Optical Studies of Ten Hard X-ray Selected Cataclysmic Binaries
Abstract
We conducted time-resolved optical spectroscopy and/or photometry of ten cataclysmic binaries that were discovered in hard X-ray surveys, with the goal of measuring their orbital periods and searching for evidence that they are magnetic. Four of the objects in this study are new optical identifications: IGR J180173542, PBC J1841.1+0138, IGR J184340508, and Swift J1909.3+0124. A 311.8 s, coherent optical pulsation is detected from PBC J1841.1+0138, as well as eclipses with a period of 0.221909 days. A 152.49 s coherent period is detected from IGR J184340508. A probable period of 389 s is seen in IGR J181511052, in agreement with a known X-ray spin period. We also detect a period of 803.5 s in an archival X-ray observation of Swift J0717.82156. The latter four objects are thus confirmed magnetic CVs of the intermediate polar class. An optical period of 1554 s in AX J1832.30840 also confirms the known X-ray spin period, but a stronger signal at 2303 s is present whose interpretation is not obvious. We also studied the candidate intermediate polar Swift J0820.62805, which has low and high states differing by mag, and optical periods or QPOs not in agreement with proposed X-ray periods. Of note is an unusually long 2.06 day orbital period for Swift J1909.3+0124, manifest in the radial velocity variation of photospheric absorption lines of an early K-type companion star. The star must be somewhat evolved if it is to fill its Roche lobe.
1 INTRODUCTION
This paper is the fourth in a series of optical studies of cataclysmic variables (CVs) that were discovered in surveys at hard X-rays energies ( keV) by the Swift Burst Alert Telescope (BAT) and the International Gamma-Ray Astrophysics Laboratory (INTEGRAL/IBIS). CVs are accreting binaries in which a white dwarf (WD) accretes mass from a low-mass main-sequence or slightly evolved companion that fills its own Roche-lobe. If the magnetic field of the WD is strong enough it will truncate the inner accretion disk at the WD magnetospheric boundary, funneling an accretion column directly onto a magnetic pole or poles. Even stronger magnetic fields can channel an accretion stream directly from the surface of the companion, completely preventing a disk from forming. Magnetic CVs are efficient at producing hard X-rays in the accretion column, where thermal bremsstrahlung X-rays are emitted by shock-heated plasma just above the surface of the WD.
The systems with partially truncated disks are the intermediate polars (IPs, or DQ Herculis stars). In these, the accretion stream or curtain is channeled from the inner edge of the disk to the magnetic pole(s). The spin period of the WD in an IP can be detected as a coherent X-ray or optical oscillation arising from the rotating hot spot at the base of the accretion column, at a shorter period than the orbital period of the binary. Sometimes the beat frequency between the spin and orbit is seen in emission reprocessed by material in the orbiting frame. The X-rays often suffer energy-dependent photoelectric absorption in the accretion curtain.
When the magnetic field is strong enough to completely block the formation of an accretion disk, it usually also locks the WD rotation to the binary orbit. These synchronous systems are the polars (AM Herculis stars). Polars also exhibit circularly polarized optical emission and optical/IR humps in their spectra, both of these being features of cyclotron radiation in a strong magnetic field. There are also a handful of asynchronous polars, in which the spin and orbit periods differ by up to a few percent.
The properties of hard X-ray selected CVs were most recently reviewed by de Martino et al. (2020), Falanga et al. (2019), and Lutovinov et al. (2020). Among those detected by Swift BAT (Oh et al., 2018) and INTEGRAL/IBIS (Bird et al., 2016), IPs outnumber all the other subclasses of CVs including polars, and continue to dominate as new classifications are made by X-ray and optical followup studies cited in the above reviews (e.g., Bernardini et al., 2017). It is thought that IPs outnumber polars in hard X-ray samples because of their higher accretion rates, and also because in polars the accretion may be “blobby,” depositing some fraction of its energy directly onto the surface of the WD, to be radiated at lower temperatures, tens of eV.
We aim to advance the completeness of CV identifications and classifications from Swift BAT and INTEGRAL/IBIS. We measure the CVs’ orbital periods using time-resolved optical spectroscopy and/or time-series photometry. Our fast photometry also reveals spin modulation when present, allowing for classification of magnetic subclasses of CVs. In Thorstensen & Halpern (2013, Paper I) Halpern & Thorstensen (2015, Paper II), and Halpern & Thorstensen (2018, Paper III), we presented data and findings on 36 hard X-ray selected CVs, 14 of which were unidentified X-ray sources prior to our work. The present paper continues this effort with targets selected from prior X-ray studies, as well as unidentified X-ray sources with counterparts in pointed observations from the imaging Swift X-ray Telescope (XRT). We present new data on ten objects: four newly identified CV counterparts and six previously studied ones.
2 EQUIPMENT AND TECHNIQUES
Nearly all our optical data are from the MDM Observatory, which comprises the 1.3-m McGraw-Hill telescope and the 2.4-m Hiltner telescope, both on the southwest ridge of Kitt Peak, Arizona. For the spectroscopy and radial velocity studies we used the modular spectrograph (modspec) on both the 1.3-m and the 2.4m telescopes, and the Ohio State Multi-Object Spectrograph (OSMOS; Martini et al. 2011) on the 2.4-m only. The observing protocols, reduction, and analysis techniques we used for the spectroscopy were essentially identical to those detailed in Papers I, II, and III.
High-cadence differential photometry sensitive to spin periods was carried out with the MDM 1.3-m, or, for one target, at the South African Astronomical Observatory (SAAO) 1-m telescope, using the Sutherland High-speed Optical Camera (Coppejans et al., 2013). Again, our techniques are detailed in earlier papers.
3 RESULTS ON INDIVIDUAL OBJECTS
Table 1 lists the objects studied here, with accurate celestial coordinates, approximate magnitudes from Pan-STARRS, and periods where determined. A photometric period is considered confirmed only if it is detected independently on different nights. Uncertainty in period is determined from the width of the periodogram peak at power level , where is the peak power value. In practice, this corresponds to , where is the time span of the data from beginning to end, and the numerical factor is accurate to .
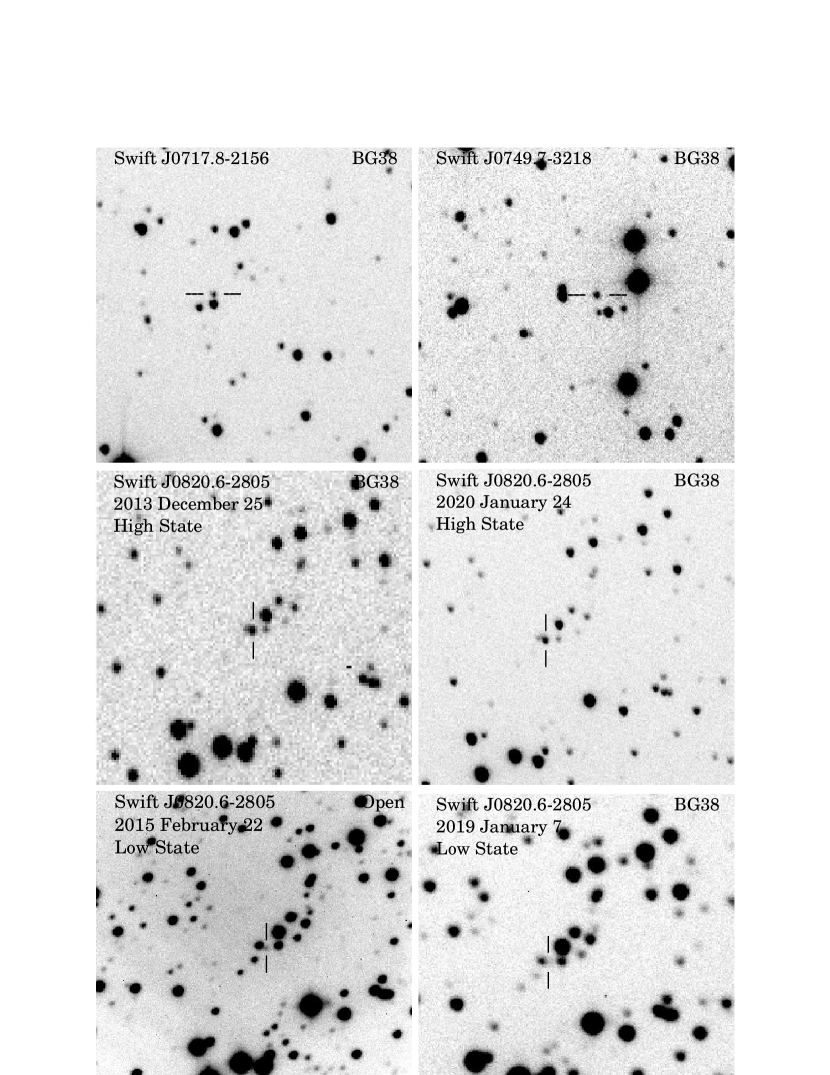
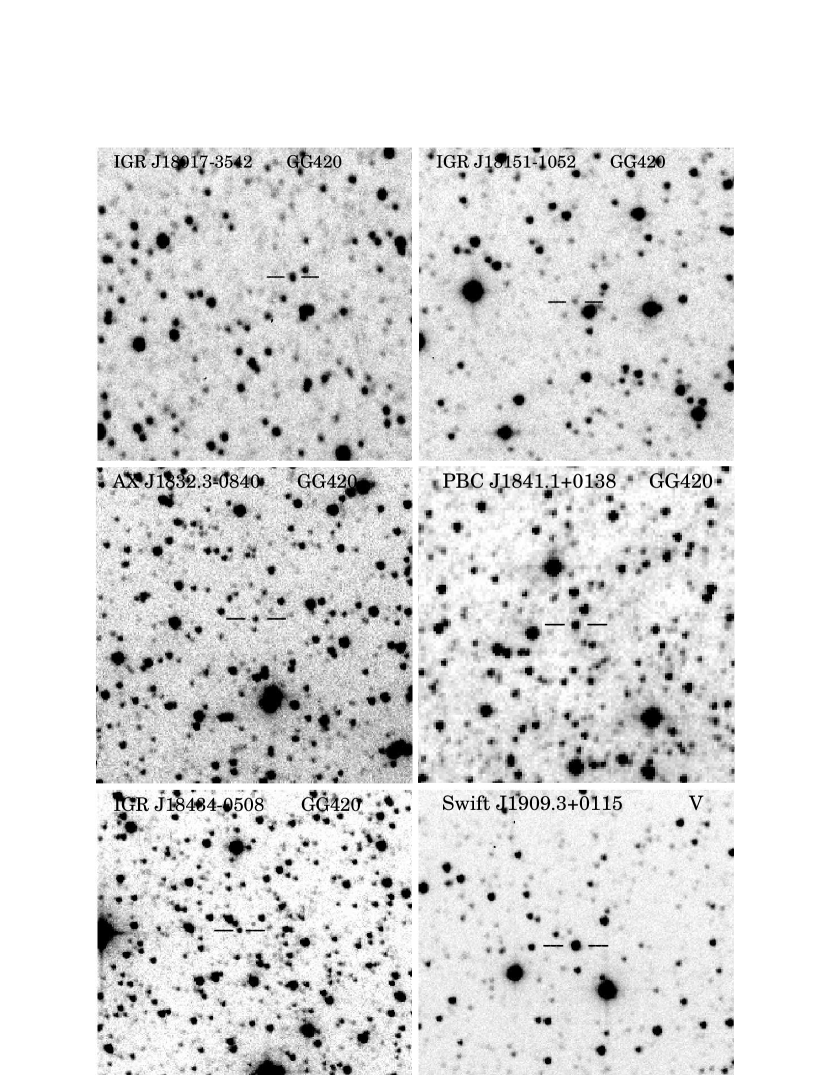
Figure 1 shows finding charts for three objects that were discussed in our previous papers and have new data reported here. Figure 2 presents finding charts for six newly studied (by us) optical counterparts. Figure 3 shows the spectra of three of the newly identified sources. Subsequent Tables and Figures contain the results and analysis of photometry and spectroscopy of individual objects.
3.1 Swift J0717.82156 and Swift J0749.73218
Swift J0717.82156 and Swift J0749.73218 were identified spectroscopically as likely CVs in Paper II, based on their Balmer and He I emission lines. But no time-series data had been obtained at that time. In Paper III, a radial velocity study of Swift J0717.82156 established an orbital period of days, and detected He II , suggesting that it is a magnetic system. We subsequently obtained a short time-series for each of these stars that confirms their CV nature through flickering, but does not detect any significant periodicity (Figures 4 and 5).
However, we report here the discovery of a likely spin period in an archival X-ray observation of Swift J0717.82156. Taken on 2019 March 28 by XMM-Newton (ObsID 0820330801), it has a continuous exposure of 49 ks. Figure 6 shows the folded light curve from the combined pn and MOS photon lists in three energy bands, and a periodogram of the lowest (0.5–2.5 keV) energy band, where the modulation is prominent. A period of s is detected, as well as significant power in the first harmonic due to the asymmetric, double-peaked pulse. Confined to energies below 2.5 keV, the pulsation is likely due to spin-modulated photoelectric absorption by the accretion curtain, a common effect in IPs. Examining the power spectrum of the optical light curve (Figure 4), there is a marginally significant peak at the X-ray period.
3.2 Swift J0820.62805
Swift J0820.62805 was identified in Paper II, where a candidate period of s was noted based on a single time series in 2013 December. Figure 7 is a reproduction of that analysis. It was noted that the period should be considered tentative because the light curve covers only five cycles of the oscillation. In subsequent years we attempted to test this result, only to discover that the star had had faded by several magnitudes and was undetectable in short exposures.
Figure 1 shows deeper images taken on 2015 February 22 and 2019 January 7, with the SAAO 1-m and the MDM 1.3-m, respectively. The former, in particular, is the sum of 1920 s of unfiltered exposures in which the optical counterpart of Swift J0820.62805 is faintly visible (and is easily confused with a neighboring star). Comparing with the magnitudes of nearby stars in Pan-STARRS, we conclude that Swift J0820.62805 had faded to . (The Pan-STARRS mean magnitude of Swift J0820.62805 is .) Finally, in 2020 January we caught the star back in a high state at magnitude in a BG38 filter, as shown in Figure 1 (image) and Figure 8 (time series).
With two nights in this high state, the star again shows oscillations, but the best fitted period is now s, which is close to but not consistent with the original value of s. Therefore, we cannot consider this confirmation. It could be that both of these signals are simply transient quasi-periodic oscillations. Alternatively, if one signal represents the spin period, and the other a beat period between the spin and the orbit, it suggests an orbital period of days. This is not an implausible value, but as an explanation this requires a change of accretion geometry such that the direct emission from the spinning WD is stronger at one epoch, while reprocessed light from an orbiting structure dominates at the other. Further observations would be needed to investigate the origin of these signals.
Nucita et al. (2020) analyzed a 37 ks XMM-Newton observation of Swift J0820.62805 that was taken in 2018. It was clearly in a low state then, since its average X-ray count rate was only 0.015 s-1, corresponding to a 0.3–10 keV flux of erg cm-2 s-1. This is to be compared with the count rate of s-1 in the much less sensitive Swift XRT in 2009 and 2011, corresponding to erg cm-2 s-1. In addition its average magnitude in the XMM-Newton optical monitor was 20.49, close to the minimum we observed in 2015 and 2019. Nevertheless, Nucita et al. (2020) identified peaks in the X-ray periodogram at 27.87 min and 87.53 min as the spin and orbital periods. Neither of these correspond to our 41.4 min (2484 s) and 39.2 min (2353 s) periods. The peaks in the X-ray periodogram are weak; we suggest that a similar X-ray observation performed when the source is in its high state will detect any true period(s) and address the present ambiguities.
3.3 IGR J180173542
This INTEGRAL/IBIS source from Krivonos et al. (2017) was observed with Chandra by Tomsick et al. (2021), who identified its probable X-ray and optical counterpart. Based on its optical/IR magnitudes, Gaia parallax and proper motion, and X-ray luminosity, Tomsick et al. (2021) classified it as a likely CV. We obtained a spectrum of this star with OSMOS on 2021 June 26 that confirms it as a CV based on its broad, double-peaked H emission line and blue continuum (Figure 3).
We then followed up with time-series photometry through a GG420 filter on three nights in 2021 July (Figure 9). Although displaying flickering up to 0.5 mag, no periodicity is detected in the power spectra (not shown). However, the time-series were frequently interrupted by clouds, and longer contiguous runs, especially from the southern hemisphere, would be of interest for this bright, mag star.
3.4 IGR J181511052
The optical identification of IGR J181511052 was made by Lutovinov et al. (2012a) with the aid of a Swift XRT position. Their optical spectrum has a strong H emission line which, together with a hard X-ray spectrum, favored classification as a CV. Masetti et al. (2013) also obtained an optical spectrum, which shows, in addition to H, emission lines of H, He II and the Bowen C III/N III blend, which further suggested a magnetic CV. Recently, Worpel et al. (2020) obtained an XMM-Newton observation that clearly showed a 390 s period, interpreted as the WD spin.
We obtained a single time-series observation of IGR J181511052 through a GG420 filter with a cadence of 63 s (Figure 10). Although not providing a significant independent detection of the 390 s period, we note that the highest peak in the Lomb-Scargle periodogram occurs at s, consistent with the X-ray period. A light curve folded at this period has an amplitude of mag.
3.5 AX J1832.30840
AX J1832.30840 was discovered as a pulsating X-ray source by Sugizaki et al. (2000). Its period of s together with a 6.7 keV iron line and luminosity based on an estimated distance of kpc identified it as a likely magnetic CV. It is also detected by INTEGRAL/IBIS (Bird et al., 2016) and by Swift-BAT (Oh et al., 2018) as Swift J1832.50863 (a non-standard coordinate naming convention). The X-ray properties of AX J1832.30840 were studied in more detail by Kaur et al. (2010) using XMM-Newton. Its features include a three-component Fe line complex, supporting classification as an IP together with their measured spin period of s. Kaur et al. (2010) also used Chandra to get a precise position, which coincided with an optical/IR counterpart whose basic properties are listed in Table 1. Masetti et al. (2013) obtained an optical spectrum showing Balmer emission lines and He II 4686, confirming AX J1832.30840 as a magnetic CV.
We obtained time-series photometry on two adjacent nights, 2019 July 8 and 9, to further study periodic phenomena in AX J1832.30840. A clear WG280 filter was used on the first night, with exposures of 60 s. On the second night a GG420 filter was used to mitigate against moonlight, and the exposure time was reduced to 40 s. Figure 11 shows the resulting light curves and Lomb-Scargle periodogram. Interestingly, while there is a peak at 1554 s (and its 1-day alias at 1529 s) matching the X-ray period, a stronger signal is seen at a period of 2303 s, and possibly a weaker one at 4723 s. None of these are exact multiples of each other, except for an alias peak at 4500 s which is close to twice one at 2248 s.
While it is very likely that the X-ray period represents the spin, the interpretation of the other optical periods is not clear, and we do not have a spectroscopic orbital period.
3.6 PBC J1841.1+0138
The Swift XRT targeted a source named PBC J1841.1+0138 twice in 2019 February. Although the Palermo Swift-BAT Catalog of hard X-ray sources has been updated several times, we can find no record of a source with this name in any publication or public database. However, an unidentified BAT source, Swift J1841.0+0152, is listed with coordinates (J2000) R.A.=, decl.= in Oh et al. (2018), which is within of the coordinate designation of PBC J1841.1+0138. Therefore, we assume that these BAT sources are one and the same.
In a total exposure of 2437 s, the XRT detected a point source of 37 relatively hard photons at position consistent with PBC J1841.1+0138, and within of the faint optical object identified in Figure 2, whose basic properties are listed in Table 1. A spectrum of this star obtained with OSMOS on 2019 May 26 identifies it as a probable CV based on its broad, double-peaked H emission and weaker He I emission lines (Figure 3).
We then followed up with time-series photometry of PBC J1841.1+0138 through a GG420 filter on five nights in 2019 May and June (Figure 12). On each night there is a clear eclipse, deeper than 1 magnitude, although on two of the nights only ingress or egress was covered. An unambiguous eclipse frequency of 4.5 cycles day-1 is evident, which made it possible to schedule two brief time-series (not shown) covering eclipses on June 28 and 29 to further refine the orbital ephemeris.
From the five complete eclipses observed, times of mid-eclipse were derived by fitting a second-order polynomial to the magnitudes in each dip. The mid-eclipse times (listed in Table 2) were then fitted to a constant orbital period leaving timing residuals s, smaller than the 43 s cadence of the data. The eclipse ephemeris (in TDB) spanning JD 2458630–2458663 is
In addition to the eclipses, the light curves have much shallower, broad modulation that could be due to some combination of ellipsoidal modulation and partial eclipse of the secondary star by the accretion disk.
The power spectra also show a persistent, coherent period of 311.8 s with full amplitude of mag, likely related to the spin of the WD. In order to measure the period most precisely, we excised the eclipses from the light curves and calculated a Lomb-Scargle periodogram of the remaining time series, which is shown in the bottom panel of Figure 12. Expanded versions of the periodogram around the resulting s signal are shown in Figure 13, where the data sets are grouped into adjacent nights (May and June separately), and the full set of five.
These periodograms show a persistent main peak at 311.8 s, with weaker 1-day aliases separated by s. But there is also structure at slightly higher frequencies, which suggests that another period is present. In the June data, a secondary peak at either 306 s or 307 s is actually stronger than the main peak. This is reminiscent of many intermediate polars in which both the spin frequency and the difference, or beat between the spin and orbit, , can be present in the optical power spectrum to varying degrees due to reprocessing of the beamed emission from the WD on material fixed in the orbiting frame.
This explanation requires that orbital frequency is the difference between closely spaced peaks, so we represent this difference with a horizontal bar marked in the middle panel of Figure 13. The beat-frequency hypothesis can account approximately for the dual structure in the periodogram, but perhaps not exactly, as the peaks don’t precisely align when assuming the precisely known as the difference. In addition, it is not clear which peak represents the spin frequency. Normally the spin frequency is higher than the reprocessed one due to prograde spin and orbit, but sometimes and can occur. For definiteness, we list in Table 1 the s period of the peak that is unambiguously strongest in the merged periodogram, though it is not certain whether this is the spin or the beat period. Finally, we note that a 10-day aliased value of 311.912 s is also possible for this peak.
3.7 IGR J184340508
IGR J184340508 from Krivonos et al. (2017) was observed with Chandra by Tomsick et al. (2021), who identified its probable X-ray and optical counterpart and classified it as a likely CV. We obtained a spectrum of this star with OSMOS on 2021 April 19 that confirms it as a CV based on its broad H emission line (Figure 3).
On the nights of 2021 June 9 and 10 UT we obtained time-series photometry of IGR J184340508 through a GG420 filter (Figure 14). The star shows flickering with an amplitude of mag. On each night we also detect coherent pulsations with a period of 152.5 s and full amplitude of mag, likely the spin signature of an IP. Given the short period, we reduced the individual exposure times from 40 s on June 9 to 20 s on June 10 in order to better resolve the pulse. But the star is too faint to see individual pulses, and the folded pulse profiles look similar on both nights. A coherent analysis combining both nights’ data derives a period of s. No other periods are detected in the full periodogram.
3.8 Swift J1909.3+0124
Swift J1909.3+0124 is found in the Swift-BAT 105-month survey (Oh et al., 2018). It was also targeted six times by the Swift XRT between 2017 November 24 and 2018 March 7, under the coordinate name Swift J1909.3+0115. (Oh et al. 2018, on the other hand, used a nonstandard coordinate naming convention.) In each XRT observation, a variable source was detected coincident with the bright optical counterpart listed in Table 1. Its maximum 0.3–10 keV count rate is s-1, with an average of about half that. Several of these images are heavily contaminated by scattered X-rays from the bright source Aql X-1, which is away. The Swift-BAT source was also identified with XMMSL2 J190921.2+011225 and was suggested to be Galactic by Stephen et al. (2018). ROSAT X-ray designations are 1RXS J190923.2+011154 and 1WGA J1909.3+0112; evidently these are all the same object. We reported briefly on our optical identification of Swift J1909.3+0124 in Halpern & Thorstensen (2018), and present more complete results here.
Table 3 summarizes our spectroscopic observations. A single discovery spectrum obtained 2018 March 4 showed bright emission lines of H, He I, He II, and the C III/N III Bowen blend typical of a cataclysmic variable, together with (more rarely seen) photospheric absorption features of a K-type companion star.
We then obtained -band time-series photometry on ten nights between 2018 March 15 and July 6. Six of these runs were 3–5 hours long at 33 s cadence, and are shown in Figures 15 and 16. Flickering with full amplitude of mag is seen, but no definite coherent period is detected. Among these nights the mean magnitude ranged from . Figure 16 shows the brightest and faintest states observed which, together with Figure 15, illustrates that the amplitude of flickering is correlated with brightness. Note that the star appeared in its lowest state on 2018 July 6 (Figure 16), when its flickering amplitude was at minimum.
We obtained more spectra with OSMOS and modspec through the 2018 observing season (see Table 3). The emission-line strength varies dramatically. The emission equivalent width of H falls mostly in the range 15–25 Å, but it was as high as 45 Å in the discovery spectrum on March 4, and as low as 2 Å for some of our June data. In the latter spectra no emission lines other than H are detected.
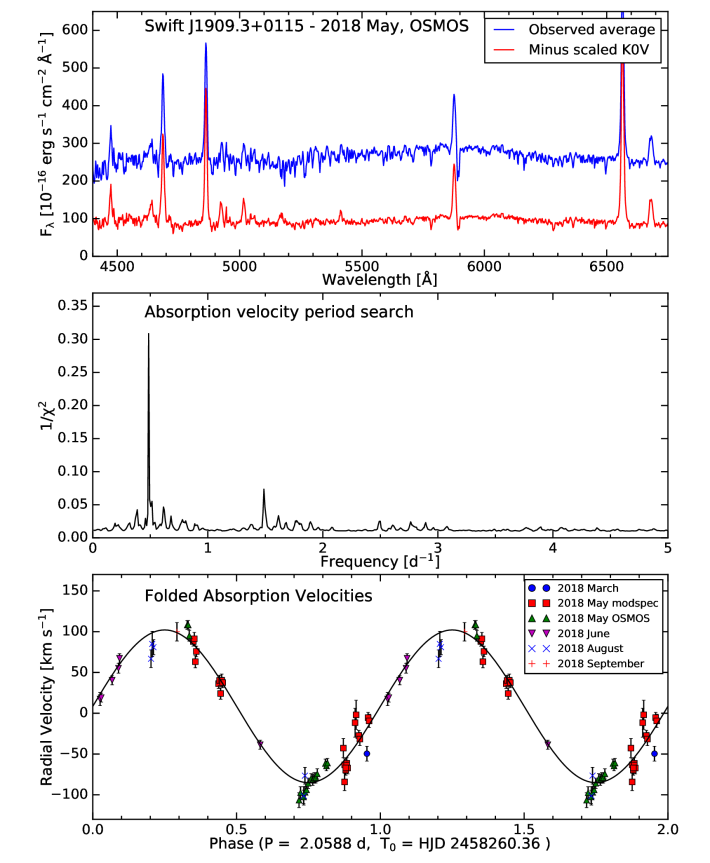
Figure 17 (top) shows the mean spectrum from the OSMOS data taken 2018 May. It has been corrected for an interstellar extinction mag (see the following discussion). We characterized the secondary star by averaging the individual flux-calibrated spectra in the rest frame of the secondary star using the radial velocity ephemeris discussed below, and then scaling and subtracting late-type stellar spectra (also shifted to rest) to obtain the best cancellation of the late-type features. The best match was found using the K0.5 V star Gliese 567. We judge the uncertainty in the classification to be about 2 subclasses. To measure radial velocities of the absorption spectrum, we cross-correlated the spectra against a composite rest-frame G-K template spectrum, using the IRAF task fxcor, and obtained 52 usable velocities. They show a sinusoidal (almost certainly orbital) modulation near 2.06 days, with no ambiguity in cycle count over the span of the observations (Figure 17, middle panel). A sinusoidal fit of the form gives
The lower panel of Figure 17 shows the folded velocities and the best fit.
The period is unusually long for a CV, and requires that the companion be somewhat evolved if it fills its Roche lobe. The Gaia EDR3 distance is nominally pc, and the reddening maps of Green et al. (2015) give at this distance. From our spectrophotometry we estimate for the companion star, which implies an absolute magnitude near +5 for the companion alone, more luminous than a main-sequence star of its early K spectral type. Since the faintest state observed in time series has and very little flickering (Figure 16), it is possible that accretion makes a smaller contribution to the light than the companion star in this state.
3.9 Swift J2237.2+6324
This CV with strong He II emission was identified by Lutovinov et al. (2012b). See that paper for a finding chart. In Paper III we showed a long light curve of Swift J2237.2+6324 from 2016 that has a strong modulation on a timescale of hr, possibly a candidate orbital period. In 2021 August we obtained two more nights of time-series photometry that, while displaying flickering on a variety of timescales (Figure 18), do not reproduce the previously observed light curve. Thus, the suggested hr period is not confirmed.
4 CONCLUSIONS
We identified four new CV counterparts of Swift BAT survey or INTEGRAL/IBIS sources, and obtained time-resolved photometry on an additional six that were previously known.
The newly identified Swift J1909.3+0124 has a 2.06 day spectroscopic period, which requires that its optical companion be slightly evolved to fill its Roche lobe. The companion makes a large contribution to the light. Swift J1909.3+0124 also displays variable emission-line EWs, and flickering amplitudes that are correlated with continuum brightness, which may be an effect of dilution by the companion’s light.
At least four of the targets are IPs based on short periods detected in their optical photometry. Two of these, IGR J181511052 and AX J1832.30840, display periods in agreement with previously known X-ray values. However, AX J1832.30840 has additional optical periods whose interpretation is not obvious. The third IP is the newly discovered PBC J1841.1+0138 with a 311.8 s period as well as a 0.221909 day eclipse period. It is not clear if 311.8 s is the spin period or a beat period. A 152.49 s period is detected from IGR J184340508, the fourth IP in this study. The previously identified Swift J0820.62805 was reobserved in states differing by mag. In the high states, significantly different periods were detected, suggesting that they are transient QPOs rather than spin-related periods.
Based on their strong He II emission lines, Swift J1909.3+0124 and Swift J2237.2+6324 warrant further testing for IP signatures. While evidence of spin is not obvious in their optical light curves, spin periods are often more easily detected in X-rays. This proved to be the case for the 803.5 s period detected in X-rays from Swift J0717.82156. We also recommend Swift J0820.62805 (but in a high state as discussed above) for X-ray timing, as well as PBC J1841.1+0138 to clarify the nature of its period structure around 311 s.
References
- Bernardini et al. (2017) Bernardini, F., de Martino, D., Mukai, K., et al. 2017, MNRAS, 470, 4815
- Bird et al. (2016) Bird, A. J., Bazzano, A., Malizia, A., et al. 2016, ApJS, 223, 15
- Brown et al. (2021) Brown, A. G. A., Vallenari, A., Prusti, T., et al. 2021, A&A, 649, A1
- Coppejans et al. (2013) Coppejans, R., Gulbis, A. A. S., Kotze, M. M., et al. 2013, PASP, 125, 976
- de Martino et al. (2020) de Martino, D., Bernardini, F., Mukai, K., Falanga, M., & Masetti, N. 2020, AdSpR, 66, 1209
- Falanga et al. (2019) Falanga, M., de Martino, D., Bernardini, F., & Mukai, K. 2020, MmSAI, 90, 126
- Green et al. (2015) Green, G. M., Schlafly, E. F., Finkbeiner, D. P., et al. 2015, ApJ, 810, 25
- Halpern & Thorstensen (2015) Halpern, J. P., & Thorstensen, J. R. 2015, AJ, 150, 170 (Paper II)
- Halpern & Thorstensen (2018) Halpern, J. P., & Thorstensen, J. R. 2018, ATel, 11787, 1
- Halpern et al. (2018) Halpern, J. P., & Thorstensen, J. R., Cho, P., et al. 2018, AJ, 155, 247 (Paper III)
- Kaur et al. (2010) Kaur, R., Wijnands, R., Paul, B., Patruno, A., & Degenaar, N. 2010, MNRAS, 402, 2388
- Krivonos et al. (2017) Krivonos, R. A., Tsygankov, S. S., Mereminskiy, I. A., et al. 2017, MNRAS, 470, 512
- Lutovinov et al. (2012a) Lutovinov, A. A., Burenin, R. A., Revnivtsev, M. G., & Bikmaev I. F. 2012a, AstL, 38, 1
- Lutovinov et al. (2012b) Lutovinov, A. A., Burenin, R. A., Revnivtsev, M. G., et al. 2012b, AstL, 38, 281
- Lutovinov et al. (2020) Lutovinov, A., Suleimanov, V., Luna, G. J. M., et al. 2020, NewAR, 91, 101547
- Martini et al. (2011) Martini, P., Stoll, R., Derwent, M. A., et al. 2011, PASP, 123, 187
- Masetti et al. (2013) Masetti, N., Parisi, P., Palazzi, E., et al. 2013, A&A, 556, A120
- Nucita et al. (2020) Nucita, A. A., De Paolis, F., Strafella, F., & Licchelli, D. 2020, MNRAS, 498, 2688
- Oh et al. (2018) Oh, K., Koss, M., Markwardt, C. B., et al. 2018, ApJS, 235, 4
- Stephen et al. (2018) Stephen, J. B., Bassani, L., Malizia, A.,, Masetti, N., & Ubertini, P. 2018, ATel, 11341, 1
- Sugizaki et al. (2000) Sugizaki, M., Kinugasa, K., Matsuzaki, K., et al. 2000, ApJ, 534, L181
- Thorstensen & Halpern (2013) Thorstensen, J. R., & Halpern, J. 2013, AJ, 146, 107 (Paper I)
- Tomsick et al. (2021) Tomsick, J. A., Coughenour, B. M., Hare, J., et al. 2021, ApJ, 914, 48
- Worpel et al. (2020) Worpel, H., Schwope, A. D., Traulsen, I., Mukai, K., & Ok, S. 2020, A&A, 639, A17
=2.2in {rotatetable}
| Name | R.A.(J2000)aaCoordinates and parallax are from the Gaia extended third data release (EDR3; Brown et al. 2021), which are corrected for proper motion to epoch 2016.0. | Decl.(J2000)aaCoordinates and parallax are from the Gaia extended third data release (EDR3; Brown et al. 2021), which are corrected for proper motion to epoch 2016.0. | aaCoordinates and parallax are from the Gaia extended third data release (EDR3; Brown et al. 2021), which are corrected for proper motion to epoch 2016.0. | bbMean PSF magnitudes from Pan-STARRS. | bbMean PSF magnitudes from Pan-STARRS. | bbMean PSF magnitudes from Pan-STARRS. | DataccTypes of data presented here: I—optical spectroscopic identification; S—time-resolved spectroscopy; T—time-series photometry. | Class | RefddReference for period(s): (1) Halpern & Thorstensen 2015, optical; (2) this paper, X-ray; (3) this paper, optical; (4) Nucita et al. 2020, X-ray; (5) Worpel et al. 2020, X-ray; (6) Sugizaki et al. 2000, X-ray; (7) Kaur et al. 2010, X-ray. | |||
|---|---|---|---|---|---|---|---|---|---|---|---|---|
| (h m s) | (∘ ′ ′′) | (mas) | (day) | (s) | (s) | |||||||
| Swift J0717.82156 | 07 17 48.260 | 53 01.49 | 0.399(96) | 18.72 | 18.14 | 17.70 | T | 0.2298(10) | 1, 2 | |||
| Swift J0749.73218 | 07 49 31.985 | 15 36.49 | 0.269(98) | … | … | … | T | |||||
| Swift J0820.62805 | 08 20 34.091 | 04 58.45 | … | 17.19 | 17.07 | 16.74 | T | IP? | 3 | |||
| 0.0608(49) | 1672(60) | 4 | ||||||||||
| IGR J180173542 | 18 01 12.511 | 39 12.24 | 0.607(43) | … | … | … | I,T | |||||
| IGR J181511052 | 18 15 03.847 | 51 35.01 | 21.76 | 20.09 | 19.24 | T | IP | 3 | ||||
| 5 | ||||||||||||
| AX J1832.30840 | 18 32 19.304 | 40 30.41 | 1.23(36) | 20.55 | 19.42 | 18.79 | T | IP | 3 | |||
| 6 | ||||||||||||
| 7 | ||||||||||||
| PBC J1841.1+0138 | 18 41 04.160 | +01 37 55.76 | 1.49(30) | 21.64 | 19.73 | 18.48 | I,T | IP | 0.2219088(11) | 311.805(4) | 3 | |
| IGR J184340508 | 18 43 11.424 | 05 45.56 | 0.44(15) | 19.08 | 18.64 | 18.18 | I,T | IP | 152.49(2) | 3 | ||
| Swift J1909.3+0124 | 19 09 20.906 | +01 12 24.56 | 1.381(21) | 15.12 | 14.64 | 13.99 | I,S,T | 2.059(3) | 3 | |||
| Swift J2237.2+6324 | 22 36 37.401 | +63 29 33.60 | 0.98(15) | 20.07 | 18.98 | 18.26 | T |
| Cycle | Mid-Eclipse |
|---|---|
| (BJD) | |
| 0 | 2458630.88975 |
| 4 | 2458631.77730 |
| 9 | 2458632.88707 |
| 144 | 2458662.84481 |
| 148 | 2458663.73211 |
| Start | Tel., Instr.aaM = modspec; O = OSMOS. | HA start | HA end | Exp | H EWbbEquivalent width of H, positive for emission. | |
|---|---|---|---|---|---|---|
| (UT) | (hh:mm) | (hh:mm) | (s) | (Å) | ||
| 2018-03-04 12:48 | 2.4-m, O | 02:59 | 02:49 | 600 | 1 | 45 |
| 2018-05-09 07:45 | 1.3-m, M | 03:42 | 02:47 | 600 | 5 | 17 |
| 2018-05-10 09:43 | 1.3-m, M | 01:41 | 00:48 | 600 | 5 | 15 |
| 2018-05-11 07:22 | 1.3-m, M | 03:58 | +00:25 | 600 | 6 | 15 |
| 2018-05-13 08:33 | 1.3-m, M | 02:39 | +00:21 | 720 | 5 | 14 |
| 2018-05-14 08:11 | 1.3-m, M | 02:57 | 02:15 | 600 | 4 | 14 |
| 2018-05-20 11:22 | 2.4-m, O | +00:37 | +01:09 | 600 | 3 | 27 |
| 2018-05-21 06:31 | 2.4-m, O | 04:10 | +00:57 | 900 | 14 | 26 |
| 2018-06-05 07:37 | 2.4-m, M | 02:04 | +01:28 | 600 | 4 | 3.6 |
| 2018-06-06 11:08 | 2.4-m, M | +01:31 | +01:43 | 720 | 1 | 10 |
| 2018-06-07 11:08 | 2.4-m, M | +01:35 | +01:45 | 600 | 1 | 1.9 |
| 2018-08-31 03:37 | 1.3-m, M | 00:22 | +00:15 | 720 | 3 | 18 |
| 2018-09-01 05:52 | 1.3-m, M | +01:57 | +02:21 | 720 | 2 | 10 |
| 2018-09-27 02:28 | 2.4-m, M | +00:15 | +00:25 | 600 | 1 | 34 |