Constraints on the maximum densities of neutron stars
from postmerger gravitational waves with third-generation observations
Abstract
Using data from 289 numerical relativity simulations of binary neutron star mergers, we identify, for the first time, a robust quasi-universal relation connecting the postmerger peak gravitational-wave frequency and the value of the density at the center of the maximum mass nonrotating neutron star. This relation offers a new possibility for precision equation-of-state constraints with next-generation ground-based gravitational-wave interferometers. Mock Einstein Telescope observations of fiducial events indicate that Bayesian inferences can constrain the maximum density to ( credibility level) for a single signal at the minimum sensitivity threshold for a detection. If the postmerger signal is included in a full-spectrum (inspiral-merger-postmerger) analysis of such signal, the pressure-density function can be tightly constrained up to the maximum density, and the maximum neutron star mass can be measured with an accuracy better than ( credibility level).
Introduction.—
Postmerger (PM) gravitational-waves (GWs) emitted from binary neutron star (BNS) merger remnants are unique probes for the stars’ nuclear equation of state (EOS) at extreme-densities. During merger, the neutron stars (NSs) fuse together to form a remnant NS with maximum densities up to two times the component’s mass reaching where is the nuclear saturation density. If the remnant does not promptly collapse to black hole, numerical relativity (NR) simulations predict a loud GW transient emitted on dynamical timescales of tens of milliseconds with a complex signal morphology and a characteristic peak frequency , e.g. Shibata and Taniguchi (2006); Hotokezaka et al. (2013); Bauswein and Stergioulas (2015); Takami et al. (2014); Bernuzzi et al. (2015); Lehner et al. (2016). These kiloHertz GW transients have not been detected in the two BNS events GW170817 and GW190425 due to the insufficient sensitivity of the GW detectors at those frequencies Abbott et al. (2017a, b, 2019, 2018a, 2020a). A first detection is however possible (and expected) with third-generation Hild et al. (2011); Punturo et al. (2010a) and others proposed detectors that specifically target the kiloHertz frequencies Ackley et al. (2020). In view of this observational scenario, it is of central importance to determine what kind of information can be extracted from PM signals and to which accuracy.
The signal-to-noise (SNR) detection threshold for a PM signal has been recently studied using different approaches e.g. Clark et al. (2016); Chatziioannou et al. (2017); Torres-Rivas et al. (2019); Tsang et al. (2019); Breschi et al. (2019); Easter et al. (2019, 2020). These studies found that SNRs at kiloHertz frequencies are typically necessary to confidently claim the detection of a BNS PM signal. These PM SNRs correspond to loud inspiral-merger signals with SNR that, in turn, would provide rather accurate measurements of the binary mass and tidal polarizability parameters, e.g. Damour et al. (2012); Gamba et al. (2021); Chatziioannou (2021). While the existence of an underlining, unique EOS for the NS matter allows to estimate the EOS at all densities from GW observations, inspiral-merger frequencies are mostly informative at the largest densities of the binary components Abbott et al. (2018b); Landry and Essick (2019); Agathos et al. (2020). In contrast, PM frequencies are expected to be mostly informative of the extreme-densities reached by the remnant, although BNS PM modeling for GW inference is non-trivial. The main approach is to employ EOS-insensitive relations connecting the peak frequency , which is the most robust feature of the PM spectrum as predicted by simulations, and equilibrium properties of NSs like the radius at fiducial masses Bauswein et al. (2012, 2016), averaged binary compactnesses Takami et al. (2015), or the binary’s tidal coupling constant Bernuzzi et al. (2015). For example, can be measured from to within a factor of two () at PM SNR (15) Easter et al. (2020), but the inspiral signal of the same event would deliver a measurement orders of magnitude more accurate Breschi et al. (2019), thus providing more stringent constraints on the pressure-density EOS function. A PM detection can typically provide only bounds on the maximum NS mass Bauswein et al. (2013); Agathos et al. (2020) [solution of the Tolman-Oppenheimer-Volkoff (TOV) equations]; although, multiple PM detections could provide a few percent measurement Bauswein et al. (2014) complementary to that from an inspiral EOS inference Abbott et al. (2018b); Landry and Essick (2019); Essick et al. (2020a). The minimum NS radius , i.e. the radius of a NS at maximum density , is a key information to constrain the NS mass-radius diagram. It can be extracted from a quasiuniversal relation with the peak PM frequency Bauswein et al. (2014) and measured with an uncertainty of at PM SNR 12 Breschi et al. (2019, 2021a). Stronger EOS constraints from BNS mergers will be possible by combining GW observations with other messengers, e.g. Margalit and Metzger (2017); Radice et al. (2018a); Bauswein et al. (2017); Coughlin et al. (2018); Raaijmakers et al. (2020); Dietrich et al. (2020); Essick et al. (2020b); Breschi et al. (2021b).
In this Letter, we propose a new quasiuniversal relation connecting the NS maximum density to the peak PM frequency. The existence of a EOS-insensitive relation was suggested by previous work Bauswein et al. (2013, 2014); Lioutas et al. (2021), but the relation obtained there involves the binary configurations with the largest possible mass that does not promptly collapse to black hole. Here, by introducing an effective Keplerian radius associated to , we propose a more general approach that can be applied to any binary and delivers a strong constrain already with a single detection. Employing full Bayesian PM analyses of mock signals and incorporating the expected information from the inspiral-merger signal, we demonstrate that a single GW BNS detection with the Einstein Telescope at the PM detection threshold can already deliver a % measurement of and . The novel method shows the capabilities of next-generation detectors and introduce the possibility for direct and accurate constraints on the high-density EOS properties from observational GW data of BNS mergers.
Effective Keplerian radius.—
The PM peak frequency can be associated to an effective remnant radius using Kepler’s law,
| (1) |
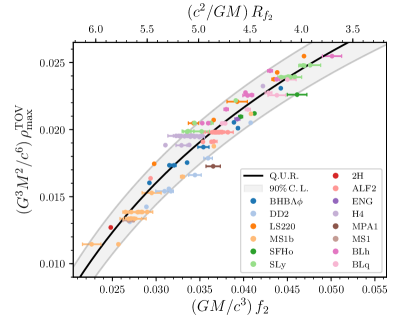
where is the gravitational constant and is the total mass of the binary. While this quantity has no direct physical interpretation in terms of the remnant properties, it correlates to the maximum central density of a non-rotating equilibrium NS with a weak dependence on the EOS. Figure 1 shows the approximate quasiuniversal relation for a NR sample of 289 simulations of the CoRe collaboration Dietrich et al. (2018); Radice et al. (2018b); Bernuzzi et al. (2020); Nedora et al. (2021); Prakash et al. (2021). To explore EOS variation, the simulations were performed with 14 different EOSs including piecewise polytropes Engvik et al. (1996); Müller and Serot (1996); Alford et al. (2005); Lackey et al. (2006); Read et al. (2009), 5 finite-temperature nucleonic models Lattimer and Swesty (1991); Douchin and Haensel (2001); Typel et al. (2010); Steiner et al. (2013); Logoteta et al. (2020), one finite-temperature hybrid model accounting for deconfined quark matter Logoteta et al. (2020); Prakash et al. (2021), and one finite-temperature hadronic model with hyperons Banik et al. (2014); Radice et al. (2017). The majority of the sample () is simulated using microphysics, neutrino transport and a subgrid model for magnetohydrodynamics (MHD) turbulence, that are sufficient to fully capture the features of the PM signal modeled here. For example, the highest-to-date resolution simulations of Kiuchi et al. (2018) suggest that the MHD effective viscosity is small and does not affect the GWs; our subgrid model is tuned to those simulations. Neutrino induced bulk viscosity might damp radial oscillations of the remnant (which cause secondary peaks in the spectrum) and will not impact . Moreover, recent simulations with improved neutrino transport suggest that neutrino bulk viscosity is too small to have a significant impact on dynamics and GW emission Radice et al. (2021).
The sample includes binaries with NS masses in the range and dimensionless spin magnitudes . The relation fits to the expression:
| (2) |
where is the speed of light and are determined by a standard least-squared minimization method at . The standard deviations of the calibrated coefficients and are respectively equal to and , corresponding to a relative error of on the final prediction.
The r.h.s. of Eq. (2) can be entirely determined from the measurement of the binary mass and the PM peak frequency . Writing the Keplerian radius in terms of , one can get a direct relation between the maximum density and the PM frequency, as
| (3) |
Hence, the maximum density can be best inferred from a full-spectrum BNS GW observation. We next discuss the potential accuracy of such measurement using a mock Bayesian inference study based on match filtering techniques and a NR-informed analytical model for the PM signal.
Mock inference study.—
We consider the Einstein Telescope (ET) design Hild et al. (2011); Punturo et al. (2010b) and assume the detector is composed by three interferometers with triangular shape and power spectral density (PSD) configuration D Hild et al. (2011). Mock signals are simulated from two fiducial equal-mass non-spinning BNS: a binary with mass and (a “stiff”) EOS DD2 Typel et al. (2010) and a binary with mass and (a “soft”) EOS SLy Douchin and Haensel (2001). Merger and PM waveforms for these BNSs from NR were already discussed in Refs. Perego et al. (2019); Breschi et al. (2019) and are employed for the PM analyses. The fiducial binaries are placed at different distances between and ; the injected signals have PM SNRs ranging from to , corresponding to total SNRs from to . For our case study, we perform full Bayesian analyses of the PM signals at different SNR and employ the Fisher matrix approach to estimate the uncertainties of the parameters measured from the inspiral signals.
Bayesian PM analyses are performed using the bajes pipeline Breschi et al. (2021a) and an updated version of the nrpm model for BNS PM signals Breschi et al. (2019). NR data are injected in a segment of with a sampling rate of . The sampling is performed with dynesty Speagle (2020) with 3200 live points analyzing the frequency region from to . nrpm is calibrated on a subset of the numerical data shown in Fig. 1 (see Breschi et al. (2019)) and it employs a simple analytical prescription for the remnant emission to capture the three peak frequencies and damping times of typical PM signals. These (complex) frequencies, here collectively indicated as , are fully determined by the intrinsic binary properties using NR-informed quasiuniversal relations in terms of the tidal coupling constant and the symmetric mass ratio Bernuzzi et al. (2015); Zappa et al. (2018); Breschi et al. (2019). The prior distribution is assumed to be uniform in the mass components, spanning the ranges and , and in the individual NS quadrupolar tidal polarizability parameters for . Spin magnitudes are kept fixed to zero. The extrinsic parameters are treated as discussed in Breschi et al. (2021a), with volumetric prior for the luminosity distance in the range . The likelihood function is analytically marginalized over reference time and phase.
In this work, nrpm is extended with two sets of additional parameters that are determined by the Bayesian inference. A first set of three parameters is introduced to enhance the flexibility of the model and to improve fitting factors to the PM signals with complex morphology. is a damping time for the PM bursts (see Eq. (9c) of Breschi et al. (2019)); accounts for a linear contribution in the frequency evolution as discussed in Easter et al. (2020); and is an additional phase-shift corresponding to the first amplitude minimum Breschi et al. (2019). The prior distribution of these parameters is chosen uniformly in , and . A second set of recalibration parameters is introduced to account for the uncertainties of each quasiuniversal relation . Specifically, we map and treat similarly to standard calibration parameters in GW analyses, e.g. Vitale et al. (2012). The prior distribution for the is assumed to be normal with zero mean and variance prescribed by the residuals of the quasiuniversal relations.
This approach aims at combining the strenghts of the nrpm templated analyses, built on quasiuniversal relations, with those of more agnostic analyses using minimal assumptions about the signal morphology, e.g. Chatziioannou et al. (2017); Easter et al. (2020). In particular, the improved nrpm model used here improves the fitting factors by an order of magnitude with respect to Breschi et al. (2019), and can detect PM GW signals at a SNR comparable to unmodeled approaches Tsang et al. (2019); Easter et al. (2020). While relying on a larger number of parameters than unmodeled methods, nrpm can deliver a measure of the intrisic parameters independently on pre-merger analyses, and produces narrower posteriors for the same PM SNR. The inference of the tidal coupling constant is also improved: comparing to Easter et al. (2020), is inferred to for PM SNR instead of . We also note that unmodeled analyses rely on analogous quasiuniversal relations to infer , hence should also consider recalibration parameters.
Fisher matrix analyses of the inspiral-merger signals are performed with gwbench Borhanian (2021). Considering the large SNR of these signals, the Fisher matrix provides an approximation of the posterior distributions of the binary mass and tidal parameters that is sufficiently accurate for our purposes. For instance, in the lowest SNR case of , the uncertainty on the binary mass measured from the inspiral signal is and the uncertainty on the quadrupolar tidal polarizability parameters is . These results imply, as expected, that the inference on via Eq. (2) has uncertainties dominated by the measurement of from the PM signal and by recalibration errors.
Maximum density constraint.—
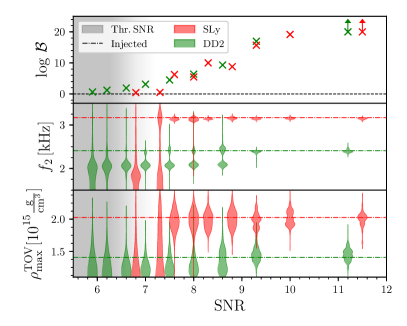
Our analysis indicates that PM signals can be detected with SNRs as low as PM SNR threshold of (total SNR ). As shown in the top panel of Fig. 2, the SNR threshold corresponds to a Bayes’ factor of in favor of the signal (vs. noise) hypothesis. This detection threshold is comparable to those obtained with minimally modeled PM waveform, e.g. Easter et al. (2020), and improves over the previous nrpm results Breschi et al. (2019) as a consequence to the enhanced flexibility of our fully NR-informed model. Figure 2 (middle panel) also shows the posterior of at different SNRs. The credibility interval of the measurement is of order of at the detectability threshold and decreases to at the largest PM SNR . The DD2 posteriors show bimodalities for SNR due to a loud first peak in the spectrum (the subdominant frequency peak at frequency ), but this systematic vanishes for increasing SNR.
The posterior distribution for is obtained by combining the posteriors of from the inspiral analysis and the posteriors of from the PM analysis. The uncertainties in the fit of Eq. (2) are taken into account with a resampling similar to the one used for the recalibration parameters (see also Breschi et al. (2021b)). Analogously to the measurement, the true value is recovered at the detectability threshold with an error of at the credibility level, as shown in the bottom panel of Fig. 2. Notably, the inference on hits the theoretical uncertainties on the quasiuniveral relation in Eq. (2) at SNR . A more precise measure is either not possible, because at that level the relation becomes EOS-dependent, or it requires a more precise quasiuniversal relation from improved simulations.
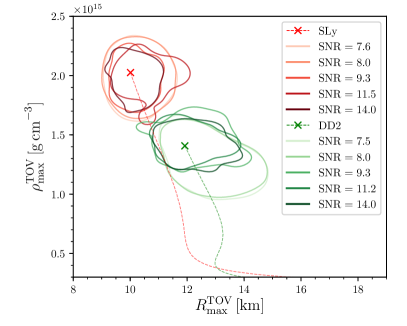
In order to further illustrate the accuracy of this approach in constraining high-density NS properties, we consider the simultaneous measure of and of the minimum NS radius . Here, the posteriors of are mapped into using Eq. (2) and the quasiuniversal relation for in Eq. (23) of Breschi et al. (2019). As above, the uncertainties of the quasiuniversal relation are taken into account by sampling on appropriate recalibration parameters. The result is shown in Fig. 3: the injected values, denoted with crosses, confidently lay within the 90% credibility regions of the recovered posterior distributions. At the detection threshold, the uncertainty on the radius are of the order of ( credibility level). Such precision is sufficient to distinguish soft and stiff EOSs within the 90% credibility regions, as illustrated using the SLy and DD2 EOSs.
EOS constraints and mass-radius diagram.—
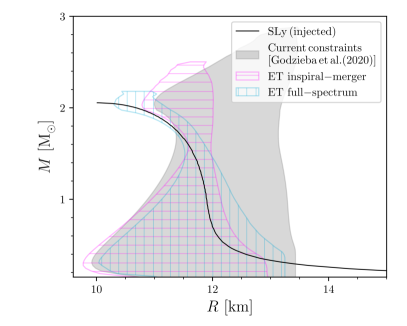
To illustrate the potential impact of this approach, we show how a single detection of PM signal at SNR 10 (total SNR 180 and luminosity distance of ) can constrain the mass-radius relation for NSs. The analysis makes use of the two-million EOS sample of Ref. Godzieba et al. (2021) that are consistent with current constraints on the EOS of dense matter. In particular, all EOSs predict maximum NS mass above the maximum NS mass from pulsar observations, Antoniadis et al. (2013), and are consistent with the upper bound on the tidal coupling constant from GW170817 Abbott et al. (2018b, 2019, 2017a). The only additional assumptions are the validity of general relativity and that the EOS is causal up to the central density of the maximum mass NS. We take the SLy binary as fiducial dataset and re-weight the EOS samples with the posteriors of the masses and the tidal parameters from the inspiral-merger and with the maximum density and minimum radius posteriors from the PM measurement.
Figure 4 shows the credibility regions of the posterior distributions in the mass-radius diagram. The inspiral-merger posteriors give the strongest constraint. They are mostly informative at the EOS at densities corresponding to the individual NS components of the binary Agathos et al. (2015). This inference leads to a measurement of the maximum NS mass of ( credibility level), consistent with the injected value (). However, the EOS posterior shows a biased behavior for high mass values, i.e. , excluding the SLy sequence from the 90% credibility region. This shows that the inspiral-merger signal does not directly constrain the high-density EOS and the inferred represents an extrapolation based on the EOS representation. The inclusion of PM information strengthens the agreement with the injected EOS at higher densities allowing a measurements of , which agrees with the injected value and carries an error lower than . The improved constraint reduces of the posterior area of the initial EOS sample leading, in particular, to tight pressure constraint at fiducial densities: and ( credibility level). For a detection at the sensitivity threshold (PM SNR 7.5) we find that the measured maximum NS mass is with a relative error of roughly .
Outlook.—
This work shows that next-generation GW observatories can deliver strong constraints on the extreme-density EOS from a single, full-spectrum detection of a BNS. In particular, the detection of the PM signal from the merger remnant significantly enhances the measurement of the NS maximum density and mass. The sensitivity threshold for PM BNS transients is around a luminosity distance , consistently with the recent estimates of Ref. Abbott et al. (2020a). According to our results, the multiple observation of about five PM BNS transients at sensitivity threshold can lead to a measurement of the maximum NS mass with an error of Torres-Rivas et al. (2019); Easter et al. (2020). This information provides narrow observational constraints that would significantly inform nuclear models in the very-high-density regimes, i.e. , which are unreachable conditions for modern nuclear experiments. Remarkably, the inclusion of the PM inference contributes in reducing observational errors and methodological biases.
In real observations, EOS constraints at the accuracy level reported here can be obtained by incorporating the PM signal in EOS inferences like those performed in Landry and Essick (2019); Abbott et al. (2019, 2020b); Essick et al. (2020a) for inspiral-merger signals. In this context, the development of accurate EOS-insensitive relations and the determination of their validity (or their breaking, e.g. Bauswein et al. (2019); Raithel and Most (2022)) via high-precision NR simulations is a key step to improve the reliability of the GW measurement. Going beyond the Fisher matrix approach employed here, future work will consider analyses employing Bayesian methods also for the inspiral-merger. Full spectrum analyses are currently possible given the availability of complete inspiral-merger-PM waveform models Breschi et al. (2019). The latter include correlations on the mass and tidal coupling constant between inspiral-merger and PM, that will further improve the estimates of this work. However, the most urgent issue for the high-SNR inspiral-mergers that will be observed by third-generation detectors remains waveform systematics in the inference of tidal properties Gamba et al. (2021); Samajdar and Dietrich (2018). Nevertheless, the computational challenges related to full-spectrum Bayesian analyses might be confronted with parallel methods Smith et al. (2020); Breschi et al. (2021a) and acceleration techniques for the likelihood evaluation, e.g. Smith et al. (2016); Zackay et al. (2018); Schmidt et al. (2021); Cornish (2021).
Acknowledgements.
Acknowledgments.—
The authors thank Francesco Zappa, Aviral Prakash and Andrea Camilletti for providing unreleased NR data and Ssohrab Borhanian for providing additional documentation for gwbench. Moreover, we acknowledge important discussions in the LIGO-Virgo Extreme matter group and within the Virgo-EGO collaboration, in particular we thank Nikolaos Stergioulas, Katerina Chatziioannou and Jocelyn Read. MB and SB acknowledge support by the EU H2020 under ERC Starting Grant, no. BinGraSp-714626. MB acknowledges support from the Deutsche Forschungsgemeinschaft (DFG) under Grant No. 406116891 within the Research Training Group RTG 2522/1. DR acknowledges funding from the U.S. Department of Energy, Office of Science, Division of Nuclear Physics under Award Number(s) DE-SC0021177 and from the National Science Foundation under Grants No. PHY-2011725, PHY-2020275, PHY-2116686, and AST-2108467. Virgo is funded by the French Centre National de Recherche Scientifique (CNRS), the Italian Istituto Nazionale della Fisica Nucleare (INFN) and the Dutch Nikhef, with contributions by Polish and Hungarian institutes. Simulations were performed on ARA, a resource of Friedrich-Schiller-Universtät Jena supported in part by DFG grants INST 275/334-1 FUGG, INST 275/363-1 FUGG and EU H2020 BinGraSp-714626. The bajes software together with the nrpm model are publicly available at: https://github.com/matteobreschi/bajes. The NR simulations employed in this work are publicly available at: http://www.computational-relativity.org/.
References
- Shibata and Taniguchi (2006) M. Shibata and K. Taniguchi, Phys.Rev. D73, 064027 (2006), arXiv:astro-ph/0603145 [astro-ph] .
- Hotokezaka et al. (2013) K. Hotokezaka, K. Kiuchi, K. Kyutoku, T. Muranushi, Y.-i. Sekiguchi, et al., Phys.Rev. D88, 044026 (2013), arXiv:1307.5888 [astro-ph.HE] .
- Bauswein and Stergioulas (2015) A. Bauswein and N. Stergioulas, Phys. Rev. D91, 124056 (2015), arXiv:1502.03176 [astro-ph.SR] .
- Takami et al. (2014) K. Takami, L. Rezzolla, and L. Baiotti, Phys.Rev.Lett. 113, 091104 (2014), arXiv:1403.5672 [gr-qc] .
- Bernuzzi et al. (2015) S. Bernuzzi, T. Dietrich, and A. Nagar, Phys. Rev. Lett. 115, 091101 (2015), arXiv:1504.01764 [gr-qc] .
- Lehner et al. (2016) L. Lehner, S. L. Liebling, C. Palenzuela, O. L. Caballero, E. O’Connor, M. Anderson, and D. Neilsen, Class. Quant. Grav. 33, 184002 (2016), arXiv:1603.00501 [gr-qc] .
- Abbott et al. (2017a) B. P. Abbott et al. (Virgo, LIGO Scientific), Phys. Rev. Lett. 119, 161101 (2017a), arXiv:1710.05832 [gr-qc] .
- Abbott et al. (2017b) B. P. Abbott et al. (Virgo, LIGO Scientific), Astrophys. J. 851, L16 (2017b), arXiv:1710.09320 [astro-ph.HE] .
- Abbott et al. (2019) B. P. Abbott et al. (LIGO Scientific, Virgo), Phys. Rev. X9, 011001 (2019), arXiv:1805.11579 [gr-qc] .
- Abbott et al. (2018a) B. P. Abbott et al. (LIGO Scientific, Virgo), (2018a), 10.3847/1538-4357/ab0f3d, arXiv:1810.02581 [gr-qc] .
- Abbott et al. (2020a) B. Abbott et al. (LIGO Scientific, Virgo), Astrophys. J. Lett. 892, L3 (2020a), arXiv:2001.01761 [astro-ph.HE] .
- Hild et al. (2011) S. Hild et al., Class. Quant. Grav. 28, 094013 (2011), arXiv:1012.0908 [gr-qc] .
- Punturo et al. (2010a) M. Punturo, M. Abernathy, F. Acernese, B. Allen, N. Andersson, et al., Class.Quant.Grav. 27, 084007 (2010a).
- Ackley et al. (2020) K. Ackley et al., Publ. Astron. Soc. Austral. 37, e047 (2020), arXiv:2007.03128 [astro-ph.HE] .
- Clark et al. (2016) J. A. Clark, A. Bauswein, N. Stergioulas, and D. Shoemaker, Class. Quant. Grav. 33, 085003 (2016), arXiv:1509.08522 [astro-ph.HE] .
- Chatziioannou et al. (2017) K. Chatziioannou, J. A. Clark, A. Bauswein, M. Millhouse, T. B. Littenberg, and N. Cornish, Phys. Rev. D96, 124035 (2017), arXiv:1711.00040 [gr-qc] .
- Torres-Rivas et al. (2019) A. Torres-Rivas, K. Chatziioannou, A. Bauswein, and J. A. Clark, Phys. Rev. D99, 044014 (2019), arXiv:1811.08931 [gr-qc] .
- Tsang et al. (2019) K. W. Tsang, T. Dietrich, and C. Van Den Broeck, Phys. Rev. D100, 044047 (2019), arXiv:1907.02424 [gr-qc] .
- Breschi et al. (2019) M. Breschi, S. Bernuzzi, F. Zappa, M. Agathos, A. Perego, D. Radice, and A. Nagar, Phys. Rev. D100, 104029 (2019), arXiv:1908.11418 [gr-qc] .
- Easter et al. (2019) P. J. Easter, P. D. Lasky, A. R. Casey, L. Rezzolla, and K. Takami, Phys. Rev. D 100, 043005 (2019), arXiv:1811.11183 [gr-qc] .
- Easter et al. (2020) P. J. Easter, S. Ghonge, P. D. Lasky, A. R. Casey, J. A. Clark, F. H. Vivanco, and K. Chatziioannou, Phys. Rev. D 102, 043011 (2020), arXiv:2006.04396 [astro-ph.HE] .
- Damour et al. (2012) T. Damour, A. Nagar, and L. Villain, Phys.Rev. D85, 123007 (2012), arXiv:1203.4352 [gr-qc] .
- Gamba et al. (2021) R. Gamba, M. Breschi, S. Bernuzzi, M. Agathos, and A. Nagar, Phys. Rev. D 103, 124015 (2021), arXiv:2009.08467 [gr-qc] .
- Chatziioannou (2021) K. Chatziioannou, (2021), arXiv:2108.12368 [gr-qc] .
- Abbott et al. (2018b) B. P. Abbott et al. (LIGO Scientific, Virgo), Phys. Rev. Lett. 121, 161101 (2018b), arXiv:1805.11581 [gr-qc] .
- Landry and Essick (2019) P. Landry and R. Essick, Phys. Rev. D 99, 084049 (2019), arXiv:1811.12529 [gr-qc] .
- Agathos et al. (2020) M. Agathos, F. Zappa, S. Bernuzzi, A. Perego, M. Breschi, and D. Radice, Phys. Rev. D101, 044006 (2020), arXiv:1908.05442 [gr-qc] .
- Bauswein et al. (2012) A. Bauswein, H. Janka, K. Hebeler, and A. Schwenk, Phys.Rev. D86, 063001 (2012), arXiv:1204.1888 [astro-ph.SR] .
- Bauswein et al. (2016) A. Bauswein, N. Stergioulas, and H.-T. Janka, Eur. Phys. J. A52, 56 (2016), arXiv:1508.05493 [astro-ph.HE] .
- Takami et al. (2015) K. Takami, L. Rezzolla, and L. Baiotti, Phys.Rev. D91, 064001 (2015), arXiv:1412.3240 [gr-qc] .
- Bauswein et al. (2013) A. Bauswein, T. Baumgarte, and H. T. Janka, Phys.Rev.Lett. 111, 131101 (2013), arXiv:1307.5191 [astro-ph.SR] .
- Bauswein et al. (2014) A. Bauswein, N. Stergioulas, and H.-T. Janka, Phys.Rev. D90, 023002 (2014), arXiv:1403.5301 [astro-ph.SR] .
- Essick et al. (2020a) R. Essick, P. Landry, and D. E. Holz, Phys. Rev. D 101, 063007 (2020a), arXiv:1910.09740 [astro-ph.HE] .
- Breschi et al. (2021a) M. Breschi, R. Gamba, and S. Bernuzzi, Phys. Rev. D 104, 042001 (2021a), arXiv:2102.00017 [gr-qc] .
- Margalit and Metzger (2017) B. Margalit and B. D. Metzger, Astrophys. J. 850, L19 (2017), arXiv:1710.05938 [astro-ph.HE] .
- Radice et al. (2018a) D. Radice, A. Perego, F. Zappa, and S. Bernuzzi, Astrophys. J. 852, L29 (2018a), arXiv:1711.03647 [astro-ph.HE] .
- Bauswein et al. (2017) A. Bauswein, O. Just, H.-T. Janka, and N. Stergioulas, Astrophys. J. 850, L34 (2017), arXiv:1710.06843 [astro-ph.HE] .
- Coughlin et al. (2018) M. W. Coughlin et al., Mon. Not. Roy. Astron. Soc. 480, 3871 (2018), arXiv:1805.09371 [astro-ph.HE] .
- Raaijmakers et al. (2020) G. Raaijmakers et al., Astrophys. J. Lett. 893, L21 (2020), arXiv:1912.11031 [astro-ph.HE] .
- Dietrich et al. (2020) T. Dietrich, M. W. Coughlin, P. T. H. Pang, M. Bulla, J. Heinzel, L. Issa, I. Tews, and S. Antier, Science 370, 1450 (2020), arXiv:2002.11355 [astro-ph.HE] .
- Essick et al. (2020b) R. Essick, I. Tews, P. Landry, S. Reddy, and D. E. Holz, Phys. Rev. C 102, 055803 (2020b), arXiv:2004.07744 [astro-ph.HE] .
- Breschi et al. (2021b) M. Breschi, A. Perego, S. Bernuzzi, W. Del Pozzo, V. Nedora, D. Radice, and D. Vescovi, Mon. Not. Roy. Astron. Soc. 505, 1661 (2021b), arXiv:2101.01201 [astro-ph.HE] .
- Lioutas et al. (2021) G. Lioutas, A. Bauswein, and N. Stergioulas, Phys. Rev. D 104, 043011 (2021), arXiv:2102.12455 [astro-ph.HE] .
- Dietrich et al. (2018) T. Dietrich, D. Radice, S. Bernuzzi, F. Zappa, A. Perego, B. Brügmann, S. V. Chaurasia, R. Dudi, W. Tichy, and M. Ujevic, Class. Quant. Grav. 35, 24LT01 (2018), arXiv:1806.01625 [gr-qc] .
- Radice et al. (2018b) D. Radice, A. Perego, K. Hotokezaka, S. A. Fromm, S. Bernuzzi, and L. F. Roberts, Astrophys. J. 869, 130 (2018b), arXiv:1809.11161 [astro-ph.HE] .
- Bernuzzi et al. (2020) S. Bernuzzi et al., Mon. Not. Roy. Astron. Soc. (2020), 10.1093/mnras/staa1860, arXiv:2003.06015 [astro-ph.HE] .
- Nedora et al. (2021) V. Nedora, S. Bernuzzi, D. Radice, B. Daszuta, A. Endrizzi, A. Perego, A. Prakash, M. Safarzadeh, F. Schianchi, and D. Logoteta, Astrophys. J. 906, 98 (2021), arXiv:2008.04333 [astro-ph.HE] .
- Prakash et al. (2021) A. Prakash, D. Radice, D. Logoteta, A. Perego, V. Nedora, I. Bombaci, R. Kashyap, S. Bernuzzi, and A. Endrizzi, Phys. Rev. D 104, 083029 (2021), arXiv:2106.07885 [astro-ph.HE] .
- Engvik et al. (1996) L. Engvik, G. Bao, M. Hjorth-Jensen, E. Osnes, and E. Ostgaard, Astrophys. J. 469, 794 (1996), arXiv:nucl-th/9509016 .
- Müller and Serot (1996) H. Müller and B. D. Serot, Nucl. Phys. A606, 508 (1996), arXiv:nucl-th/9603037 [nucl-th] .
- Alford et al. (2005) M. Alford, M. Braby, M. W. Paris, and S. Reddy, Astrophys. J. 629, 969 (2005), arXiv:nucl-th/0411016 .
- Lackey et al. (2006) B. D. Lackey, M. Nayyar, and B. J. Owen, Phys. Rev. D 73, 024021 (2006), arXiv:astro-ph/0507312 .
- Read et al. (2009) J. S. Read, B. D. Lackey, B. J. Owen, and J. L. Friedman, Phys. Rev. D79, 124032 (2009), arXiv:0812.2163 [astro-ph] .
- Lattimer and Swesty (1991) J. M. Lattimer and F. D. Swesty, Nucl. Phys. A535, 331 (1991).
- Douchin and Haensel (2001) F. Douchin and P. Haensel, Astron. Astrophys. 380, 151 (2001), astro-ph/0111092 .
- Typel et al. (2010) S. Typel, G. Ropke, T. Klahn, D. Blaschke, and H. H. Wolter, Phys. Rev. C81, 015803 (2010), arXiv:0908.2344 [nucl-th] .
- Steiner et al. (2013) A. W. Steiner, J. M. Lattimer, and E. F. Brown, Astrophys. J. 765, L5 (2013), arXiv:1205.6871 [nucl-th] .
- Logoteta et al. (2020) D. Logoteta, A. Perego, and I. Bombaci, (2020), 10.1051/0004-6361/202039457, arXiv:2012.03599 [nucl-th] .
- Banik et al. (2014) S. Banik, M. Hempel, and D. Bandyopadhyay, Astrophys. J. Suppl. 214, 22 (2014), arXiv:1404.6173 [astro-ph.HE] .
- Radice et al. (2017) D. Radice, S. Bernuzzi, W. Del Pozzo, L. F. Roberts, and C. D. Ott, Astrophys. J. 842, L10 (2017), arXiv:1612.06429 [astro-ph.HE] .
- Kiuchi et al. (2018) K. Kiuchi, K. Kyutoku, Y. Sekiguchi, and M. Shibata, Phys. Rev. D97, 124039 (2018), arXiv:1710.01311 [astro-ph.HE] .
- Radice et al. (2021) D. Radice, S. Bernuzzi, A. Perego, and R. Haas, (2021), arXiv:2111.14858 [astro-ph.HE] .
- Punturo et al. (2010b) M. Punturo, M. Abernathy, F. Acernese, B. Allen, N. Andersson, et al., Class.Quant.Grav. 27, 194002 (2010b).
- Perego et al. (2019) A. Perego, S. Bernuzzi, and D. Radice, Eur. Phys. J. A55, 124 (2019), arXiv:1903.07898 [gr-qc] .
- Speagle (2020) J. S. Speagle, Monthly Notices of the Royal Astronomical Society 493, 3132?3158 (2020).
- Zappa et al. (2018) F. Zappa, S. Bernuzzi, D. Radice, A. Perego, and T. Dietrich, Phys. Rev. Lett. 120, 111101 (2018), arXiv:1712.04267 [gr-qc] .
- Vitale et al. (2012) S. Vitale, W. Del Pozzo, T. G. Li, C. Van Den Broeck, I. Mandel, et al., Phys.Rev. D85, 064034 (2012), arXiv:1111.3044 [gr-qc] .
- Borhanian (2021) S. Borhanian, Class. Quant. Grav. 38, 175014 (2021), arXiv:2010.15202 [gr-qc] .
- Godzieba et al. (2021) D. A. Godzieba, D. Radice, and S. Bernuzzi, Astrophys. J. 908, 122 (2021), arXiv:2007.10999 [astro-ph.HE] .
- Antoniadis et al. (2013) J. Antoniadis, P. C. Freire, N. Wex, T. M. Tauris, R. S. Lynch, et al., Science 340, 6131 (2013), arXiv:1304.6875 [astro-ph.HE] .
- Agathos et al. (2015) M. Agathos, J. Meidam, W. Del Pozzo, T. G. F. Li, M. Tompitak, J. Veitch, S. Vitale, and C. V. D. Broeck, Phys. Rev. D92, 023012 (2015), arXiv:1503.05405 [gr-qc] .
- Abbott et al. (2020b) B. P. Abbott et al. (LIGO Scientific, Virgo), Class. Quant. Grav. 37, 045006 (2020b), arXiv:1908.01012 [gr-qc] .
- Bauswein et al. (2019) A. Bauswein, N.-U. F. Bastian, D. B. Blaschke, K. Chatziioannou, J. A. Clark, T. Fischer, and M. Oertel, Phys. Rev. Lett. 122, 061102 (2019), arXiv:1809.01116 [astro-ph.HE] .
- Raithel and Most (2022) C. A. Raithel and E. R. Most, (2022), arXiv:2201.03594 [astro-ph.HE] .
- Samajdar and Dietrich (2018) A. Samajdar and T. Dietrich, Phys. Rev. D98, 124030 (2018), arXiv:1810.03936 [gr-qc] .
- Smith et al. (2020) R. J. E. Smith, G. Ashton, A. Vajpeyi, and C. Talbot, Mon. Not. Roy. Astron. Soc. 498, 4492 (2020), arXiv:1909.11873 [gr-qc] .
- Smith et al. (2016) R. Smith, S. E. Field, K. Blackburn, C.-J. Haster, M. Pürrer, V. Raymond, and P. Schmidt, Phys. Rev. D94, 044031 (2016), arXiv:1604.08253 [gr-qc] .
- Zackay et al. (2018) B. Zackay, L. Dai, and T. Venumadhav, (2018), arXiv:1806.08792 [astro-ph.IM] .
- Schmidt et al. (2021) S. Schmidt, M. Breschi, R. Gamba, G. Pagano, P. Rettegno, G. Riemenschneider, S. Bernuzzi, A. Nagar, and W. Del Pozzo, Phys. Rev. D 103, 043020 (2021), arXiv:2011.01958 [gr-qc] .
- Cornish (2021) N. J. Cornish, Phys. Rev. D 104, 104054 (2021), arXiv:2109.02728 [gr-qc] .