Increasing decoherence rate of Rydberg polaritons due to accumulating dark Rydberg atoms
Abstract
We experimentally observed an accumulative type of nonlinear attenuation and distortion of slow light, i.e., Rydberg polaritons, with the Rydberg state in the weak-interaction regime. The present effect of attenuation and distortion cannot be explained by considering only the dipole-dipole interaction (DDI) between Rydberg atoms in . Our observation can be attributed to the atoms in the dark Rydberg states other than those in the bright Rydberg state, i.e., , driven by the coupling field. The dark Rydberg states are all the possible states, in which the population decaying from accumulated over time, and they were not driven by the coupling field. Consequently, the DDI between the dark and bright Rydberg atoms increased the decoherence rate of the Rydberg polaritons. We performed three different experiments to verify the above hypothesis, to confirm the existence of the dark Rydberg states, and to measure the decay rate from the bright to dark Rydberg states. In the theoretical model, we included the decay process from the bright to dark Rydberg states and the DDI effect induced by both the bright and dark Rydberg atoms. All the experimental data of slow light taken at various probe Rabi frequencies were in good agreement with the theoretical predictions based on the model. This study pointed out an additional decoherence rate in the Rydberg-EIT effect, and provides a better understanding of the Rydberg-polariton system.
I Introduction
Atoms in the Rydberg states possess a strong electric dipole-dipole interaction (DDI) among themselves. The blockade effect arising from the DDI is a versatile mechanism for quantum information processing blockade_Zoller2000 ; Comparat_2010 ; SaffmanRMP ; Pfau_2013 . The combination of the DDI and the effect of electromagnetically induced transparency (EIT) can mediate strong photon-photon interactions Adams_2010 ; Fleischhauer_2011 ; Lukin_Nature_2012 ; Gorshkov_PRL_2017 ; Hofferberth_2014 ; Rempe_swithch_2014 ; Rempe_2014 ; Rempe_gate . Thus, Rydberg atoms have led to applications such as quantum logic gates Lukin_2000 ; Saffman_2017 ; Lukin_PRL_2019 ; Rempe_gate , single-photon generation Kuzmich_2012 ; Pfau_2018 ; ondemand_2020 , single-photon transistors Hofferberth_2014 ; Rempe_2014 , and single-photon switches Rempe_swithch_2014 . Furthermore, the system of Rydberg atoms in a vapor or an array is also a platform for the study of many-body physics Bloch_2012 ; dressing_2016 ; Gross_2016 ; Browaeys_2016 ; Lukin_2017 ; Lukin_2019 ; dressing_2020 ; Lukin_2021 .
Most of the studies on Rydberg atoms have been performed in a strong interaction regime. On the contrary, the DDI-induced effect in the weak interaction regime based on EIT was studied theoretically OurOE2020 and experimentally OurCommunPhys2021 with a low principal quantum number of and a low Rydberg-atom density equal to or less than 2.0109 cm-3. The weak interaction regime in those studies were where and are the half mean distance between the Rydberg atoms and the blockade radius, respectively. Due to the EIT effect EIT_review , the propagation delay time or photon-matter interaction time in a high-OD medium was a couple of s. With help of a sufficient collision rate and interaction time in a high-OD EIT medium of weakly interacting Rydberg atoms, it was observed that a smaller width of the transverse momentum distribution of Rydberg polaritons at the exit of the system as compared with that at the entrance OurCommunPhys2021 .
The observation in Ref. OurCommunPhys2021 is a demonstration of thermalization process of Rydberg polariton, and indicates a possibility of Rydberg polariton Bose-Einstein condensation (BEC). It was also suggested to make Rydberg polaritons stationary and cool down the temperature in both transverse and longitudinal directions for the realization of BEC. To achieve the Rydberg polariton BEC, it is needed to gather rather many particles of weakly-interacting polaritons with a long interaction time in the system. However, the loss of the polaritons due to an extra attenuation, which is discussed in this study, hinders the particles from achieving the Rydberg polariton BEC.
In this work, we systematically studied the transmission of a probe field propagating through a Rydberg-EIT system with experimental conditions similar to Ref. OurCommunPhys2021 . We observed the distorted output pulses which were inconsistent with the theoretical prediction considering the DDI-induced decoherence rate OurOE2020 ; OurCommunPhys2021 . Based on the measurements, we found evidence of the presence of the dark Rydberg states which were not driven by the coupling field. The population can be transferred from a bright Rydberg state, which was excited by coupling field, to the dark Rydberg states. Since not interacting with the coupling field, the dark Rydberg atoms accumulated over time. On the other hand, due to the DDI between the dark and bright Rydberg atoms, the DDI-induced decoherence rate increased with time.
Following the scenario described in the previous paragraph, we proposed a theoretical model based on the experimental data. Using a theoretical model to take into account the effect that population accumulates in some dark Rydberg states and the dark Rydberg atoms cause an extra DDI-induced decoherence rate, we can successfully explain the experimental data. We believe the effect is universal. There are several previous papers that studied decay or transition from the bright to dark Rydberg states, and the phenomena caused by the dark Rydberg atoms. However, to our knowledge, the increasing DDI-induced decoherence rate due to atoms accumulating in dark Rydberg states is a new phenomenon, which has not been systematically studied before. This work can provide a better understanding for the creation of dark Rydberg atoms and their influence to Rydberg polaritons in the Rydberg-EIT system. This work also points out an obstacle in the realization of the BEC with weakly-interacting Rydberg polaritons.
This article is organized as follows. In Sec. II, we present the distorted output probe pulse shapes, which we cannot explain with the theoretical model as it only considered the DDI between the bright Rydberg states under the EIT condition. In addition, we show the necessity of the consideration of the dark Rydberg states by measurements of the decay time constant, the steady-state attenuation coefficient of the square input pulse, and the lifetime of the dark Rydberg state. In Sec. III, we introduce a modified theoretical model to describe the increasing attenuation coefficient over time depending on the density of the Rydberg atom. We also report the method for estimating the decay rate from the bright Rydberg state to the dark Rydberg state and compare the experimental data with the theoretical prediction. In Sec. IV, we discuss the possible transfer process from the bright to the dark Rydberg states and the interaction strength between a bright and a dark Rydberg atoms. Finally, we summarize the results in Sec. V.
II Observation of the Accumulation Effect
II.1 Experiment setup
The experiment was performed with a cigar-shaped cold 87Rb atom cloud produced by a magneto-optical trap. The dimension of the cloud was mm3 cigar-shape MOT and the temperature was about 350 k OurPRA2019 ; OurCommunPhys2021 . The transition scheme formed by the probe and coupling fields is shown in Fig. 1(a). The probe field drove the transition between the ground state and the intermediate state , and the coupling field drove the transition between state and the Rydberg state . States , , and corresponded to the ground state , the Rydberg state , and the excited state of 87Rb atoms, respectively. We prepared all population in a single Zeeman state by optical pumping Natcomm_2014 . In the experiment, the -polarized probe and coupling fields were used. Owing to the optical pumping and polarization of the laser fields, the relevant energy levels , , and were considered as a single Zeeman state. The spontaneous decay rate of is 6.07 MHz, and that of is 27.9 kHz or 1.3 Rb87Data ; RydbergStateLifeTime . As the van der Waals interaction energy is denoted as , the Rydberg atoms in have 130 MHzm6 Saffman_C6 .
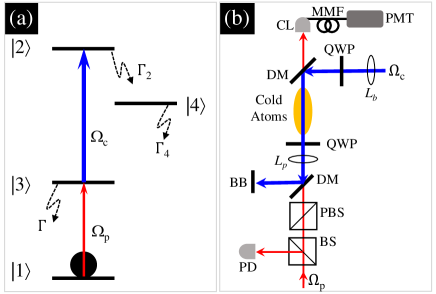
The experimental scheme is shown in Fig. 1(b). Frequency stabilized laser systems generated the probe and coupling fields. The details of the stabilization method are described in Refs. OurPRA2019 ; OurCommunPhys2021 . The probe and coupling fields were the first-order beams of the acousto-optic modulators (AOMs, not drawn in the figure). The AOMs were used to control the time sequence, shape the probe pulse, and adjust the frequency and the amplitude of the fields precisely. Each field was sent to the atom cloud by the polarization maintained optical fiber (PMF) after the AOM. To minimize the Doppler effect, we used the counter-propagating scheme of the probe and coupling fields. At the center of the cloud, the full widths of the probe and coupling beams were 130 and 250 m, respectively. The pulse shape and amplitude of the input probe field were monitored by a photo detector (PD) before entering the atom cloud as shown in Fig. 1(b). The probe field was detected by a photomultiplier tube (PMT) after passing through the atom cloud. A digital oscilloscope (Agilent MSO6014A) acquired the signal from the PMT and produced the raw data.
II.2 Theoretical model without the accumulation effect
The Rydberg atoms inside the cloud were considered randomly distributed particles, similar to ideal gases, due to the assumption that the condition of a weakly-interacting many-body system of Rydberg polaritons was satisfied. Therefore, the mean-field model developed in Ref. OurOE2020 was adopted to describe the DDI-induced behaviors in this study.
We initially considered only the states , , and shown by Fig. 1(a) in the theoretical model. The DDI-induced decoherence rate () and frequency shift (), which are caused by the population in the Rydberg state , were taken into account. The optical Bloch equations (OBEs) of the density matrix operator and the Maxwell-Schrödinger equation (MSE) of the probe field are given below:
| (1) | |||||
| (2) | |||||
| (3) | |||||
| (4) | |||||
| (5) | |||||
| (6) | |||||
| (7) |
where () represents a matrix element of the density matrix operator, and are the Rabi frequencies of the probe and coupling fields, is the two-photon detuning, is the intrinsic decoherence rate in the experimental system, and are the one-photon detunings of the probe and coupling transitions, and and are the optical depth and length of the medium.
The values of and were obtained by the analytic formulas of the attenuation coefficient () and the phase shift (), respectively, induced by the DDI in the steady-state condition. The formulas were derived in Ref. OurOE2020 , utilizing a mean-field model based on the nearest neighbor distribution, and they were experimentally verified in Ref. OurCommunPhys2021 . At the condition of and , the formulas of and are given by:
| (8) |
| (9) |
where is the density of the Rydberg-state atoms. Using the relation between and the density of all atoms, , we introduced the coefficient , which is written as:
| (10) |
The coefficient represents the DDI-induced decoherence rate or frequency shift per unit . From Eqs. (8) and (10), we obtained:
| (11) |
Similarly, from Eqs. (9) and (10), we also obtained:
| (12) |
Thus, and were replaced by in the OBEs. According to the values of , , and used in the experiment, it was determined that 0.76. We set and fixed to 0.76 in all the theoretical predictions of this work and the values of and are linearly proportional to the population of the Rydberg state, .
Furthermore, the effect of the DDI, i.e., and , was ignored to obtain Eq. (3) due to the assumption of , which was the case in the experiment. Throughout this study, the two-photon resonance condition of was always maintained. Please note that the term of in Eq. (1), i.e., , played a negligible role in the output probe transmission, since and in all the cases of this work. To obtain Eqs. (5) and (6), we also considered that the population in rarely decayed to and . When we made the population in all decay to by adding the term of to the right-hand-side of Eq. (6), the calculation result changed very little because in this work.
II.3 Distorted output pulses of slow light
Before the measurement, the values of the one-photon detuning and two-photon detuning were set to zero and experimentally verified. We determined the experimental parameters in the order of OD. The parameters were confirmed again after the measurement in the reverse order of that before measurement. Determined , , and OD were 1.0, 9.0 and 70, respectively. Details can be found in Supplemental material and Ref. OurPRA2019 .
Following the definition of the half mean distance between Rydberg polaritons, , the estimated smallest in this experiment was 5.0 m when was OurOE2020 . The blockade radius, , was 1.9 m according to the formula of Lukin_Nature_2012 . was the largest input probe Rabi frequency and was kept throughout the EIT experiment. Thus, it was considered a weakly-interacting many-body system of Rydberg polaritons, which satisfied the condition of .
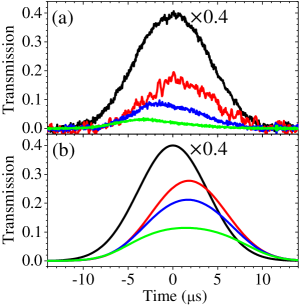
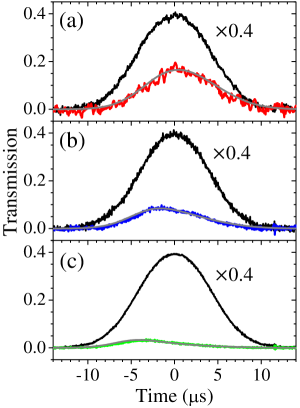
Using the above experimental conditions, we measured the slow light data as shown in Fig. 2(a). An input probe pulse with a Gaussian full width of 11.5 s was used in this measurement. This input pulse was far longer than that used in the determining the OD. Considering the values of OD and , the delay time was expected to be s as the result of a short input Gaussian pulse with the full width of 0.66 s. However, the peak position of the output pulse with of the long Gaussian input probe pulse was nearly the same as the peak position of the input pulse (i.e., the delay time was nearly zero). Furthermore, a stronger input pulse had an output peak position that preceded the input peak position and showed a more distorted shape of the output pulse.
The degree of distortion of the output pulse shape depends on , or equivalently the Rydberg atom density. One might guess that the DDI effect could explain the distortion, and the experimental data of Fig. 2(a) could be predicted by Eqs. (1)-(7) with the introduction of and . To test this hypothesis, we calculated the theoretical predictions as shown in Fig. 2(b) by solving Eqs. (1)-(7), which included the effect of DDI. We used the experimentally-determined values of , , , and in the calculation. Owing to the DDI effect, i.e., the term of or in Eq. (1), we did observe a lower transmission with a higher value of in the theoretical prediction. In each case of , the theoretical prediction gave a very similar delay time (s), which resulted in a higher peak transmission than the experimental value. The theoretical predictions did not agree with the experimental data.
II.4 Phenomenon of the DDI-induced attenuation increasing with time
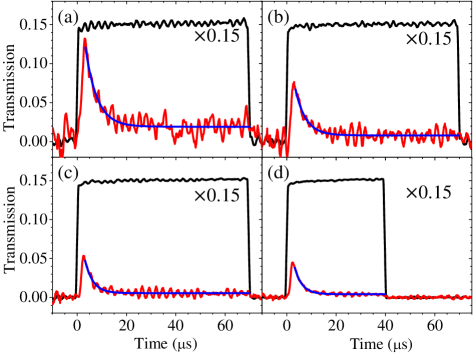
To further study the phenomenon, we applied the long square probe pulse with the input Rabi frequency of 0.08, 0.10, 0.15, or 0.2 under the constant presence of the coupling field, as shown in Fig 3. The experimental parameters of (OD) = 70, = , = 0, and = 0 were kept the same as in the measurements with the Gaussian input, but was changed to in the measurement.
Regarding the behavior of the output probe field in Fig. 3, we observed that the transmission decreased (or the attenuation increases) with time, after it reached the peak value in each of the measurements. The peak value of the output probe transmission decreased with . This was expected from the DDI effect, i.e., the term of or in Eq. (1), where . However, neither the theoretical model nor Eqs. (1)-(7) described in Sec. II.2 were not able to explain the phenomenon of the transmission decay or the increasing attenuation over time. We fitted the decayed part of the experimental data with an exponential-decay function, and determined the decay time constant and the steady-state attenuation coefficient. Blue lines shown in Fig. 3 are the best fits.
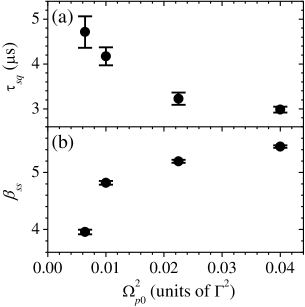
Based on the best fits in Fig. 3, the decay time constant, , and steady-state attenuation coefficient, , as functions of are shown in Figs. 4(a) and 4(b), respectively. The value of was given by the absolute value of the logarithm of the transmission at the steady state. Figures 4(a) and 4(b) clearly show that a larger value of resulted in a faster decay and a larger steady-state attenuation.
A higher Rydberg polariton density leads to a larger DDI-induced attenuation. Thus, the data in Figs. 3 and 4 inferred that the Rydberg polariton density increased with time. One can guess that some of the Rydberg population in was transferred to other states (denoted as ), and that the atoms in did not interact with the coupling field but were able to have a DDI with the atoms in . Due to the existence of the DDI, had to represent some nearby Rydberg states of . The population in , which was not driven by the coupling field, should have accumulated. As more population accumulated in , the DDI-induced attenuation of became large. Thus, the probe output transmission decreased with time, exhibiting the accumulation phenomenon of the DDI effect.
In Fig. 1(a), we introduce to represent all possible nearby Rydberg states of . The spontaneous or collisional decay process could cause the transfer of the population from to , because no additional field was applied in the experiment. Since was driven by the coupling field, it was called the bright Rydberg state. On the other hand, did not interact with any applied field and was called the dark Rydberg state.
II.5 Evidence of dark Rydberg states
To verify the hypothesis based on the dark Rydberg state , we measured the existing time of the DDI effect, after nearly all the atoms in the bright Rydberg state had been de-excited. The basic idea of this measurement was as follows. Since the atoms in did not interact with any applied field, they should decay by themselves and have a decay rate of . Furthermore, represented a number of Rydberg states, so must be close to the Rydberg-state lifetime. Consequently, after the atoms in had been removed, the DDI effect should still exist in the system, and gradually decay with the time constant of . Then, we explored the DDI-induced attenuation as a function of time in the system by employing a very weak Gaussian probe pulse and the coupling field. The probe pulse was weak enough to cause a negligible DDI effect by itself.
The sequence of the input probe field is depicted in the inset of Fig. 5. A 70-s square probe pulse of = 0.1 was first employed. The pulse duration was sufficiently long compared with the lifetime of , which was approximately s at room temperature. The OD was 70 and the coupling field of 1.0 was continuously kept on during the measurement. After the square probe pulse was switched off, the coupling field quickly de-excited the remaining population in . The de-excitation time was estimated to be about 27 ns. We waited for a certain time after the square pulse was turned off, and then applied a weak Gaussian probe pulse to measure the DDI-induced attenuation, , as a function of . The value of was equal to the absolute value of the logarithm of the peak transmission of the output Gaussian pulse. The input Gaussian pulse had the peak of 0.05 and the full width of 10 s. Compared with the 70-s square probe pulse, the weaker and much shorter Gaussian probe pulse induced a negligible DDI effect.
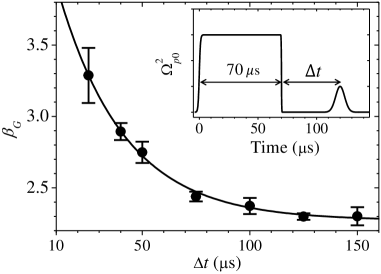
We observed the exponential-decay behavior of versus as shown in Fig. 5 in which the circles are the experimental data and the black line is the best fit of an exponential-decay function. The decay time constant of the best fit was 31 s, which is about the lifetime of a Rydberg state with a principal quantum number between 32 and 38. The atoms in were quickly de-excited by the coupling field, after the square probe pulse was switched off. If the atoms in the dark Rydberg state could not exist in the system, the value of would quickly drop to its steady-state value due to the absence of the atoms in the bright Rydberg state . The slow decay of demonstrated the existence of the atoms in , which did not interact with the coupling field, but gave the DDI effect and decayed slowly.
III Theory of the accumulation effect and experimental verification
III.1 Theoretical model with the accumulation effect
In the previous section, we discussed the necessity of the consideration of dark Rydberg states in the system. To simulate the accumulative DDI effect observed in the experiment, we improved the theoretical model described in Subsec. II.2 by including the dark Rydberg state and the decay process from to . The DDI effect between one atom in and one atom in was also taken into account. Thus, the OBEs can be given by:
| (13) | |||||
| (14) | |||||
| (15) | |||||
| (16) | |||||
| (17) | |||||
| (18) | |||||
| (19) |
where the coefficient represents the DDI-induced decoherence rate or frequency shift per unit with a value given by Eq. (10), the coefficient (or ) is similar to the coefficient and represents the DDI-induced decoherence rate (or frequency shift) per unit , is the decay rate from to , and is the decay rate of .
The terms and in Eq. (13) represent and , respectively. The values of and varied with space and time due to the populations of and during the propagation of the probe light. The decay rate was parametrized as:
| (20) |
where the coefficient is the two-body decay rate per unit , and the coefficient is the one-body decay rate. The atomic density, , of the system is a part of the coefficient . Further discussion regarding the transfer mechanism can be found in the Discussion section.
In Eq. (15), the DDI effect, i.e., and , and the decay rates, i.e., , and , were ignored due to the experimental condition of . Please note that the frequency shift induced by the population in each of the dark Rydberg states might be positive or negative, and thus the net frequency shift resulted in . Furthermore, the term of in Eq. (13) played a negligible role in the output probe transmission, since and in all the cases of this work.
The value of given by Eq. (10) was derived from Ref. OurOE2020 and experimentally verified in Ref. OurCommunPhys2021 . We first measured the coefficients and as described in Subsec. III.2. Using the known values of , , and , we then determined using the experimental data of Fig. 3 as illustrated in Subsec. III.3. Finally, we compared the experimental data of the slow light shown in Fig. 2 with the theoretical predictions calculated using the experimentally determined values of , , , and in Subsec. III.3. The comparison was used to test the validity of the theoretical model introduced here.
III.2 Determination of the decay rate from bright to dark Rydberg states
We designed an experiment to determine the coefficients and in Eq. (20). The decay rate, , of the atoms in was measured against the atomic density of , . The experiment details can be found in Supplemental material. The procedure of the measurement of was as follows. We first prepared a given number of atoms in the ground state and excited them to with a two-photon transition (TPT) pulse. The TPT had a large one-photon detuning . After the TPT pulse, no light field was applied, and the atoms in decayed. Then, we waited for a certain time , and also depleted the residual atoms in . At the end of , the remaining atoms in were brought back to with another TPT pulse. Finally, after the second TPT pulse we determined the number of the returned atoms in or, equivalently, measured the absorption coefficient, , of the weak probe field. The result of was proportional to the remaining atoms in after the given . By varying and measuring , we obtained the data points of as a function of , and fitted the data with an exponential function. The best fit gave the value of .
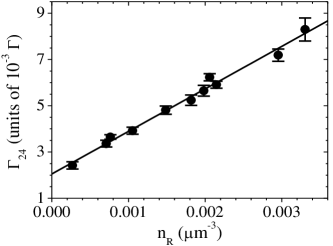
The circles in Fig. 6 are the experimental data of as a function of . Each circle represents the result of a series of measurements similar to those shown in Supplemental Material. We fitted the circles in Fig. 6 with the fitting function of a straight line. The interception of the best fit determined the coefficient defined in Eq. (20), which was 2.0. The determined value of was comparable to the spontaneous decay rate of at room temperature, which is Rb87Data ; RydbergStateLifeTime . Furthermore, the slope, , of the best fit determined the coefficient defined in Eq. (20) in the following way: Since and , the coefficient is given by:
| (21) |
where is the OD used in the EIT experiment, is the absorption cross section of the resonant probe transition from to . During the measurements of the data shown in Figs. 2(a) and 3(a)-3(d), the optical depth () was 70, we used the above equation to estimate that the value of was at 70. Possible processes of the population transfer from the bright to dark Rydberg states are discussed in Sec. IV.
III.3 Comparison between theoretical predictions and experimental results
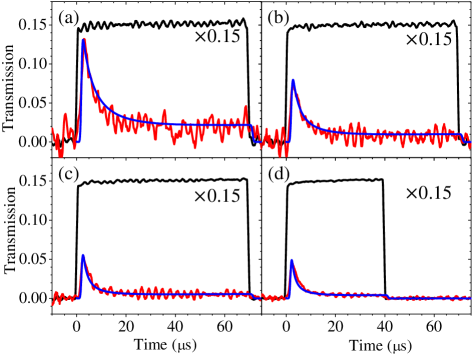
After determining the values of and in the decay rate used in Eqs. (13), (16), and (18), we next utilized the experimental data of Fig. 3 to determine the value of coefficient used in Eq. (13). Since the measured value of was the total decay rate of but not merely the decay rate from to , the determined value of might account for the discrepancy. Figure 7 shows the comparison between the experimental data of the long square probe pulses shown in Figs. 3(a)-3(d) and the theoretical predictions calculated with the modified model described in Sec. III.1. In the calculation, we used the experimentally determined values of the optical depth, the coupling Rabi frequency, and intrinsic decoherence rate in the system OurPRA2019 . We set (the DDI-induced decoherence rate per unit ) to the value given by Eq. (10), and used the values of and derived from the result of Fig. 6. The only adjustable parameter in the calculation of the predictions was (the DDI-induced decoherence rate per unit ). Note that we set = in the term of in Eq. (13), but this term played a negligible role in the calculation result of the output probe transmission. A good agreement between the theoretical predictions and experimental data was obtained at the coefficient 7.7.
A single optimum value of was able to explain all the experimental data taken at different input probe Rabi frequencies. This demonstrated the theoretical model presented by Eqs. (13)-(20) was qualitatively valid. Furthermore, we compared the experimental data of the Gaussian input probe pulses as shown in Fig. 2 with the theoretical predictions. The values of the parameters used in the calculation of the predictions were the same as those in Fig. 7 except for the value of , which had a day-to-day fluctuation of 1.5. Figures 8(a)-8(c) show that the experimental data were all in good agreement with the theoretical predictions, manifesting that the theoretical model was also quantitatively successful.
IV Discussion
We discuss some possible mechanisms of the population transfer to the dark Rydberg state in this section. Experimental observations led by the existence of the dark Rydberg state which was transferred from a bright Rydberg state have been reported in several articles Martin_2004 ; Porto_2016 ; Porto_2017 ; Hond_2020 ; Gorshkov_2020 ; PRA_SR_2007 ; NJP_SR_2021 . The underlying mechanisms of such transfers can be classified into four as follows: (i) transitions driven by a microwave field Martin_2004 , (ii) the spontaneous decay Porto_2016 ; Porto_2017 ; Hond_2020 , (iii) the DDI-induced antiblockade excitation and state-change collision assisted by radiation trapping Gorshkov_2020 ; radiationtrapping , and (iv) the superradiance of the transition with a long wavelength induced by the black-body radiation (BBR) PRA_SR_2007 ; NJP_SR_2021 . Please see Supplemental material for further discussion on these articles.
However, the mechanisms (i), (ii), and (iii) cannot explain our observations. Corresponding reasons are following. (a) No additional microwave field was applied for population transfer to another Rydberg state. (b) The spontaneous decay was a one-body process, and its rate should not depend on the Rydberg-atom density. However, the observed decay rate of the population in the bright Rydberg state depended on the Rydberg-atom density, and it is much higher than the spontaneous decay at the room temperature. (c) According to the experimental condition, we made an estimation, illustrated in the next paragraph, to show that the state-changing Rydberg collision rate state_changing_collision_PRA2015 ; PRL_stateMixing2004 ; PRL_stateMixing2008 ; PRR_stateMixing2020 is too low to be responsible for the population transfer from the bright to dark Rydberg states. Furthermore, the antiblockade excitation antiblockade_PRL2007 ; antiblockade_PRL2010 is difficult to occur in the weak-interaction regime like our experiment due to large energy defects between and nearby states.
We can rule out the mechanisms (i) and (ii) for the corresponding quite obvious reasons (a) and (b). However, before rule out the third case, we estimated the DDI induced state-exchange collision or the Rydberg state-changing collision rate compared to Ref. Gorshkov_2020 . The decay rate due to state-changing collisions is proportional to (principal quantum number)12 state_changing_collision_PRA2015 . Comparing the experimental conditions of the present study (cm-3, principal quantum number = 32) with Ref. Gorshkov_2020 (cm-3, principal quantum number = 111), the state-changing collision rate in our experiment should be on the order of 0.1 Hz based on the rate presented in Ref. Gorshkov_2020 . The estimated value is far smaller than the determined shown in Fig. 6. Therefore, the state-changing collision is not responsible for the observed two-body decay.
As a possible mechanism of the population transfer from the bright to dark Rydberg states, we considered the superradiance of transitions induced by the BBR. According to the transition or decay rate from to the nearby states induced by the BBR at K and the corresponding wavelength, we found the four most probable dark Rydberg states. Their information is listed in Table 1. To explain the measured two-body decay rate by the superradiance of the transitions induced by the BBR at the room temperature, we made the estimation the decay rate from to as an example. In Fig. 6, the decay rate at m-3 was about five times faster than the spontaneous decay rate of at the room temperature. To estimate the number of particles participating in the superradiance, i.e., the enhancement factor of the decay rate, we considered an effective range for the cooperative interaction to be 1/100 of the transition wavelength () PRA_SR_2007 ; NJP_SR_2021 . The number of Rydberg atoms inside the effective volume of was 260 according to the value of in Table 1 and m-3. Hence, the superradiance of the BBR-induced transitions can likely be the mechanism that transfers the population dark Rydberg states faster.
| State | ||||
|---|---|---|---|---|
| (KHz) | (mm) | (GHz) | (s) | |
| 22.5 | 1.9 | 158.4 | 15.0 | |
| 15.1 | 4.0 | 74.0 | 16.4 | |
| 14.8 | 1.9 | 155.4 | 34.7 | |
| 9.1 | 4.4 | 68.63 | 32.2 |
The values of and were and , respectively, indicating that the DDI strength between a bright and a dark Rydberg atoms is much larger than that between two bright Rydberg atoms. To explain this, we considered the DDI between a bright and a dark Rydberg atoms is a dipole-dipole interaction of the collision process of , where is one of the dark Rydberg state in Table 1. The collision process is resonant, because the two Rydberg atoms just exchange their quantum states. To estimate the strength of each resonant DDI process between a bright and a dark Rydberg atoms in Table 1, we followed steps similar to the estimation of described in Subsec. II.2 and Ref. OurOE2020 . The estimated value of is denoted as . The relation between and the dipolar coupling coefficient is given by
| (22) |
where is the average value of by considering the branch ratio as a weight value. The branch ratio is the ratio between the decay or excitation rates of the transitions from to . The estimated value of with of each possible dark Rydberg state was listed in Table 2.
Although the simple derivation of using Eq. (22) may cause overestimation of , a resonant dipole-dipole interaction between the bright and dark Rydberg states can provide an intuitive understanding of the behavior of the system. The resonant DDI strength arises from , and is the average value of among the Zeeman states of the same . The strength of the non-resonant DDI between two bright Rydberg atoms arises from . According to Eqs. (10) and (22), we can obtain the ratio of . Since in Table 2 is much larger than MHzm3 in the experiment, or the estimated value of is much larger than . Therefore, the experimentally-determined value of indicated the interaction between a bright and a dark Rydberg atoms is likely a resonant DDI. Lifetime of each of the four possible dark Rydberg states is also listed in Table 1. The lifetimes of and are significantly shorter than those of and . The population accumulated in the former is far less than that in the latter. Therefore, we think the dark Rydberg states of and contribute the coefficient much more than and . The decay time constant, i.e., s, of the best fit in Fig. 5 is close to the lifetimes of and in Subsec. II.5.
| State | Branch | ||||
| ratio | (MHzm3) | (MHzm3) | () | ||
| 7/2 | 0.58 | 220 | |||
| 5/2 | 0.30 | 63 | 146 | 7.9 | |
| 3/2 | 0.12 | 10.5 | |||
| 7/2 | 0.57 | 687 | |||
| 5/2 | 0.31 | 196 | 456 | 24.7 | |
| 3/2 | 0.12 | 33 | |||
| 3/2 | 1 | 206 | 206 | 11.2 | |
| 3/2 | 1 | 636 | 636 | 34.4 |
V Conclusion
In this work, we systematically studied the transmission of a probe field propagating through a Rydberg EIT system, in which the DDI strength was in the weak interaction regime. We observed the distorted output of a long Gaussian input probe pulse. Such a phenomenon was unable to be predicted by the theoretical model, which only considered the DDI between the bright Rydberg atoms. According to the further measurements, we explained that the distortion was due to the extra attenuation. This phenomenon was caused by a much larger DDI-induced decoherence rate due to the atoms accumulating in the dark Rydberg states. The population in the dark Rydberg states was transferred from the bright Rydberg state in an unexpected high rate. We attribute the high transfer rate to the superradiance of transitions induced by the black-body radiation. Using a theoretical model to take into account the effect that population accumulates in some dark Rydberg states and the dark Rydberg atoms cause an extra DDI-induced decoherence rate, we can successfully explain the experimental data.
In conclusion, this study provided a better understanding for the creation of dark Rydberg atoms and their influence to Rydberg polaritons in the Rydberg-EIT system under a long interaction time SLP_Lukin ; SPL_2009 ; SLP_review and we believe the effect is universal. This work also points out an obstacle in the realization of the BEC with weakly-interacting Rydberg polaritons DSP_BEC_Fleischhauer2008 ; OurCommunPhys2021 .
Acknowledgements
We thank the Referees for their comments which stimulate the discussions in Sec. IV. This work was supported by Grant Nos. 109-2639-M-007-001-ASP and 110-2639-M-007-001-ASP of the Ministry of Science and Technology, Taiwan.
References
- (1) M. D. Lukin, M. Fleischhauer, R. Cote, L. M. Duan, D. Jaksch, J. I. Cirac, and P. Zoller, Dipole Blockade and Quantum Information Processing in Mesoscopic Atomic Ensembles, Phys. Rev. Lett. 87, 037901 (2001).
- (2) D. Comparat, and P. Pillet, Dipole blockade in a cold Rydberg atomic sample, J. Opt. Soc. Am. B 27, A208 (2010).
- (3) M. Saffman, T. G. Walker, and K. Mølmer, Quantum information with Rydberg atoms, Rev. Mod. Phys. 82, 2313 (2010).
- (4) T. Baluktsian, B. Huber, R. Löw, and T. Pfau, Evidence for Strong van der Waals Type Rydberg-Rydberg Interaction in a Thermal Vapor, Phys. Rev. Lett. 110, 123001 (2013).
- (5) D. Tiarks, S. Schmidt-Eberle, T. Stolz, G. Rempe, and S. Dürr, A photon–photon quantum gate based on Rydberg interactions, Nature Phys. 15, 124 (2019).
- (6) H. Gorniaczyk, C. Tresp, J. Schmidt, H. Fedder, and S. Hofferberth, Single-Photon Transistor Mediated by Interstate Rydberg Interactions, Phys. Rev. Lett. 113, 053601 (2014).
- (7) D. Tiarks, S. Baur, K. Schneider, S. Dürr, and G. Rempe, Single-Photon Transistor Using a Förster Resonance, Phys. Rev. Lett. 113, 053602 (2014).
- (8) S. Baur, D. Tiarks, G. Rempe, and S. Dürr, Single-Photon Switch Based on Rydberg Blockade, Phys. Rev. Lett. 112, 073901 (2014).
- (9) J. D. Pritchard, D. Maxwell, A. Gauguet, K. J. Weatherill, M. P. A. Jones, and C. S. Adams, Cooperative Atom-Light Interaction in a Blockaded Rydberg Ensemble, Phys. Rev. Lett. 105, 193603 (2010).
- (10) D. Petrosyan, J. Otterbach, and M. Fleischhauer, Electromagnetically Induced Transparency with Rydberg Atoms, Phys. Rev. Lett. 107, 213601 (2011).
- (11) T. Peyronel, O. Firstenberg, Q.-Y. Liang, S. Hofferberth, A. V. Gorshkov, T. Pohl, M. D. Lukin, and V. Vuletić, Quantum nonlinear optics with single photons enabled by strongly interacting atoms, Nature 488, 57 (2012).
- (12) E. Zeuthen, M. J. Gullans, M. F. Maghrebi, and A. V. Gorshkov, Correlated Photon Dynamics in Dissipative Rydberg Media, Phys. Rev. Lett. 119, 043602 (2017).
- (13) D. Jaksch, J. I. Cirac, P. Zoller, S. L. Rolston, R. Côté, and M. D. Lukin, Fast Quantum Gates for Neutral Atoms, Phys. Rev. Lett. 85, 2208 (2000).
- (14) D. S. Weiss, and M. Saffman, Quantum computing with neutral atoms, Physics Today 70, 44 (2017).
- (15) H. Levine, A. Keesling, G. Semeghini, A. Omran, T. T. Wang, S. Ebadi, H. Bernien, M. Greiner, V. Vuletić, H. Pichler, and M. D. Lukin, Parallel Implementation of High-Fidelity Multiqubit Gates with Neutral Atoms, Phys. Rev. Lett. 123, 170503 (2019).
- (16) Y. O. Dudin and A. Kuzmich, Strongly Interacting Rydberg Excitations of a Cold Atomic Gas, Science 336, 887 (2012).
- (17) F. Ripka, H. Kübler, R. Löw, and T. Pfau, A room-temperature single-photon source based on strongly interacting Rydberg atoms, Science 362, 446 (2018).
- (18) D. P. Ornelas-Huerta, A. N. Craddock, E. A. Goldschmidt, A. J. Hachtel, Y. Wang, P. Bienias, A. V. Gorshkov, S. L. Rolston, and J. V. Porto, On-demand indistinguishable single photons from an efficient and pure source based on a Rydberg ensemble, Optica 7, 813 (2020).
- (19) P. Schauß, M. Cheneau, M. Endres, T. Fukuhara, S. Hild, A. Omran, T. Pohl, C. Gross, S. Kuhr, and I. Bloch, Observation of spatially ordered structures in a two-dimensional Rydberg gas, Nature 491, 87 (2012).
- (20) Y.-Y. Jau, A. M. Hankin, T. Keating, I. H. Deutsch, and G. W. Biedermann, Entangling atomic spins with a Rydberg-dressed spin-flip blockade, Nature Phys. 12, 71 (2016).
- (21) J. Zeiher, R. van Bijnen, P. Schauß, S. Hild, J.-y. Choi, T. Pohl, I. Bloch, and C. Gross, Many-body interferometry of a Rydberg-dressed spin lattice, Nature Phys. 12, 1095 (2016).
- (22) H. Labuhn, D. Barredo, S. Ravets, S. de Léséleuc, T. Macrì, T. Lahaye, and A. Browaeys, Tunable two-dimensional arrays of single Rydberg atoms for realizing quantum Ising models, Nature 534, 667 (2016).
- (23) A. Omran, H. Levine, A. Keesling, G. Semeghini, T. T. Wang, S. Ebadi, H. Bernien, A. S. Zibrov, H. Pichler, S. Choi, J. Cui, M. Rossignolo, P. Rembold, S. Montangero, T. Calarco, M. Endres, M. Greiner, V. Vuletić, and M. D. Lukin, Generation and manipulation of Schrödinger cat states in Rydberg atom arrays, Science 365, 570 (2019).
- (24) V. Borish, O. Marković, J. A. Hines, S. V. Rajagopal, and M. Schleier-Smith, Transverse-Field Ising Dynamics in a Rydberg-Dressed Atomic Gas, Phys. Rev. Lett. 124, 063601 (2020).
- (25) D. Bluvstein, A. Omran, H. Levine, A. Keesling, G. Semeghini, S. Ebadi, T. T. Wang, A. A. Michailidis, N. Maskara, W. W. Ho, S. Choi, M. Serbyn, M. Greiner, V. Vuletić, and M. D. Lukin, Controlling quantum many-body dynamics in driven Rydberg atom arrays, Science 371, 1355 (2021).
- (26) H. Bernien, S. Schwartz, A. Keesling, H. Levine, A. Omran, H. Pichler, S. Choi, A. S. Zibrov, M. Endres, M. Greiner, V. Vuletić, and M. D. Lukin, Probing many-body dynamics on a 51-atom quantum simulator, Nature 551, 579 (2017).
- (27) S.-S. Hsiao, K.-T. Chen, and I. A. Yu, Mean field theory of weakly-interacting Rydberg polaritons in the EIT system based on the nearest-neighbor distribution, Opt. Express 28, 28414 (2020).
- (28) B. Kim, K.-T. Chen, S.-S. Hsiao, S.-Y. Wang, K.-B. Li, J. Ruseckas, G. Juzeliūnas, T. Kirova, M. Auzinsh, Y.-C. Chen, Y.-F. Chen, and I. A. Yu, A weakly-interacting many-body system of Rydberg polaritons based on electromagnetically induced transparency, Commun. Phys. 4, 101 (2021).
- (29) M. Fleischhauer, A. Imamoglu, and J. P. Marangos, Electromagnetically induced transparency: Optics in coherent media, Rev. Mod. Phys. 77, 633 (2005).
- (30) Y.-W. Lin, H.-C. Chou, P. P. Dwivedi, Y.-C. Chen, and I. A. Yu, Using a pair of rectangular coils in the MOT for the production of cold atom clouds with large optical density, Opt. Express 16, 3753 (2008).
- (31) B. Kim, K.-T. Chen, C.-Y. Hsu, S.-S. Hsiao, Y.-C. Tseng, C.-Y. Lee, S.-L. Liang, Y.-H. Lai, J. Ruseckas, G. Juzeliūnas, and I. A. Yu, Effect of laser-frequency fluctuation on the decay rate of Rydberg coherence, Phys. Rev. A 100, 013815 (2019).
- (32) M.-J. Lee, J. Ruseckas, C.-Y. Lee, V. Kudriašov, K.-F. Chang, H.-W. Cho, G. Juzeliūnas, and I. A. Yu, Experimental demonstration of spinor slow light, Nat. Comm. 5, 5542 (2014).
- (33) I. I. Beterov, I. I. Ryabtsev, D. B. Tretyakov, and V. M. Entin, Quasiclassical calculations of blackbody-radiation-induced depopulation rates and effective lifetimes of Rydberg , , and alkali-metal atoms with , Phys. Rev. A 79, 052504 (2009); Erratum, Phys. Rev. A 80, 059902(E) (2009).
- (34) D. A. Steck, Rubidium 87 D Line Data, available online at http://steck.us/alkalidata (Version 2.2.2, last revised 9 July 2021).
- (35) T. G. Walker and M. Saffman, Consequences of Zeeman degeneracy for the van der Waals blockade between Rydberg atoms, Phys. Rev. A 77, 032723 (2008).
- (36) K. Afrousheh, P. Bohlouli-Zanjani, D. Vagale, A. Mugford, M. Fedorov, and J. D. D. Martin, Spectroscopic Observation of Resonant Electric Dipole-Dipole Interactions between Cold Rydberg Atoms, Phys. Rev. Lett. 93, 233001 (2004).
- (37) E. A. Goldschmidt, T. Boulier, R. C. Brown, S. B. Koller, J. T. Young, A. V. Gorshkov, S. L. Rolston, and J. V. Porto, Anomalous Broadening in Driven Dissipative Rydberg System, Phys. Rev. Lett. 116, 113001 (2016).
- (38) T. Boulier, E. Magnan, C. Bracamontes, J. Maslek, E. A. Goldschmidt, J. T. Young, A. V. Gorshkov, S. L. Rolston, and J. V. Porto, Spontaneous avalanche dephasing in large Rydberg ensembles, Phys. Rev. A 96, 053409 (2017).
- (39) J. de Hond, N. Cisternas, R. J. C. Spreeuw, H. B. van Linden van den Heuvell, and N. J. van Druten, Interplay between van der Waals and dipole-dipole interactions among Rydberg atoms, J. Phys. B: At. Mol. Opt. Phys. 53, 084007 (2020).
- (40) P. Bienias, J. Douglas, A. Paris-Mandoki, P. Titum, I Mirgorodskiy, C. Tresp, E. Zeuthen, M. J. Gullans, M. Manzoni, S. Hofferberth, D. Chang, and A. V. Gorshkov, Photon propagation through dissipative Rydberg media at large input rates, Phys. Rev. Research 2, 033049 (2020).
- (41) T. Wang, S. F. Yelin, R. Côté, E. E. Eyler, S. M. Farooqi, P. L. Gould, M. Koštrun, D. Tong, and D. Vrinceanu, Superradiance in ultracold Rydberg gases, Phys. Rev. A 75, 033802 (2007).
- (42) L. Hao, Z. Bai, J. Bai, S. Bai, Y. Jiao, G. Huang, J. Zhao, W. Li, and S. Jia, Observation of blackbody radiation enhanced superradiance in ultracold Rydberg gases, New J. Phys. 23, 083017 (2021).
- (43) D. P. Sadler, E. M. Bridge, D. Boddy, A. D. Bounds, N. C. Keegan, G. Lochead, M. P. A. Jones, and B. Olmos, Radiation trapping in a dense cold Rydberg gas, Phys. Rev. A 95, 013839 (2017).
- (44) A. Derevianko, P. Kómár, T. Topcu, R. M. Kroeze, and M. D. Lukin, Effects of molecular resonances on Rydberg blockade, Phys. Rev. A 92, 063419 (2015).
- (45) T. J. Carroll, K. Claringbould, A. Goodsell, M. J. Lim, and M. W. Noel, Angular Dependence of the Dipole-Dipole Interaction in a Nearly One-Dimensional Sample of Rydberg Atoms, Phys. Rev. Lett. 93, 153001 (2004).
- (46) A. Reinhard, T. Cubel Liebisch, K. C. Younge, P. R. Berman, and G. Raithel, Rydberg-Rydberg Collisions: Resonant Enhancement of State Mixing and Penning Ionization, Phys. Rev. Lett. 100, 123007 (2008).
- (47) M. Eder, A. Lesak, A. Plone, T. Yoda, M. Highman, and A. Reinhard, Quantifying the impact of state mixing on the Rydberg excitation blockade, Phys. Rev. Research 2, 023234 (2020).
- (48) C. Ates, T. Pohl, T. Pattard, and J. M. Rost, Antiblockade in Rydberg Excitation of an Ultracold Lattice Gas, Phys. Rev. Lett. 98, 023002 (2007).
- (49) T. Amthor, C. Giese, C. S. Hofmann, and M. Weidemüller, Evidence of Antiblockade in an Ultracold Rydberg Gas, Phys. Rev. Lett. 104, 013001 (2010).
- (50) N. Šibalić, J. D. Pritchard, C. S. Adams, and K. J. Weatherill, ARC: An open-source library for calculating properties of alkali Rydberg atoms, Comput. Phys. Commun. 220, 319 (2017).
- (51) A. André, M. Bajcsy, A. S. Zibrov, and M. D. Lukin, Nonlinear Optics with Stationary Pulses of Light, Phys. Rev. Lett. 94, 063902 (2005).
- (52) Y.-W. Lin, W.-T. Liao, T. Peters, H.-C. Chou, J.-S. Wang, H.-W. Cho, P.-C. Kuan, and I. A. Yu, Stationary Light Pulses in Cold Atomic Media and without Bragg Gratings, Phys. Rev. Lett. 102, 213601 (2009).
- (53) J. L. Everett, D. B. Higginbottom, G. T. Campbell, P. K. Lam, and B. C. Buchler, Stationary Light in Atomic Media, Adv. Quantum Technol. 2, 1800100 (2019).
- (54) M. Fleischhauer, J. Otterbach, and R. G. Unanyan, Bose-Einstein Condensation of Stationary-Light Polaritons, Phys. Rev. Lett. 101, 163601 (2008).