Adsorption and dissociation of diatomic molecules in monolayer -MoSe2
Abstract
Two dimensional transition metal dichalcogenides appear as good candidates for gas sensing and catalysis. Here, by means of density functional theory, we characterize the adsorption and dissociation of selected diatomic molecules (CO, H2, O2, and NO) on the MoSe2 monolayer. We consider that these processes occur on the pristine -MoSe2 monolayer and in the vicinity of an isolated Se vacancy. The presence of a single Se vacancy both enhances the molecular adsorption and reduces the energy needed for dissociation, making it energetically favorable for the case of O2 and NO molecules. Moreover, the presence of a second Se vacancy makes the dissociation process energetically favorable for all the molecules that are studied here. For each case we evaluate the effect that each adsorbate has on the electronic structure of the MoSe2 monolayer and the charge transfer that takes place between the adsorbate and the surface. Remarkably, adsorption of either CO or NO at the Se vacancy induces a finite spin-magnetization in the system that is spatially well localized around the adsorbate and the three closest Mo atoms.
I Introduction
Atomically thin nano-structures have attracted much attention both from academia and industry since the discovery of graphene in 2004 Novoselov et al. (2004). However, the zero band-gap that graphene exhibits has emerged as its main drawback for practical applications Liu et al. (2013) due to the large leakage currents. Nonetheless, the advantages that two-dimensional (2D) materials offer, such as large surface to volume ratio and good implementation with metal electrodes Tyagi et al. (2020), has boosted the research in other families of 2D materials.
Transition Metal Dichalcogenides (TMDs) appear in nature in a bulk, layered structure. Each layer is bounded to the others by weak van der Waals interactions and it is composed of planes of transition metal atoms (M) sandwiched between two layers of chalcogen ones (XS, Se, and Te). This allows to exfoliate them into single and few layered nano-structures. In addition to the different chemical compositions in which they appear (MX2), TMDs present different phases depending on the coordination between the metal and the chalcogen atoms (trigonal prismatic, octahedral, and distorted octahedral). Besides that, they are very versatile as their electrical properties can be tuned by, for example, application of strain Muoi et al. (2019), application of an external electric field Ai et al. (2019), and creation of vacancies dos Santos et al. (2021); Liang et al. (2021).
Group V TMDs (i.e., MX2 with MNb, Ta) are metallic and can exhibit superconductivity at low temperatures Revolinsky et al. (1965); Lian et al. (2018). Whereas TMDs with the transition metal pertaining to group VI (MMo and W Duan et al. (2015)) have a small band-gap, that allows to overcome the zero band-gap problem present in graphene nano-sheets. Contrary to what happens to their metallic counterparts, semiconductor TMDs are stable at room temperature with no need of embedding them in a inert atmosphere Tyagi et al. (2020). Additionally, their band-gap is located in the near infra-red and visible radiation range, which suggests their appropriateness for solar cells fabrication Tongay et al. (2012).
Among their possible applications TMD semiconductors have emerged as a good test-bed where to study valleytronic physics by taking advantage of the broken inversion symmetry that appears between the and valleys in the monolayer limit (see, for example Refs. Jin et al. (2018); Li et al. (2019)). Employing circularly polarized light and magnetic fields it is possible to engineer spin-selective excitations. This has been both theoretically studied Yao et al. (2008); Xiao et al. (2012); Ulstrup et al. (2017); Xuan and Quek (2020) and experimentally proved Wang et al. (2015); Kumar et al. (2014); Lyons et al. (2019) (Also for few layered nano-structures, see for example Refs. Gong et al. (2013); Wu et al. (2013); Arora et al. (2018); Zhao et al. (2021)).
A lot of attention has been paid to the possibility of using TMD semiconductors as gas sensors (see Liu et al. (2017); Ping et al. (2017); Zeng et al. (2018); Vargas-Bernal (2019); Tyagi et al. (2020), for reviews on this topic), although up to now most of the research in this direction has been focused in MoS2 and WS2 nano-sheets (see Donarelli and Ottaviano (2018) for a comparative review of these two materials with graphene oxide). As an example, MoS2 has been reported as a highly sensitive, selective, charge transfer detector for NO, NO2 and NH3 Li et al. (2014a); Cho et al. (2015). Notably, some efforts have been dedicated to the possibility of fabricating wearable sensors, taking advantage of the mechanical robustness and flexibility that TMDs offer Kumar et al. (2020). Also from the theoretical point of view, some efforts have been committed to characterize the adsorption of light atoms Ma et al. (2011) and molecules Nagarajan and Chandiramouli (2018); Ai et al. (2019); Zhao et al. (2014); Babar et al. (2019) on MoS2, MoSe2 and WS2 monolayers by means of density functional theory (DFT). Similarly, molecular adsorption has been considered in Janus WSSe, MoSSe, and WSTe monolayers Chaurasiya and Dixit (2019, 2020); Dou et al. (2021).
Regarding the employment of monolayer MoSe2 for gas sensing, some proposals have also appeared in the bibliography. For example the possibility of using it as a NH3 detector was investigated in Refs. Late et al. (2014); Zhang et al. (2017); Guo et al. (2019) (see also Ren et al. (2019a) for CH4 detection). Interestingly, it has been shown that the size of the MoSe2 nano-sheets affects the balance between the response and recovery towards gas adsorption Zhang et al. (2017). Besides the 2D geometry in which we focus here, other proposals appear in the bibliography such as the nano-flower CO detector that is characterized in Ref. Yang et al. (2020).
In order to improve the gas sensing performance of TMDs, different strategies have been explored. Vacancy engineering has came out as a promising research route, as it enhances the chemical activity of the surface (see Koós et al. (2019); Liang et al. (2021) for a review on this topic). Alternatively, replacing a proportion of chalcogen atoms with Ge or Sb has been demonstrated to improve the adsorption of Nitrogen containing gases Panigrahi et al. (2019). A similar approach, consists in doping TMDs monolayer with additional transition metal impurities. In general, the doping of the material with a metallic impurity reduces the gap giving small metallic character to the whole system, thus enhancing its conductivity, which is relevant for sensing purposes. Among other proposals Choi et al. (2017); Liu et al. (2021); Ni et al. (2020); Ren et al. (2019b); Guo et al. (2021), in Ref. Aguilar et al. (2020) the CO activation on the MoS2 monolayer has been studied for different metallic doping and in Ref. Zhang et al. (2019) the adsorption of H2 and C2H2 molecules has been characterized in a Rhodium doped MoSe2 sheet. Alternatively, doping with pnictogens group atoms (N, P, As) has demonstrated to enhance the adsorption energies in WSSe Janus monolayers Abbas et al. (2018); Pal Kaur et al. (2021).
The usage of TMDs as catalytic surfaces is also an active research field. On one hand, it has been studied how the presence of vacancies and metallic doping on a MoSe2 nano-sheet enhances the Hydrogen evolution reaction activity Shu et al. (2017); Lee et al. (2018); Shu et al. (2017); Jain et al. (2020). On the other, the Oxygen evolution reaction has been studied in MoS2 focusing on the pristine surface German and Gebauer (2020), on its edges Karmodak and Andreussi (2021), and also considering a reduced geometry (dots) Mohanty et al. (2018). Similarly, the MoSe2 and MoS2 monolayers have been proposed as platforms for N2 and CO2 reduction (see Giuffredi et al. (2021) for a review). In particular, it has been revealed that the efficiency is improved at the edges of the nano-sheets Chan et al. (2014) and in the presence of chalcogen vacancies or metallic doping Kang et al. (2019); Ye et al. (2021).
In this work, we study the adsorption and dissociation of common diatomic molecules (H2, O2, CO, and NO) on the less studied MoSe2 monolayer, placing special emphasis on how each of these possible adsorbates affects the electronic and magnetic properties of the MoSe2 substrate. Inspired by the above mentioned works, we explicitly compare the case in which the MoSe2 surface is perfectly formed (pristine case) with the one in which a Se vacancy is present on the MoSe2 monolayer (MoSe2-vSe). As a previous step for the calculation of dissociation, we evaluate the most energetically favorable adsorption position across the surface for each molecule and also for its atomic components. The paper is organized as follows: In section II we give the details about the DFT calculations that we perform. Then, in section III we comment our results. After that, we evaluate the dissociation energy for each of the diatomic molecules on the MoSe2 monolayer. The possible effect that spin-orbit coupling (SOC) may induce in the adsorption and dissociation energies that we report is investigated in Appendix C. Finally, we summarize our conclusions in section IV.
II Method
II.1 DFT calculations
The DFT calculations presented here are performed with the Vienna ab initio simulation package (vasp) Kresse and Furthmüller (1996). Two different approaches are used to incorporate the van der Waals (vdW) interaction in the electron exchange-correlation: the revPBE-vdW functional introduced by Dion et al. Dion et al. (2004) that self-consistently incorporates non-local correlation corrections and the PBE-D3 method Grimme et al. (2010) that also includes the vdW correction but in a non self-consistent manner. In the latter, the exchange-correlation interaction of electrons is described by the generalized gradient approximation (GGA) in the form of Perdew-Burke-Ernzerhof (PBE) Perdew et al. (1996) and using the Becke-Johnson (BJ) damping Grimme et al. (2011) to avoid strong repulsion at short distances. The ionic cores are described with the projector augmented wave (PAW) method Blöchl (1994) implemented in vasp Kresse and Joubert (1999). Specifically, we use the PAW potentials with 14, six, six, five, four, and one valence electrons for Mo, Se, O, N, C,and H, respectively. The Kohn-Sham states are expanded in a plane-wave basis set using as energy cutoffs: 700 eV for the systems containing C, O, and N; and 500 eV for those involving H only and for the bare monolayer. The Brillouin zone integration is performed with (cell-size adapted, see below) -centered Monkhorst–Pack (MP) grids of special -points Monkhorst and Pack (1976), using a Gaussian smearing of 0.1 eV for electronic state occupancies. In all the calculations, 10-6 and 10-5 eV are the energy converge criteria for the electronic and structural optimization, respectively. During the structural optimization all the atoms in the simulation cell are allowed to move.
The MoSe2 monolayer is considered to be in the phase. As a first step, the MoSe2 hexagonal lattice constant is calculated in the monolayer primitive cell with 23 Å of vacuum along the surface normal and using a 11111 -centered MP mesh of special -points. The values obtained with revPBE-vdW and PBE-D3 are =3.386 and 3.282 Å, respectively. See appendix A for more details. A larger 44 surface supercell together with a 441 MP grid are used to study adsorption of the different gas species on pristine MoSe2 and on MoSe2 MoSe2-vSe. This larger supercell avoids lateral interactions of the adsorbate with its images and also ensures a reliable description of an isolated Se vacancy in the MoSe2-vSe surface. (See Appendix A for more details about MoSe2 and MoSe2-vSe characterization).
When needed for the discussion, the band structure and density of states (DOS) are split into atomic components. This is done in vasp by projecting onto atomic localized orbitals Amadon et al. (2008); Karolak et al. (2011); Schüler et al. (2018). For each pair of -point and -band index, it projects the Kohn-Sham wave function onto spherical harmonics centered at each ion position , such as:
| (1) |
All the structural and electron density figures were plotted with the vesta software Momma and Izumi (2011), whereas the PyMatgen package Ong et al. (2013) was used for the band structure and DOS plots. For simplicity, only the PBE-D3 optimized structures, band structures, DOS, and charge density plots will be shown.
II.2 Adsorption and dissociation of diatomic molecules
Following previous works Ma et al. (2011), we explore different possible adsorption positions across the surface. In particular, the considered adsorption sites on pristine MoSe2 are: atop a Se atom (), atop a Mo atom (), on the hollow site (), midway the Mo-Se bond (), and midway the and sites (). On the MoSe2-vSe surface, for simplicity, we only consider adsorption at the vacancy position (). After all this preliminary assay, in Sec. III only the results of the most energetically favorable configuration will be discussed. In addition to the structural relaxation, the stability of each adsorption configuration is further confirmed by performing a vibrational mode analysis of the corresponding adsorbate, which is based on a finite-difference calculation of the Hessian matrix.
The adsorption energy of a molecule (or atom) on the TMD surface (MoSe2 or MoSe2-vSe) is calculated as,
| (2) |
where is the energy of the relaxed system composed by adsorbed on the monolayer, while and are the energies of the (optimized) isolated adsorbate and corresponding TMD monolayer, respectively.
The dissociation energy of a diatomic molecule on the surface is also calculated with Eq. (2), where is now the energy of the two atoms adsorbed at separate positions on the surface. For completeness, we also calculate the dissociation energy in the limiting case in which the two atoms are separated by an infinite distance as,
| (3) |
where and are the adsorption energy of each atom forming the molecule and is the dissociation energy in gas-phase. The latter is obviously calculated as the energy difference between the isolated atoms and the isolated (optimized) molecule []. As atomic adsorption positions for the dissociation process, we will typically consider the most stable adsorption sites that are obtained from our preliminary adsorption study for each of the relevant atomic species (H, O, C, and N).
To characterize the molecular adsorption configuration we also compute the molecular bond length at the adsorption position d(A-B), the height of the molecule geometrical center from the surface (defined as the average heights of the Se atoms in the topmost layer), and the polar and azimuthal angles, and , defining the molecular axis orientation respect to the surface normal and the lattice vector . Only d(A-B) and the height of each atom (, ) are provided for the dissociated configurations.
The analysis of the charge distribution between the adsorbate and the surface provides a deeper insight into the adsorption process. To this purpose we evaluate, depending on the system, the following charge quantities: (i) The Bader charge transfer,
| (4) |
where is the Bader electron charge calculated with the implementation by Tang et al. Tang et al. (2009) and Henkelman et al. Henkelman et al. (2006) and the adsorbate total atomic number (i.e., for the diatomic molecules); (ii) The induced electron density,
| (5) |
where is the electron density distribution when is adsorbed on MoSe2 (or MoSe2-vSe), whereas and are those of the isolated adsorbate and corresponding surface, respectively, which are calculated keeping the optimized adsorption structure in both cases; and in the case of those systems that have a finite spin magnetic moment, (iii) the spin-magnetization density,
| (6) |
with , the local electron density for the spin majority and minority components, respectively.
III Results
III.1 H2 adsorption and dissociation
| revPBE-vdW | |||||||
|---|---|---|---|---|---|---|---|
| (eV) | 0.053 | 0.067 | 0.063 | 0.057 | 0.059 | 0.181 | |
| d(H-H)(Å) | 0.739 | 0.739 | 0.740 | 0.740 | 0.740 | 1.868 | |
| (Å) | 3.75 | 3.09 | 3.48 | 3.38 | 3.49 | 0.54 | |
| 90∘ | 90∘ | 90∘ | 90∘ | 84∘ | 82∘ | ||
| 0∘ | 0∘ | 0∘ | 60∘ | 5∘ | 30∘ | ||
| () | 0 | 0 | 0 | 0 | 0 | 0 | |
| PBE-D3 | |||||||
| (eV) | 0.031 | 0.049 | 0.043 | 0.049 | 0.047 | 0.539 | |
| d(H-H)(Å) | 0.750 | 0.751 | 0.750 | 0.751 | 0.751 | 1.774 | |
| (Å) | 3.20 | 2.90 | 2.96 | 3.17 | 3.13 | 0.58 | |
| 90∘ | 90∘ | 88∘ | 90∘ | 71∘ | 84∘ | ||
| 0∘ | 0∘ | 7∘ | 60∘ | 22∘ | 31∘ | ||
| () | 0 | 0 | 0 | 0 | 0 | 0 | |
The experimental H2(gas) bond length of 0.741 Å NIS is correctly reproduced by both revPBE-vdW (0.739 Å) and PBE-D3 (0.750 Å). Regarding the H2(gas) dissociation energy, revPBE-vdW overestimates it by about 0.300 eV, while PBE-D3 provides a value of 4.539 eV that is in reasonable agreement with the experimental values =4.746 and 4.787 eV. Note that, to compare it to our DFT data, the latter values are respectively obtained by adding the H2(gas) zero point energy (ZPE) of 269 meV Irikura (2007) to the experimental dissociation energy of 4.477 eV Darwent (1970) and 4.518 eV Benson (1965).
Our results for adsorption of one H2 molecule at different sites on the pristine MoSe2 surface and at the Se vacancy are summarized in Table 1. Each optimization started with the molecule oriented parallel to the surface (=90∘). The structural relaxation calculations suggest that H2 can adsorb in any of the five sites that were considered in the pristine MoSe2 layer, being the most energetically favorable site (although and are energetically degenerated in the case of PBE-D3). The small adsorption energy of about 50–70 meV agrees with the results from the normal mode analysis at the configuration showing that the H2 molecule is weakly bounded in the perpendicular direction to the surface ( 20 meV), and actually free to move parallel to the surface and to rotate around the surface normal direction.
Regarding the structural properties, both functionals provide similar results, remaining the H2 bond length practically unaltered when compared to its gas phase value. However, the revPBE-vdW predictions for the H2 height from the surface are always between 0.2 and 0.6 Å larger than the PBE-D3 ones.
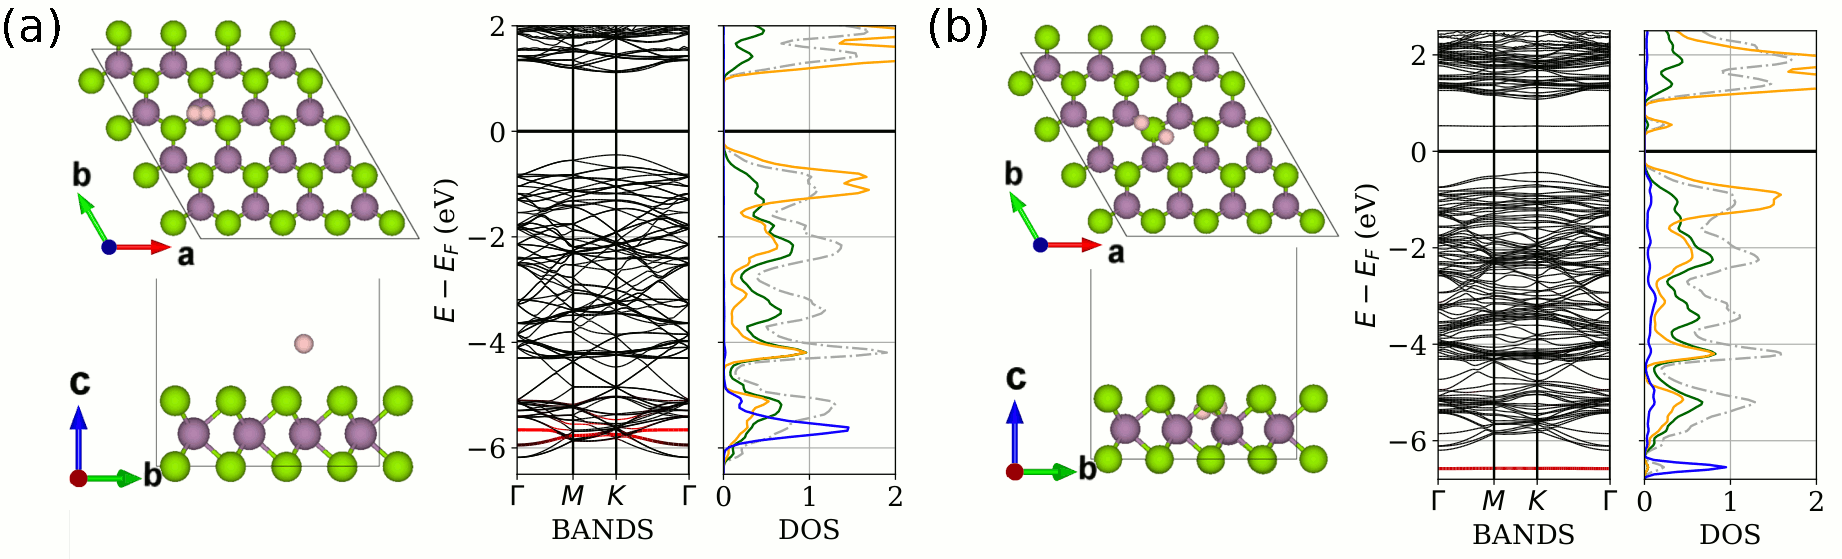
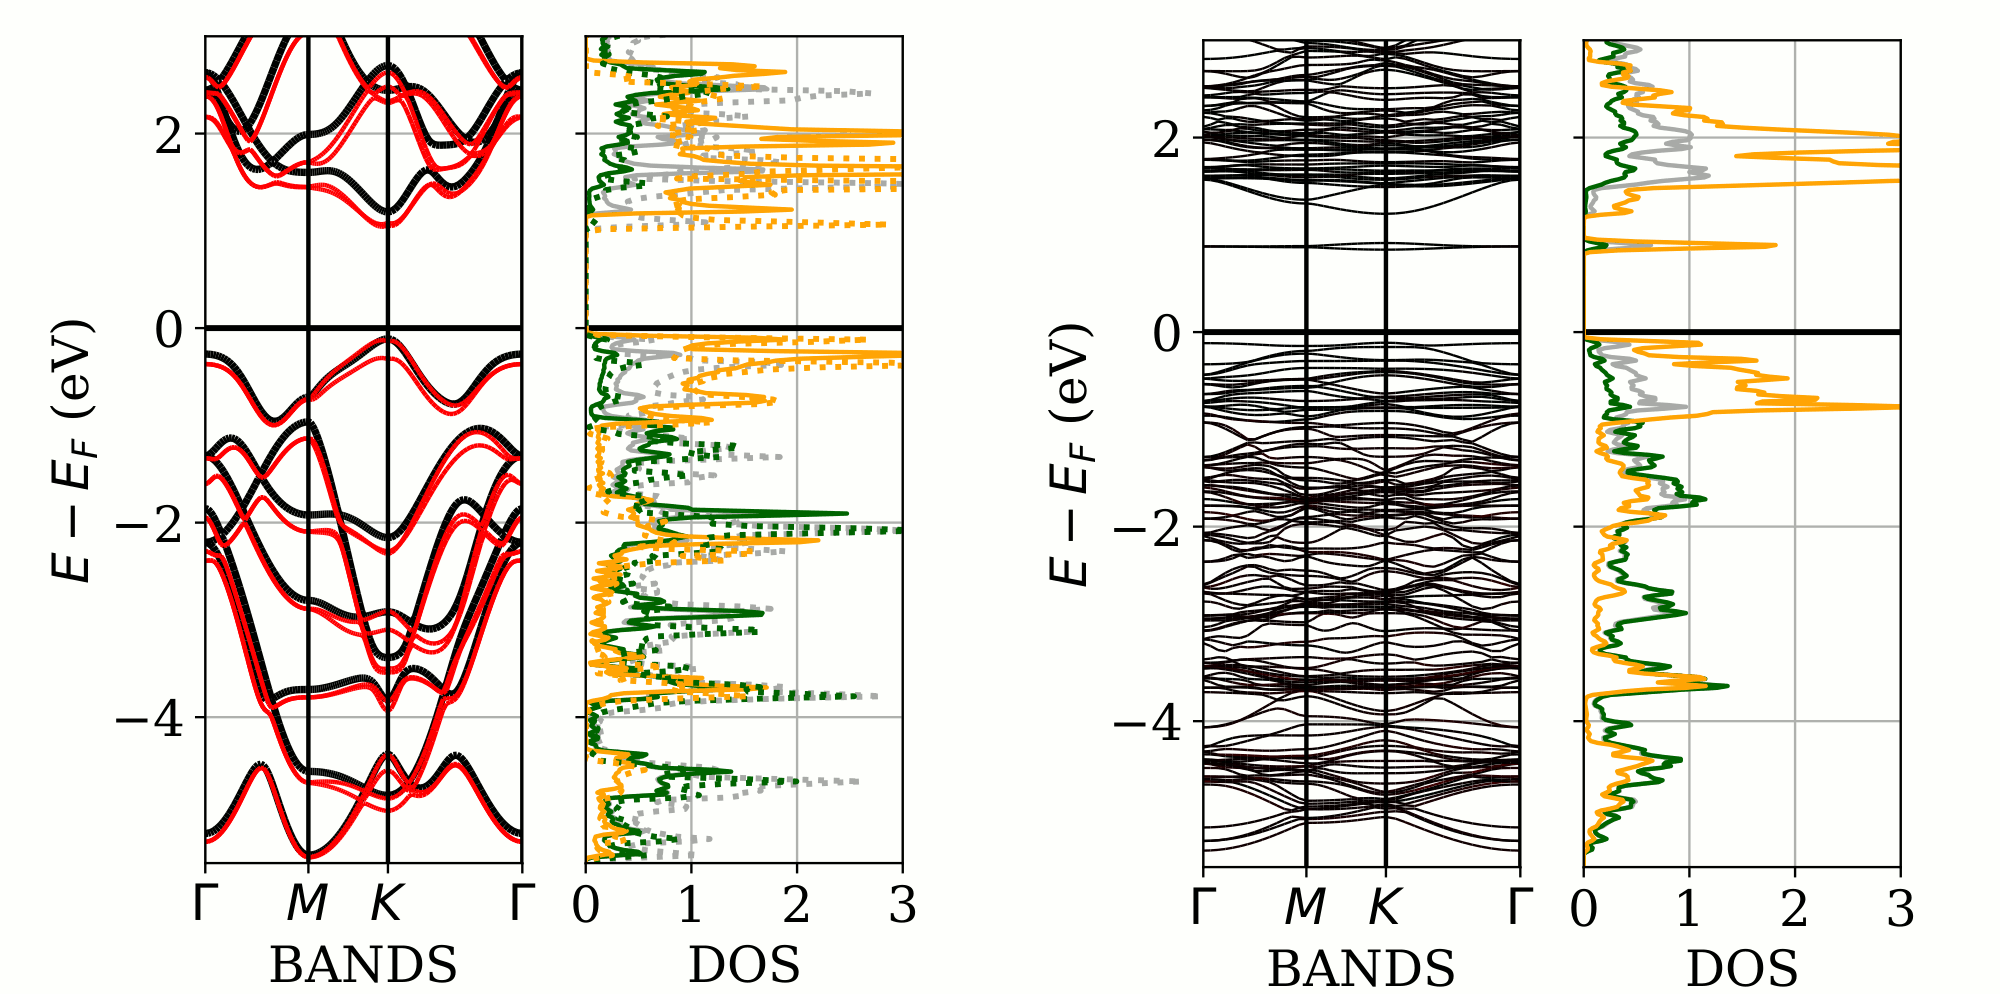
Figure 1(a) shows the geometrical structure, band structure, and DOS for the energetically favored configuration. As observed in the H-projected band structure (red bands) and DOS (blue curve), the H2-dominated -like orbitals lie around 5.5 eV below the Fermi level and are rather localized in energy. The broadening of about 500 meV suggests a weak interaction with the MoSe2 layer in line with the small value and vibrational modes. In this respect, the Bader charge analysis reveals that the charge transfer is almost negligible (=0.006 e) and, hence, it confirms that H2 is physisorbed. For comparison, using the Local Density Approximation, the adsorption energy for H2 adsorbed on the pristine WS2 surface is 75 meV Zhou et al. (2015).
| revPBE-vdW | PBE-D3 | ||||
|---|---|---|---|---|---|
| (eV) | 3.652 | 1.560 | 3.378 | 1.256 | |
| (eV) | 3.657 | 1.626 | 3.368 | 1.284 | |
| d(H-H)(Å) | 3.41 | 2.84 | 3.28 | 2.94 | |
| (Å) | 1.33, 1.33 | 0.87, 1.26 | 1.15, 1.15 | 0.82, 1.15 | |
| () | 2 | 2 | 2 | 2 | |
On the contrary, when H2 adsorbs at the Se vacancy in MoSe2-vSe, strong bonds are formed. The adsorption energy in this case is significantly enhanced, being its revPBE-vdW (PBE-D3) value =0.181 (0.539) eV. Even if the discrepancy in the adsorption energy between the two functionals is considerable, the adsorption geometry is in both cases very similar (cf. last column in Table 1). At the revPBE-vdW (PBE-D3) adsorption position, the H2 geometrical center is 0.54 (0.58) Å below the average MoSe2-vSe surface. Remarkably, the distance between the two H atoms comes out to be as large as 1.85 (1.77) Å. This is more than twice the value of the gas-phase H2 bond length [see the TvSe configuration depicted in Fig. 1(b)]. In this case, the H2 molecule is not parallel to the surface but slightly tilted from the surface plane, with its axis pointing to the closest Mo atom. A normal mode analysis reveals that the H2 is well located at the reported position, being the energy of the lowest mode 65 meV. The stretch in the H-H bond length that we find here is in agreement with the one obtained with the PBE-D2 method in Ref. Shu et al. (2017), where an adsorption energy of 0.621 eV is also reported.
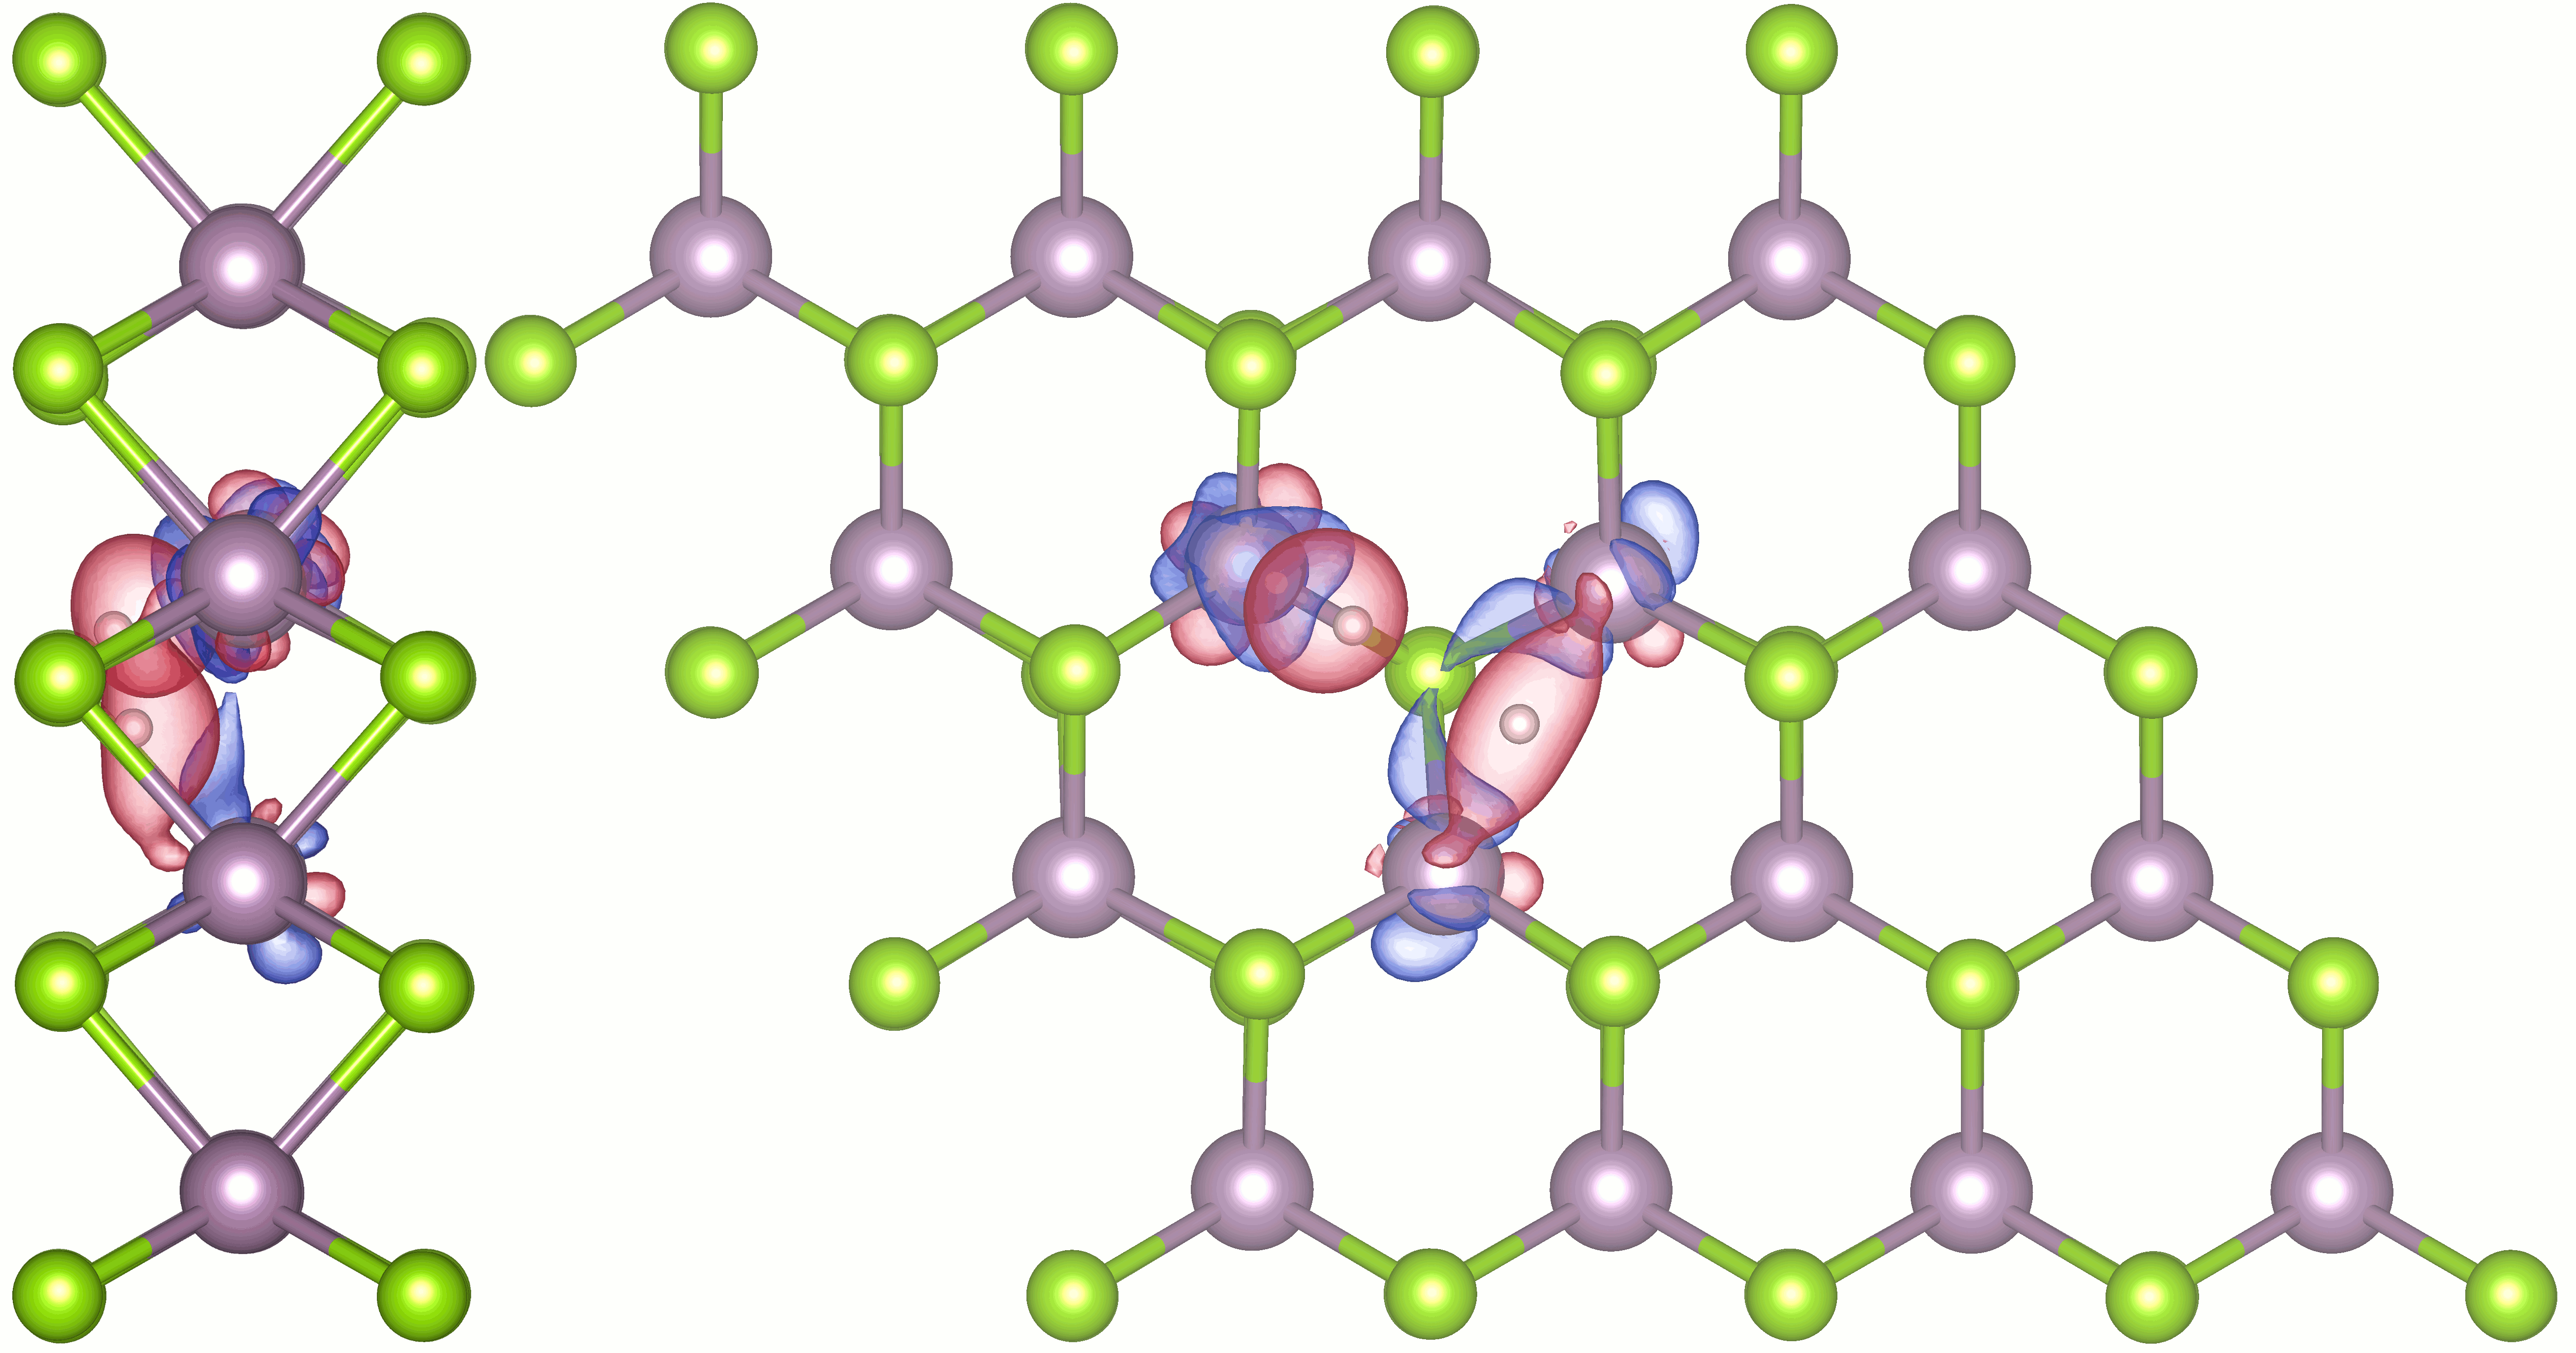
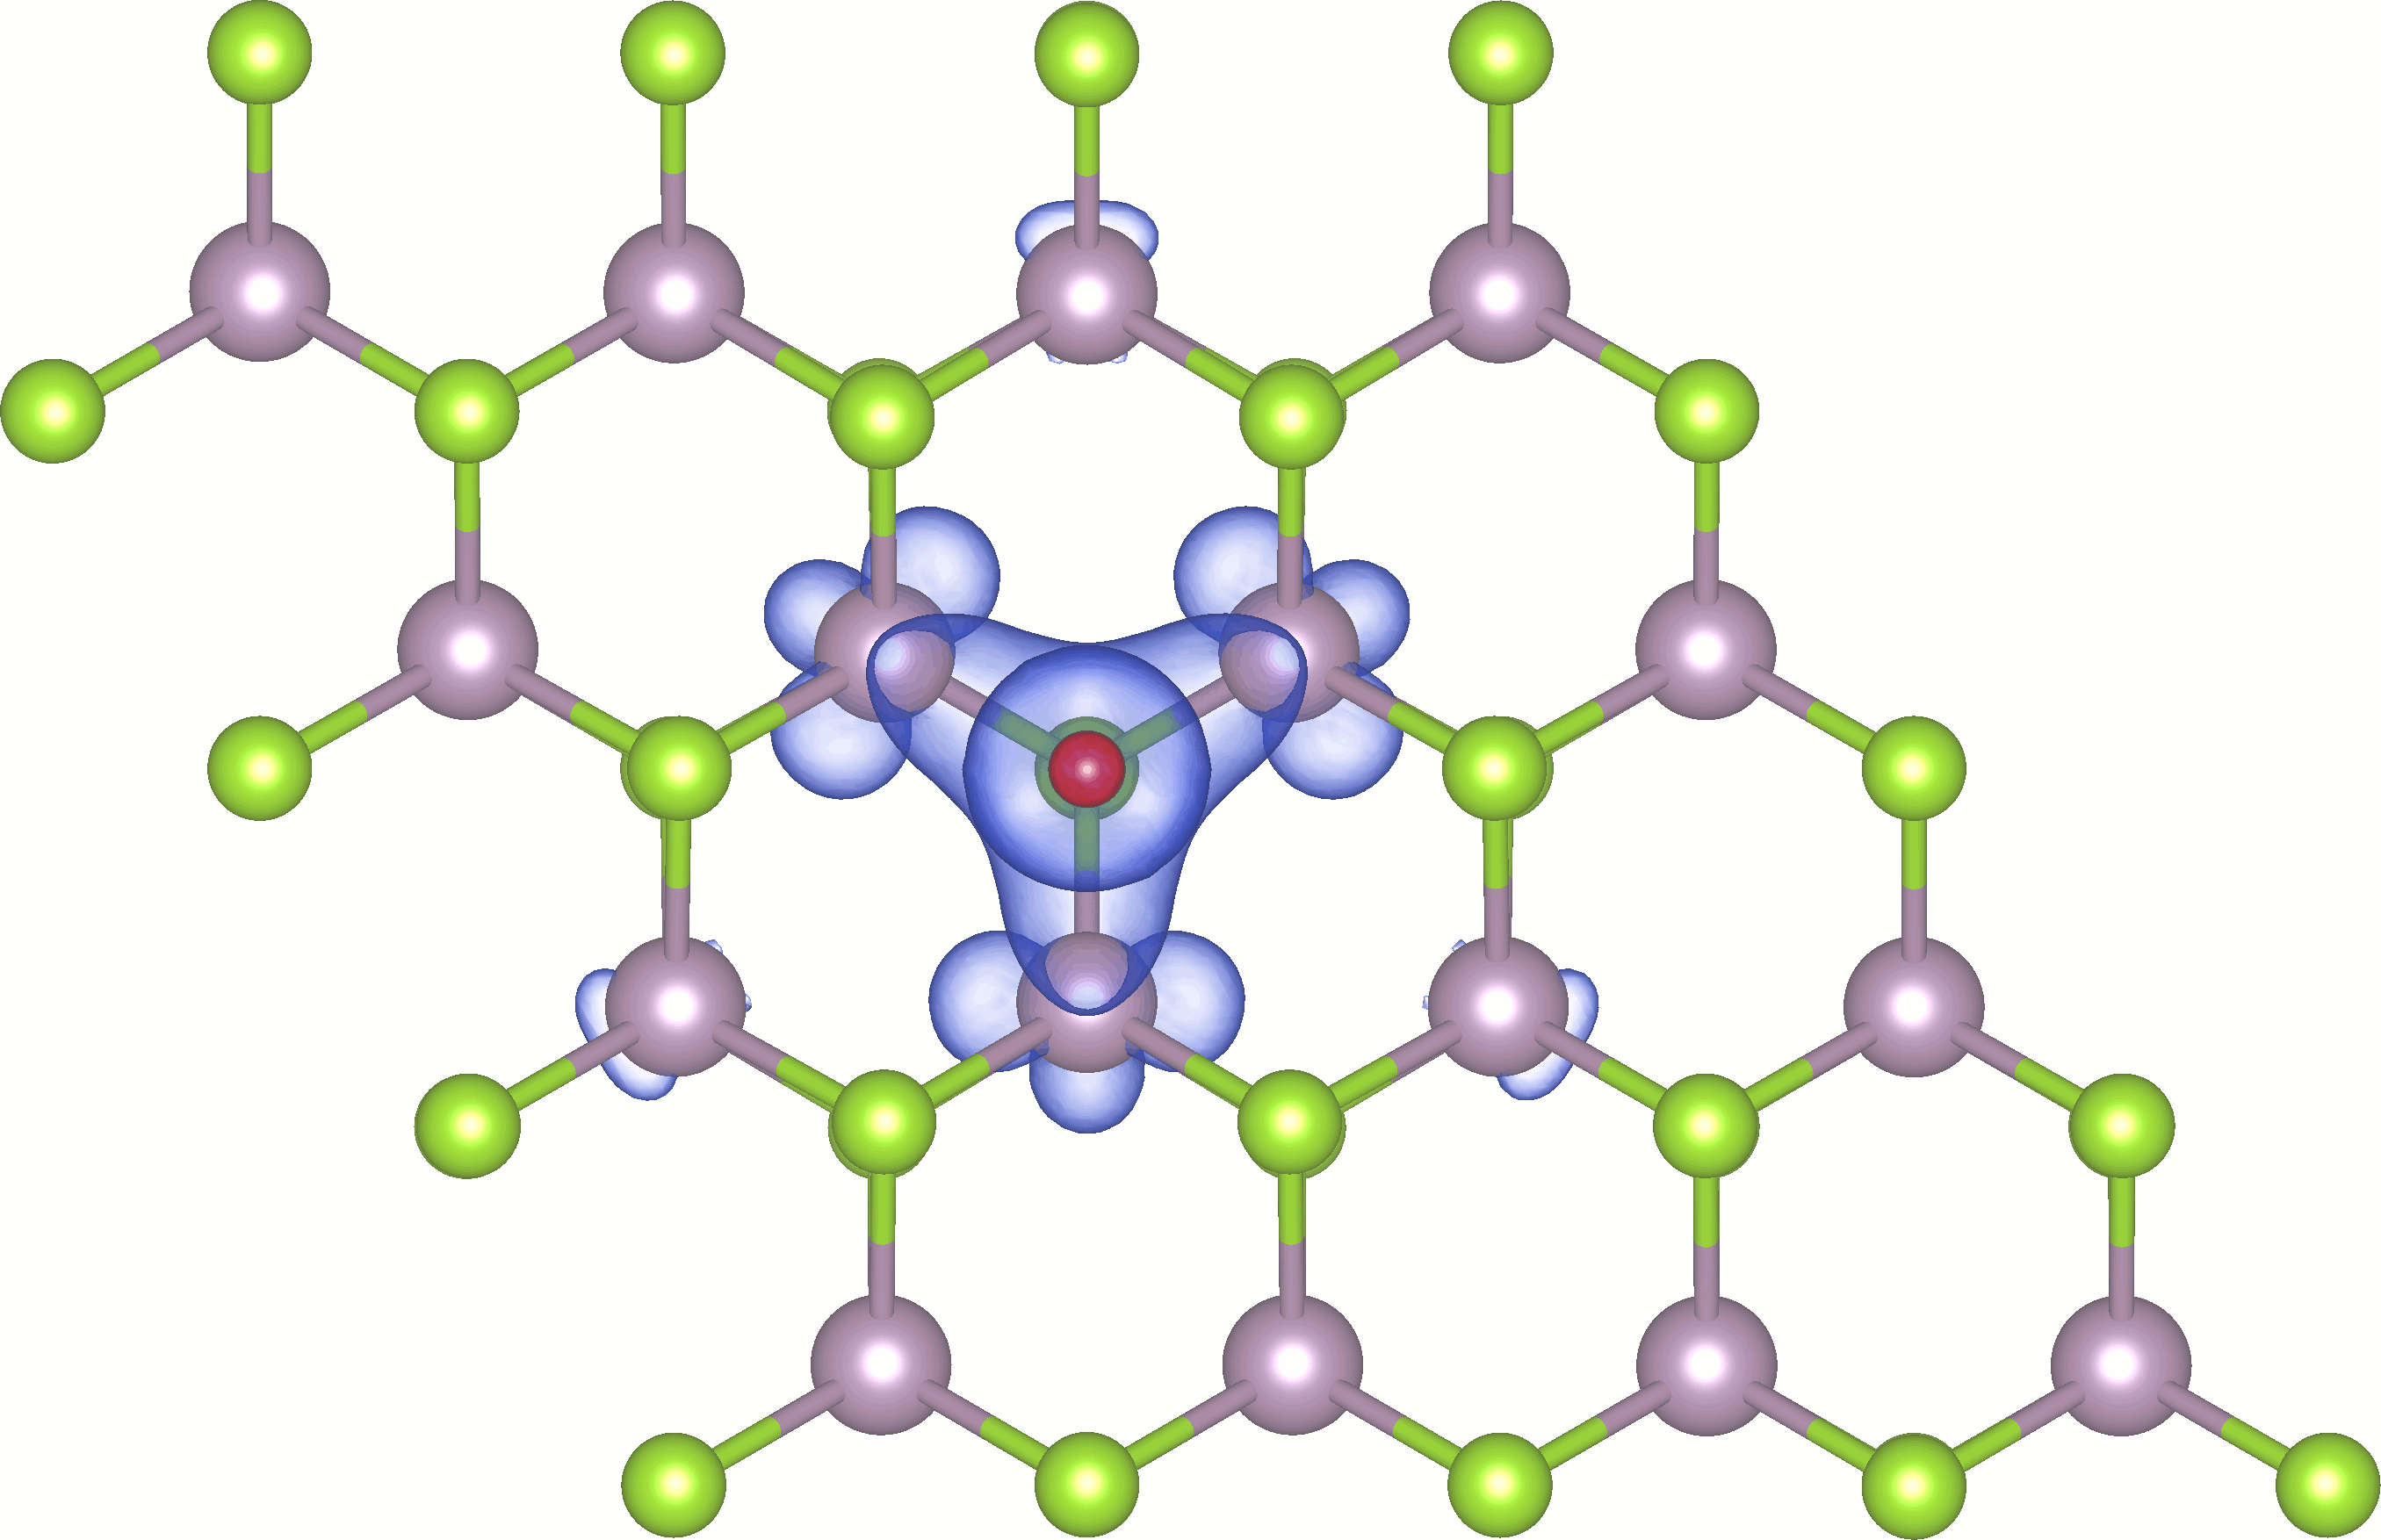
The corresponding band structure and DOS are also shown in Fig. 1(b). Upon adsorption of H2 in the Se vacancy, the MoSe2-vSe in-gap states remain unoccupied, although the direct band-gap (between the valence band maximum and the lowest in-gap) decreases by 80 meV. The H-projected DOS exhibits a narrow peak at about eV that, being readily associated to the flat red bands, is not expected to contribute much to the surface-molecule bonding. We additionally observe a large spread of the projected DOS along the valence MoSe2 states that overlaps with the DOS projected onto - and -states of Selenium and Molybdenum, respectively. The latter may hint to a sizeable charge transfer between the adsorbate and the MoSe2 layer that is confirmed by the Bader charge analysis that gives 0.54 . The isosurface of Fig. 2 shows that the charge transfer comes mainly from the three closest Mo atoms.
Regarding the atomic adsorption of H, which is needed to evaluate the H2 dissociation energy, the site in the pristine MoSe2 surface is the most energetically favorable adsorption position, being the revPBE-vdW (PBE-D3) prediction for the adsorption energy (H)= 0.689 (0.580) eV. However, in the case of MoSe2-vSe, H adsorbs preferentially in the Se vacancy with a revPBE-vdW (PBE-D3) energy of 2.715 (2.674) eV (see Appendix B for all the details). In view of these results, our study of the dissociation process in MoSe2 is restricted to the case in which the two H atoms end up adsorbed at two adjacent positions; whereas in MoSe2-vSe, one H is adsorbed in the vacancy and the other H in the adjacent site ().
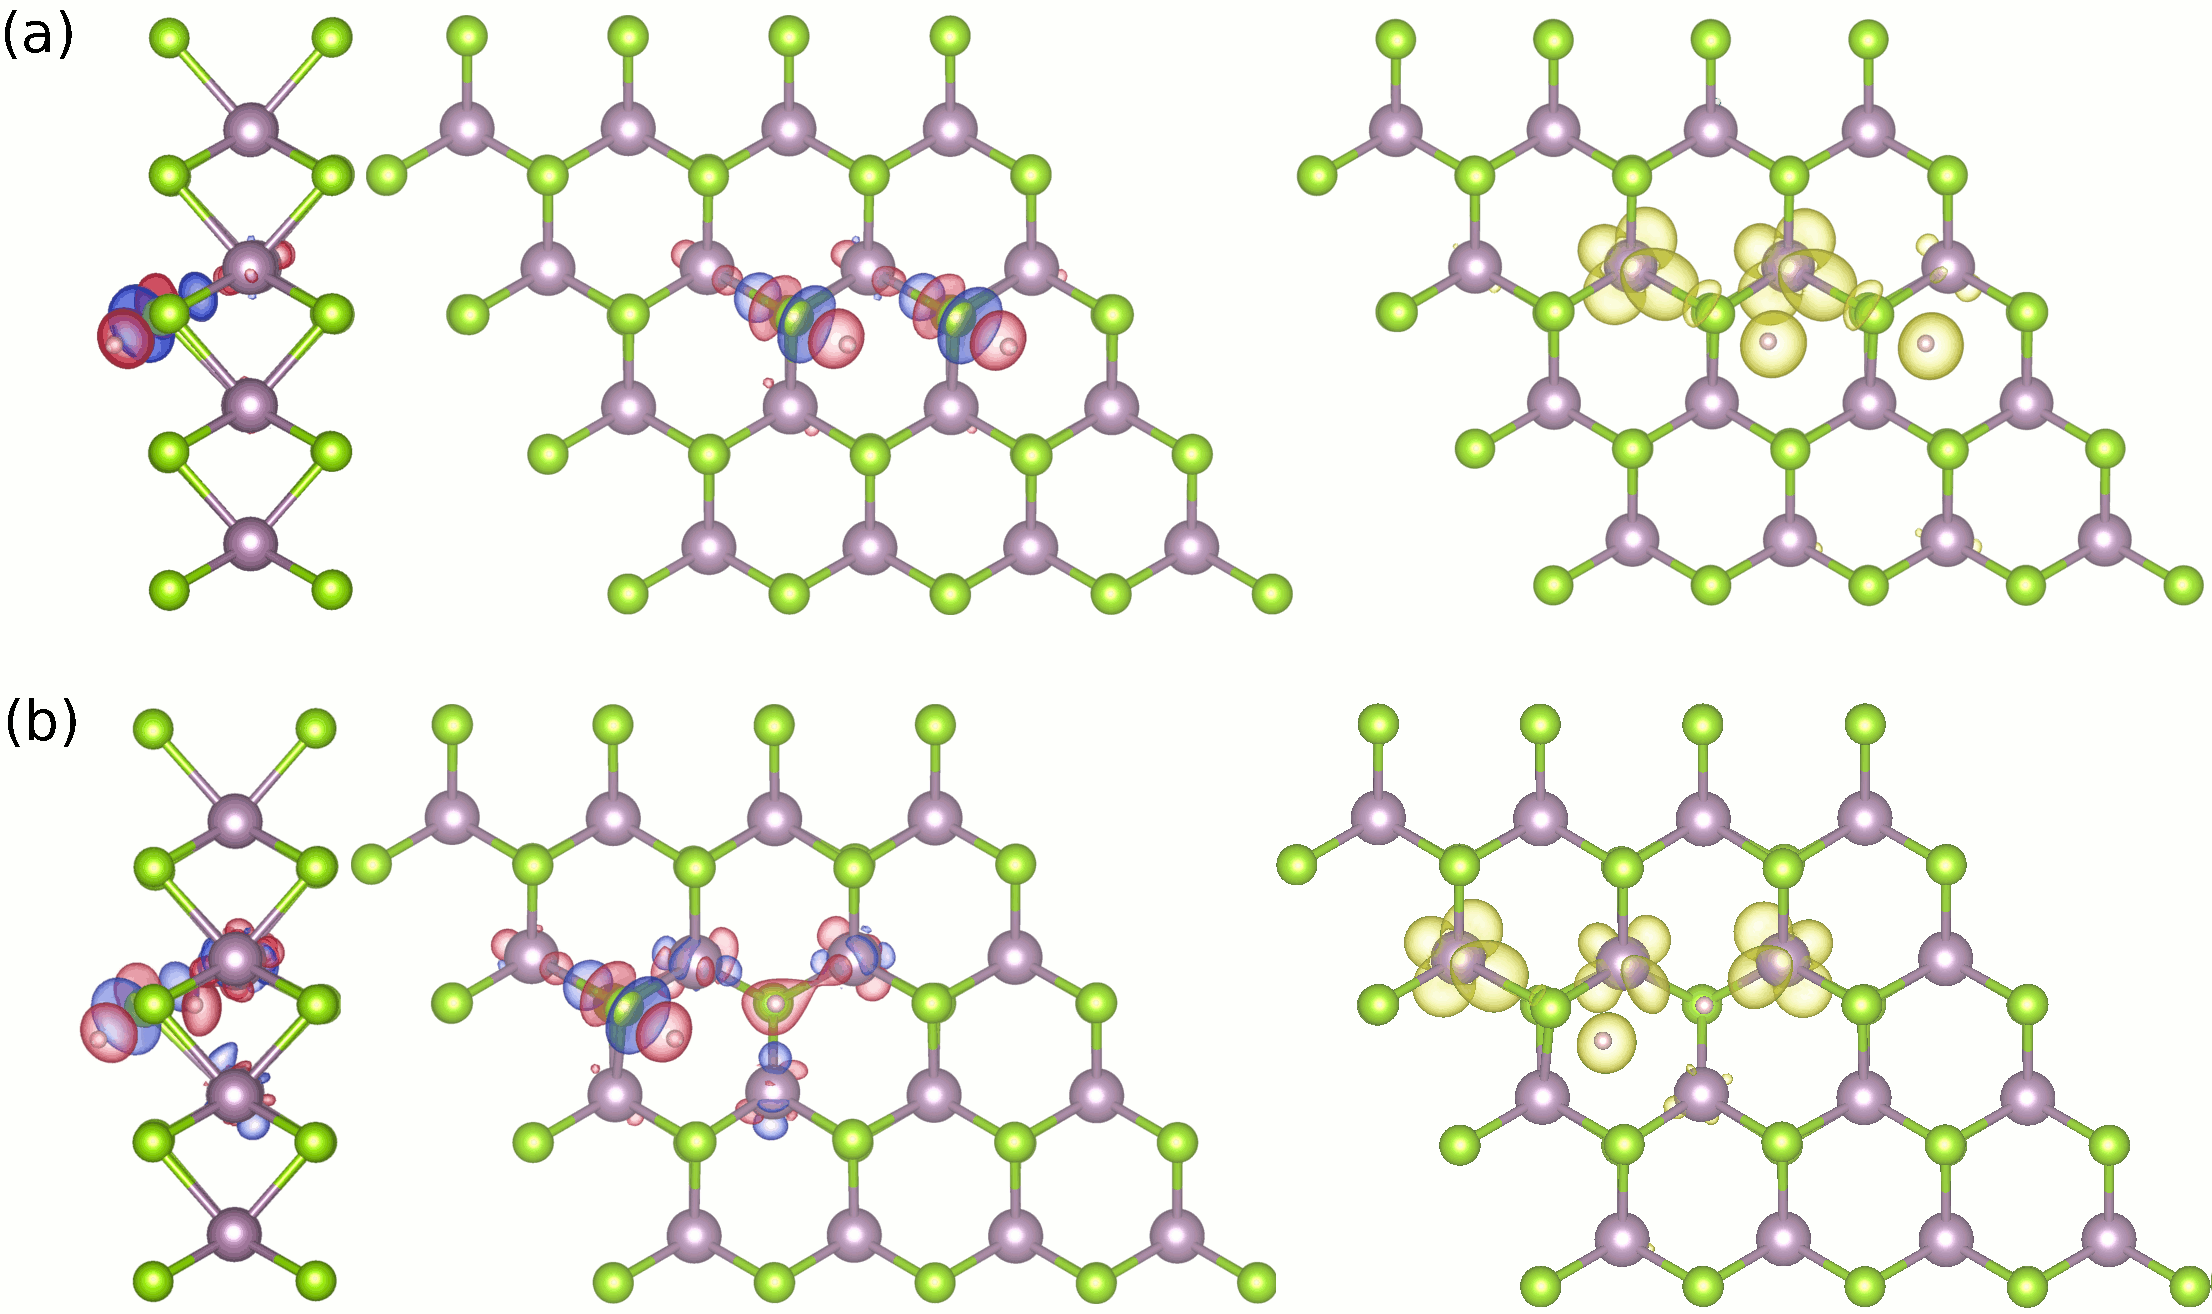
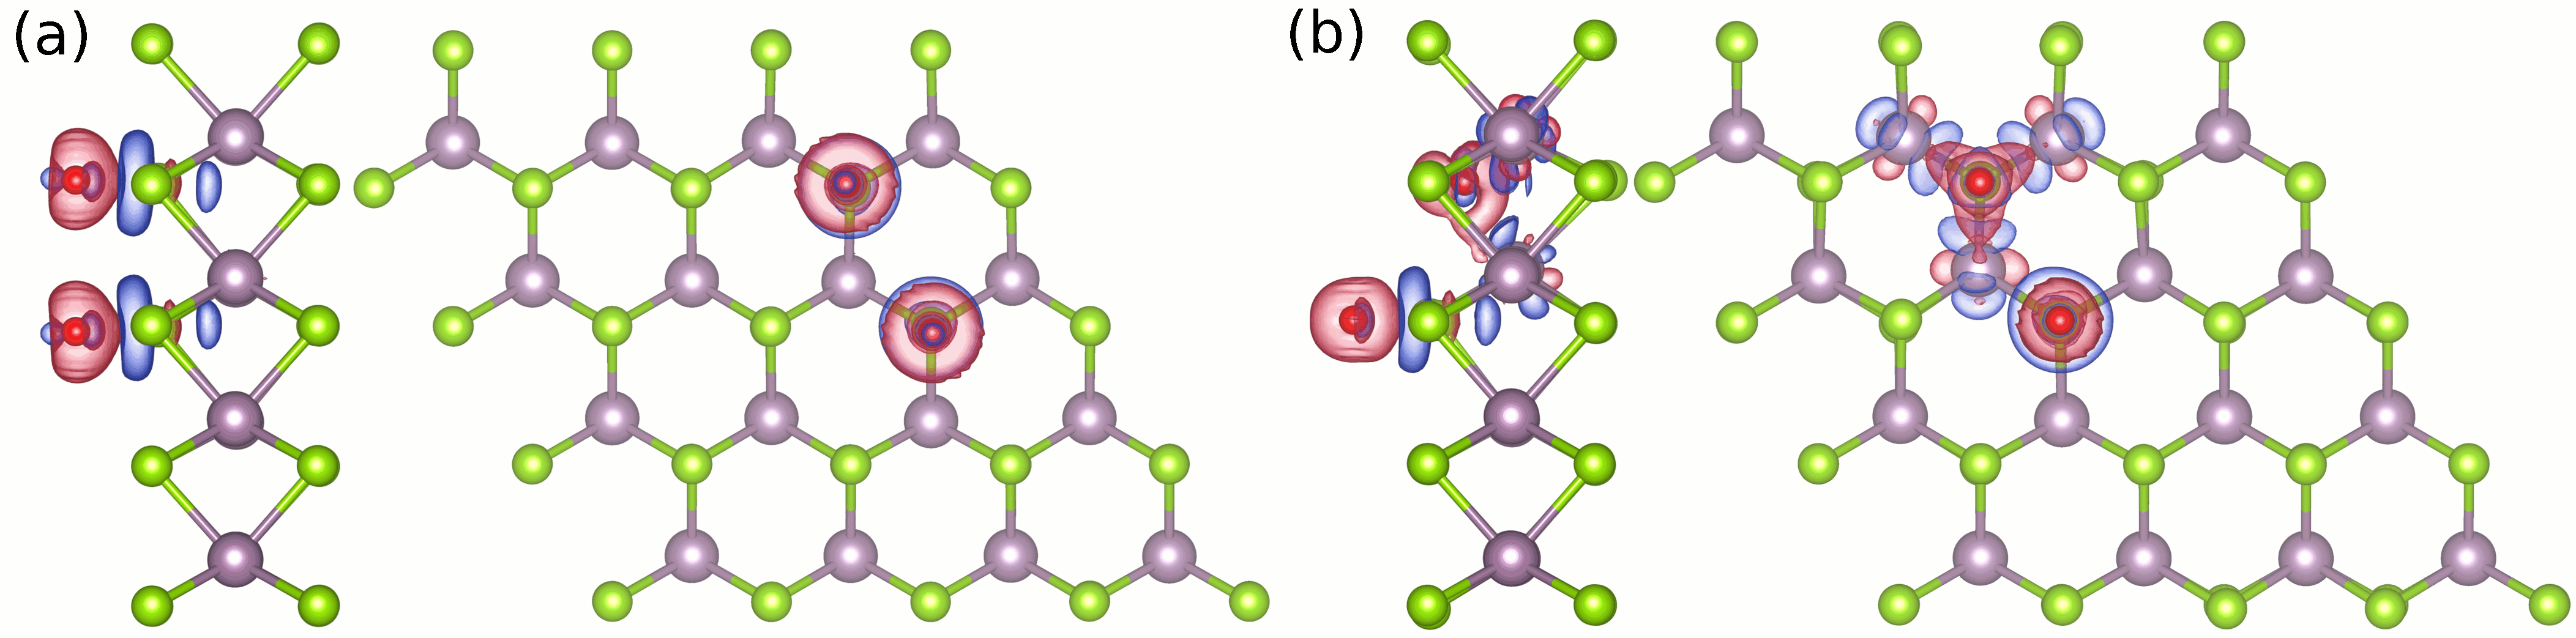
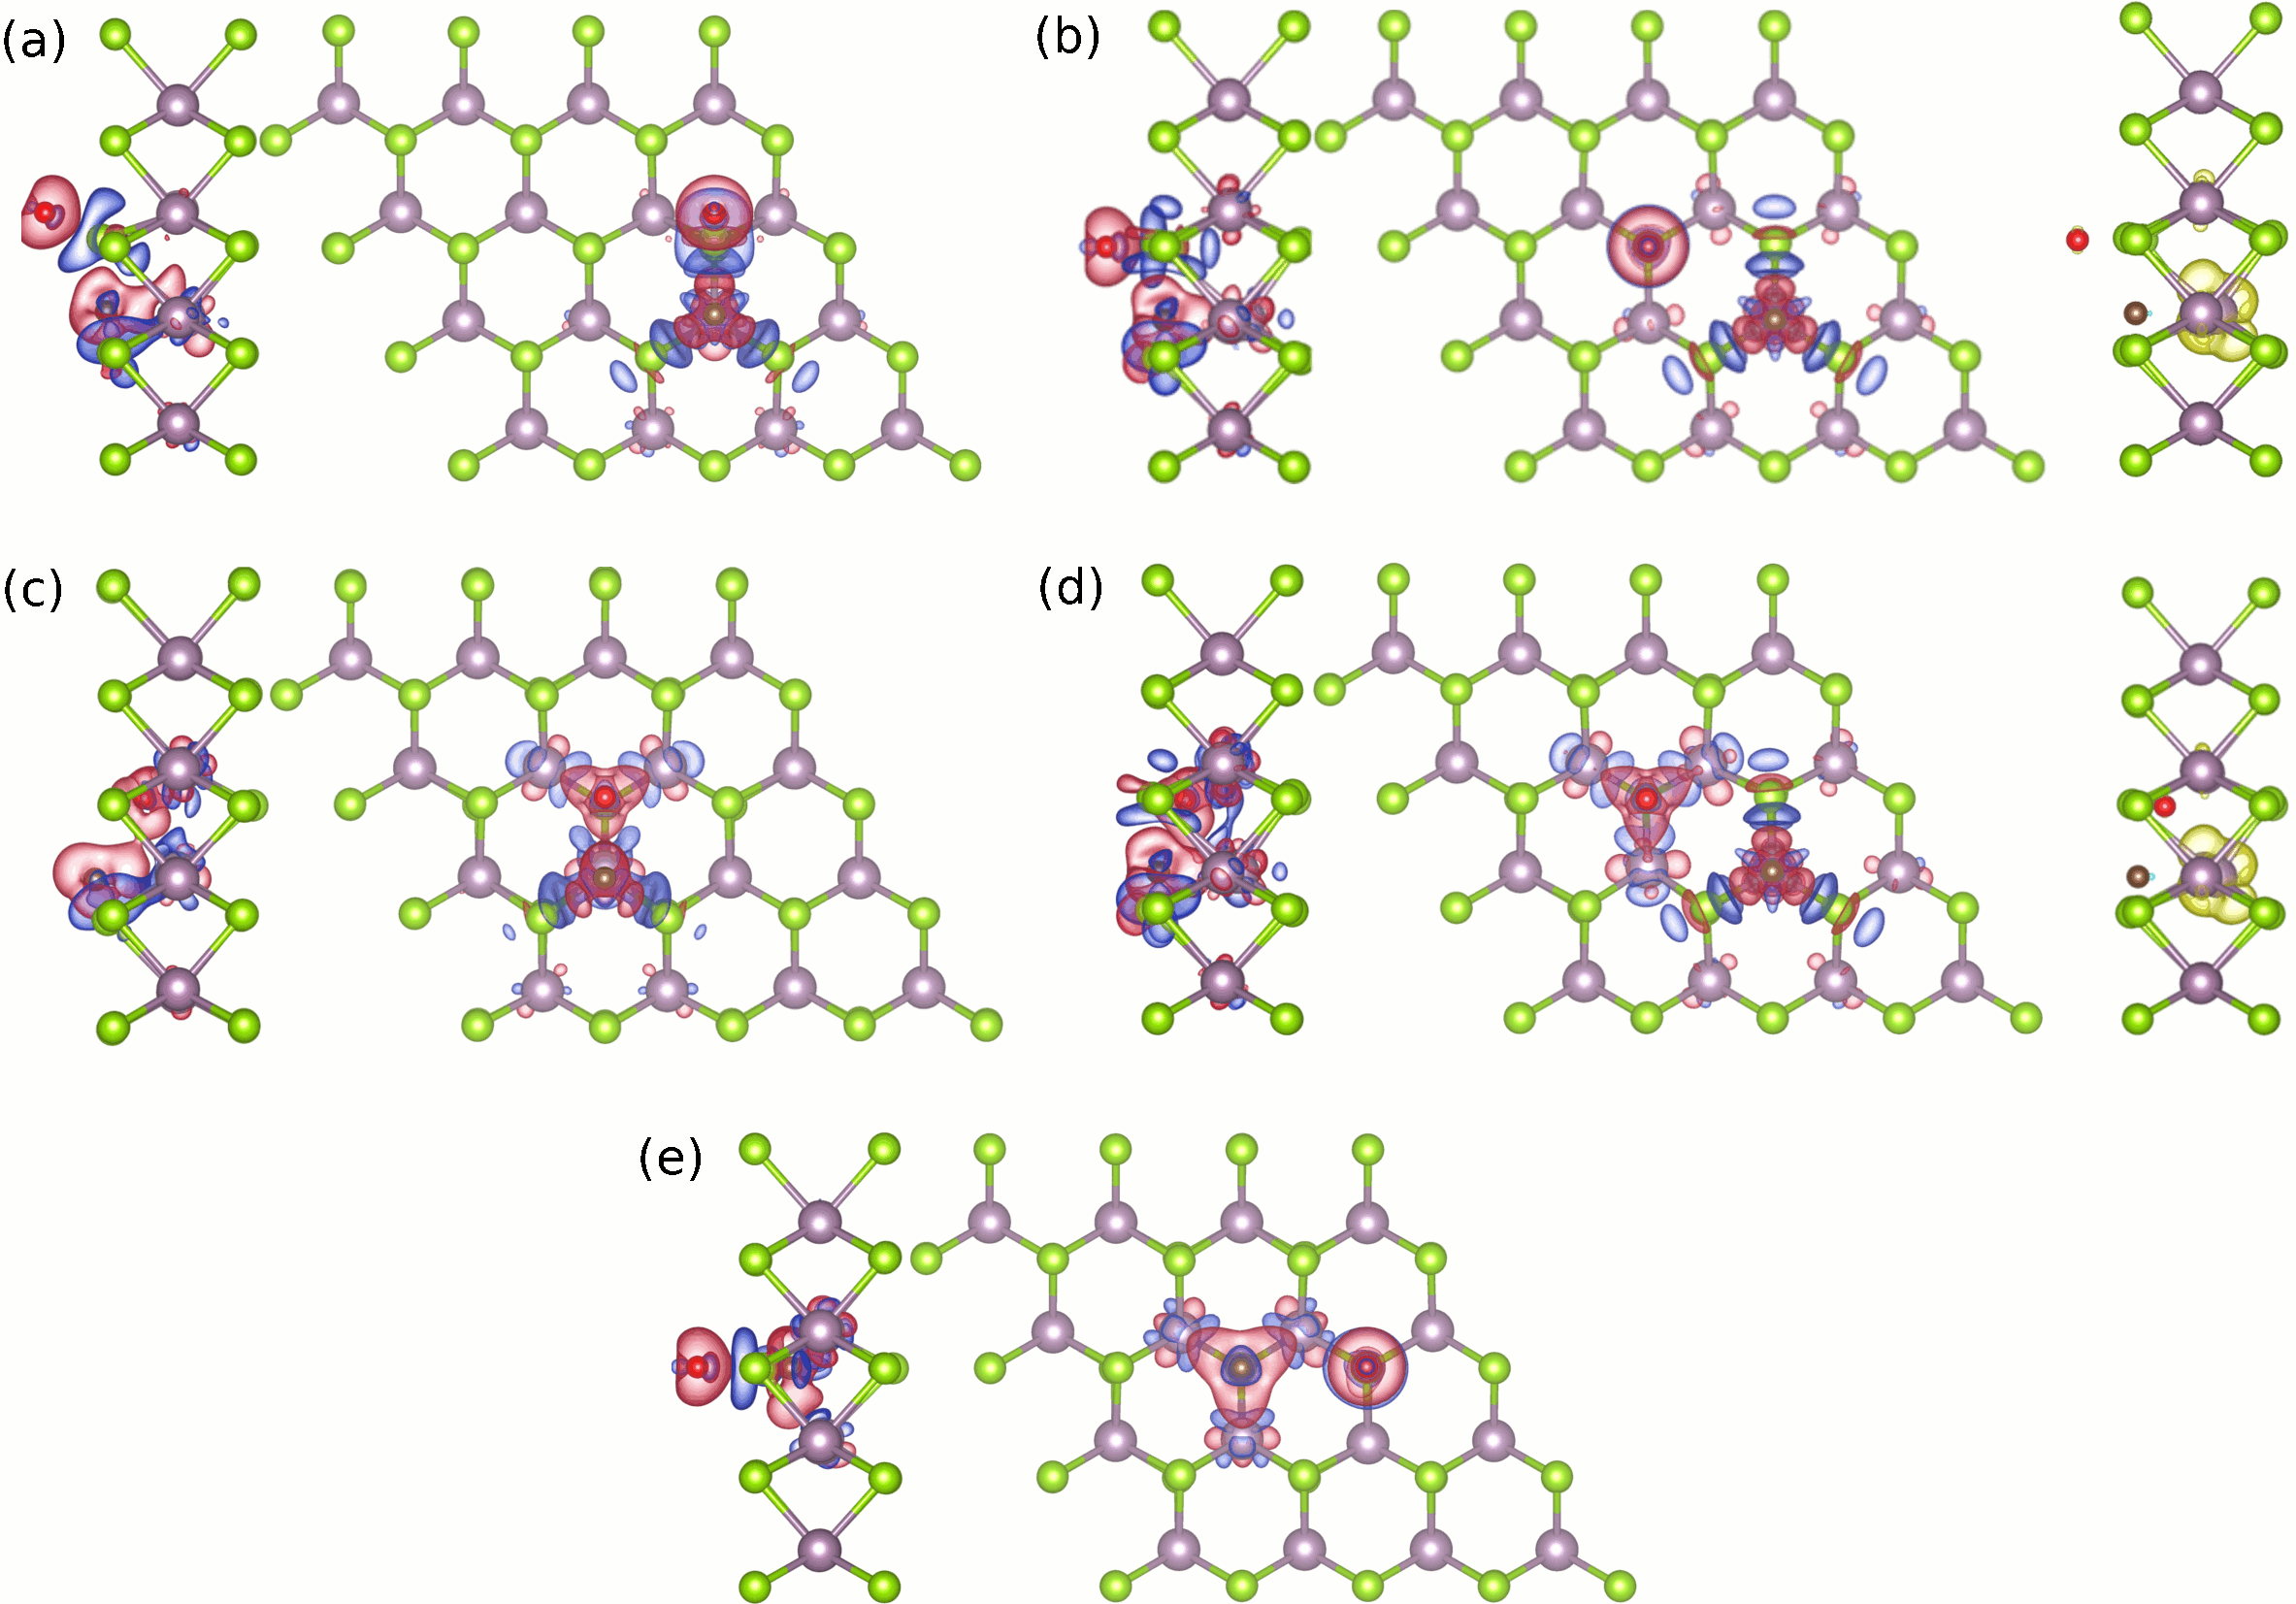
Our results for the dissociative adsorption of H2 on MoSe2 are summarized in Table 2. Even if the gas-phase dissociation energy is reduced by about 1.3 eV on the surface, the process remains highly endothermic (=3.652 and 3.378 eV with revPBE-vdW and PBE-D3, respectively). For each functional, the and values are very similar, reflecting the lack of interaction between H atoms separated by one lattice constant. It is worth noting that the dissociative adsorption of H2 induces a spin magnetization of 2 in the system. Figure 3(a) shows isosurfaces of the induced electron density and spin-magnetization density for H2 dissociatively adsorbed on MoSe2. Each H atom binds to its closest Se, causing a charge rearrangement that is very localized along the corresponding H-Se-Mo line. Remarkably, although the total spin-magnetic moment corresponds to that of the two isolated H atoms, the spin-magnetization density is located both around the H atoms and the Mo atoms involved in the mentioned charge rearrangement. Also a spin-magnetization of 1 has been obtained for atomic adsorption of H on MoSe2, MoTe2, and WS2 Ma et al. (2011), and on MoS2 He et al. (2010). The possibility of magnetizing locally the material by adsorbing H atoms has already been predicted and observed in the case of Graphene Yazyev and Helm (2007); Boukhvalov et al. (2008); González-Herrero et al. (2016).
As seen in Table 2, the dissociation energy is further reduced when a Se vacancy is present in the MoSe2 sheet, but the process is also endothermic in this case. The revPBE-vdW (PBE-D3) dissociation energy is 1.560 (1.256) eV. These values increase slightly (i.e., they are more endothermic), if one considers that the two H atoms diffuse to positions that are far from each other (see the corresponding values). Figure 3(b) shows isosurfaces of the induced electron density and spin-magnetization density for this configuration. The perturbation caused by the H adsorbed at the position is very similar to the one created in the pristine surface [cf. Figs. 3(a) and (b)]. The H atom adsorbed at the vacancy bonds to the three surrounding Mo atoms, but it only induces spin magnetization in two of them due to the presence of the other H. (We have confirmed that the spin magnetization is equally distributed among the three Mo if we remove the H at from the MoSe2-vSe monolayer.)
Interestingly, our calculations show that H2 dissociation on MoSe2-vSe becomes exothermic when the two H atoms are adsorbed in two different and isolated Se vacancies, being the revPBE-vdW (PBE-D3) dissociation energy () eV. Even if a proper study of this particular case would require to consider the energetics of the diffusion process, which is beyond the scope of this study, this result suggests that dissociation might be possible with a larger vacancy concentration. Therefore, for completeness, we have evaluated the dissociation energy for H2 in the case in which two Se vacancies are present at neighbor positions. The process becomes exothermic, being the revPBE-vdW (PBE-D3) prediction = () eV.
DFT-D2 calculations on H2 adsorption at the S vacancy of the MoS2 monolayer show that the dissociative adsorption on that surface is 300 meV more favourable than molecular adsorption Li et al. (2016). This finding is in sharp contrast to what we find here for H2 adsorption on MoSe2-vSe, where the dissociation process is 1.7 eV more endothermic than the molecular adsorption.
III.2 O2 adsorption and dissociation
| revPBE-vdW | |||||||
|---|---|---|---|---|---|---|---|
| (eV) | 0.079 | 0.110 | 0.104 | 0.097 | 0.102 | 2.394 | |
| d(O-O)(Å) | 1.232 | 1.234 | 1.233 | 1.231 | 1.232 | 1.478 | |
| (Å) | 3.40 | 3.21 | 3.20 | 3.14 | 3.22 | 0.12 | |
| 90∘ | 90∘ | 84∘ | 89∘ | 76∘ | 74∘ | ||
| 0∘ | 0∘ | 15∘ | 60∘ | 14∘ | 33∘ | ||
| () | 2 | 2 | 2 | 2 | 2 | 0 | |
| PBE-D3 | |||||||
| (eV) | 0.085 | 0.172 | 0.101 | 0.107 | 0.094 | 2.266 | |
| d(O-O)(Å) | 1.212 | 1.220 | 1.219 | 1.220 | 1.219 | 1.446 | |
| (Å) | 3.48 | 3.22 | 3.22 | 3.20 | 3.39 | 0.15 | |
| 90∘ | 90∘ | 89∘ | 90∘ | 83∘ | 73∘ | ||
| 3∘ | 1∘ | 1∘ | 60∘ | 7∘ | 34∘ | ||
| () | 2 | 2 | 2 | 2 | 2 | 0 | |
Except for a slight stretching, the experimental O2(gas) bond length in gas-phase (1.208 Å) NIS is well reproduced by revPBE-vdW (1.232 Å) and PBE-D3 (1.219 Å). In contrast, the calculated revPBE-vdW (6.349 eV) and PBE-D3 (6.886 eV) O2(gas) dissociation energies overestimate the experimental values, 5.213 and 5.267 eV, that are obtained after adding the O2(gas) ZPE of 98 meV Irikura (2007) to the gas-phase dissociation energy of 5.115 eV Darwent (1970) and 5.169 eV Benson (1965).
Regarding the adsorption of O2 on the MoSe2 monolayer, Table 3 summarizes our results for O2 adsorption at different sites. In all cases, the O2 molecular axis was initially oriented parallel to the surface. Similarly to what we find for H2, the five studied configurations remain as possible O2 adsorption sites after the structural relaxation. Energetically, the most favorable adsorption configuration is , with a revPBE-vdW (PBE-D3) adsorption energy 0.110 (0.172) eV. The molecule lies parallel to the surface at a distance of about 3 Å and preserves its gas-phase bond length. Our normal mode analysis for this site reveals that O2 is weakly bounded in the perpendicular direction to the surface ( 20 meV), and that the molecule will be able to perform both small displacements parallel to the surface and rotations around the surface normal under small perturbations ( 13 meV).
The optimized geometry for O2 adsorbed at the site on MoSe2, as well as the spin-resolved band structure and spin-resolved DOS are shown in Fig. 4(a). The lack of dispersion in the O2-dominated orbitals (flat red bands and the corresponding sharp blue peaks in the O-projected DOS) suggests a weak interaction between the molecule and the surface. The minor Bader charge transfer of 0.02 associated with the adsorbed O2 confirms the physisorption character of the interaction. The induced electron density and spin-magnetization density (not shown) also corroborate that there is only a very minor charge rearrangement on O2 that conserves the gas-phase spin magnetization. Let us remark that the O2 adsorption energy in the pristine MoSe2 surface is similar to the ones obtained for adsorption in other TMD monolayers by other authors. See for example Bui et al. Bui et al. (2015) and Zhou et al. Zhou et al. (2015) for a study on WS2 and Zhao et al. Zhao et al. (2014) for a study in MoS2.

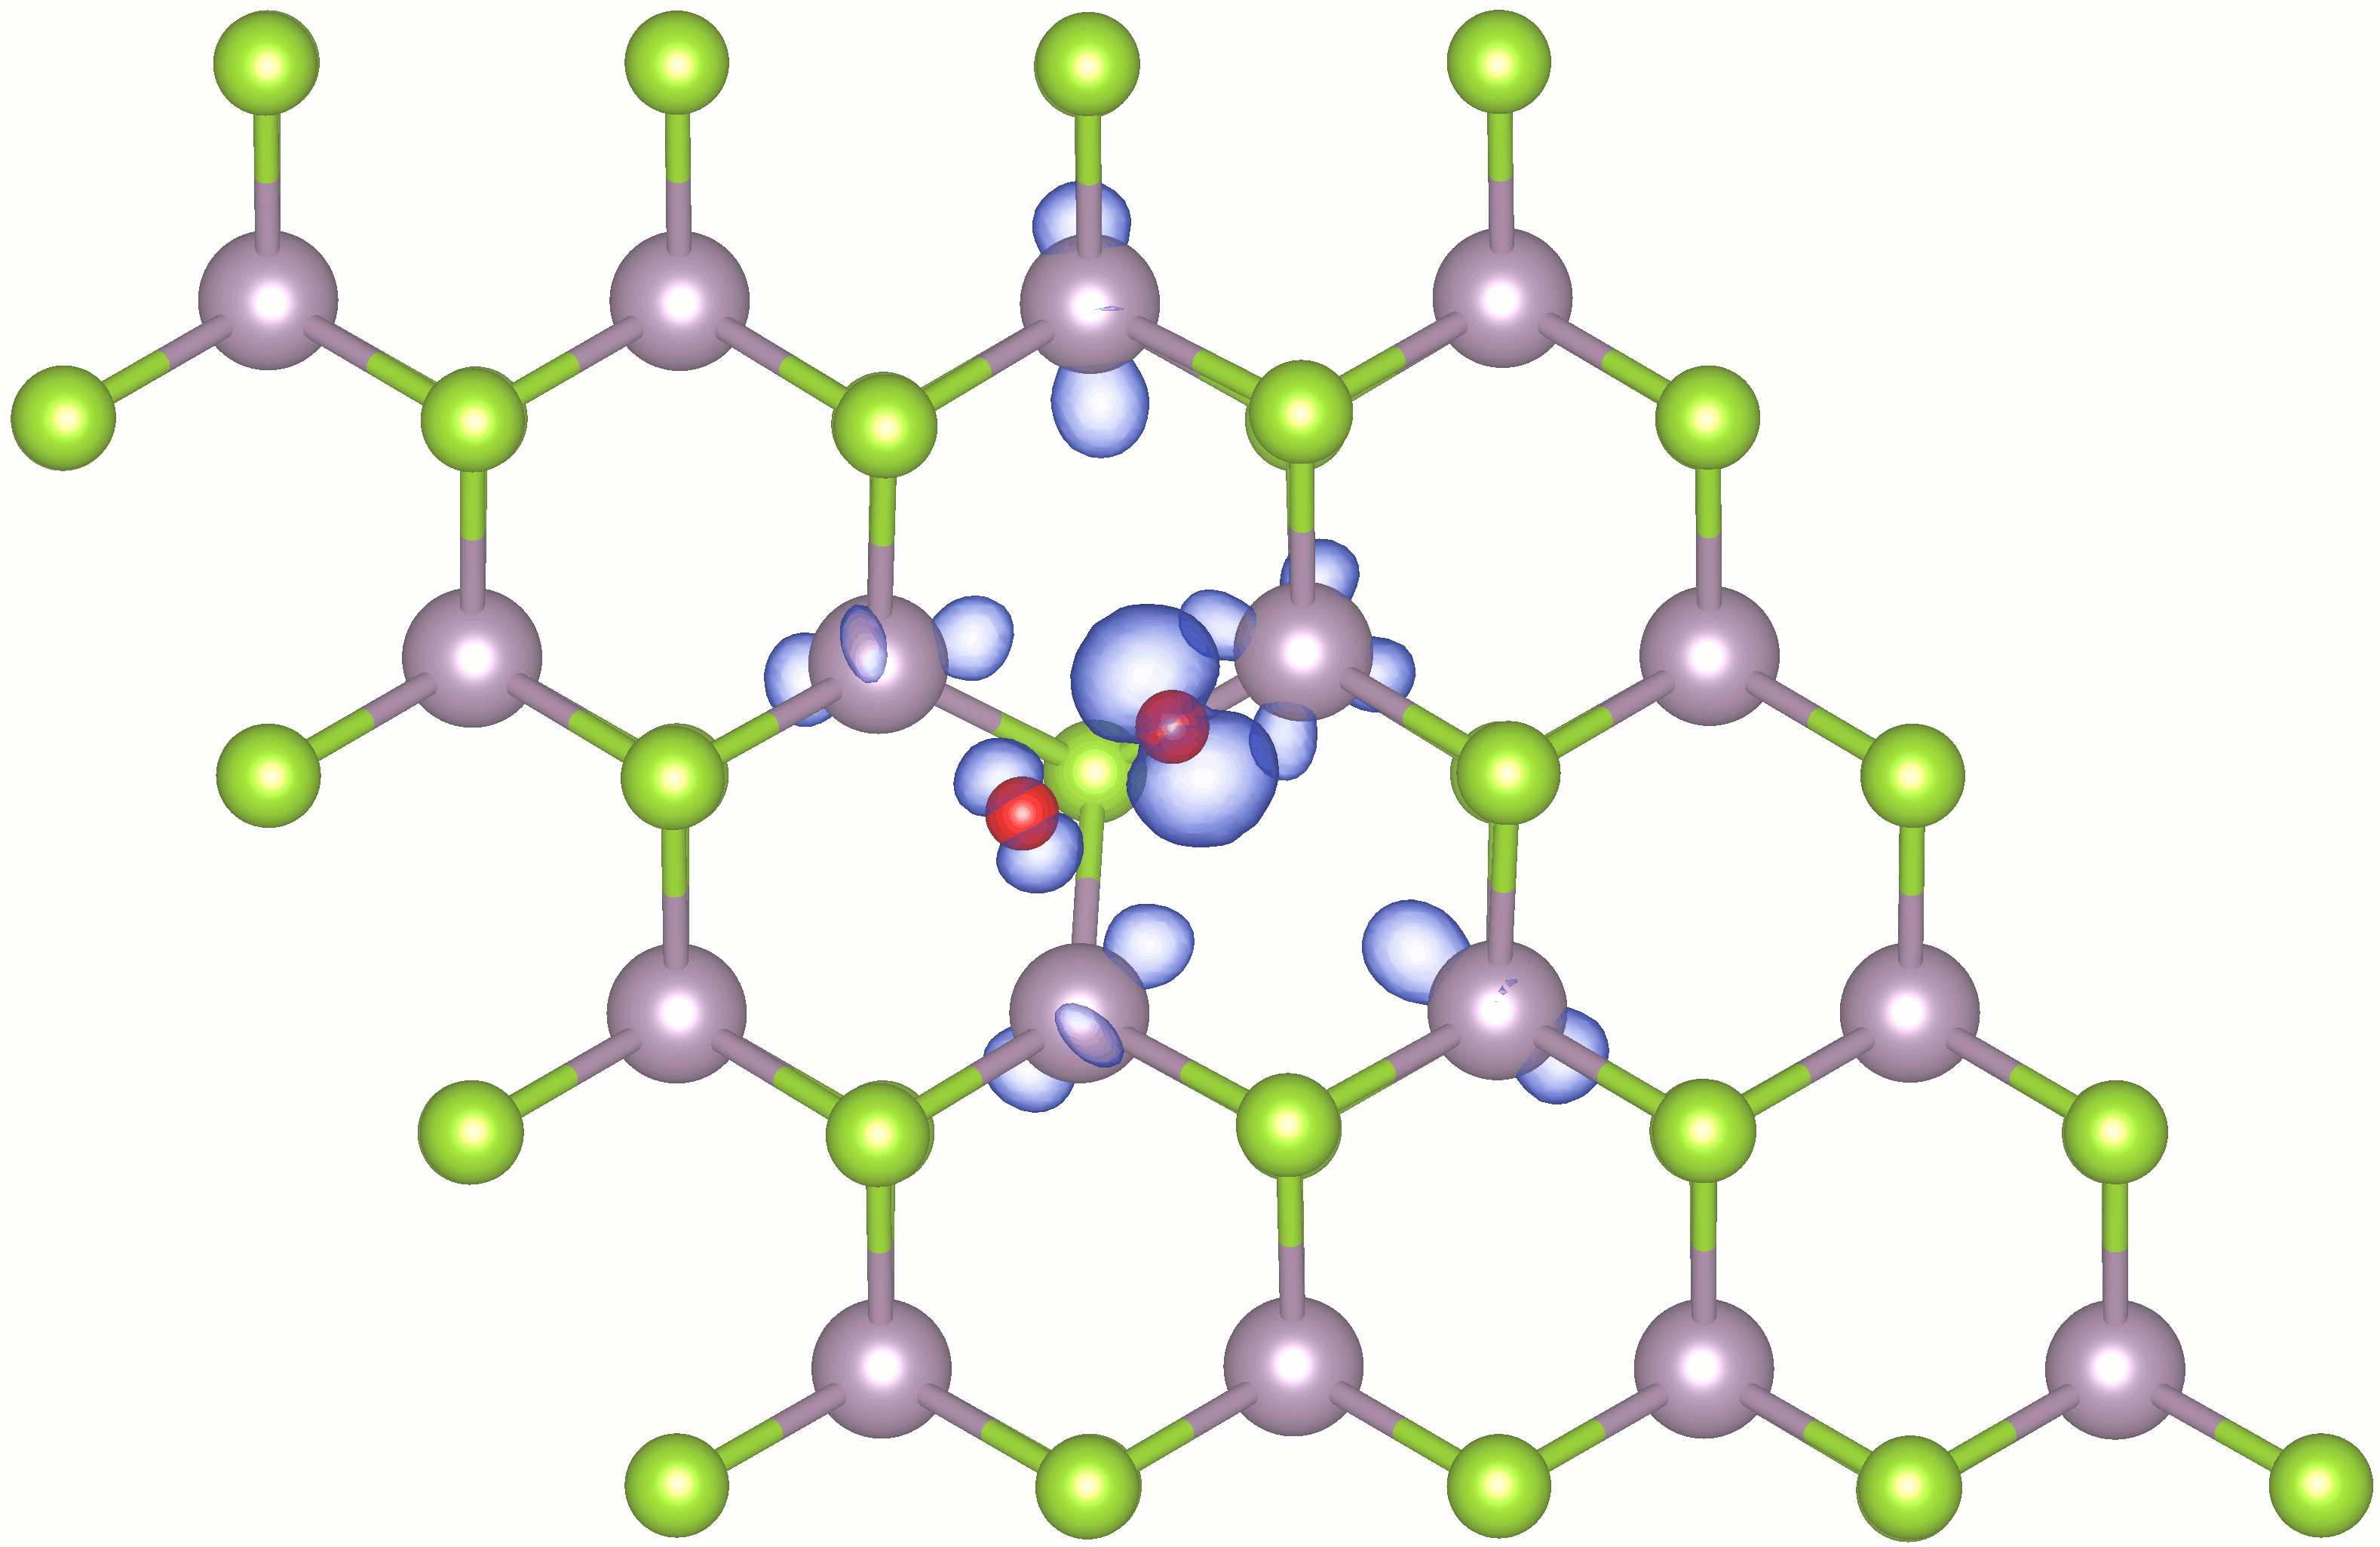
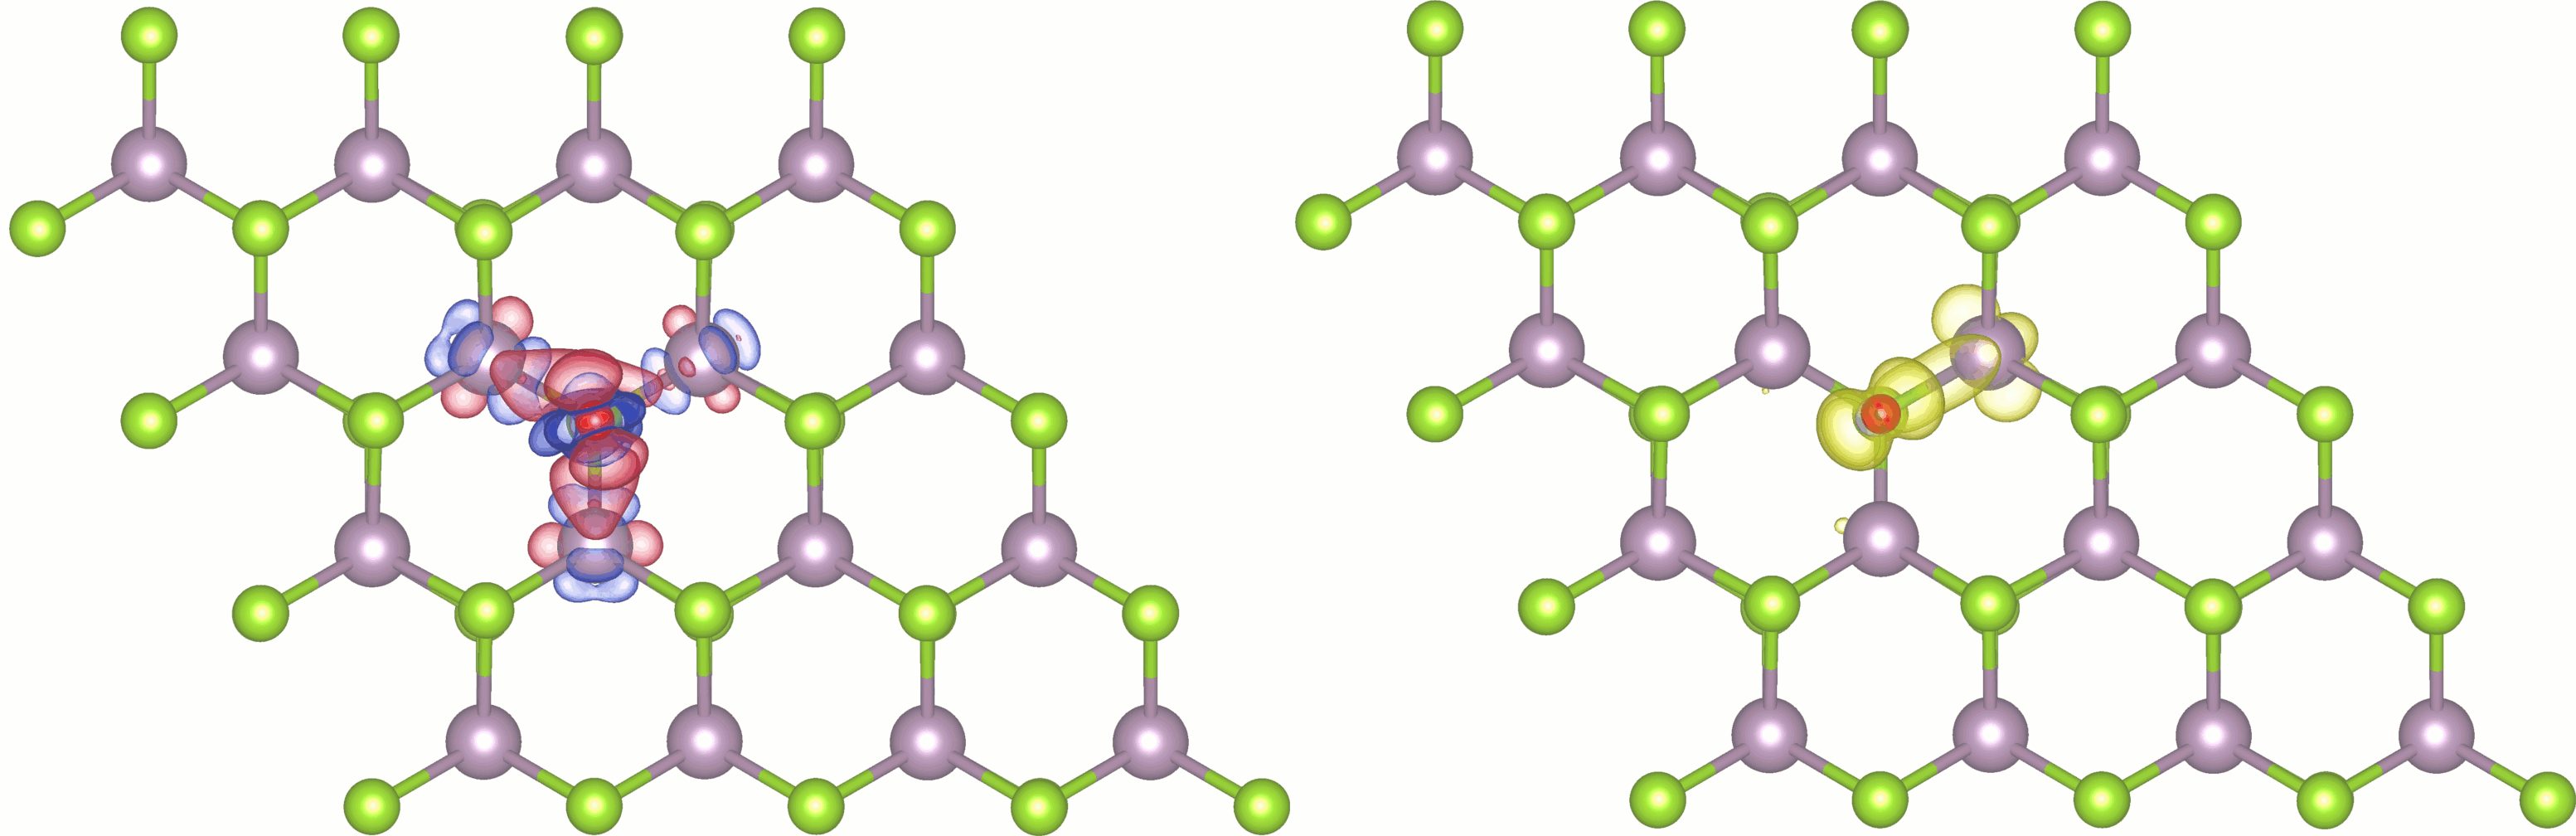
Table 3 shows that the O2 adsorption energy in a Se vacancy () is one order of magnitude larger than in the pristine surface, being the revPBE-vdW and PBE-D3 values 2.394 and 2.266 eV, respectively. The normal mode analysis performed for this configuration shows that adsorption at the vacancy is stable at low temperatures, being the lowest energy mode 25 meV. In particular, for modes involving desorption, 40 meV. Noticeably, the total spin-magnetic moment in this case vanishes as a consequence of a significant charge transfer from the surface to the molecule that, according to the Bader charge analysis is 1.11 . Inspection of the spin-magnetization density confirms the absence of possible regions with opposite spin that could contribute to the zero spin magnetization of the system. The induced electron density in Fig. 5 shows that O2 at the site decreases its electron density around its two atoms and gains it in the bond.
The O2/MoSe2-vSe band structure in Fig. 4(b) resembles that of H2 adsorbed at the Se vacancy [Fig. 1(b)] as the DOS projected onto the adsorbate orbitals spreads over the MoSe2 valence band. However, the large charge transfer experienced by the adsorbed O2 causes an important modification of the band structure that is not observed in H2/MoSe2-vSe. The MoSe2-vSe in-gap states disappear and a O2 dominated flat band appears near the valence band maximum. As a result, the system direct band-gap is 1.40 eV, which is quite similar to the corresponding value of the pristine MoSe2 monolayer. The partial charge associated with the above mentioned states is plotted in Fig. 6.
Adsorption of O2 at a chalcogen vacancy in different TMD monolayers (MX2 with MW, Mo and XS, Se, Te) has been studied by means of the DFT-D2 method Chen et al. (2015); Li et al. (2016); Liu et al. (2015). Overall, the reported adsorption energies are between 2–2.5 eV and the Bader charge captured by the adsorbed O2 is around 1 in all cases. In particular, for MoSe2 Liu et al. (2015), the reported O2 adsorption energy, O-O bond length, and Bader charge transfer, are 2.2 eV, 1.45 Å, and 1.0 , respectively, in good agreement with the results presented here. The band structures presented in these works exhibit similar phenomenology to that of Fig. 4(b): After O2 adsorption at the chalcogen vacancy the ingap states related to the presence of a chalcogen defect are removed and new flat bands are formed at a lower energy. Similar results have been found in studies with other functionals Zhao et al. (2017); Wang and Paulus (2021).
Regarding the Oxygen atomic adsorption, our analysis in Appendix B shows that on MoSe2 and on MoSe2-vSe are the energetically favored adsorption sites. Thus, as dissociate adsorption configurations, we consider that the O atoms adsorb on the pristine surface at two positions separated by a lattice constant (), whereas on MoSe2-vSe, one O is in the vacancy and the other O at the nearest (). The results are shown in Table 4.
| revPBE-vdW | PBE-D3 | ||||
| Ta,a | Ta,a | ||||
| (eV) | 1.222 | 3.268 | 1.039 | 3.947 | |
| (eV) | 0.605 | 3.820 | 0.426 | 3.958 | |
| d(O-O)(Å) | 3.62 | 4.01 | 3.54 | 3.87 | |
| (Å) | 1.59, 1.59 | 0.62, 1.57 | 1.57, 1.57 | 0.65, 1.52 | |
| () | 0 | 0 | 0 | 0 | |
Dissociation on the pristine surface is still endothermic, although the revPBE-vdW and PBE-D3 dissociation energies (=1.222 and 1.039 eV, respectively) are significantly smaller than the gas-phase value. The fact that is about 0.6 eV smaller than reveals the existence of a non-negligible vdW interaction between the adsorbed O atoms in spite of being separated by 3.5–3.6 Å. In this situation the Bader charge transfer associated with each O is 0.86 . The excess of charge between each O and its closest Se that is observed in the induced electron density of Fig. 7(a) remarks the strong bonds that they form. Since the charge rearrangement is very localized along each of these bonds, we interpret the remanent interaction between the adsorbed O as a dipole-dipole interaction between the two O-Se compounds.
At variance with our results for H2 dissociation, a single Se vacancy suffices to facilitate the dissociation of O2. Table 4 shows that the revPBE-vdW and PBE-D3 predictions for the dissociation energy at are and 3.9 eV, respectively. The revPBE-vdW value suggests a non-negligible interaction between the dissociated atoms, but not the PBE-D3 one. The induced electron density of Fig. 7(b) shows the strong bonds that the O at the vacancy forms with the three closest Mo atoms. The other O binds to the Se below, being the corresponding quite similar to what we observe for adsorption on the pristine surface [cf. Fig. 7(a)].
For completeness, we have evaluated the dissociation energy of O2 considering that two Se vacancies are present at neighbor lattice positions. In this situation the process is even more exothermic with a revPBE-vdW (PBE-D3) prediction () eV. Similar values are obtained for the case in which the two O atoms are adsorbed at two different isolated Se vacancies eV.
The effect that different S vacancy concentrations have in the dissociation of O2 on the MoS2 surface has been characterize in Ref. Zhou et al. (2021). Specifically, the process becomes more favorable as the concentration of vacancies increases from 3.13% to 12.5%. These results are in accordance to what we find in our calculations where one and two vacancies are present in the 44 supercell, corresponding to a concentration of vacancies of 3.13% and 6.25%, respectively.
III.3 CO adsorption and dissociation
The CO(gas) bond length calculated with revPBE-vdW and PBE-D3 is 1.137 and 1.135 Å, respectively. Both values reproduce the experimental value of 1.128 Å NIS within a relative error of 1%. The revPBE-vdW (PBE-D3) dissociation energy of CO(gas), =11.68 (12.10) eV, overestimates the corresponding experimental values, =11.243 eV and =11.274 eV, that, for comparative purposes, we obtain by adding the CO(gas) ZPE of 134 meV Irikura (2007) to the experimental dissociation energies, 11.109 eV Darwent (1970) and 11.140 eV Benson (1965), respectively.
| revPBE-vdW | |||||||
|---|---|---|---|---|---|---|---|
| (eV) | 0.133 | 0.122 | 0.143 | 0.127 | 0.119 | 0.871 | |
| d(C-O)(Å) | 1.137 | 1.137 | 1.137 | 1.137 | 1.138 | 1.208 | |
| (Å) | 3.88 | 3.93 | 3.51 | 4.13 | 4.24 | 0.25 | |
| 65∘ | 14∘ | 82∘ | 36∘ | 28∘ | 0∘ | ||
| 38∘ | 81∘ | 27∘ | 61∘ | 67∘ | 0∘ | ||
| () | 0 | 0 | 0 | 0 | 0 | 2 | |
| PBE-D3 | |||||||
| (eV) | 0.124 | 0.123 | 0.145 | 0.120 | 0.103 | 1.317 | |
| d(C-O)(Å) | 1.137 | 1.134 | 1.136 | 1.135 | 1.136 | 1.210 | |
| (Å) | 3.71 | 3.70 | 3.34 | 3.94 | 4.09 | 0.21 | |
| 58∘ | 6∘ | 45∘ | 28∘ | 17∘ | 0∘ | ||
| 43∘ | 85∘ | 30∘ | 66∘ | 74 ∘ | 0∘ | ||
| () | 0 | 0 | 0 | 0 | 0 | 2 | |
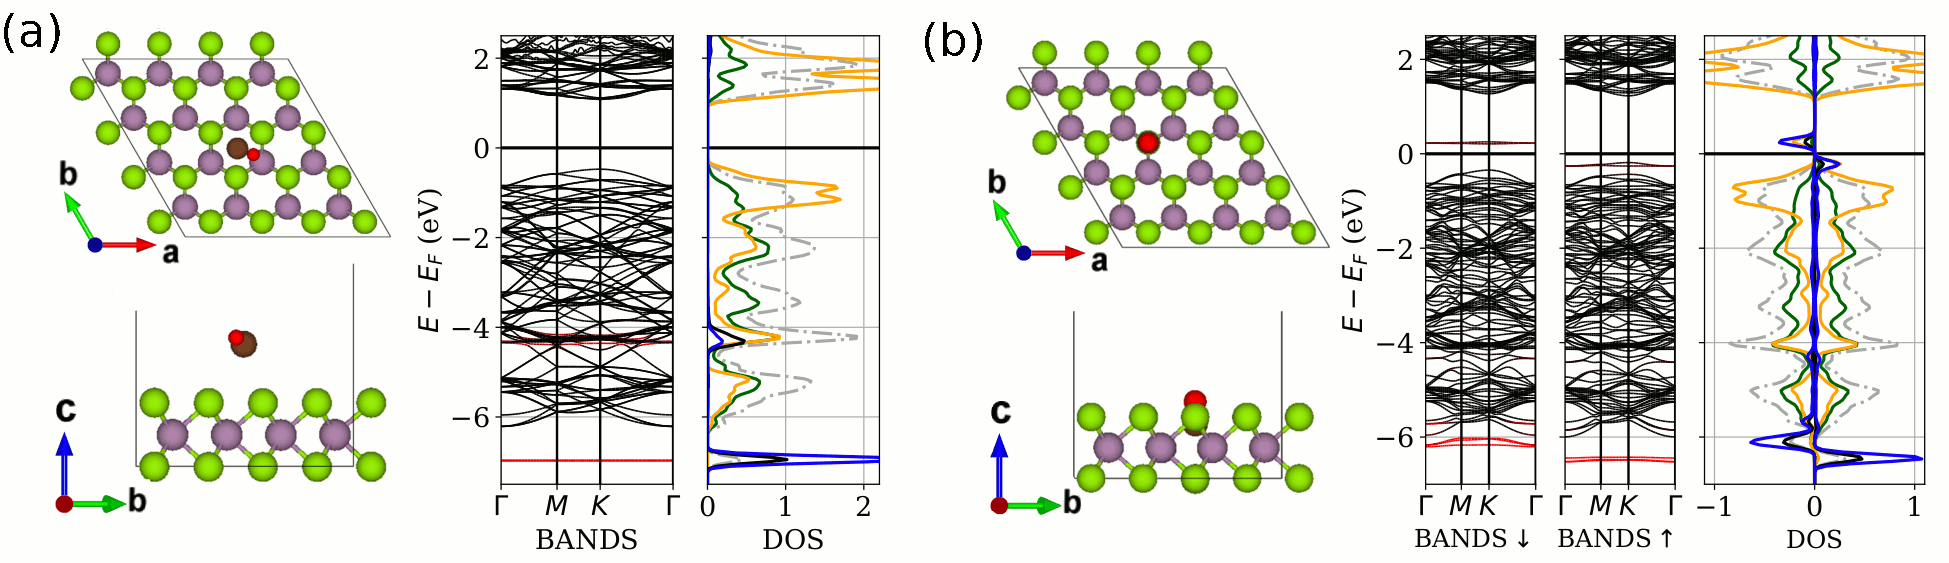
Table 5 shows our results for adsorption of one CO molecule at the five considered sites in the MoSe2 surface and at the Se vacancy in MoSe2-vSe. All the relaxation calculations start with the expected CO orientation for adsorption at surfaces, i.e., perpendicular to the surface being C the closest atom to the surface. Starting with the results for MoSe2, both functionals provide compatible predictions for all the properties presented in Table 5 and agree that the most energetically favorable position is , with 0.145 eV. In this configuration, CO adsorbs at 3.2 Å, keeping the gas-phase bond length, and it is slightly tilted respect to the surface normal, with the C atom atop and the O atom displaced towards the nearest . The optimized structure is shown in Fig. 8(a) together with the corresponding band structure and DOS. The fact that CO is physisorbed is reflected in the rather flat bands associated with the outer CO levels that lie about 4.4 eV below the Fermi level and in the small charge transfer that is obtained with a Bader charge analysis ( 0.015 ). By analysing the induced electron density (not shown), we observe that there is only a small charge redistribution inside the CO and the closest surface atoms. A normal mode analysis shows that the molecule is only weakly bounded to the surface ( 15 meV) and that is almost free to displace in the plane parallel to the surface and to rotate around the surface normal direction ( 15 meV). However, perturbations involving a change on the molecule tilting angle will require a larger energy supply ( 20 meV).
The adsorption of CO in the MoSe2 monolayer has been previously studied in Ref. Ai et al. (2019) with PBE-D2. The reported adsorption energy is 0.100 eV with the CO located at 3 Å in between the and positions, and with a Bader charge transfer compatible with the one obtained in this work. Additionally, theoretical studies for CO adsorption in the MoS2 and WS2 monolayers report adsorption energies of the same order Bui et al. (2015); Zhou et al. (2015); Zhao et al. (2014).
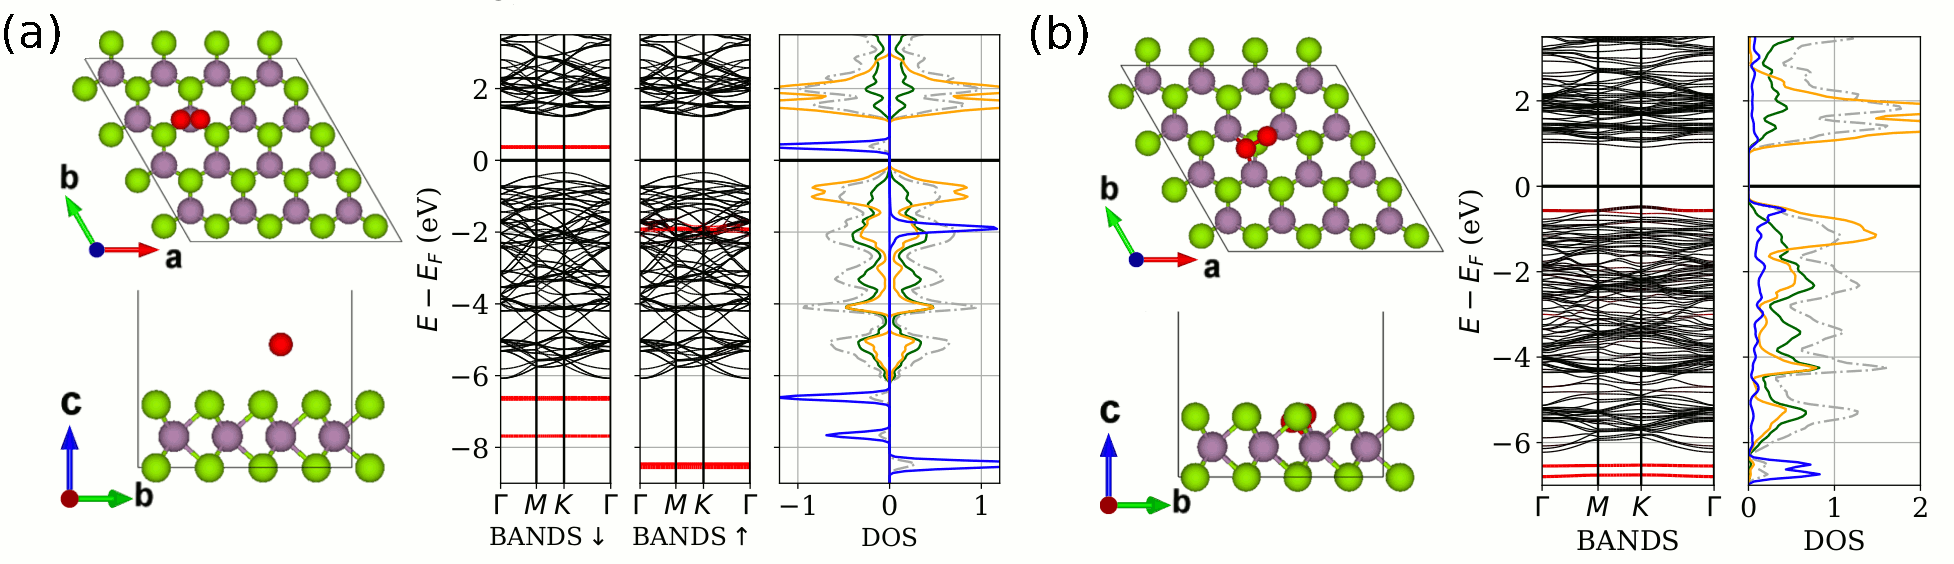
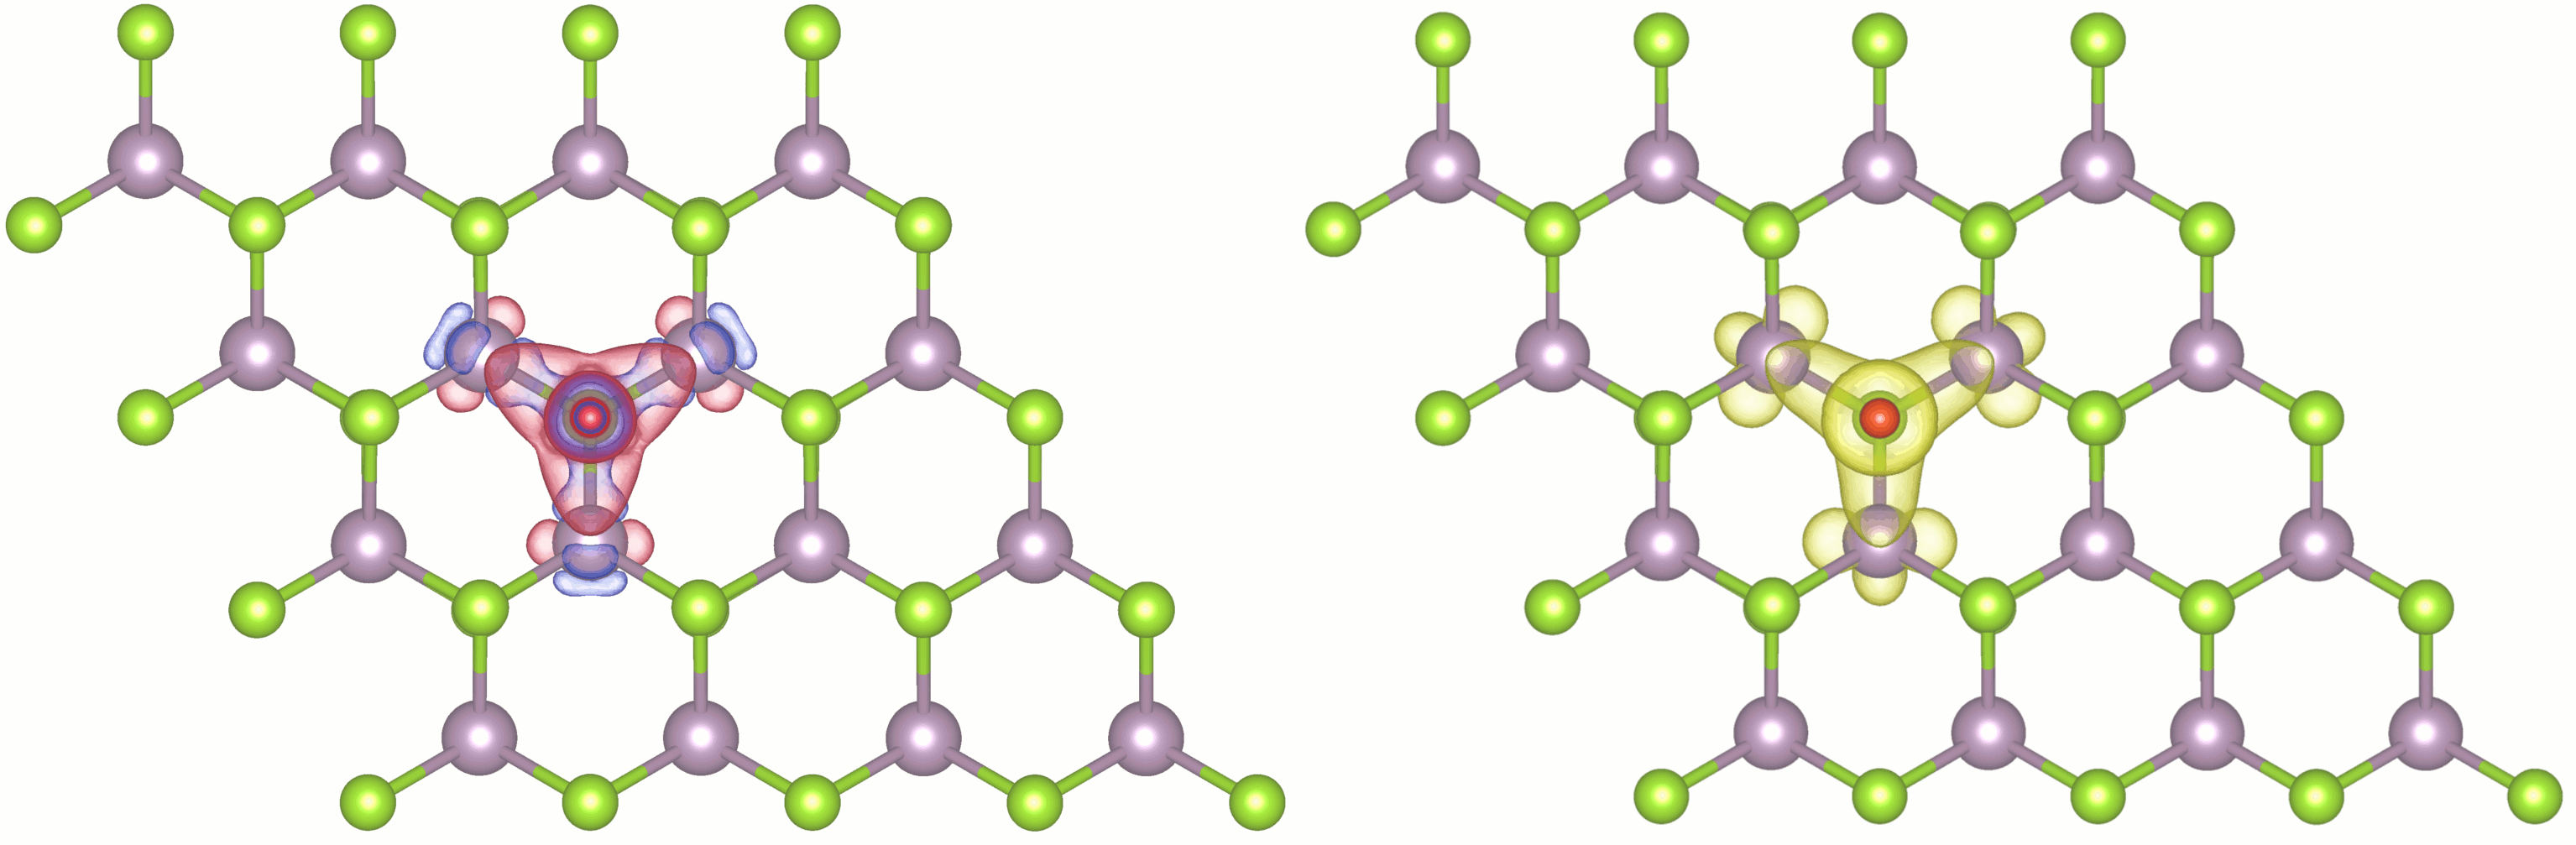
As also obtained for H2 and O2, CO adsorption at a Se vacancy is characterized by a much larger binding energy, although there is a large discrepancy between the revPBE-vdW ( eV) and PBE-D3 ( eV) values in this case. However, both calculations agree on the structural properties of the adsorption configuration, namely, Å, d(C-O) Å, and perpendicular orientation [see the site in Table 5 and Fig. 8(b)]. The normal mode analysis reveals that CO adsorption is stable at low temperatures, being all the modes 20 meV. In particular, for the mode related to desorption (i.e., translation perpendicular to the plane), meV. Remarkably, upon adsorption of CO at the Se vacancy, the system acquires a spin-magnetic moment of 2 . A Bader charge analysis reveals that the charge transfer that can be attributed to CO is = 0.680 . It is one order of magnitude larger than the Bader charge transfer to CO adsorbed in MoSe2, but insufficient to explain the system spin-magnetic moment (2 ). Figure 9 provides some insight into this point. The induced electron density shows that CO binds to the three closest Mo atoms below. Hence, although part of the spin-magnetization is located on the adsorbate, it also involves these three Mo atoms, as clearly shown in the figure. The band structure and DOS shown in Fig. 8(b) allow us to understand better the spin-magnetization. The MoSe2-vSe in-gap states disappear, giving rise to two nearly flat and degenerate bands per spin component close to the Fermi level that are mainly contributed by -like states of CO and -like states of the three closest Mo. Figure 10 shows the partial charge density associated with the two new bands appearing below the Fermi level to illustrate the shape and spatial distribution of these newly formed states. These bands, being partially occupied, are at the origin of the finite magnetic moment and transform the system into a -type semiconductor. Besides, the minimum energy excitation is a spin excitation.
The band structure of CO adsorbed at a S vacancy on MoS2 has been studied with DFT-D2 Li et al. (2016). As obtained here for MoSe2-vSe, the in-gap states vanish while new flat bands appear just below and above the Fermi level. In contrast to MoSe2-vSe, the new bands are non-degenerated and, as a result, no spin-polarization appears. Similarly a non-magnetic ground state has been predicted for CO adsorption at the chalcogen vacancy position of WSe2 Ma et al. (2017) using the optB86b-vdW functional.
| revPBE-vdW | PBE-D3 | ||||||||||||||
| C+O | |||||||||||||||
| (eV) | 6.700 | 6.589 | 2.066 | 2.115 | 1.620 | 5.700 | 6.087 | 1.671 | 1.667 | 1.263 | |||||
| (eV) | 6.607 | 6.607 | 2.474 | 2.474 | 1.635 | 6.114 | 6.114 | 1.730 | 1.730 | 1.290 | |||||
| d(C-O)(Å) | 3.26 | 4.23 | 2.48 | 3.93 | 4.18 | 3.11 | 4.06 | 2.44 | 3.83 | 4.06 | |||||
| (Å) | 0.31 | 0.04 | 0.52 | 0.11 | 0.90 | 0.25 | 0.03 | 0.49 | 0.02 | 0.89 | |||||
| (Å) | 1.92 | 1.60 | 0.73 | 0.66 | 1.60 | 1.89 | 1.53 | 0.76 | 0.68 | 1.52 | |||||
| () | 0 | 2 | 0 | 2 | 0 | 0 | 2 | 0 | 2 | 0 | |||||
The adsorption energies for atomic O and C are written in Appendix B (see Table 12). The most favorable positions on pristine MoSe2 are and for O and C, respectively. Therefore, as dissociative adsorption configuration of CO on the pristine monolayer we consider that each atom adsorbs at its most energetically favorable position. Since the separation between adjacent and sites is smaller than one lattice constant, we account for the two following configurations. In the first one, denoted , C and O adsorb each atop first nearest Mo and Se neghbors, respectively. In the second one, , C and O are adsorbed atop second nearest Mo and Se neighbors. Since the O in the first configuration ends at the position after relaxation, in the following we will refer to this configuration as . All these results are summarized in Table 6. Even if the dissociation energy of CO in the pristine MoSe2 surface is roughly a factor two smaller than the gas-phase value, the process remains highly endothermic. In particular, revPBE-vdW predicts 6.589 eV for as the lowest dissociation energy, while with eV is the energetically favored dissociation configuration according to PBE-D3. There are differences between and that not only refer to the energetics, but also to the C and O adsorption height, the induced surface distortions, and remarkably, the spin-magnetization that changes from zero to 2 as the C-O distance increases. According to revPBE-vdW and PBE-D3, the dissociation energy, the overall adsorption structure, and the total magnetic moment for (i.e., C and O adsorbed at second nearest Mo-Se neighbors) are already very similar to the results obtained when considering the atoms adsorbed at infinitely separated sites (compare the properties to and to the C and O atomic adsorption properties summarized in Table 12 in Appendix B).
The analysis of the charge transfer distribution allows us to understand better the differences between the and configurations, including the very different spin magnetization. The Bader charge analysis assigns a rather similar charge to C and also to O in the two situations. In , the C and O Bader charge transfer are 0.75 and 0.88 , respectively, whereas 0.82 and O 0.94 are the corresponding values when the atoms adsorb at second nearest Mo-Se neighbors. The induced electron density plotted in Figs. 11(a) and (b) clarifies that the differences arise from the different surface atoms involved in the bindings. In , the strong bond between the O atom and its nearest Se, which is also close to C, breaks the three-fold symmetry of the site, restricting the binding of the C atom to the two other Se atoms [see the side view in Fig. 11(a)]. In contrast, since O binds to a different Se in , the C atom forms strong bonds with its three nearest Se. The charge rearrangement induced by these new bonds also extends to the Mo beneath. The corresponding spin magnetization density of Fig. 11 shows that the finite spin-magnetic moment is in fact localized at this Mo atom. We have verified that this is exactly the charge and spin rearrangement that a single C atom induces when adsorbing on the pristine surface.
Regarding the dissociative adsorption of CO on MoSe2-vSe, Table 12 in Appendix B shows that the adsorption energies of the two atomic species at the Se vacancy are similar and highly exothermic ( eV with PBE-D3, for instance). Therefore, we consider the following dissociatively adsorbed configurations: C is at the vacancy and O at its also stable site [], O is at the vacancy and C is either at the first [] or the second [] nearest site from the vacancy. The properties of the optimized configurations are summarized in Table 6. Although the dissociation process close to the vacancy is still endothermic, there is a significant reduction in that now varies within 1–2 eV, depending on the configuration and calculation method. Among the studied configurations, with a revPBE-vdW (PBE-D3) dissociation energy of 1.620 (1.263) eV is the less endothermic. The corresponding value differs in less than 15 (30) meV, suggesting that the interaction between the adsorbed atoms (and also between the perturbations induced locally) is minor. The induced electron density is shown in Fig. 11(e). Clearly, the local perturbation created by the adsorbed O is similar to the one observed for in the pristine MoSe2 surface [Fig. 11(b)]. This similarity is in accordance with the aforementioned minor interaction between the adsorbates. The C and O Bader charge transfer are 0.86 and 0.79 in this configuration.
As Table 6 shows, when O is adsorbed at the Se vacancy, does not significantly depend on whether C is adsorbed at or . However, the spin magnetization does. The comparative analysis of the induced electron density between both configurations shows that the situation is similar to what is observed for and in MoSe2 [cf., Figs. 11(c) and (d)]. When the adsorbed C and O are well separated, the C atom binds to the three nearest Se, causing a strong spin-polarized charge rearrangement around the Mo below. In this situation the C and O Bader charge transfer are 0.75 and 1.01 , respectively.
It is important to remark that in the configuration the distance between the two ions is only d(C-O) 2.4 Å. Therefore, this configuration might be considered as an intermediate step for dissociation. The Bader charge transfer to C and O are reduced being 0.62 and 0.99 respectively. Remarkably, if one considers that two Se vacancies are present at neighbor positions in the surface, the process becomes exothermic. The revPBE-vdW (PBE-D3) dissociation energy becomes (3.036) eV. This result is close to what one obtains considering that the two Se vacancies are isolated 2.498 (3.094) eV.
III.4 NO adsorption and dissociation

| revPBE-vdW | |||||||
|---|---|---|---|---|---|---|---|
| (eV) | 0.201 | 0.212 | 0.216 | 0.220 | 0.216 | 2.471 | |
| d(N-O)(Å) | 1.163 | 1.161 | 1.161 | 1.162 | 1.163 | 1.276 | |
| (Å) | 3.84 | 3.66 | 3.64 | 3.51 | 3.55 | 0.09 | |
| 51∘ | 36∘ | 56∘ | 36∘ | 43∘ | 3∘ | ||
| 48∘ | 86∘ | 87∘ | 60∘ | 5∘ | 87∘ | ||
| () | 1 | 1 | 1 | 1 | 1 | 1 | |
| PBE-D3 | |||||||
| (eV) | 0.185 | 0.176 | 0.195 | 0.200 | 0.204 | 2.778 | |
| d(N-O)(Å) | 1.159 | 1.157 | 1.158 | 1.159 | 1.159 | 1.265 | |
| (Å) | 3.38 | 3.19 | 3.14 | 3.16 | 3.12 | 0.05 | |
| 51∘ | 20∘ | 54∘ | 30∘ | 45∘ | 4∘ | ||
| 47∘ | 73∘ | 46∘ | 66∘ | 87∘ | 86∘ | ||
| () | 1 | 1 | 1 | 1 | 1 | 1 | |
The revPBE-vdW (PBE-D3) prediction for the NO(gas) bond length is 1.162 (1.159) Å, in good agreement with the experimental value (1.154 Å) NIS . In contrast, the revPBE-vdW (PBE-D3) dissociation energy of gas-phase NO, (7.748) eV, overestimates the experimental eV that we calculate by adding the NO(gas) ZPE of 117 meV Irikura (2007) to the experimental value of 6.548 eV Benson (1965).
Similarly to what we obtained for the previous diatomic molecules, the structural relaxation suggests that NO may adsorb on any of the five sites that were studied in MoSe2. The results are summarized in Table 7. All the relaxation calculations start with the NO molecular axis perpendicular to the surface, being the N atom the closest to the surface. According to revPBE-vdW, the energetically preferred adsorption site is with eV. In contrast, PBE-D3 predicts that the most energetically favorable position is in between a Se-Mo bond (), being eV. Nonetheless, the difference between the and adsorption energies is only 4 meV in each case. This small difference is possibly beyond the numerical precision and we can consider that the two positions are degenerated. Actually, the adsorption energies of the five sites differ in less than 20 meV, suggesting a rather planar potential energy surface. In this respect, a normal mode analysis for yields soft modes for translation on the surface and rotation around the surface normal ( 8meV). Furthermore, the molecule is weakly bounded along the surface normal [ 15 (12) meV with revPBE-vdW (PBE-D3)]. With 20 meV, the mode associated to NO tilting is slightly higher. Altogether, these results and the minor Bader charge transfer ( 0.05 ) imply that NO is weakly physisorbed on MoSe2.
Figure 12(a) shows the optimized structure for NO adsorbed on MoSe2 at together with the corresponding band structure and DOS. The aforementioned weak interaction agrees with the lack of dispersion in the NO-dominated bands (red bands and corresponding sharp peaks in the -like contribution of the N- and O-projected DOS) and the fact that these bands do not overlap with the MoSe2 ones. We note that the adsorption of NO in the MoSe2 monolayer has been studied in Refs. Panigrahi et al. (2019); Ai et al. (2019) using PBE-D2. In general, the reported adsorption properties are in good agreement with our results. The exception is the adsorption energy, which is smaller for PBE-D2, as also found in adsorption studies performed on other TMD monolayers by Zhao et al., using different functionals Zhao et al. (2014). The revPBE-vdW and PBE-D3 adsorption energies of NO on the MoS2 monolayer calculated by these authors are similar to the ones that we obtain for MoSe2.
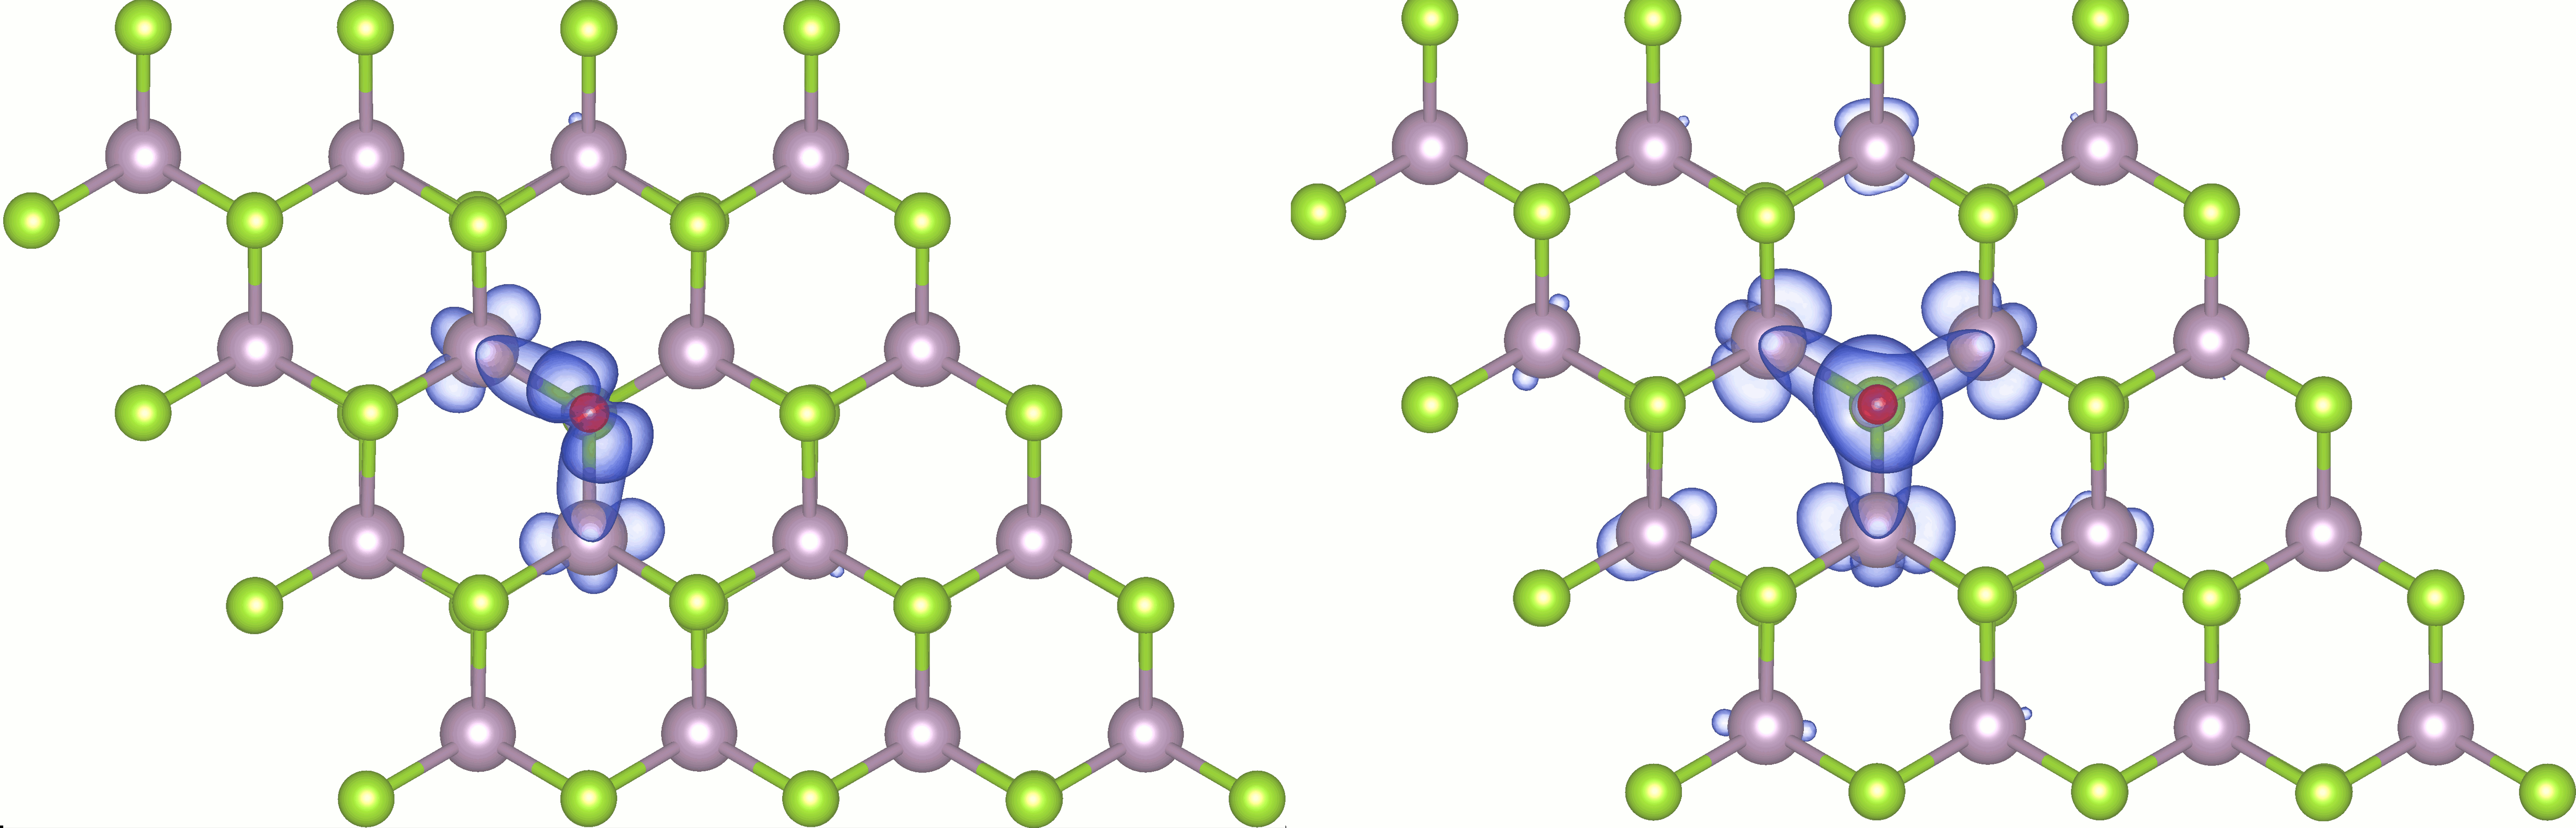
Also in Table 7 we report the results for NO adsorption on MoSe2-vSe (). The molecule is slightly elongated and stays nearly perpendicular to the surface with the N atom well inside the vacancy, as can be observed in Fig. 12(b). The revPBE-vdW (PBE-D3) adsorption energy () eV suggests that adsorption on the vacancy is quite stable. The normal mode analysis confirms the stability at low temperatures, since all the modes have energies, 20 meV. In particular, the mode related to desorption (translation perpendicular to the surface) is 40 meV. Noticeably, the spin magnetic moment is as in the gas-phase and physisorbed NO cases. At first sight, this result surprises because the Bader charge analysis assigns 0.74 to NO at this position. The induced electron density and spin-magnetization density in Fig. 13 show that NO binds to the three nearest Mo and, as a result, the spin moment is not longer localized on NO, but it also involves one Mo.
The band structure and DOS represented in Fig. 12(b) clarify the formation and properties of these bonds. In common to the case of CO adsorbed at the vacancy, the MoSe2-vSe in-gap states disappear, while two nearly flat and degenerate new states appear. The atom-projected DOS shows that these states involve the -like orbitals of NO and the -like orbitals of the Mo atoms beneath. As for CO chemisorption, the system acquires -type semiconductor character. The main difference to the CO case is that not only the spin-majority bands, but also one of the spin-minority are occupied, thus a spin excitation is not the lowest energy one. The partial electron density of the quasi-degenerate spin-up bands and the occupied spin-down band are represented in Fig. 14, explaining the spin-magnetization density of the system [see Fig. 13(b)]. Moreover, the highest occupied state that can be mostly attributed to the MoSe2 surface exhibits its maximum at the -high-symmetry point. This is different from the valence band maximum of the isolated surface that occurs at the high-symmetry -point.
Recent DFT studies that account for vdW corrections in the adsorption of NO at the chalcogen vacancy of monolayer MoS2 Li et al. (2016); Ma et al. (2016); Li and Shi (2018) and WSe2 Ma et al. (2017) predict adsorption energies in the order of the ones obtained here. Interestingly, the overall appearance of the MoS2 band structure around the Fermi level when NO adsorbs at the S vacancy of MoS2 Li et al. (2016) resembles that of Fig. 12(b).
| revPBE-vdW | ||||
|---|---|---|---|---|
| N + O | ||||
| (eV) | 3.784 | 0.711 | 1.927 | |
| eV) | 3.722 | 0.701 | 1.825 | |
| d(N-O)(Å) | 3.65 | 4.02 | 4.11 | |
| (Å) | 1.77 | 1.73 | 0.79 | |
| (Å) | 1.62 | 0.67 | 1.60 | |
| () | 1 | 1 | 0 | |
| PBE-D3 | ||||
| N + O | ||||
| (eV) | 3.626 | 0.838 | 2.043 | |
| eV) | 3.573 | 0.811 | 1.995 | |
| d(N-O)(Å) | 3.56 | 4.02 | 4.02 | |
| (Å) | 1.68 | 1.64 | 0.81 | |
| (Å) | 1.54 | 0.70 | 1.52 | |
| () | 1 | 1 | 0 | |
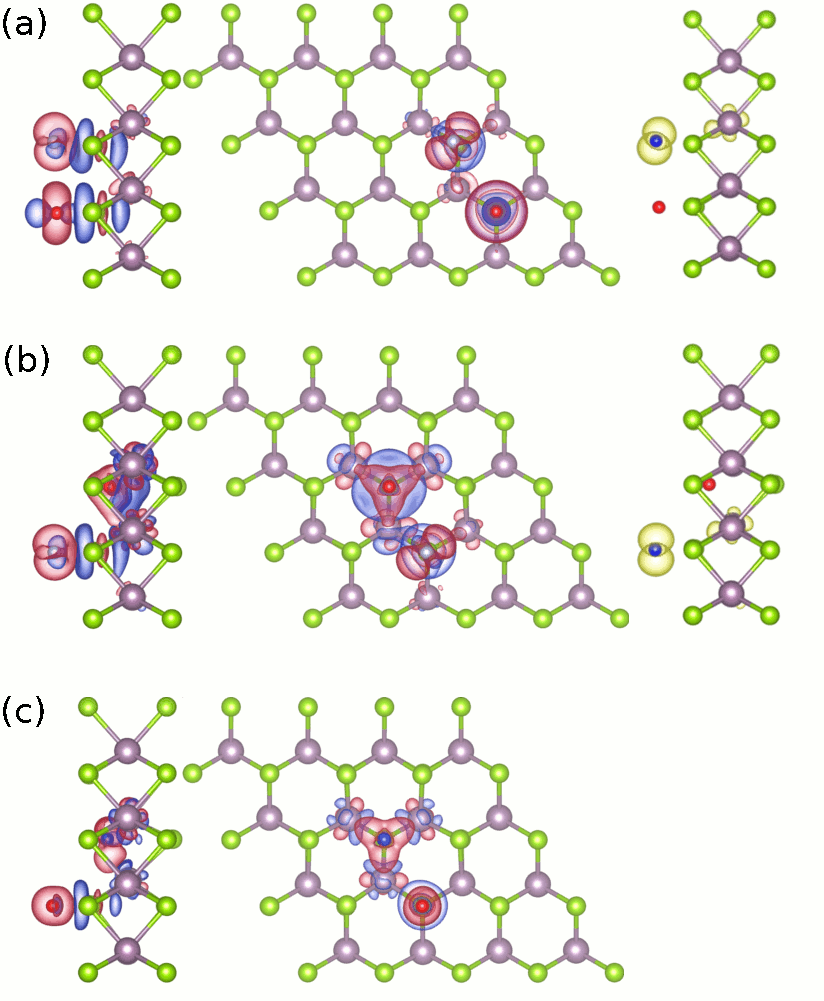
Because is the energetically preferred site for the atomic adsorption of N and O (see Appendix B), we focus our study on the dissociative adsorption of NO on MoSe2 to the case in which both N and O end adsorbed at different positions. Our results are summarized in Table 8. The dissociation process at the MoSe2 surface is still endothermic, being the revPBE-vdW (PBE-D3) dissociation energy 3.784 (3.626) eV. The difference of around 60 meV between and values points to a very minor interaction between the adsorbed N and O. Note, for instance, that this difference is one order of magnitude smaller than the one we obtained for O2 dissociation in the same configuration. The induced electron density of the dissociated configuration in Fig. 15(a) shows that each atom is strongly bounded to the Se below, being the Bader charge transfer for N and O, 0.60 and 0.85 , respectively. The spin-magnetization density in the same figure shows that the finite spin magnetic moment is located both around the N and one of the closest Mo.
To study the dissociation of NO in the vicinity of a Se vacancy we consider two cases, namely, the O atom is adsorbed at the Se vacancy and the N atom at a position separated by a lattice constant [] and vice verse []. In Table 8 we summarize our results. Interestingly, the process becomes exothermic in both cases, being the dissociated configuration the most exothermic with a revPBE-vdw (PBE) value, () eV. The corresponding induced density displayed in Fig. 15(c) resembles that of the dissociative adsorption of CO at the configuration. The N atom, which adsorbs well inside the vacancy, binds to its three closest Mo, while the O atom does to the Se below. According to the Bader charge analysis N gains 1.08 , slightly larger than the 0.86 obtained for C in the configuration. The charge transfer towards the O atom is the same as in the for the pristine surface. The zero spin magnetic moment in this configuration contrasts with the result obtained for dissociation in the case. Figure 15(b) shows clearly that the spin-magnetization is caused by the adsorption of N at the site, in accordance to the results obtained for dissociation in the pristine surface. Note also that the charge rearrangement induced in the vacancy is similar irrespective of being occupied by the N or the O atom. This also agrees with the similar Bader charge transfer assigned to O at the vacancy ( 1.00 ). On the other hand, the N atoms takes 0.69 of charge.
Finally, as found for the rest of diatomic molecules, the dissociation energy will become highly exothermic if the N and O end adsorbed at two adjacent Se vacancies. The revPBE-vdW (PBE-D3) prediction in this case is () eV. These values are similar to the ones obtained when one considers that the two Se vacancies are isolated from each other, - eV.
IV Conclusions
By means of density functional theory calculations we have studied the adsorption and dissociation of different diatomic molecules, H2, O2, CO, and NO, on the monolayer MoSe2, including the case of having an isolated Se vacancy (MoSe2-vSe). Our study was aimed to characterize not only the adsorption properties (i.e., adsorption geometry, energetics, and stability of the adsorbate), but also the effect that the adsorbate has on the monolayer electronic structure.
In all the cases the MoSe2 surface holds several active sites for molecular adsorption. The adsorption mechanism in the pristine surface is physisorption. In the presence of Se vacancies the physics gets richer as the diatomic molecules form strong chemical bonds with the MoSe2-vSe sheet. Upon H2 chemisorption at the Se vacancy, no noticeably changes in the MoSe2-vSe electronic structure are observed. However, the situation is different when any of the other three molecules chemisorbs: The MoSe2-vSe in-gap states disappear and new bonding states are formed near the valence band maximum. In the case of O2, a single spin degenerated flat band appears that overlaps in energy with the valence band maximum of MoSe2-vSe. As a consequence, the gap of the composed system is quite similar to that of the pristine MoSe2 monolayer. In the case of CO and NO, two new and quasi-degenerated states form above the valence band maximum. These states, being partially occupied by 2 and 3 electrons, creates a spin magnetization of 2 and 1 that is spatially localized in the region around the adsorbate. The remaining empty states that lie just above the Fermi level give a -type semiconductor character to the system.
Although the pristine MoSe2 monolayer facilitates the dissociation process, it remains endothermic for the four molecules studied here. The dissociation energy is considerably reduced in the presence of a single Se vacancy. Still, only the dissociation of O2 ( eV) and NO ( eV) becomes exothermic. Nonetheless, our calculations reveal that a larger concentration of Se vacancies favours the dissociation in all cases. In particular, dissociation at two adjacent Se vacancies is exothermic for the four molecules studied here. Finally, we note that adsorption of atomic H, C, and N, also induces a finite spin-magnetization in the system, but it is more localized than in the case of the molecules.
Acknowledgements.
The authors acknowledge financial support by the Gobierno Vasco-UPV/EHU Project No. IT1246-19 and the Spanish Ministerio de Ciencia e Innovación [Grant No. PID2019-107396GB-I00/AEI/10.13039/501100011033]. This research was conducted in the scope of the Transnational Common Laboratory (LTC) “QuantumChemPhys – Theoretical Chemistry and Physics at the Quantum Scale”. Computational resources were provided by the DIPC computing center.Appendix A Characterization of the MoSe2 system
A.1 Bulk -MoSe2
| (Å) | (Å) | (eV) | |
| revPBE-vdW (this work) | 3.386 | 13.890 | 1.08 |
| PBE-D3 (this work) | 3.283 | 12.720 | 0.75 |
| PBE-D2 Refs. Tongay et al. (2012); Kim and Choi (2021) | 3.317 | 13.032 | 0.84 |
| GW Ref. Kim and Choi (2021) | 1.15 | ||
| LDA Ref. Böker et al. (2001) | 3.299 | 12.938 | |
| Experiment Ref. Zemann (1965) | 3.289 | 12.927 | |
| Experiment Ref. Kam and Parkinson (1982) | 1.12 | ||
| Experiment Ref. Baglio (1982) | 1.22 | ||
| Experiment Ref. Tonndorf et al. (2013) | 1.1 |
The common bulk structure in group VI TMD semiconductors, including bulk MoSe2, is the phase. It consists of an hexagonal lattice formed by planes of Mo atoms sandwiched between two layers of Se atoms. The results of our revPBE-vdW and PBE-D3 calculations for the phase of bulk MoSe2 are compared in Table 9 to available experimental values. The experimental lattice parameters, Å and Å Zemann (1965), are better reproduced by PBE-D3 than by revPBE-vdW. In contrast, the latter provides a better value of the measured indirect band-gap ( = 1.1-1.2 eV Kam and Parkinson (1982); Baglio (1982); Tonndorf et al. (2013)) than the former. For comparison, we also include in Table 9 the results obtained by other authors using the local density approximation (LDA) Böker et al. (2001) and PBE-D2 Tongay et al. (2012); Kim and Choi (2021).
A.2 -MoSe2 monolayer
The MoSe2 monolayer in the phase Zhang et al. (2018) can be obtained, for example, by exfoliation of the bulk phase. The atoms are organized in an hexagonal lattice with lattice constant equal to the bulk one Ohuchi et al. (1991). Although it is beyond the scope of this work, the phonon dispersion of the MoSe2 monolayer has been previously studied in different DFT studies, demonstrating its dynamical stability Li et al. (2014b); Ding et al. (2011); Mahrouche et al. (2021). In Table 10 we compare our DFT results for the distances between the three atoms that are contained in the primitive cell to the DFT values obtained by other authors using different exchange-correlation functionals. In the last two columns of the same table, we show the results for the band-gap energy obtained from two different calculations, namely, corresponds to the value predicted by our standard DFT calculation that neglects the spin-orbit coupling (SOC) and is the value obtained when SOC is included using the vasp implementation Steiner et al. (2016). The SOC introduces a splitting in the band structure at the high-symmetry -point that reduces the band-gap in 100 meV. It is worth remarking that this is in good agreement with angle resolved photo-electron spectroscopy (ARPES) experiments showing that the MoSe2 monolayer exhibits a direct band-gap at the high symmetry -point of 1.52 eV Lu et al. (2014); Shaw et al. (2014), with a splitting around the valence band maximum of 100–200 meV Beal et al. (1972); Böker et al. (2001); Rasmussen and Thygesen (2015). This splitting is clearly observed in the PBE-D3 band structure of Fig 16 (computed in the primitive cell). The band structure evaluated with and without SOC (red and red black, respectively) are shown together to remark the differences that appear between the two calculations. In the same figure we include the DOS and its projection onto the -states of Mo (orange) and -states of Se (green). The minor effect that SOC causes in the adsorption and dissociation energies of the molecules studied in this work is analyzed in Appendix C.
| d(Mo-Se) (Å) | d(Se-Se) (Å) | (eV) | (eV) | ||
| revPBE-vdW (this work) | 3.386 | 2.579 | 3.363 | 1.30 | 1.17 |
| PBE-D3 (this work) | 3.282 | 2.531 | 3.357 | 1.54 | 1.45 |
| PBE-D2 Refs. Tongay et al. (2012); Kim and Choi (2021) | 3.320 | 3.332 | 1.35 | ||
| HSE06 Ref. Kang et al. (2013) | 3.320 | 2.540 | 1.33 | 1.14 | |
| PBE Ref. Horzum et al. (2013) | 3.321 | 2.528 | 3.293 | 1.50 | |
| HSE Ref. Kang et al. (2013) | 3.290 | 2.510 | 1.52 | 1.25 | |
| GW Ref. Kim and Choi (2021) | 2.08 | ||||
| GVJ-2e Ref. Gusakova et al. (2017) | 2.03 | ||||
| Experiment Refs Lu et al. (2014); Shaw et al. (2014) | 1.56 | ||||
| Experiment Ref. Tonndorf et al. (2013) | 1.10 | ||||
A.3 -MoSe2 monolayer with a Se vacancy
| revPBE-vdW | ||||
| 3.8599 | 3.8601 | 3.8600 | ||
| (MoSe2-vSe+Se) | 3.6720 | 3.7560 | 3.7928 | |
| 5.07 | 5.02 | 5.04 | ||
| PBE-D3 | ||||
| 7.0051 | 7.0052 | 7.0052 | ||
| (MoSe2-vSe+Se) | 7.0197 | 7.0142 | 7.0111 | |
| 5.82 | 5.78 | 5.76 | ||
Let us now consider the case in which Se vacancies are present in the MoSe2 sheet (MoSe2-vSe). Our aim is to describe the limiting case in which the concentration of Se vacancies is so small that they can be considered as isolated. Therefore, as a first step we have to determine the size of the supercell that assures a negligible interaction between the periodically repeated vacancies. To do so, we define a chemical potential , related to the creation of an isolated Se vacancy, as
| (7) |
where , (MoSe2-vSe), and (Se) are the vasp total energies of MoSe2, MoSe2-vSe, and Se, respectively, that are calculated using the same supercell. (The subscript refers to the size of the calculation cell).
The values for different supercell sizes are summarized in Table 11. In all cases the cell contains 23 Å of vacuum along the surface normal. The linear extrapolation to is 5.0 and 5.72 eV for revPBE-vdW and PBE-D3, respectively. The results in the table show that for the 44 cell, finite-size effects in the chemical potential are below 1%. Hence, this has been the supercell used in this work unless otherwise stated.
Figure 16 shows the MoSe2-vSe band structure and DOS computed in the supercell. Compared to the MoSe2 band structure shown in the same figure, we clearly identify the in-gap states that appear above the Fermi level as a consequence of the Se vacancy, reducing in practice the band-gap energy. In the same figure, we show the projection of the total DOS into the -states of Molybdenum and -states of Selenium that dominate around the band-gap. Note that the in-gap states are not completely degenerated in our case. In this respect, it is worth remarking the theoretical study of Ref. Iberi et al. (2016) showing that the in-gap states break their degeneracy when the concentration of Se vacancies is finite. The splitting increases as the concentration of Se vacancies increases. Interestingly, for a vacancy concentration of 12%, the authors found that the in-gap state is split into two bands all over the Brillouin zone except at the -point. The splitting that we observe in our case is consistent to the one reported for our vacancy concentration of 3%.
”The presence of the Se vacancy induces a small shrink of the lattice around it. To evaluate that distortion, we calculate the ions displacement with respect to their (optimized) crystal positions in the pristine MoSe2 monolayer. To avoid spurious finite size effects, we restrict ourselves to the atoms that lie at a distance from the vacancy position that is smaller than half the shortest dimension of the simulation cell. In the 44 supercell this restriction corresponds to the first, second, and third Mo nearest neighbors and to the first and second Se neighbors. The average distortion that is induced at those five positions is 0.13, 0.06, 0.01, 0.11, and 0.02 Å, respectively.”
Appendix B Atomic adsorption
| revPBE-vdW | PBE-D3 | |||||||||||||
| atom | ||||||||||||||
| H | (eV) | 0.388 | 0.115 | 0.446 | 0.689 | 2.715 | 0.240 | 0.115 | 0.074 | 0.333 | 0.580 | 2.674 | ||
| (Å) | 1.61 | 2.10 | 1.52 | 1.30 | 0.84 | 1.61 | 1.85 | 2.65 | 1.45 | 1.19 | 0.83 | |||
| () | 1 | 1 | 1 | 1 | 1 | 1 | 1 | 1 | 1 | 1 | 1 | |||
| O | (eV) | -2.872 | 0.313 | 7.614 | ||||||||||
| (Å) | 1.60 | 0.67 | 1.55 | 2.10 | 0.62 | |||||||||
| () | 0 | 0 | 0 | 2 | 0 | |||||||||
| C | (eV) | 1.617 | 2.178 | 7.150 | 1.990 | 2.756 | 7.580 | |||||||
| (Å) | 1.93 | 0.07 | 0.92 | 1.82 | 0.03 | 0.91 | ||||||||
| () | 2 | 2 | 0 | 2 | 2 | 0 | ||||||||
| N | (eV) | 0.712 | 0.168 | 0.172 | 0.161 | 0.163 | 6.259 | 0.945 | 0.178 | 0.182 | 0.183 | 0.180 | 6.512 | |
| (Å) | 1.75 | 2.77 | 2.75 | 2.88 | 2.88 | 0.77 | 1.67 | 2.40 | 2.30 | 2.35 | 2.35 | 0.80 | ||
| () | 1 | 3 | 3 | 3 | 3 | 0 | 1 | 3 | 3 | 3 | 3 | 0 | ||
In this appendix we analyze the adsorption on MoSe2 of the different atoms that compose the diatomic molecules that we study in the main text: H2, O2, CO, and NO. The objective is to determine the most energetically favorable adsorption position among the five candidates that we propose, namely, , , , , and . Also following the main text, we study the atomic adsorption at an isolated Se vacancy, . Table 12 summarizes the revPBE-vdW and PBE-D3 predictions for the adsorption energy , adsorbate distance from the surface , and the total magnetic moment . After relaxing the system, there are cases in which the adsorption position was unstable (the atom ends in another of the five sites), this is indicated in the table with the symbol “-”.
The most energetically favorable position for H is (in agreement with Ref. Tsai et al. (2014)), with H adsorbed at a distance 1.5 Å from the surface and with = 0.689 (0.580) eV according to the revPBE-vdW (PBE-D3) calculation. It is worth remarking that while PBE-D3 predicts stability for all the five positions, the position is unstable with revPBE-vdW. Adsorption at a Se vacancy is characterized by a much larger adsorption energy, 2.7 eV, with H located about 0.8 Å below the MoSe2-vSe surface.
For Oxygen, both functionals predict that the most energetically favorable position is , with O located at 1.6 Å above the surface. The corresponding revPBE-vdW and PBE-D3 adsorption energies are 2.872 and 3.230 eV, respectively. At variance with the revPBE-vdW results, PBE-D3 also predicts a weaker adsorption at the position. In this case, the adsorbed O retains the spin-magnetic moment of 2 . Adsorption at a Se vacancy with the O atom located at 0.65 Å below the surface is much more favorable, being the revPBE-vdW (PBE-D3) adsorption energy 7.300 (-7.614) eV.
In the case of Carbon, with a revPBE-vdW (PBE-D3) calculated () eV is the energetically preferred adsorption site, with C located at only 0.05 Å from the surface. Furthermore, revPBE-vdW and PBE-D3 also predict a weaker adsorption at the site. As in previous cases, adsorption at a Se vacancy is highly exothermic ( eV with revPBE-vdW and eV with PBE-D3) and the C atom adsorbs below the surface (0.9 Å).
Nitrogen adsorption is energetically favorable in all the five positions that we have tested. However, the adsorption energy for is more than four times larger than for any of the other positions. It is worth remarking that the total magnetic moment of the system is finite and located around the N atom in all the studied cases. However, only when N adsorbs on , the magnetic moment is reduced from the gas-phase value of 3 to . As in all previous cases, adsorption at a Se vacancy is strongly favored, with -6.256 (-6.512) eV for revPBE-vdW (PBE-D3). In this situation, there is a Bader charge transfer to N of and no magnetic moment is appreciable around N.
To conclude this appendix it is worth noticing that for O, C, and N, PBE-D3 predicts larger adsorption energies for the most energetically favorable configuration than revPBE-vdW. On the contrary, for H it occurs the opposite. In all cases the agreement in the structural configuration and magnetic state is good.
Atomic adsorption on the pristine MoSe2 surface was studied in Ref. Ma et al. (2011) using PBE as the exchange-correlation functional. The reported adsorption energy and sites for H, O, C, and N are following this order: 0.021, 3.160, 2.599, and 0.714 eV at , , , and . For the last three cases, the PBE adsorption energies are within the PBE-D3 and revPBE-vdW values of Table 12. However, for the case of Hydrogen a much weaker adsorption energy is reported. We aatribute this discrepancy to the use of a different functional (PBE with no vdW correction) and, most probably, to the fact that only the , and positions were tested in their case.
Appendix C Spin-orbit coupling effect
| (eV) | (eV) | ||||||||
|---|---|---|---|---|---|---|---|---|---|
| MoSe2 | MoSe2-vSe | MoSe2 | MoSe2-vSe | ||||||
| No SOC | SOC | No SOC | SOC | No SOC | SOC | No SOC | SOC | ||
| H2 | 0.049 | 0.049 | 0.539 | 0.531 | 3.378 | 3.371 | 1.256 | 1.259 | |
| O2 | 0.172 | 0.086 | 2.266 | 2.260 | 1.039 | 1.058 | 3.947 | 3.936 | |
| CO | 0.145 | 0.126 | 1.317 | 1.317 | 5.700 | 5.715 | 1.263 | 1.268 | |
| NO | 0.204 | 0.205 | 2.778 | 2.772 | 3.626 | 3.639 | 2.043 | 2.048 | |
As discussed in Appendix A, SOC reduces the MoSe2 band-gap by about 100 meV (see Fig 16). The reason is the splitting that occurs at the conduction band minimum and valence band maximum around the high symmetry -point, as already confirmed by angle-resolved photo-electron spectroscopy Böker et al. (2001) and transmission spectra Beal et al. (1972) experiments. Our purpose in this appendix is to determine whether this reduction in the band gap may alter the adsorption and dissociation energies of the diatomic molecules we study in this work. For simplicity, the analysis is restricted to the PBE-D3 results and, unless otherwise stated, to the most energetically favored adsorption configurations. Each of the optimized PBE-D3 configurations are again relaxed with a PBE-D3 calculation that also includes SOC, using the same relaxation criteria as before. In Table 13 we compare our results for the adsorption energy with and without SOC. For H2, CO, and NO adsorbed on the pristine MoSe2 surface, the differences in the adsorption energy calculated with and without SOC are small (i.e., 20 meV). However, in the case of O2, the SOC calculation predicts a notable reduction in the adsorption energy (-0.086 eV versus -0.172 eV). On the other hand, when adsorption occurs at a Se vacancy, the SOC effect in is almost negligible in all cases.
Similarly, we systematically study the effect that SOC has in the dissociation energies of H2, O2, CO and NO. As in the previous case, the analysis is restricted to the most energetically favored dissociation configurations. Therefore, for dissociation of H2, O2, CO, and NO we consider following this order, (2H), (2O), , and in the case of MoSe2 and (H) +(H), (O) + (O), and in the case of MoSe2-vSe. The effect in all cases is small being the largest one for the dissociation of O2 on the pristine surface ( 20 meV). Although for simplicity we have not included it on the table, the difference for the other dissociation positions that are commented in the main text is of the same order. All in all, this analysis suggests that the standard DFT calculations that neglect SOC can be safely used in our study.
References
- Novoselov et al. (2004) K. S. Novoselov, A. K. Geim, S. V. Morozov, D. Jiang, Y. Zhang, S. V. Dubonos, I. V. Grigorieva, and A. A. Firsov, Science 306, 666 (2004).
- Liu et al. (2013) G. Liu, S. Ahsan, A. G. Khitun, R. K. Lake, and A. A. Balandin, J. Appl. Phys. 114, 154310 (2013).
- Tyagi et al. (2020) D. Tyagi, H. Wang, W. Huang, L. Hu, Y. Tang, Z. Guo, Z. Ouyang, and H. Zhang, Nanoscale 12, 3535 (2020).
- Muoi et al. (2019) D. Muoi, N. N. Hieu, H. T. Phung, H. V. Phuc, B. Amin, B. D. Hoi, N. V. Hieu, L. C. Nhan, C. V. Nguyen, and P. Le, Chem. Phys. 519, 69 (2019).
- Ai et al. (2019) W. Ai, L. Kou, X. Hu, Y. Wang, A. V. Krasheninnikov, L. Sun, and X. Shen, J. Phys-Condens. Mat. 31, 445301 (2019).
- dos Santos et al. (2021) R. M. dos Santos, W. F. da Cunha, W. F. Giozza, R. T. de Sousa Júnior, L. F. Roncaratti, and L. A. Ribeiro Júnior, Chem. Phys. Lett 771, 138495 (2021).
- Liang et al. (2021) Q. Liang, Q. Zhang, X. Zhao, M. Liu, and A. T. S. Wee, ACS Nano (2021), 10.1021/acsnano.0c09666.
- Revolinsky et al. (1965) E. Revolinsky, G. Spiering, and D. Beerntsen, J. Phys. Chem. Solids 26, 1029 (1965).
- Lian et al. (2018) C.-S. Lian, C. Si, and W. Duan, Nano Lett. 18, 2924 (2018), pMID: 29652158.
- Duan et al. (2015) X. Duan, C. Wang, A. Pan, R. Yu, and X. Duan, Chem. Soc. Rev. 44, 8859 (2015).
- Tongay et al. (2012) S. Tongay, J. Zhou, C. Ataca, K. Lo, T. S. Matthews, J. Li, J. C. Grossman, and J. Wu, Nano Lett. 12, 5576 (2012), pMID: 23098085.
- Jin et al. (2018) C. Jin, E. Y. Ma, O. Karni, E. C. Regan, F. Wang, and T. F. Heinz, Nat. Nanotechnol. 13, 994 (2018).
- Li et al. (2019) Y. Li, J. Shi, Y. Mi, X. Sui, H. Xu, and X. Liu, J. Mater. Chem. C 7, 4304 (2019).
- Yao et al. (2008) W. Yao, D. Xiao, and Q. Niu, Phys. Rev. B 77, 235406 (2008).
- Xiao et al. (2012) D. Xiao, G.-B. Liu, W. Feng, X. Xu, and W. Yao, Phys. Rev. Lett. 108, 196802 (2012).
- Ulstrup et al. (2017) S. Ulstrup, A. G. c. v. a. c. Čabo, D. Biswas, J. M. Riley, M. Dendzik, C. E. Sanders, M. Bianchi, C. Cacho, D. Matselyukh, R. T. Chapman, E. Springate, P. D. C. King, J. A. Miwa, and P. Hofmann, Phys. Rev. B 95, 041405 (2017).
- Xuan and Quek (2020) F. Xuan and S. Y. Quek, Phys. Rev. Research 2, 033256 (2020).
- Wang et al. (2015) G. Wang, L. Bouet, M. M. Glazov, T. Amand, E. L. Ivchenko, E. Palleau, X. Marie, and B. Urbaszek, 2D Mater. 2, 034002 (2015).
- Kumar et al. (2014) N. Kumar, J. He, D. He, Y. Wang, and H. Zhao, Nanoscale 6, 12690 (2014).
- Lyons et al. (2019) T. P. Lyons, S. Dufferwiel, M. Brooks, F. Withers, T. Taniguchi, K. Watanabe, K. S. Novoselov, G. Burkard, and A. I. Tartakovskii, Nat. Commun. 10, 2330 (2019).
- Gong et al. (2013) Z. Gong, G.-B. Liu, H. Yu, D. Xiao, X. Cui, X. Xu, and W. Yao, Nat. Commun. 4, 2053 (2013).
- Wu et al. (2013) S. Wu, J. S. Ross, G.-B. Liu, G. Aivazian, A. Jones, Z. Fei, W. Zhu, D. Xiao, W. Yao, D. Cobden, and X. Xu, Nat. Phys. 9, 149 (2013).
- Arora et al. (2018) A. Arora, M. Koperski, A. Slobodeniuk, K. Nogajewski, R. Schmidt, R. Schneider, M. R. Molas, S. M. de Vasconcellos, R. Bratschitsch, and M. Potemski, 2D Mater. 6, 015010 (2018).
- Zhao et al. (2021) Y. Zhao, L. Du, S. Yang, J. Tian, X. Li, C. Shen, J. Tang, Y. Chu, K. Watanabe, T. Taniguchi, R. Yang, D. Shi, Z. Sun, Y. Ye, W. Yang, and G. Zhang, “Optically and magnetically addressable valley pseudospin of interlayer excitons in bilayer MoS2,” (2021).
- Liu et al. (2017) X. Liu, T. Ma, N. Pinna, and J. Zhang, Adv. Funct. Mater. 27, 1702168 (2017).
- Ping et al. (2017) J. Ping, Z. Fan, M. Sindoro, Y. Ying, and H. Zhang, Adv. Funct. Mater. 27, 1605817 (2017).
- Zeng et al. (2018) Y. Zeng, S. Lin, D. Gu, and X. Li, Nanomaterials-Basel 8 (2018), 10.3390/nano8100851.
- Vargas-Bernal (2019) R. Vargas-Bernal, Sensors 19 (2019), 10.3390/s19061295.
- Donarelli and Ottaviano (2018) M. Donarelli and L. Ottaviano, Sensors 18 (2018), 10.3390/s18113638.
- Li et al. (2014a) H. Li, J. Wu, Z. Yin, and H. Zhang, Accounts Chem. Res. 47, 1067 (2014a).
- Cho et al. (2015) B. Cho, M. G. Hahm, M. Choi, J. Yoon, A. R. Kim, Y.-J. Lee, S.-G. Park, J.-D. Kwon, C. S. Kim, M. Song, Y. Jeong, K.-S. Nam, S. Lee, T. J. Yoo, C. G. Kang, B. H. Lee, H. C. Ko, P. M. Ajayan, and D.-H. Kim, Sci. Rep-UK 5, 8052 (2015).
- Kumar et al. (2020) R. Kumar, N. Goel, M. Hojamberdiev, and M. Kumar, Sensors Actuat A: Phys 303, 111875 (2020).
- Ma et al. (2011) Y. Ma, Y. Dai, M. Guo, C. Niu, J. Lu, and B. Huang, Phys. Chem. Chem. Phys. 13, 15546 (2011).
- Nagarajan and Chandiramouli (2018) V. Nagarajan and R. Chandiramouli, J. Mol. Graph. Mod. 81, 97 (2018).
- Zhao et al. (2014) S. Zhao, J. Xue, and W. Kang, Chem. Phys. Lett. 595-596, 35 (2014).
- Babar et al. (2019) V. Babar, H. Vovusha, and U. Schwingenschlögl, ACS Appl. Nano Mater. 2, 6076 (2019).
- Chaurasiya and Dixit (2019) R. Chaurasiya and A. Dixit, Appl. Surf. Sci. 490, 204 (2019).
- Chaurasiya and Dixit (2020) R. Chaurasiya and A. Dixit, Phys. Chem. Chem. Phys. 22, 13903 (2020).
- Dou et al. (2021) H. Dou, B. Yang, X. Hu, C. Huo, X. Wang, and C. Shi, Comp. Theor. Chem. 1195, 113089 (2021).
- Late et al. (2014) D. J. Late, T. Doneux, and M. Bougouma, Appl. Phys. Lett. 105, 233103 (2014).
- Zhang et al. (2017) S. Zhang, T. H. Nguyen, W. Zhang, Y. Park, and W. Yang, Appl. Phys. Lett. 111, 161603 (2017).
- Guo et al. (2019) S. Guo, D. Yang, S. Zhang, Q. Dong, B. Li, N. Tran, Z. Li, Y. Xiong, and M. E. Zaghloul, Adv. Funct. Mater. 29, 1900138 (2019).
- Ren et al. (2019a) J. Ren, H. Liu, Y. Xue, and L. Wang, Nanoscale Res. Lett. 14, 293 (2019a).
- Yang et al. (2020) Z. Yang, D. Zhang, and D. Wang, Sensors Actuat B: Chem 304, 127369 (2020).
- Koós et al. (2019) A. A. Koós, P. Vancsó, M. Szendrő, G. Dobrik, D. Antognini Silva, Z. I. Popov, P. B. Sorokin, L. Henrard, C. Hwang, L. P. Biró, and L. Tapasztó, The J. Phys. Chem. C 123, 24855 (2019).
- Panigrahi et al. (2019) P. Panigrahi, T. Hussain, A. Karton, and R. Ahuja, ACS Sens. 4, 2646 (2019).
- Choi et al. (2017) S. Y. Choi, Y. Kim, H.-S. Chung, A. R. Kim, J.-D. Kwon, J. Park, Y. L. Kim, S.-H. Kwon, M. G. Hahm, and B. Cho, ACS Appl. Mater. Inter. 9, 3817 (2017), pMID: 28058836.
- Liu et al. (2021) Y. Liu, T. Shi, Q. Si, and T. Liu, Phys. Lett. A 391, 127117 (2021).
- Ni et al. (2020) J. Ni, W. Wang, M. Quintana, F. Jia, and S. Song, Appl. Surf. Sci. 514, 145911 (2020).
- Ren et al. (2019b) J. Ren, Y. Xue, and L. Wang, Chem. Phys. Lett. 733, 136631 (2019b).
- Guo et al. (2021) J.-X. Guo, S.-Y. Wu, S.-Y. Zhong, G.-J. Zhang, G.-Q. Shen, and X.-Y. Yu, Appl. Surf. Sci. 565, 150558 (2021).
- Aguilar et al. (2020) N. Aguilar, M. Atilhan, and S. Aparicio, Appl. Surf. Sci. 534, 147611 (2020).
- Zhang et al. (2019) Y. Zhang, X. Sun, S. Tan, T. Liu, and H. Cui, Appl. Surf. Sci. 487, 930 (2019).
- Abbas et al. (2018) H. G. Abbas, T. T. Debela, S. Hussain, and I. Hussain, RSC Adv. 8, 38656 (2018).
- Pal Kaur et al. (2021) S. Pal Kaur, T. Hussain, and T. J. Dhilip Kumar, J. Appl. Phys. 130, 014501 (2021).
- Shu et al. (2017) H. Shu, D. Zhou, F. Li, D. Cao, and X. Chen, ACS Appl. Mater. Inter. 9, 42688 (2017), pMID: 29152972.
- Lee et al. (2018) J. Lee, S. Kang, K. Yim, K. Y. Kim, H. W. Jang, Y. Kang, and S. Han, J. Phys. Chem. Lett. 9, 2049 (2018), pMID: 29621882.
- Jain et al. (2020) A. Jain, M. B. Sadan, and A. Ramasubramaniam, The J. Phys. Chem. C 124, 12324 (2020).
- German and Gebauer (2020) E. German and R. Gebauer, Appl. Surf. Sci. 528, 146591 (2020).
- Karmodak and Andreussi (2021) N. Karmodak and O. Andreussi, The J. Phys. Chem. C 125, 10397 (2021).
- Mohanty et al. (2018) B. Mohanty, M. Ghorbani-Asl, S. Kretschmer, A. Ghosh, P. Guha, S. K. Panda, B. Jena, A. V. Krasheninnikov, and B. K. Jena, ACS Catal. 8, 1683 (2018).
- Giuffredi et al. (2021) G. Giuffredi, T. Asset, Y. Liu, P. Atanassov, and F. Di Fonzo, ACS Materials Au 1, 6 (2021).
- Chan et al. (2014) K. Chan, C. Tsai, H. A. Hansen, and J. K. Nørskov, ChemCatChem 6, 1899 (2014).
- Kang et al. (2019) S. Kang, S. Han, and Y. Kang, ChemSusChem 12, 2671 (2019).
- Ye et al. (2021) J. Ye, D. Rao, and X. Yan, New J. Chem. 45, 5350 (2021).
- Kresse and Furthmüller (1996) G. Kresse and J. Furthmüller, Phys. Rev. B 54, 11169 (1996).
- Dion et al. (2004) M. Dion, H. Rydberg, E. Schröder, D. C. Langreth, and B. I. Lundqvist, Phys. Rev. Lett. 92, 246401 (2004).
- Grimme et al. (2010) S. Grimme, J. Antony, S. Ehrlich, and H. Krieg, J. Chem. Phys. 132, 154104 (2010).
- Perdew et al. (1996) J. P. Perdew, K. Burke, and M. Ernzerhof, Phys. Rev. Lett. 77, 3865 (1996).
- Grimme et al. (2011) S. Grimme, S. Ehrlich, and L. Goerigk, J. Comput. Chem. 32, 1456 (2011).
- Blöchl (1994) P. E. Blöchl, Phys. Rev. B 50, 17953 (1994).
- Kresse and Joubert (1999) G. Kresse and D. Joubert, Phys. Rev. B 59, 1758 (1999).
- Monkhorst and Pack (1976) H. J. Monkhorst and J. D. Pack, Phys. Rev. B 13, 5188 (1976).
- Amadon et al. (2008) B. Amadon, F. Lechermann, A. Georges, F. Jollet, T. O. Wehling, and A. I. Lichtenstein, Phys. Rev. B 77, 205112 (2008).
- Karolak et al. (2011) M. Karolak, T. O. Wehling, F. Lechermann, and A. I. Lichtenstein, J. Phys-Condens. Mat. 23, 085601 (2011).
- Schüler et al. (2018) M. Schüler, O. E. Peil, G. J. Kraberger, R. Pordzik, M. Marsman, G. Kresse, T. O. Wehling, and M. Aichhorn, J. Phys-Condens. Mat. 30, 475901 (2018).
- Momma and Izumi (2011) K. Momma and F. Izumi, J. Appl. Phys. Crystallogr. 44, 1272 (2011).
- Ong et al. (2013) S. P. Ong, W. D. Richards, A. Jain, G. Hautier, M. Kocher, S. Cholia, D. Gunter, V. L. Chevrier, K. A. Persson, and G. Ceder, Comp. Mater. Sci. 68, 314 (2013).
- Tang et al. (2009) W. Tang, E. Sanville, and G. Henkelman, J. Phys-Condes. Mat. 21, 084204 (2009).
- Henkelman et al. (2006) G. Henkelman, A. Arnaldsson, and H. Jónsson, Comp. Mater. Sci. 36, 354 (2006).
- (81) NIST Standard Reference Database Number, Vol. 101 (Gaithersburg: National Institute of Standards and Technology).
- Irikura (2007) K. K. Irikura, J. Phys. Chem. Ref. data 36, 389 (2007).
- Darwent (1970) B. d. Darwent, Washington: National Bureau of Standards 31 (1970).
- Benson (1965) S. W. Benson, J. Chem. Edu. 42, 502 (1965).
- Zhou et al. (2015) C. Zhou, W. Yang, and H. Zhu, J. Chem. Phys. 142, 214704 (2015).
- He et al. (2010) J. He, K. Wu, R. Sa, Q. Li, and Y. Wei, Appl. Phys. Lett. 96, 082504 (2010).
- Yazyev and Helm (2007) O. V. Yazyev and L. Helm, Phys. Rev. B 75, 125408 (2007).
- Boukhvalov et al. (2008) D. W. Boukhvalov, M. I. Katsnelson, and A. I. Lichtenstein, Phys. Rev. B 77, 035427 (2008).
- González-Herrero et al. (2016) H. González-Herrero, J. M. Gómez-Rodríguez, P. Mallet, M. Moaied, J. J. Palacios, C. Salgado, M. M. Ugeda, J.-Y. Veuillen, F. Yndurain, and I. Brihuega, Science 352, 437 (2016).
- Li et al. (2016) H. Li, M. Huang, and G. Cao, Phys. Chem. Chem. Phys. 18, 15110 (2016).
- Bui et al. (2015) V. Q. Bui, T.-T. Pham, D. A. Le, C. M. Thi, and H. M. Le, J. Phys-Condens. Mat. 27, 305005 (2015).
- Chen et al. (2015) B. Chen, H. Sahin, A. Suslu, L. Ding, M. I. Bertoni, F. M. Peeters, and S. Tongay, ACS Nano 9, 5326 (2015), pMID: 25868985.
- Liu et al. (2015) H. Liu, N. Han, and J. Zhao, RSC Adv. 5, 17572 (2015).
- Zhao et al. (2017) B. Zhao, C. Shang, N. Qi, Z. Chen, and Z. Chen, Appl. Surf. Sci. 412, 385 (2017).
- Wang and Paulus (2021) K. Wang and B. Paulus, The J. Phys. Chem. C 125, 19544 (2021).
- Zhou et al. (2021) W. Zhou, L. Dong, L. Tan, and Q. Tang, J. Phys-Condens Mat 33, 395002 (2021).
- Ma et al. (2017) D. Ma, B. Ma, Z. Lu, C. He, Y. Tang, Z. Lu, and Z. Yang, Phys. Chem. Chem. Phys. 19, 26022 (2017).
- Ma et al. (2016) D. Ma, Q. Wang, T. Li, C. He, B. Ma, Y. Tang, Z. Lu, and Z. Yang, J. Mater. Chem. C 4, 7093 (2016).
- Li and Shi (2018) F. Li and C. Shi, Appl. Surf. Sci. 434, 294 (2018).
- Kim and Choi (2021) H.-g. Kim and H. J. Choi, Phys. Rev. B 103, 085404 (2021).
- Böker et al. (2001) T. Böker, R. Severin, A. Müller, C. Janowitz, R. Manzke, D. Voß, P. Krüger, A. Mazur, and J. Pollmann, Phys. Rev. B 64, 235305 (2001).
- Zemann (1965) J. Zemann, Acta Crystallogr. 18, 139 (1965).
- Kam and Parkinson (1982) K. K. Kam and B. A. Parkinson, J. Phys. Chem-us 86, 463 (1982).
- Baglio (1982) J. A. Baglio, J. Electrochem. Soc. 129, 1461 (1982).
- Tonndorf et al. (2013) P. Tonndorf, R. Schmidt, P. Böttger, X. Zhang, J. Börner, A. Liebig, M. Albrecht, C. Kloc, O. Gordan, D. R. T. Zahn, S. M. de Vasconcellos, and R. Bratschitsch, Opt. Express 21, 4908 (2013).
- Zhang et al. (2018) X. Zhang, Z. Lai, Q. Ma, and H. Zhang, Chem. Soc. Rev. 47, 3301 (2018).
- Ohuchi et al. (1991) F. Ohuchi, T. Shimada, B. Parkinson, K. Ueno, and A. Koma, J. Crys. Grownth 111, 1033 (1991).
- Li et al. (2014b) Y. Li, Y.-L. Li, W. Sun, and R. Ahuja, Comp. Mater. Sci. 92, 206 (2014b).
- Ding et al. (2011) Y. Ding, Y. Wang, J. Ni, L. Shi, S. Shi, and W. Tang, Physica B: Condensed Matter 406, 2254 (2011).
- Mahrouche et al. (2021) F. Mahrouche, K. Rezouali, F. Zaabar, and A. Molina-Sánchez, “Phonons in MoSe2/WSe2 van der Waals heterobilayer,” (2021).
- Steiner et al. (2016) S. Steiner, S. Khmelevskyi, M. Marsmann, and G. Kresse, Phys. Rev. B 93, 224425 (2016).
- Lu et al. (2014) X. Lu, M. I. B. Utama, J. Lin, X. Gong, J. Zhang, Y. Zhao, S. T. Pantelides, J. Wang, Z. Dong, Z. Liu, W. Zhou, and Q. Xiong, Nano Lett. 14, 2419 (2014).
- Shaw et al. (2014) J. C. Shaw, H. Zhou, Y. Chen, N. O. Weiss, Y. Liu, Y. Huang, and X. Duan, Nano Res. 7, 511 (2014).
- Beal et al. (1972) A. R. Beal, J. C. Knights, and W. Y. Liang, J. Phys. C Solid State 5, 3540 (1972).
- Rasmussen and Thygesen (2015) F. A. Rasmussen and K. S. Thygesen, The J. Phys. Chem. C 119, 13169 (2015).
- Kang et al. (2013) J. Kang, S. Tongay, J. Zhou, J. Li, and J. Wu, Appl. Phys. Lett. 102, 012111 (2013).
- Horzum et al. (2013) S. Horzum, H. Sahin, S. Cahangirov, P. Cudazzo, A. Rubio, T. Serin, and F. M. Peeters, Phys. Rev. B 87, 125415 (2013).
- Gusakova et al. (2017) J. Gusakova, X. Wang, L. L. Shiau, A. Krivosheeva, V. Shaposhnikov, V. Borisenko, V. Gusakov, and B. K. Tay, Phys. Status. Solidi A 214, 1700218 (2017).
- Iberi et al. (2016) V. Iberi, L. Liang, A. V. Ievlev, M. G. Stanford, M.-W. Lin, X. Li, M. Mahjouri-Samani, S. Jesse, B. G. Sumpter, S. V. Kalinin, D. C. Joy, K. Xiao, A. Belianinov, and O. S. Ovchinnikova, Sci. Rep-UK 6, 30481 (2016).
- Tsai et al. (2014) C. Tsai, K. Chan, F. Abild-Pedersen, and J. K. Nørskov, Phys. Chem. Chem. Phys. 16, 13156 (2014).