The spectral weight of hole doped cuprates across the pseudogap critical point
Abstract
One of the most widely discussed features of the cuprate high superconductors is the presence of a pseudogap in the normal state [1, 2]. Recent transport and specific heat measurements have revealed an abrupt transition at the pseudogap critical point, denoted , characterized by a drop in carrier density [3, 4, 5] and a strong mass enhancement [6, 7]. In order to give more details about this transition at , we performed low-temperature infrared spectroscopy in the normal state of cuprate superconductors La2-xSrxCuO4 (LSCO) and La1.8-xEu0.2SrxCuO4 (Eu-LSCO) for doping contents across the pseudogap critical point (from to ). Through the complex optical conductivity , we can extract the spectral weight, , of the narrow Drude peak due the coherent motion of the quasi-particles, and the spectral weight enclosed inside the mid-infrared (MIR) band, , caused by coupling of the quasi-particles to collective excitations of the many-body system. is smaller than a third of the value predicted by band calculations, and forms a dome as a function of doping. We observe a smooth doping dependence of through , and demonstrate that this is consistent with the observed doping dependence of the carrier density and the mass enhancement. We argue that the superconducting dome is the result of the confluence of two opposite trends, namely the increase of the density of the quasi-particles and the decrease of their coupling to the collective excitations as a function of doping.
pacs:
74.25.F, 74.45.+c, 74.70.TxI Introduction
The rich phase diagram of hole doped cuprates is a major challenge in condensed matter physics. In addition to superconductivity with the highest superconducting at ambient pressure ( K) it contains several other competing phases including the pseudogap that is most prominent for very low carrier concentrations. While many proposals have been made about the nature of the pseudogap phase, the microscopic description thereof is not universally agreed upon [1, 2]. Moreover, the superconducting pairing mechanism as well as its link to the pseudogap phase has not been established beyond any doubt. When the carrier density exceeds the value where the highest is observed (the so-called “optimal doping”), a critical point is reached where the pseudogap vanishes. At this critical doping two important signatures have been observed: firstly the carrier density observed by Hall effect [3, 4, 8] and thermal transport [5] jumps from to indicating a major Fermi surface reconstruction, secondly the density of states and associated effective mass observed by NMR [9] and specific heat [6, 7] is strongly enhanced at and exhibits a logarithmic divergence in temperature. The jump in and the strong renormalization of at the critical doping underline that the pseudogap phase terminates at this point by a quantum phase transition. The close proximity of to optimal doping further suggests a key role in the mechanism of superconductivity in the cuprates [10].
Two additional ordering phenomena occur at a doping level close to the point where the pseudogap vanishes: (i) A change of crystal structure from tetragonal at high doping to orthorhombic (approximately a superstructure) at low doping [11, 12, 13]. (ii) A Lifshitz transition of the Fermi surface topology: at low doping it is a hole-like pocket centered at the Brillouin zone corner, at high doping it is an electron-like pocket around the Brillouin zone center [14, 15, 16]. For La2-xSrxCuO4 (LSCO) both the structural transition [12] and the Lifshitz transition [15] have been situated at . For La1.8-xEu0.2SrxCuO4 (Eu-LSCO) the structural phase diagram is more complex due to three different structural variants [13], but the electronic specific heat is strongly peaked at [6]. At approximately the same doping also the orthorhombic distortion disappears [13]. Approximately the same critical doping is observed for the Lifshitz transition, the vanishing of the pseudogap and the structural transition. In the sequel, we will for each of the two types of compounds of the present study refer to a single critical doping, namely and .
Previous optical studies on bismuth and mercury cuprate families [17, 18, 19] have demonstrated that the free carrier spectral weight is far below the band calculations and approaches zero at zero doping. These studies have also demonstrated the coupling to high energy degrees of freedom far exceeding those of phonons supporting the possibility of an electronic pairing mechanism. However, the strongly overdoped side of the phase diagram has remained unexplored and the high of the Hg1201 and Bi2212 families has limited the accessible temperature range where the normal state properties could be analyzed.
To elucidate this puzzle, we measured infrared optics and extracted the complex optical conductivity in the normal state of two cuprates, LSCO and Eu-LSCO for four dopings across the pseudogap critical point p∗: 0.12, 0.15, 0.21 and 0.24 (a total of six samples). In LSCO and Eu-LSCO, the pseudogap line delimited by is well defined both by transport measurements [20] and ARPES [21]. Compared to other cuprates, the of LSCO and Eu-LSCO is relatively low, and thus interesting for extracting the normal state properties down to low temperatures without using external magnetic fields.
The parent compound of LSCO and Eu-LSCO is La2CuO4. Substituting La by Sr introduces holes amounting to a hole concentration . Substituting La with Eu does not introduce holes or electrons, but it modifies the maximum of the superconducting critical temperature (): in Eu-LSCO = 15-20 K versus = 30-40 K in LSCO. The high temperature crystal structure of LSCO and Eu-LSCO for all Sr concentrations is body centered tetragonal (space group ) with lattice parameters Å and Å. For LSCO with doping , the low temperature structure is single-face-centered orthorhombic (space group ) with, for the undoped parent compound, Å, Å, and Å [11, 12, 13]. The orthorhombic distortion corresponds to a rotation of the CuO6 octahedra such as to buckle the Cu-O squares along the direction, causing the lattice parameter to be smaller than [22]. Accordingly, in-plane anisotropy has been observed for the magnetic susceptibility [23], the DC resistivity [24] and the optical conductivity [25] of untwinned crystals with doping concentrations . The LSCO and Eu-LSCO crystals used for the present study were prepared as described in Refs. 26, 27, 6, 28. Since in the orthorhombic phase, these crystals were -plane micro twinned, the properties reported in the present study represent the effective medium average of -axis and -axis properties. X-ray diffraction was used to align and select the surface, which for part of the samples was chosen parallel to the plane and for the other ones perpendicular to such as to obtain surface dimensions of at least 0.5 mm2. A polarizer was used for selecting the optical response parallel to the CuO2 planes.
II Optical conductivity
We measured the infrared reflectivity from 2 meV to 0.5 eV using a Fourier transform spectrometer with a home design UHV optical flow cryostat and in-situ gold evaporation for calibrating the signal. In the energy range from 0.5 eV to 5 eV we measured real and imaginary parts of the dielectric function using a home-design UHV cryostat installed in a Visible-UV ellipsometer. Combining the ellipsometry and reflectivity data and using the Kramers-Kronig relations between the reflectivity amplitude and phase, provided for each measured temperature the complex optical conductivity spectrum in the range from 2 meV to 5 eV.
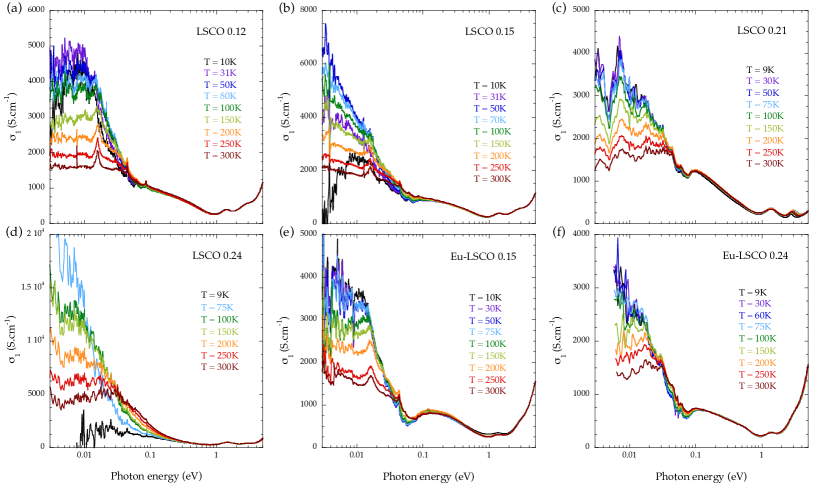
The optical conductivity spectra of LSCO and Eu-LSCO hole-doped from to are presented in Fig. 1. The doping content corresponds to the “optimal” doping where is maximum [29, 30]. In these figures, we clearly observe a broad MIR band located around 0.1-0.3 eV, which is more pronounced in underdoped and optimally doped samples compared to the Drude response. Below , a depletion at low energy is present, corresponding to the superconducting gap.
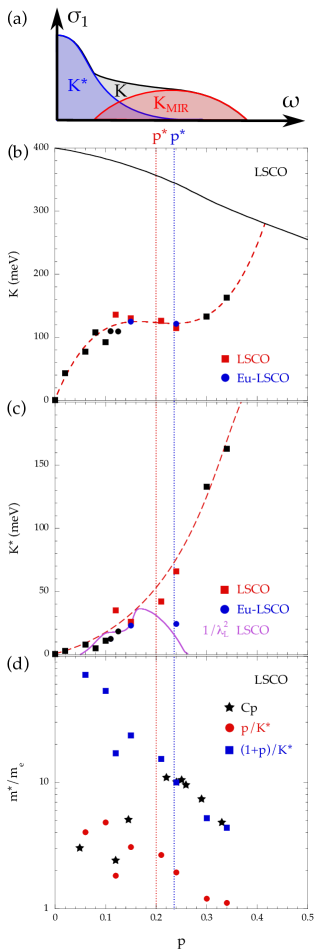
The optical conductivity probes the collective response due to the free charge carriers, phonons, and inter-band transitions. For a non-interacting Fermi-gas, the free charge response is described by a zero-energy mode (the Drude peak) with a spectral weight and the width corresponding to the (frequency independent) scattering rate. If we take into account coupling to phonons or collective excitations of the electron many-body system, part of the Drude spectral weight is transferred to a mid-infrared band (MIR band) at higher energy, carrying a spectral weight . These two components, schematically sketched in Fig. 2(a), are clearly visible in the experimental spectra shown in Figs. 1(a-f). The residual Drude response carries a spectral weight . The total spectral weight becomes
| (1) |
A convenient tool for the analysis of the optical conductivity of an interacting electron liquid is provided by the extended Drude model, where both the scattering rate and the effective mass ratio are frequency dependent functions [37, 38, 39]. For two-dimensional materials, like cuprates, the extended Drude model can be written as
| (2) |
where represents the distance between two CuO2 planes, and is the band mass. In this expression the relation between spectral weight , density and mass of the free charge carriers is provided by the expression . A slight rearrangement of terms in Eq. 2 provides
| (3) |
which is a particularly useful expression in the context of a Fermi liquid. In this case, the scattering rate and effective mass of the quasi-particles are given by and respectively. The coherent Drude spectral weight can be defined as
| (4) |
Experimentally, we obtain from an integration of the real part of the optical conductivity
| (5) |
with the cut-off frequency chosen below the interband transitions and above the MIR band (1 eV in the present case). An equivalent way to obtain , and , providing the same values, is fitting the spectra with a linear superposition of Lorentzians, and extracting the different spectral weights associated to each intra-band transition: for the narrow Drude response and for the broad MIR band.
III Spectral weight analysis
In the experimental optical conductivities shown in Fig. 1, the two main contributions in the total spectral weight are from the coherent Drude response and the broad MIR band . Phonons contribute less than 10% to the total spectral weight . In Figs. 2(b,c) and Fig. 3(a), we report the value of , and as a function of doping. Our data in blue circles (Eu-LSCO) and red squares (LSCO) correspond to the lowest temperature we can reach in the normal state (slightly above ). Black squares and black circles are values extracted from published data in low doped and highly doped samples [31, 32, 33, 34]. The red dashed curve is a guide to the eye.
Fig. 2(b) shows the doping dependence of the total spectral weight . The black curve represents the spectral weight of the sheet conductance obtained from the calculated bandstructure [41] using the expression [17, 42]
| (6) |
where is the occupancy of the state with momentum and spin , is the energy-momentum dispersion, is the interplanar lattice spacing and is the sample volume. The bandstructure calculation of Ref. 41 was done for the high temperature tetragonal crystal structure of La2CuO4. Here we assume that the band dispersion is doping independent. These model assumptions do not (and are not intended to) account for the low temperature orthorhombic structure and/or emerging electronic order in part of the phase diagram. For a two-dimensional free electron gas, Eq. 6 provides . The effect of interactions is to transfer part of this spectral weight to interband transitions, which typically spread over a range of 10 eV. An additional effect of electron-electron interactions and electron-phonon coupling is to distribute the free carrier optical conductivity over a “coherent” zero-energy peak and an “incoherent” mid-infrared band. For , the unit cell is doubled and consequently we expect folding of the band structure to occur. This will normally cause a change of the free carrier spectral weight roughly in proportion to the to reduction of the number of free charge carriers. As stated above, this effect is not taken into account in the bandstructure calculation shown in Fig. 2(b). A recent ab initio band structure calculation [43] has shown that, while antiferromagnetic correlations have a strong effect on the band dispersion, the orthorhombic distortion causes band splittings of order 0.1 eV. The spectral weight removed from the then reappears in the interband transitions in the mid-infrared range. For this reason, the calculated shown in Fig. 2(b) should be compared to the experimental (i.e. instead of ).
For , the experimental value of initially increases roughly proportional to the hole doping . Then, between and , remains at an almost constant value of about 125 meV, which falls a factor 3 below . This significant reduction of the free carrier spectral weight can be explained by the fact , where is small inside the pseudogap state. Above , finally increases again, and the extrapolation of the experimental data reaches the band value around .
In Fig. 2(c) the narrow Drude spectral weight is presented as a function of doping. Similar as for , in the insulating phase and it increases gradually when the system gains more and more holes. It increases continuously, approximately as a quadratic function of doping, up to , without any noticeable anomaly (i.e. a kink or a jump) at . In a free electron approximation where , our observations for would be in conflict with the sharp transition in carrier density observed in the DC transport data [3, 4, 5]. However, for an interacting Fermi liquid, the Drude spectral weight is obtained by replacing in Eq. 6 with the quasiparticle energy . This expression mixes two different quantities, and , both of which undergo important changes around . A detailed description of the doping dependence of requires ad hoc assumptions about the evolution of the electronic structure in the pseudogap phase. Instead, staying close to the experimentally observed quantities, we present in Fig. 2(d) a comparison between the effective mass obtained from the linear term of the specific heat [7] using the relation , and the effective mass from the spectral weight of the zero-energy mode assuming a Fermi liquid using (blue squares) and a doped Mott insulator using (red circles). We see that matches for , and for . This comparison puts in evidence a transition in the carrier density around , in agreement with the transition observed by transport measurements.
In a recent study of LSCO [15], the linear term in the specific heat, , which is proportional to the density of states at , was compared to the value expected from the electronic band structure measured with angle resolved photoelectron spectroscopy (ARPES), with the result that measured with ARPES gives a in overdoped LSCO well below the specific heat value. It was speculated that the mass enhancement of in the electronic specific heat results from quantum criticality emerging from the pseudogap collapse. The good agreement Fig. 2(d) between the optical data and specific heat on the overdoped side would suggest that the renormalization of the spectral function near the critical doping , is more easily resolved with optics than with ARPES.
For comparison, the penetration depth is plotted in Fig. 2(c) as a solid purple line [35, 36]. As inside the superconducting state, we can calculate the superconducting spectral weight of the condensed Cooper pairs. From to the optimally doped sample , , which is what we should expect if the pair breaking gap is much bigger than the residual scattering rate . This observation does not in itself allow to distinguish between the BCS limit where is much smaller than the Fermi energy , or the opposite case corresponding to Bose-Einstein condensation of preformed pairs [44, 45, 46, 47, 48]. On the overdoped side, the observation that goes to zero while keeps increasing, indicates that . This is a natural consequence of becoming smaller for reasons that we will discuss below.
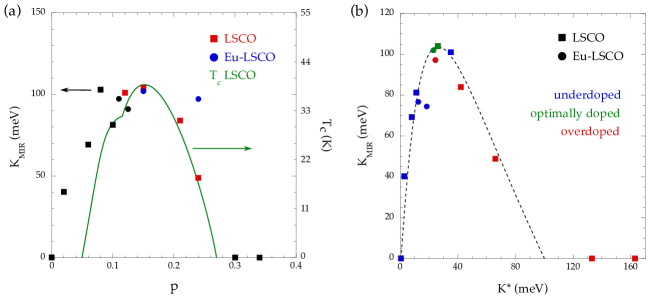
By knowing and , we can directly extract , the spectral weight enclosed inside the MIR band corresponding to the electronic correlations in the extended Drude model. We show as a function of doping in Fig. 3(a) and compare it with (solid green curve [40]). We give another representation of this behaviour in Fig. 3(b), where is plotted as a function of , which is a monotonously increasing function of doping. The three colors represent the different doping regions: underdoped in blue, optimally doped in green and overdoped in red. It is interesting to note that this representation results in a smoother doping dependence, indicating that any scatter in the doping value obtained from sample stoichiometry (for example oxygen off-stoichiometry) is absent when we use as a measure of the charge carrier density. We observe that the MIR spectral weight forms a dome with a maximum around , i.e. meV. This doping value matches the optimal doping for obtained in Refs. 35, 36. This correlation of the MIR spectral weight and as a function of doping suggests that the strength of the MIR band reveals an important part of the superconducting pairing interaction.
In Ref. 17, a linear relation between and , was reported for HgBa2CuO4+δ (Hg1201), Bi2Sr2CaCu2O8-δ (Bi-2212) and Bi2Sr2CuO6+δ (Bi-2201) with eV. In contrast, the results for LSCO and Eu-LSCO shown in Fig. 2(c) follow a superlinear dependence. The aforementioned linear relation would give eV at , which is two times higher than the value for LSCO shown in Fig 2(c). Given that the planes of LSCO are buckled whereas Hg1201, Bi-2212, and Bi-2201 have flat planes, we postulate that the buckling of the planes of LSCO causes a further suppression of in addition to the effect of the pseudogap that is common to all cuprate high superconductors.
IV and the spectral weight
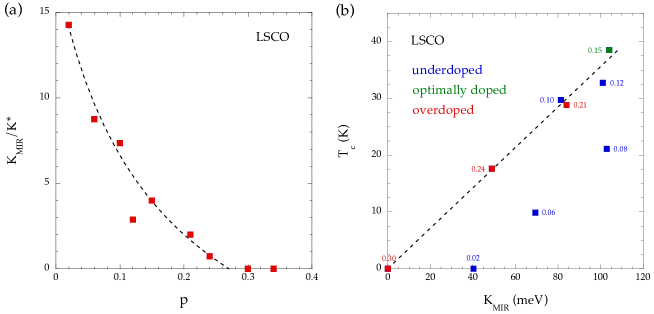
For the overdoped samples where no band folding is present (), the ratio describes the mass enhancement due to the coupling to electronic and vibrational collective excitations. At the underdoped side of the phase diagram where , is reduced due to two effects, namely the reconstruction of the Fermi surface due to band folding, as well as mass enhancement due to many-body effects. In Fig. 4(a), is represented as a function of doping content in red squares. The black dashed line is a guide to the eye. In the underdoped region, is very high and goes to infinity down to . This is consistent with the notion that the charge in a Mott-insulator is fully localized, hence bound at a non-zero energy. In the overdoped region, becomes indistinguishable from zero within the measurement accuracy for , coinciding with the upper doping limit of the superconducting dome. In Fig. 3(a), the -like dome of puts in evidence a potential link between and . For this reason, in Fig. 4(b), we plot as a function of . Underdoped samples are in blue squares, optimally doped in green square and overdoped samples in red squares. For , we find a proportionality between these two quantities (with the familiar exception at doping), which implies that the broad MIR band not only results from coupling of the electrons to collective (spin, charge and vibrational) excitations, but also that this coupling mediates superconducting pairing. For the strongly underdoped samples () is much lower, indicating that in the underdoped region the coupling to collective excitations contributes only in part to the superconducting pair formation.
V Conclusions
In this study, the optical conductivity was measured in the normal state of La2-xSrxCuO4 and La1.8-xEu0.2SrxCuO4 at four doping contents and across the pseudogap critical point . The free carrier spectral weight exhibits the following trends as a function of doping: (i) the total spectral weight is much smaller than the band calculation, illustrating the consequences of the pseudogap state and the strong electronic correlations in the underdoped region. (ii) The coherent spectral weight increases continuously and smoothly from to without any noticeable transition. Due to a compensating effect in , which is proportional to the ratio of carrier density over effective mass, this is consistent with anomalies near p∗ observed in the specific heat and the Hall constant. (iii) The spectral weight of the broad MIR band forms a dome looking alike the superconducting dome and T, putting in evidence a candidate for the pairing mechanism revealed by the MIR band. In particular, goes to zero at the same doping value where the intensity of the MIR band becomes negligible. (iv) in the underdoped region and in the overdoped region.
Taken together, the superconducting dome in the phase diagram of LSCO and Eu-LSCO cuprates is the result of two competing phenomema, namely (i) the density of charge carriers available for superconductivity characterized by , which vanishes for doping and (ii) the pairing interaction revealed by , which drops to zero at high doping.
The datasets generated and analyzed during the cur-rent study are available in Ref. 49 and will be preserved for 10 years.
Acknowledgments
We thank Antoine Georges and Christophe Berthod for fruitful discussions, and Bernd Büchner, Sunseng Pyon, Tomohiro Takayama, and Hidenori Takagi for providing samples. This project was supported by the Swiss National Science Foundation through project 200020-179157.
References
- Keimer et al. [2015] B. Keimer, S. A. Kivelson, M. R. Norman, S. Uchida, and J. Zaanen, From quantum matter to high-temperature superconductivity in copper oxides, Nature 518, 179 (2015).
- Vishik [2018] I. M. Vishik, Photoemission perspective on pseudogap, superconducting fluctuations, and charge order in cuprates: a review of recent progress, Reports on Progress in Physics 81, 062501 (2018).
- Badoux et al. [2016] S. Badoux, W. Tabis, F. Laliberté, G. Grissonnanche, B. Vignolle, D. Vignolles, J. Béard, D. A. Bonn, W. Hardy, R. Liang, N. Doiron-Leyraud, L. Taillefer, and C. Proust, Change of carrier density at the pseudogap critical point of a cuprate superconductor, Nature 531, 210 (2016).
- Collignon et al. [2017] C. Collignon, S. Badoux, S. A. A. Afshar, B. Michon, F. Laliberté, O. Cyr-Choinière, J.-S. Zhou, S. Licciardello, S. Wiedmann, N. Doiron-Leyraud, and L. Taillefer, Fermi-surface transformation across the pseudogap critical point of the cuprate superconductor La1.6-xNd0.4SrxCuO4, Phys. Rev. B 95, 224517 (2017).
- Michon et al. [2018] B. Michon, A. Ataei, P. Bourgeois-Hope, C. Collignon, S. Y. Li, S. Badoux, A. Gourgout, F. Laliberté, J.-S. Zhou, N. Doiron-Leyraud, and L. Taillefer, Wiedemann-Franz Law and Abrupt Change in Conductivity across the Pseudogap Critical Point of a Cuprate Superconductor, Phys. Rev. X 8, 041010 (2018).
- Michon et al. [2019] B. Michon, C. Girod, S. Badoux, J. Kacmarcik, Q. Ma, M. Dragomir, H. A. Dabkowska, B. D. Gaulin, J.-S. Zhou, S. Pyon, T. Takayama, H. Takagi, S. Verret, N. Doiron-Leyraud, C. Marcenat, L. Taillefer, and T. Klein, Thermodynamic signatures of quantum criticality in cuprate superconductors, Nature 567, 218 (2019).
- Girod et al. [2021] C. Girod, D. LeBoeuf, A. Demuer, G. Seyfarth, S. Imajo, K. Kindo, Y. Kohama, M. Lizaire, A. Legros, A. Gourgout, H. Takagi, T. Kurosawa, M. Oda, N. Momono, J. Chang, S. Ono, G.-q. Zheng, C. Marcenat, L. Taillefer, and T. Klein, Normal state specific heat in the cuprate superconductors La2-xSrxCuO4 and Bi2+ySr2-x-yLaxCuO6+δ near the critical point of the pseudogap phase, Phys. Rev. B 103, 214506 (2021).
- Putzke et al. [2021] C. Putzke, S. Benhabib, W. Tabis, J. Ayres, Z. Wang, L. Malone, S. Licciardello, J. Lu, T. Kondo, T. Takeuchi, N. E. Hussey, J. R. Cooper, and A. Carrington, Reduced Hall carrier density in the overdoped strange metal regime of cuprate superconductors, Nature Physics 17, 826 (2021).
- Kawasaki et al. [2010] S. Kawasaki, C. Lin, P. L. Kuhns, A. P. Reyes, and G.-q. Zheng, Carrier-Concentration Dependence of the Pseudogap Ground State of Superconducting Bi2Sr2-xLaxCuO6+δ Revealed by 63,65Cu-Nuclear Magnetic Resonance in Very High Magnetic Fields, Phys. Rev. Lett. 105, 137002 (2010).
- She et al. [2011] J.-H. She, B. J. Overbosch, Y.-W. Sun, Y. Liu, K. E. Schalm, J. A. Mydosh, and J. Zaanen, Observing the origin of superconductivity in quantum critical metals, Phys. Rev. B 84, 144527 (2011).
- Jorgensen et al. [1988] J. D. Jorgensen, B. Dabrowski, S. Pei, D. G. Hinks, L. Soderholm, B. Morosin, J. E. Schirber, E. L. Venturini, and D. S. Ginley, Superconducting phase of : A superconducting composition resulting from phase separation, Phys. Rev. B 38, 11337 (1988).
- Keimer et al. [1992] B. Keimer, N. Belk, R. J. Birgeneau, A. Cassanho, C. Y. Chen, M. Greven, M. A. Kastner, A. Aharony, Y. Endoh, R. W. Erwin, and G. Shirane, Magnetic excitations in pure, lightly doped, and weakly metallic , Phys. Rev. B 46, 14034 (1992).
- Klauss et al. [2000] H.-H. Klauss, W. Wagener, M. Hillberg, W. Kopmann, H. Walf, F. J. Litterst, M. Hücker, and B. Büchner, From Antiferromagnetic Order to Static Magnetic Stripes: The Phase Diagram of , Phys. Rev. Lett. 85, 4590 (2000).
- Park et al. [2014] S. R. Park, T. Fukuda, A. Hamann, D. Lamago, L. Pintschovius, M. Fujita, K. Yamada, and D. Reznik, Evidence for a charge collective mode associated with superconductivity in copper oxides from neutron and x-ray scattering measurements of la2-xsrxcuo4, Phys. Rev. B 89, 020506(R) (2014).
- Horio et al. [2018] M. Horio, K. Hauser, Y. Sassa, Z. Mingazheva, D. Sutter, K. Kramer, A. Cook, E. Nocerino, O. K. Forslund, O. Tjernberg, M. Kobayashi, A. Chikina, N. B. M. Schroter, J. A. Krieger, T. Schmitt, V. N. Strocov, S. Pyon, T. Takayama, H. Takagi, O. J. Lipscombe, S. M. Hayden, M. Ishikado, H. Eisaki, T. Neupert, M. Mansson, C. E. Matt, and J. Chang, Three-Dimensional Fermi Surface of Overdoped La-Based Cuprates, Phys. Rev. Lett. 121, 077004 (2018).
- Miao et al. [2021] H. Miao, G. Fabbris, R. J. Koch, D. G. Mazzone, C. S. Nelson, R. Acevedo-Esteves, G. D. Gu, Y. Li, T. Yilimaz, K. Kaznatcheev, E. Vescovo, M. Oda, T. Kurosawa, N. Momono, T. Assefa, I. K. Robinson, E. S. Bozin, J. M. Tranquada, P. D. Johnson, and M. P. M. Dean, Charge density waves in cuprate superconductors beyond the critical doping, npj Quantum Materials 6, 31 (2021).
- Mirzaei et al. [2013] S. Mirzaei, D. Stricker, J. N. Hancock, C. Berthod, A. Georges, E. van Heumen, M. K. Chan, X. Zhao, Y. Li, M. Greven, N. Barisic, and D. van der Marel, Spectroscopic evidence for Fermi liquid-like energy and temperature dependence of the relaxation rate in the pseudogap phase of the cuprates, PNAS 110, 5774 (2013).
- van Heumen et al. [2009a] E. van Heumen, E. Muhlethaler, A. B. Kuzmenko, H. Eisaki, W. Meevasana, M. Greven, and D. van der Marel, Optical determination of the relation between the electron-boson coupling function and the critical temperature in high-Tc cuprates, Phys. Rev. B 79, 184512 (2009a).
- van Heumen et al. [2009b] E. van Heumen, W. Meevasana, A. B. Kuzmenko, H. Eisaki, and D. van der Marel, Doping-dependent optical properties of Bi2201, New Journal of Phys. 11, 055067 (2009b).
- Cyr-Choinière et al. [2018] O. Cyr-Choinière, R. Daou, F. Laliberté, C. Collignon, S. Badoux, D. LeBoeuf, J. Chang, B. J. Ramshaw, D. A. Bonn, W. N. Hardy, R. Liang, J.-Q. Yan, J.-G. Cheng, J.-S. Zhou, J. B. Goodenough, S. Pyon, T. Takayama, H. Takagi, N. Doiron-Leyraud, and L. Taillefer, Pseudogap temperature T∗ of cuprate superconductors from the Nernst effect, Phys. Rev. B 97, 064502 (2018).
- Matt et al. [2015] C. E. Matt, C. G. Fatuzzo, Y. Sassa, M. Mansson, S. Fatale, V. Bitetta, X. Shi, S. Pailhès, M. H. Berntsen, T. Kurosawa, M. Oda, N. Momono, O. J. Lipscombe, S. M. Hayden, J.-Q. Yan, J.-S. Zhou, J. B. Goodenough, S. Pyon, T. Takayama, H. Takagi, L. Patthey, A. Bendounan, E. Razzoli, M. Shi, N. C. Plumb, M. Radovic, M. Grioni, J. Mesot, O. Tjernberg, and J. Chang, Electron scattering, charge order, and pseudogap physics in La1.6-xNd0.4SrxCuO4: An angle-resolved photoemission spectroscopy study, Phys. Rev. B 92, 134524 (2015).
- Picket [1989] W. Picket, Electronic structure of the high- oxides, Rev. Mod. Phys. 61, 433 (1989).
- Lavrov et al. [2001] A. N. Lavrov, Y. Ando, S. Komiya, and I. Tsukada, Unusual Magnetic Susceptibility Anisotropy in Untwinned Single Crystals in the Lightly Doped Region, Phys. Rev. Lett. 87, 017007 (2001).
- Ando et al. [2002] Y. Ando, K. Segawa, S. Komiya, and A. N. Lavrov, Electrical Resistivity Anisotropy from Self-Organized One Dimensionality in High-Temperature Superconductors, Phys. Rev. Lett. 88, 137005 (2002).
- Dumm et al. [2003] M. Dumm, S. Komiya, Y. Ando, and D. N. Basov, Anisotropic Electromagnetic Response of Lightly Doped La2-xSrxCuO4 within the CuO2 Planes, Phys. Rev. Lett. 91, 077004 (2003).
- Nakamura and Uchida [1993] Y. Nakamura and S. Uchida, Anisotropic transport properties of single-crystal La2-xSrxCuO4: Evidence for the dimensional crossover, Phys. Rev. B 47, 8369 (1993).
- Hess et al. [2003] C. Hess, B. Büchner, U. Ammerahl, and A. Revcolevschi, Phonon thermal conductivity in doped La2CuO4: Relevant scattering mechanisms, Phys. Rev. B 68, 184517 (2003).
- Frachet et al. [2020] M. Frachet, I. Vinograd, R. Zhou, S. Benhabib, S. Wu, H. Mayaffre, S. Krämer, S. K. Ramakrishna, A. P. Reyes, J. Debray, T. Kurosawa, N. Momono, M. Oda, S. Komiya, S. Ono, M. Horio, J. Chang, C. Proust, D. LeBoeuf, and M.-H. Julien, Hidden magnetism at the pseudogap critical point of a cuprate superconductor, Nature Phys. 16, 1064 (2020).
- Boebinger et al. [1996] G. S. Boebinger, Y. Ando, A. Passner, T. Kimura, M. Okuya, J. Shimoyama, K. Kishio, K. Tamasaku, N. Ichikawa, and S. Uchida, Insulator-to-Metal Crossover in the Normal State of La2-xSrxCuO4 Near Optimum Doping, Phys. Rev. Lett. 77, 5417 (1996).
- Cooper et al. [2009] R. A. Cooper, Y. Wang, B. Vignolle, O. J. Lipscombe, S. M. Hayden, Y. Tanabe, T. Adachi, Y. Koike, M. Nohara, H. Takagi, C. Proust, and N. E. Hussey, Anomalous Criticality in the Electrical Resistivity of La2-xSrxCuO4, Science 323, 603 (2009).
- Uchida et al. [1991] S. Uchida, T. Ido, H. Takagi, T. Arima, Y. Tokura, and S. Tajima, Optical spectra of La2-xSrxCuO4: Effect of carrier doping on the electronic structure of the CuO2 plane, Phys. Rev. B 43, 7942 (1991).
- Uchida et al. [1996] S. Uchida, K. Tamasaku, and S. Tajima, c-axis optical spectra and charge dynamics in La2-xSrxCuO4, Phys. Rev. B 53, 14558 (1996).
- Pignon et al. [2008] B. Pignon, G. Gruener, V. T. Phuoc, F. Gervais, C. Marin, and L. Ammor, Comparative infrared study of optimally doped and underdoped La2-xSrxCuO4 single crystals, J. Phys.: Condens. Matt. 20, 075230 (2008).
- Autore et al. [2014] M. Autore, P. Di Pietro, P. Calvani, U. Schade, S. Pyon, T. Takayama, H. Takagi, and S. Lupi, Phase diagram and optical conductivity of La1.8Eu0.2SrxCuO4, Phys. Rev. B 90, 035102 (2014).
- Panagopoulos et al. [2003] C. Panagopoulos, T. Xiang, W. Anukool, J. R. Cooper, Y. S. Wang, and C. W. Chu, Superfluid response in monolayer high-Tc cuprates, Phys. Rev. B 67, 220502(R) (2003).
- Bozovic et al. [2016] I. Bozovic, X. He, J. Wu, and A. T. Bollinger, Dependence of the critical temperature in overdoped copper oxides on superfluid density, Nature 536, 309 (2016).
- Götze and Wölfe [1972] W. Götze and P. Wölfe, Homogeneous Dynamical Conductivity of Simple Metals, Phys. Rev. B 6, 4 (1972).
- Youn et al. [2007] S. J. Youn, T. H. Rho, B. I. Min, and K. S. Kim., Extended Drude model analysis of noble metals, Phys. Stat. Sol. 244, 1354 (2007).
- Nakajima et al. [2010] M. Nakajima, S. Ishida, K. Kihou, Y. Tomioka, T. Ito, Y. Yoshida, C. H. Lee, H. Kito, A. Iyo, H. Eisaki, K. M. Kojima, and S. Uchida, Evolution of the optical spectrum with doping in Ba(Fe1-xCox)2As2, Phys. Rev. B 81, 104528 (2010).
- Takagi et al. [1989] H. Takagi, T. Ido, S. Ishibashi, M. Uota, S. Uchida, and Y. Tokura, Superconductor-to-nonsuperconductor transition in ( as investigated by transport and magnetic measurements, Phys. Rev. B 40, 2254 (1989).
- Pavarini et al. [2001] E. Pavarini, I. Dasgupta, T. Saha-Dasgupta, O. Jepsen, and O. K. Andersen, Band-Structure Trend in Hole-Doped cuprates and Correlation with T, Phys. Rev. Lett. 87, 047003 (2001).
- Norman et al. [2007] M. R. Norman, A. V. Chubukov, E. van Heumen, A. B. Kuzmenko, and D. van der Marel, Optical integral in the cuprates and the question of sum-rule violation, Phys. Rev. B 76, 220509(R) (2007).
- Lane et al. [2018] C. Lane, J. W. Furness, I. G. Buda, Y. Zhang, R. S. Markiewicz, B. Barbiellini, J. Sun, and A. Bansil, Antiferromagnetic ground state of : A parameter-free ab initio description, Phys. Rev. B 98, 125140 (2018).
- Uemura et al. [1988] Y. J. Uemura, V. J. Emery, A. R. Moodenbaugh, M. Suenaga, D. C. Johnston, A. J. Jacobson, J. T. Lewandowski, J. H. Brewer, R. F. Kiefl, S. R. Kreitzman, G. M. Luke, T. Riseman, C. E. Stronach, W. J. Kossler, J. R. Kempton, X. H. Yu, D. Opie, and H. E. Schone, Systematic variation of magnetic-field penetration depth in high- superconductors studied by muon-spin relaxation, Phys. Rev. B 38, 909 (1988).
- Randeria et al. [1989] M. Randeria, J.-M. Duan, and L.-Y. Shieh, Bound states, Cooper pairing, and Bose condensation in two dimensions, Phys. Rev. Lett. 62, 981 (1989).
- van der Marel and Rietveld [1992] D. van der Marel and G. Rietveld, Universal jump in slope of the chemical potential at second-order phase transitions, Phys. Rev. Lett. 69, 2575 (1992).
- Rietveld et al. [1992] G. Rietveld, N. Y. Chen, and D. van der Marel, Anomalous temperature dependence of the work function in YBa2Cu3O7-δ, Phys. Rev. Lett. 69, 2578 (1992).
- Alexandrov and Mott [1994] A. S. Alexandrov and N. F. Mott, Bipolarons, Reports on Progress in Physics 57, 1197 (1994).
- Michon et al. [2021] B. Michon, A. Kuzmenko, M. Tran, B. McElfresh, S. Komiya, S. Ono, S. Uchida, and D. van der Marel, Open Data 10.26037/yareta:vytlmt6phzghpgnpt5jj2uw4xq (2021).