The Influence of the Peculiar Velocities of SNe Ia in Clusters of Galaxies on the Redshift Measurements
Abstract
The most intriguing question of modern astronomy is the question of our Universe formation. The Hubble diagram analysis with Type Ia Supernovae (SNe Ia) is widely used to estimate the cosmological parameters with high accuracy. The cosmological measurements allow us to better understand the early stages of the Universe evolution. Nevertheless, the redshift on the SN Ia Hubble diagram includes the contribution from the unknown peculiar velocities that decreases the accuracy of such measurements. We consider the contamination of peculiar velocities of the host galaxies for those SNe that exploded in galaxy clusters. For this purpose, we use the Pantheon cosmological sample and offer the procedure to minimise the influence of such uncertainties.
I Introduction
The discovery of the accelerating expansion of the Universe was performed by observations of distant Type Ia Supernovae (SNe Ia) 1999Perlmutter ; 1998Riess and caused a resurgence of interest for this type of astrophysical transients. It turns out that in the last two decades the discovery rate of SNe Ia has been dramatically increased. The future projects such as the Vera C. Rubin Observatory Legacy Survey of Space and Time 2009arXiv0912.0201L will provide even more observations of this phenomenon and allow us to measure the cosmological parameters with the highest accuracy.
Cosmological parameters are estimated from the “luminosity distance-redshift” relation of SNe Ia using the Hubble diagram. Currently, a lot of attention is paid to enhance the accuracy of SN luminosity standardisation 2020A&A…636A..46L . The other effect that decreases the accuracy of the luminosity distance measurements is the gravitational lensing. In 2018IJMPD..2750019H the authors showed that its contribution at the low redshifts is negligible but increases with the redshift growth.
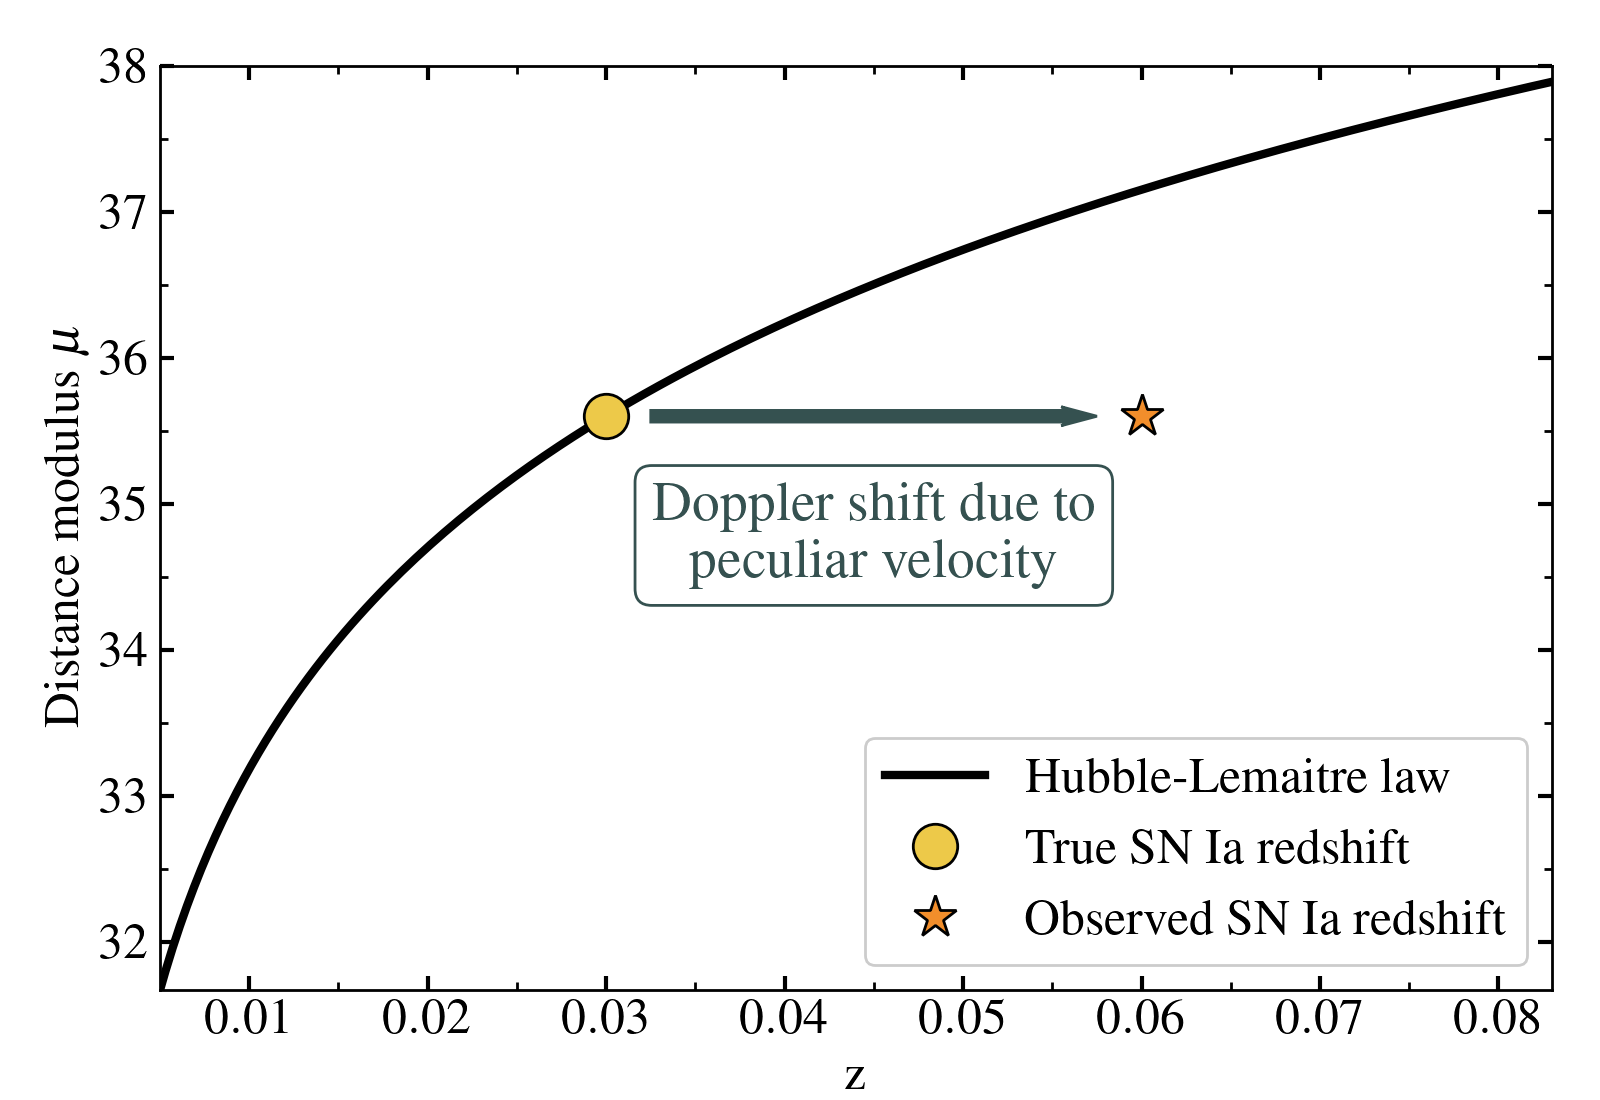
The uncertainty on the redshift in the “luminosity distance-redshift” relation is quite often considered negligible. In this relation, the redshift should be entirely due to the expansion of the Universe, i. e. relative to the CMB frame. However, the observed redshift contains a contribution from the poorly known peculiar velocities: , where corresponds to the peculiar velocity contribution to the redshift. For the low redshift it could be expressed as , where is speed of light. In Fig. 1 (left) the impact of the peculiar velocities on the Hubble diagram is schematically shown.
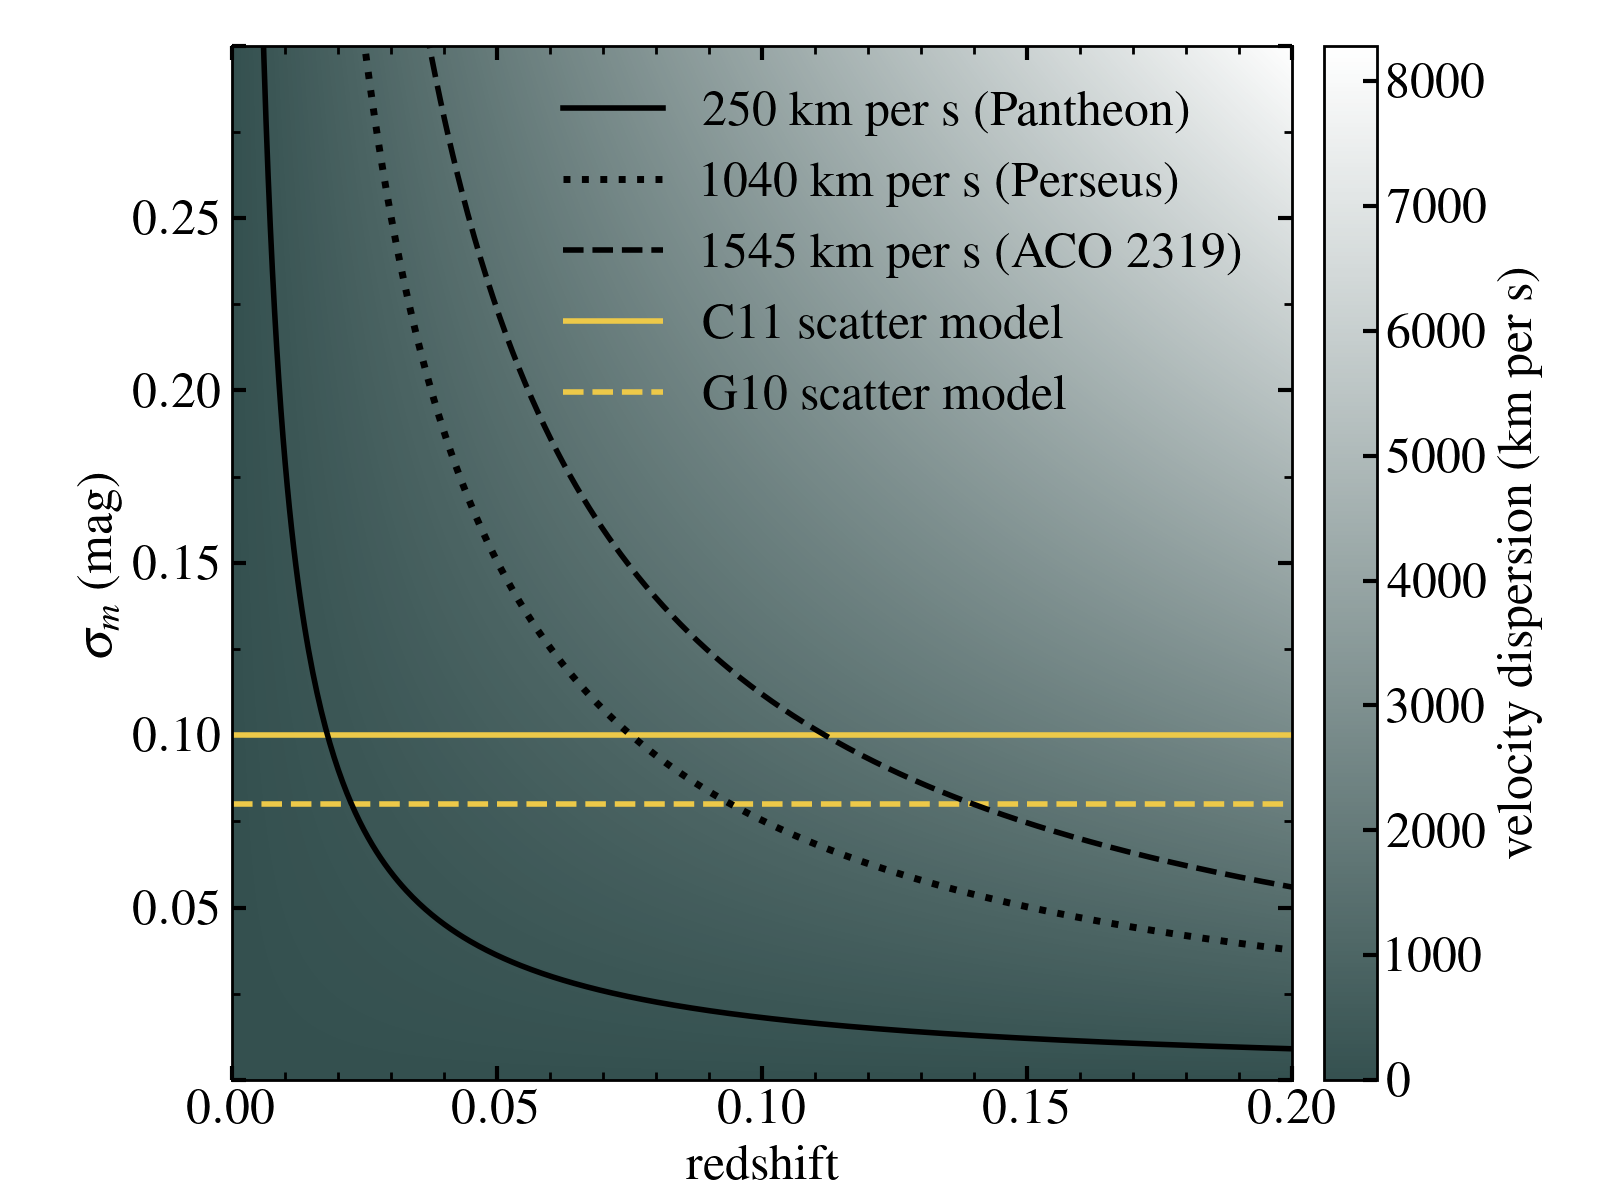
To minimise the influence of peculiar velocities, in cosmological analyses a standard value of km s-1 is added in quadrature to the redshift uncertainty 2018Scolnic . It has nonetheless been observed that velocity dispersion can exceed km s-1 in galaxy clusters: the velocity dispersion equals km s-1 for the Perseus cluster 2020MNRAS.494.1681A and km s-1 for ACO 2319 1996ApJ…473..670F .
One can recalculate the velocity dispersion caused by the peculiar velocities to the magnitude uncertainty by . For instance, if a SN Ia host galaxy at redshift has a peculiar velocity of km s-1, its contribution to the magnitude uncertainty will be mag. As it is seen from Fig. 1 (right), the magnitude uncertainty due to peculiar velocities of km s-1 is greater than the intrinsic dispersion of mag for the scattering model C11 2011A&A…529L…4C in the Pantheon analysis for the redshifts and, therefore, has to be taken into account 2020arXiv201005765H . To decrease the contribution of this effect for those SNe that exploded in the galaxy clusters, we suggest to use the redshift of the clusters instead of the redshift of their host galaxies.
The similar analysis was performed for 11 Nearby Supernova Factory SNe Ia in galaxy clusters 2018A&A…615A.162L . The authors showed that the Hubble residual dispersion of SNe Ia associated with galaxy clusters significantly decreased when the cluster redshift is taken as the cosmological redshift of supernovae. Our analysis applies the similar procedure to the Pantheon cosmological sample of SNe Ia 2018Scolnic .
II Data
II.1 Pantheon sample
As a supernova sample we use Pantheon cosmological sample consisting of 1048 spectroscopically confirmed SNe Ia with redshift range . This sample represents a compilation from several supernova surveys 2018Scolnic . We choose this sample because it is one of the biggest intercalibrated samples of supernovae. Since the contribution of peculiar velocities is significant for the nearby Universe (see Fig. 1, right) we chose 297 SNe Ia from Pantheon sample with the redshifts .
II.2 Galaxy clusters data
Galaxy clusters are characterised by the extremely hot gas in their centres that is observed as the diffuse X-ray emission 1966PhRvL..17..447B ; 1988xrec.book…..S . This observational fact can serve as the most effective and reliable way to establish which optically detected galaxy clusters are gravitationally-bound systems. Another observational appearance of hot gas in the central parts of clusters is the Sunyaev-Zel’dovich (SZ) effect that manifests as the distortion in the cosmic microwave background. Based on these effects we collect the following catalogues with galaxy clusters:
-
•
MCXC which is the compilation of X-ray detected clusters of galaxies. This catalogue is based on publicly available ROSAT All Sky Survey-based, serendipitous cluster catalogues and finally comprises 1743 clusters 2011MCXC .
-
•
SWXCS which is the Swift X-ray Cluster Survey catalogue obtained using archival data from the X-ray telescope onboard the Swift satellite. The list of sources was cross-correlated with published optical, X-ray, and Sunyaev-Zel’dovich catalogues of clusters and 263 sources have been identified as clusters 2015ApJS..216…28L .
-
•
XCS-DR1 which is the first data release from the XMM Cluster Survey. It consists of 503 detected X-ray clusters that were optically confirmed 2012XCS .
-
•
Plank-SZ catalogue that consists of 439 clusters detected via their Sunyaev-Zel’dovich signal 2016Planck .
III Search of SNe Ia in galaxy clusters
III.1 Preliminary search
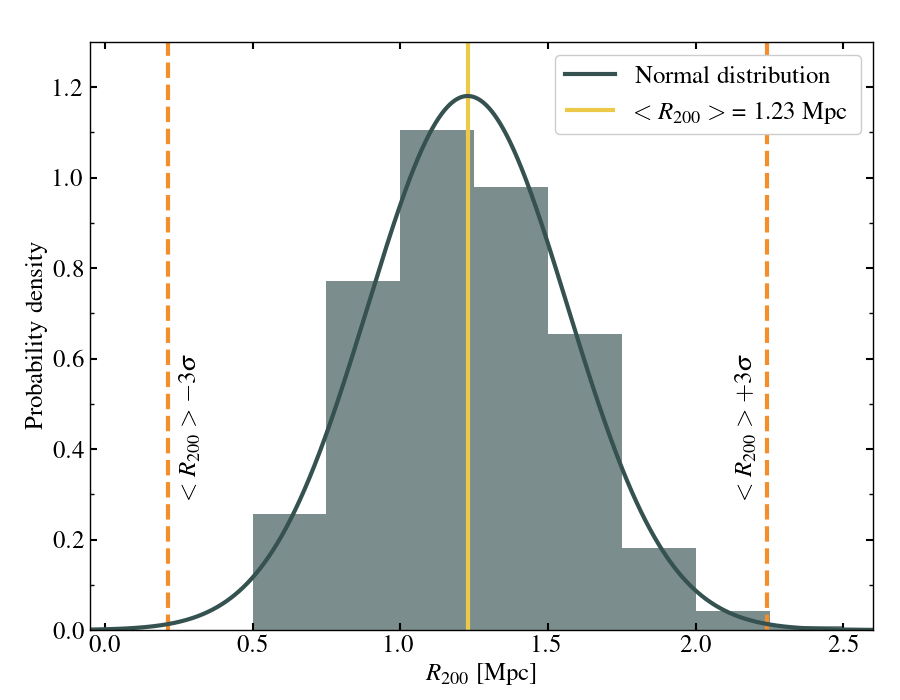
To find those Pantheon SNe that belong to clusters of galaxies, we realise the cross-matching between the chosen cluster catalogues and Pantheon sample. The preliminary search is performed in the cone of characteristic value . To find , we build the distribution of parameter based on MCXC data, where is the radius that encloses a sphere whose mean density is equal to 200 times of the critical density of the Universe (Fig. 2). The parameter is calculated from parameter from MCXC using the relation . After finding the mean value of and its standard deviation we choose criterion as Mpc. Besides, for this preliminary search, we need to define some redshift cut. For the ACO 2319 cluster which demonstrates one of the highest value of velocity dispersion we calculate the maximum value of . This value is used for the preliminary redshift cut. After applying both cuts, 30 SNe Ia in the galaxy clusters are identified by cross-matching procedure.
III.2 Redshift of galaxy clusters
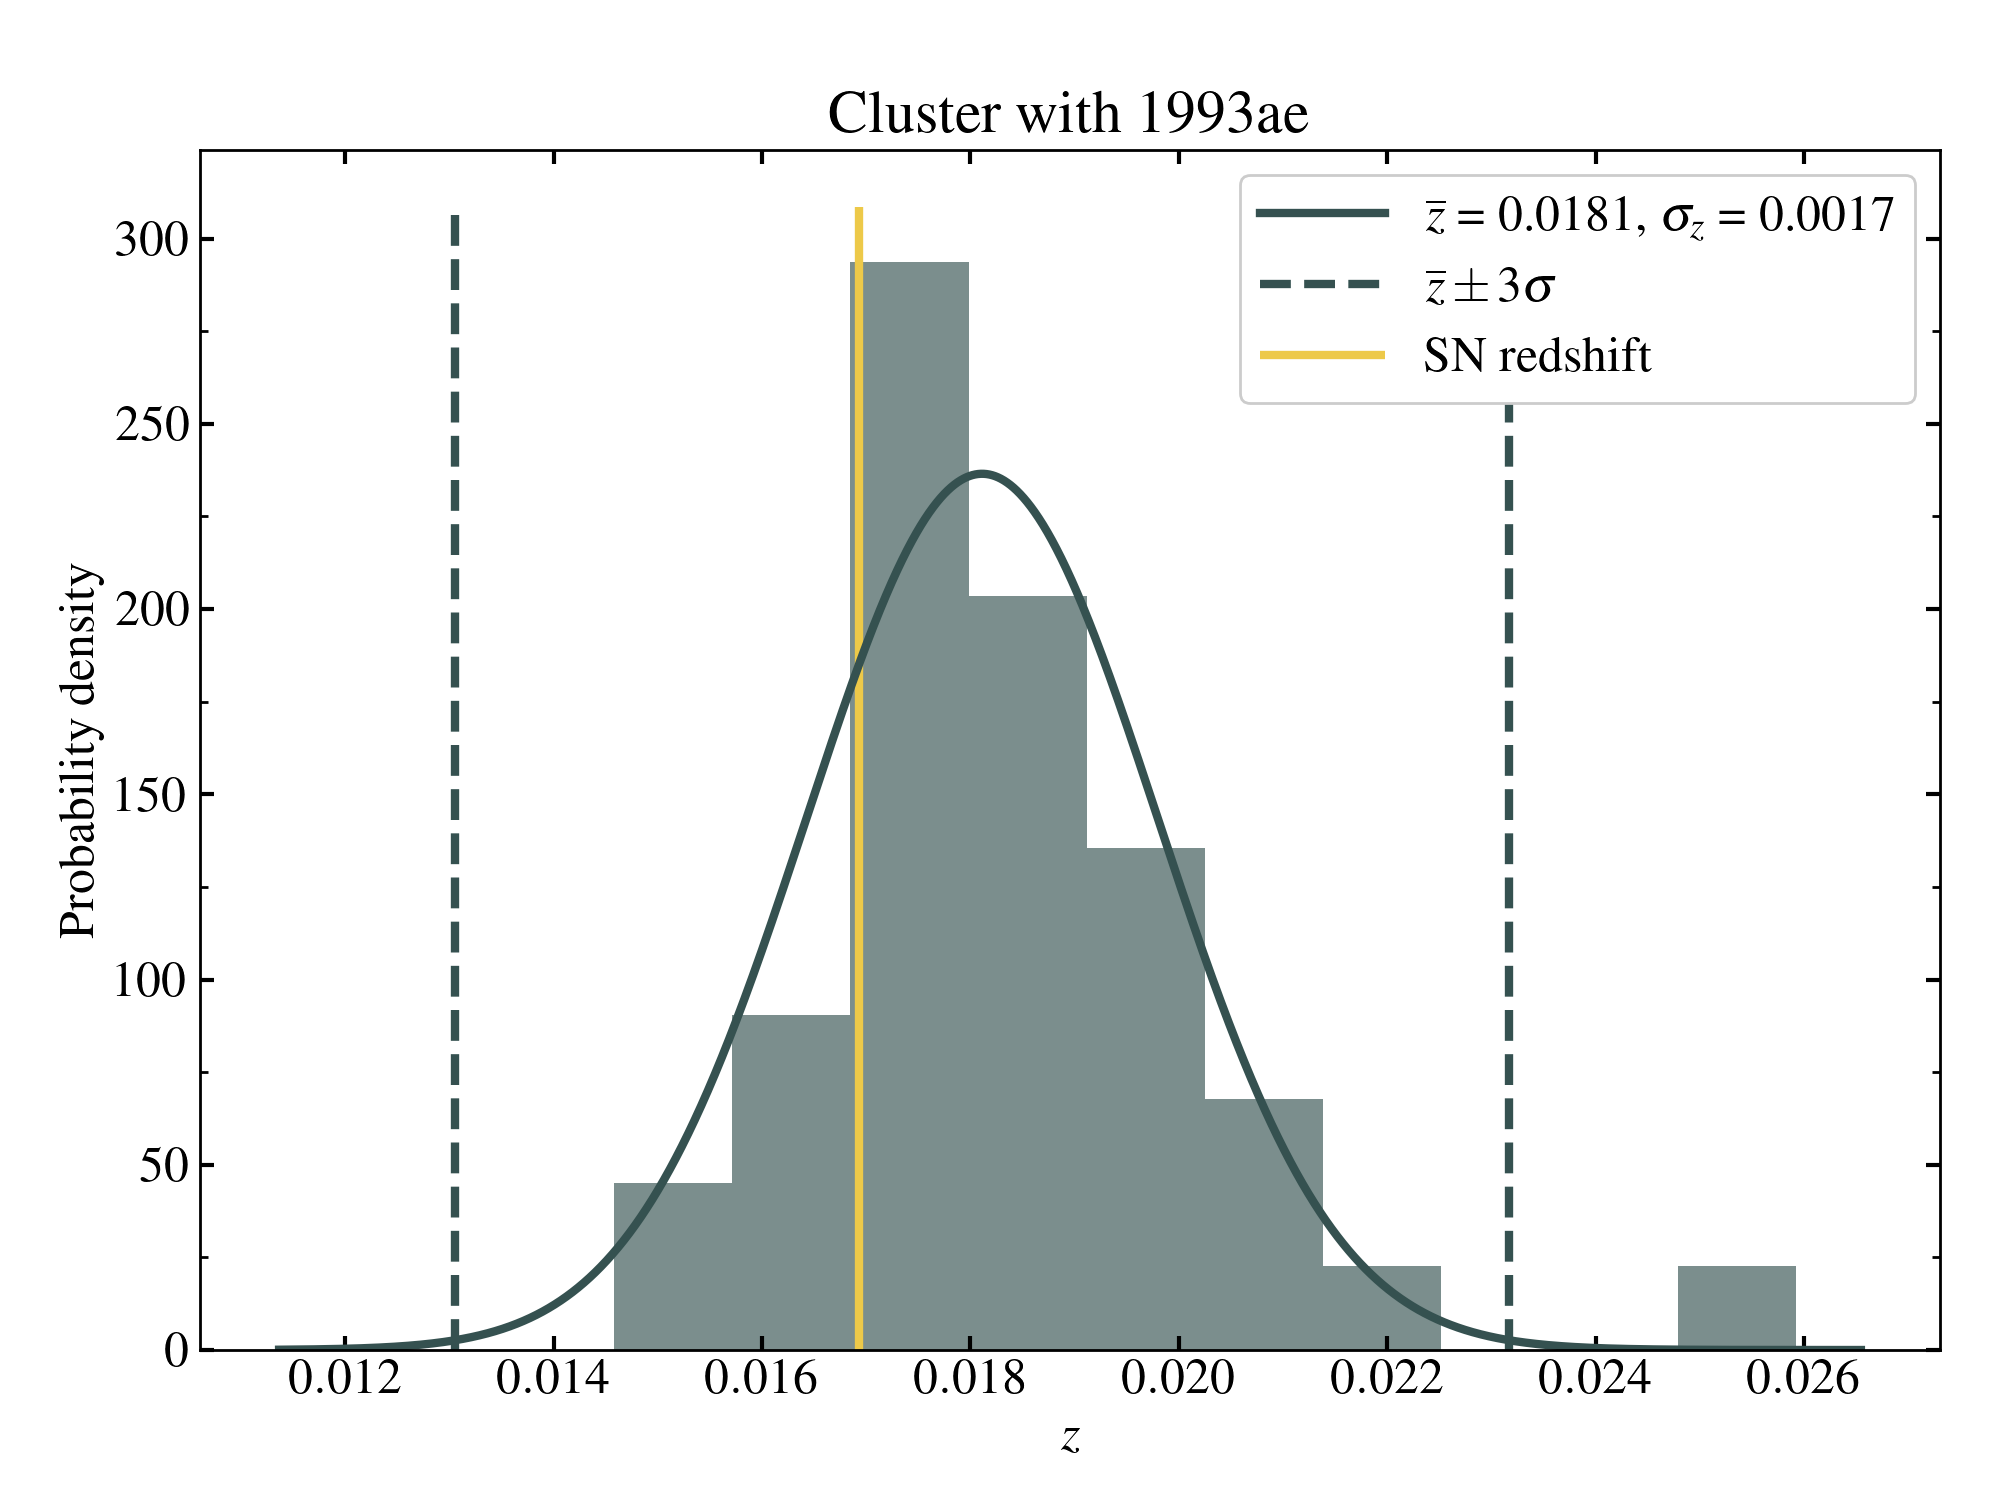
To reduce the residuals on the Hubble diagram, we suggest in our analysis to use the galaxy cluster redshifts instead of the host galaxy redshifts for SNe Ia that belong to the clusters. To measure the cluster redshift, for each cluster we select all galaxies inside radius around cluster centre that have the spectroscopic redshifts in SDSS111https://www.sdss.org 2019PASP..131e5001W ; 2020ApJS..249….3A . Following 2018A&A…615A.162L we choose the objects with the redshift value in the range , where the cluster velocity dispersion could be found as , for the flat Universe. For the resulting list of objects, we apply the bi-weight technique 1990AJ….100…32B and estimate the redshift values for 25 clusters. For example, the histogram with redshift distribution for one of the clusters is shown in Fig. 3. For other five clusters there are no data in SDSS, and we collect their redshifts from the SIMBAD database 2000A&AS..143….9W and literature. Thus, we define the redshifts for all 30 galaxy clusters as well as their virial radii.
III.3 Final selection
After determining the redshift of galaxy clusters, we can perform the final selection to discard those supernovae that only projected near the clusters. Therefore, each SN has to satisfy the following conditions: I. and II. , where is a distance between supernova and galaxy cluster centre. These final cuts allow us to determine those Pantheon SNe Ia that belong to the galaxy clusters. Table 1 presents the final list of 13 supernovae associated with clusters of galaxies and the main physical parameters of the clusters.

IV Discussion
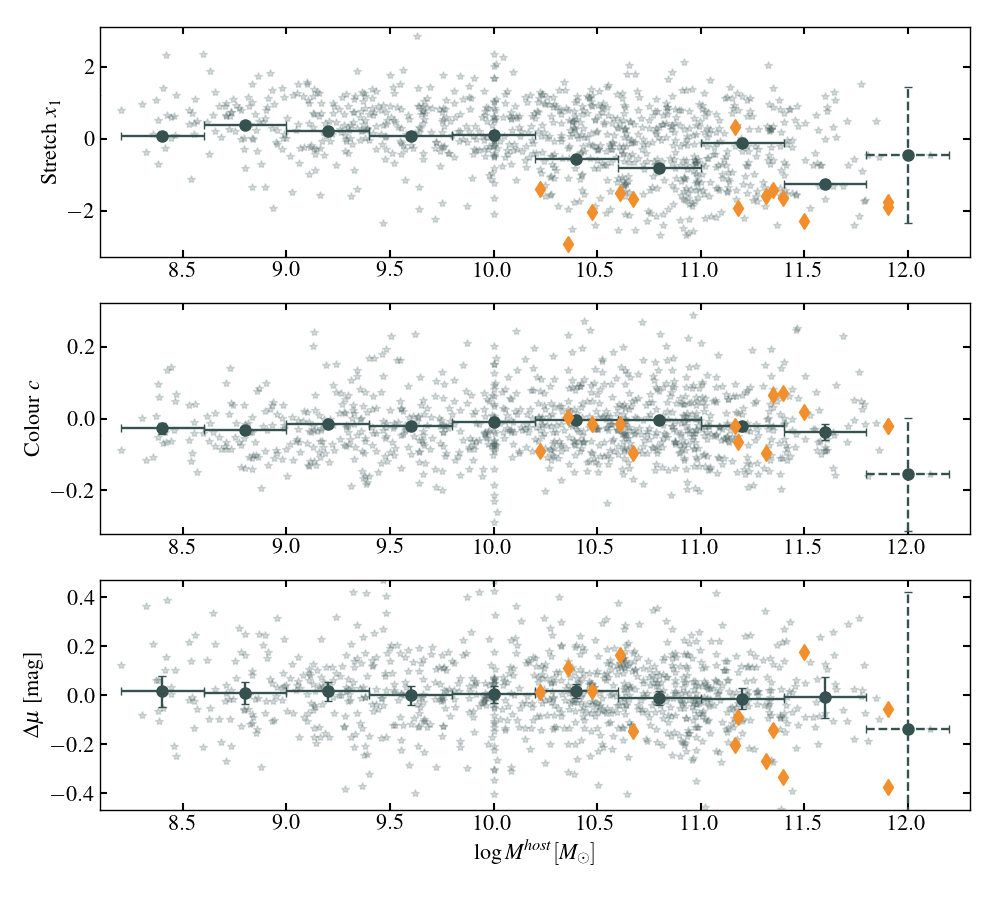
The effects of environment is another cause of uncertainties on the Hubble diagram. Using Pantheon data we consider the influence of environmental effects: the position of the SN relative to its host galaxy and the mass of the host galaxy – for supernovae in the field and supernovae in clusters, see Fig. 5. One can notices that host galaxies related with clusters are massive: . Besides, SNe in clusters show even lower values of the stretching parameter in comparison with the average values that shown by green bars in Fig. 5 for each ranges. This effect may be due to the fact that in a cluster of galaxies it is more likely to detect elliptical host galaxies, which are characterized by large masses and lower values of the stretching parameter 2020MNRAS.499.5121P .
V Conclusion
Using the Pantheon distance modulus values and the theoretical distance modulus for the flat CDM cosmology 2018Scolnic , we found the distance modulus residuals for 13 SNe Ia in clusters. Then, we corrected the Pantheon redshifts by the peculiar velocity correction found in Section III, and compared the Hubble diagram residuals before and after corrections (see Fig. 4). As expected, the supernova positions on the Hubble diagram do change. In perspective, we are going to evaluate the significance of the impact of the peculiar velocity correction on the Hubble diagram. However, it can be already stressed that with increasing accuracy of the cosmological studies, such effects become more and more important and have to be taken into account.
Acknowledgements.
The authors are grateful to Pierre-François Léget for the helpful discussion. This work has made use of data from the Sloan Digital Sky Surveys 2020ApJS..249….3A and the SIMBAD database, operated at CDS, Strasbourg, France 2000A&AS..143….9W .Funding
E.A.B. and M.V.P. acknowledge support from RSF grant 18-72-00159 and the Interdisciplinary Scientific and Educational School of Moscow University “Fundamental and Applied Space Research”.
REFERENCES
References
- (1) S. Perlmutter, G. Aldering, et al. Astrophys. J. , 517:565–586, June 1999.
- (2) A. G. Riess, A. V. Filippenko, et al. Astronomical Journal, 116:1009–1038, September 1998.
- (3) LSST Science Collaboration, Paul A. Abell, et al. arXiv e-prints, page arXiv:0912.0201, December 2009.
- (4) P. F. Léget, E. Gangler, et al. Astronomy and Astrophysics, 636:A46, April 2020.
- (5) Farhang Habibi, Shant Baghram, and Saeed Tavasoli. International Journal of Modern Physics D, 27(3):1850019, January 2018.
- (6) D. Fadda, M. Girardi, et al. Astrophys. J. , 473:670, December 1996.
- (7) J. A. L. Aguerri, M. Girardi, et al. Monthly Notices of the RAS, 494(2):1681–1692, March 2020.
- (8) D. M. Scolnic, D. O. Jones, et al. Astrophys. J. , 859(2):101, June 2018.
- (9) N. Chotard, E. Gangler, et al. Astronomy and Astrophysics, 529:L4, May 2011.
- (10) Dragan Huterer. arXiv e-prints, page arXiv:2010.05765, October 2020.
- (11) P. F. Léget, M. V. Pruzhinskaya, et al. Astronomy and Astrophysics, 615:A162, August 2018.
- (12) Elihu Boldt, Frank B. McDonald, et al. Phys. Rev. Lett. , 17(8):447–450, August 1966.
- (13) Craig L. Sarazin. X-ray emission from clusters of galaxies. Cambridge Astrophysics Series, Cambridge: Cambridge University Press, 1988.
- (14) R. Piffaretti, M. Arnaud, et al. Astronomy and Astrophysics, 534:A109, October 2011.
- (15) Teng Liu, Paolo Tozzi, et al. Astrophysical Journal, Supplement, 216(2):28, February 2015.
- (16) Nicola Mehrtens, A. Kathy Romer, et al. Monthly Notices of the RAS, 423(2):1024–1052, June 2012.
- (17) Planck Collaboration, Ade, P. A. R., et al. A&A, 594:A24, 2016.
- (18) J. C. Wilson, F. R. Hearty, et al. Publications of the ASP, 131(999):055001, May 2019.
- (19) SDSS-IV Collaboration, Romina Ahumada, et al. Astrophysical Journal, Supplement, 249(1):3, July 2020.
- (20) Timothy C. Beers, Kevin Flynn, and Karl Gebhardt. Astronomical Journal, 100:32, July 1990.
- (21) M. Wenger, F. Ochsenbein, et al. Astronomy and Astrophysics, Supplement, 143:9–22, April 2000.
- (22) M. V. Pruzhinskaya, A. K. Novinskaya, et al. Monthly Notices of the RAS, 499(4):5121–5135, December 2020.
- (23) John P. Huchra, Michael S. Vogeley, and Margaret J. Geller. Astrophysical Journal, Supplement, 121(2):287–368, April 1999.
- (24) Hitomi Collaboration, Felix Aharonian, et al. Nature (London), 535(7610):117–121, July 2016.
- (25) H. Böhringer, W. Voges, et al. Astrophysical Journal, Supplement, 129(2):435–474, August 2000.
| SN | Cluster name | R.A.cl | Dec.cl | [Mpc] | Ref. | ||
|---|---|---|---|---|---|---|---|
| 2001ic | 0.04296 | J2310.4+0734 | 23 10 26.4 | +07 34 37 | 0.0439 | 1.117 | 2019PASP..131e5001W |
| 2003ic | 0.05491 | J0041.80918 | 00 41 50.1 | -09 18 07 | 0.0555 | 1.840 | 2019PASP..131e5001W |
| 2006al | 0.06905 | J1039.4+0510 | 10 39 27.9 | +05 10 46 | 0.0688 | 1.225 | 2019PASP..131e5001W |
| 2006gt | 0.04362 | J0056.30112 | 00 56 18.3 | -01 13 00 | 0.0446 | 1.431 | 2019PASP..131e5001W |
| 2006je | 0.03712 | J0150.7+3305 | 01 50 44.9 | +33 05 24 | 0.0355 | 0.907 | 2019PASP..131e5001W |
| 2008bf | 0.02453 | J1204.1+2020 | 12 04 11.6 | +20 20 53 | 0.0233 | 0.727 | 2019PASP..131e5001W |
| 2007nq | 0.04243 | J0056.30112 | 00 56 18.3 | -01 13 00 | 0.0446 | 1.431 | 2019PASP..131e5001W |
| 1994M | 0.02431 | J1231.0+0037 | 12 31 05.6 | +00 37 44 | 0.0230 | 0.621 | 2019PASP..131e5001W |
| 1999ej | 0.01544 | J0123.2+3327 | 01 23 12.2 | +33 27 40 | 0.0165 | 0.761 | 2019PASP..131e5001W |
| 2000dk | 0.01602 | J0107.4+3227 | 01 07 28.3 | +32 27 43 | 0.0174 | 0.784 | 2019PASP..131e5001W |
| 2005hf | 0.04205 | J0126.9+1912 | 01 26 54.5 | +19 12 42 | 0.0427 | 0.519 | 1999ApJS..121..287H |
| 2008L | 0.0173 | J0319.7+4130 | 03 19 47.2 | +41 30 47 | 0.0179 | 1.954 | 2016Natur.535..117H |
| 1998dx | 0.05389 | J1811.0+4954 | 18 11 00.1 | +49 54 40 | 0.0501 | 1.166 | 2000ApJS..129..435B |