Candidate isolated neutron stars in the 4XMM-DR10 catalog of X-ray sources
Abstract
Most isolated neutron stars have been discovered thanks to the detection of their pulsed non-thermal emission, at wavelengths spanning from radio to gamma-rays. However, if the beamed non-thermal radiation does not intercept our line of sight or it is too faint or absent, isolated neutron stars can also be detected through their thermal emission, which peaks in the soft X-ray band and is emitted nearly isotropically. In the past thirty years, several thermally-emitting isolated neutron stars have been discovered thanks to X-ray all-sky surveys, observations targeted at the center of supernova remnants, or as serendipitous X-ray sources. Distinctive properties of these relatively rare X-ray sources are very soft spectra and high ratios of X-ray to optical flux. The recently released 4XMM-DR10 catalog contains more than half a million X-ray sources detected with the XMM-Newton telescope in the 0.2–10 keV range in observations carried out from 2000 to 2019. Based on a study of the spectral properties of these sources and on cross-correlations with catalogs of possible counterparts, we have carried out a search of isolated neutron stars, finding four potential candidates. The spectral and long-term variability analysis of these candidates, using also Chandra and Swift-XRT data, allowed us to point out the most interesting sources deserving further multiwavelength investigations.
keywords:
pulsar: general – stars: neutron – X-rays: stars1 Introduction
Neutron stars are the remnants of massive stars whose cores collapse during the supernova explosions. They are usually detected as radio (2500 known, Manchester et al. 2005) and/or gamma-ray (300, Abdollahi et al. 2020) pulsars, thanks to their beamed non-thermal emission. In addition, there is a group of isolated neutron stars (INSs) from which pulsed non-thermal emission is not detected.
This could be caused by an unfavorable orientation of the rotation and magnetic axes, or by the intrinsic lack, or faintness, of non-thermal magnetospheric emission. On the other hand, these objects can be discovered through their thermal X-ray emission, that arises from the cooling neutron star surface and, being emitted nearly isotropically, can be seen independently of the star orientation. This thermal emission is characterized by a soft X-ray spectrum that peaks between 0.2 and 2 keV (Potekhin et al., 2020, and references therein) and gives only a small contribution in the optical band, leading to high values of the X-ray to optical flux ratio, . Pulsations with broad, nearly sinusoidal profiles, and usually small pulsed fractions (e.g., Tiengo & Mereghetti 2007), can be detected. These are likely caused by a non-uniform surface temperature and/or beaming effects due to the presence of a magnetized atmosphere.
The prototype of these thermally emitting INSs was discovered with the ROSAT satellite (Walter et al., 1996), and, subsequently, other six similar sources were found in the ROSAT All-Sky Survey (RASS, Voges et al. 1999). These sources, generally referred to as XDINS (X-ray dim isolated neutron stars), have distances in the range 100–500 pc, X-ray spectra with blackbody temperatures of 45–110 eV and spin periods of a few seconds (Haberl, 2007; Turolla, 2009).
Thanks to their high sensitivity, X-ray satellites such as XMM-Newton and Chandra should be able to detect dimmer (and thus farther) thermally emitting INSs. However, they provide a smaller sky coverage than all-sky surveys. Furthermore, absorption by the interstellar medium strongly suppresses soft X-rays, thus reducing the possibility of detecting farther and more absorbed objects. In fact, further searches using these satellites led only to a small increase of this sample. For example, Pires et al. (2009b) analyzed the 2XMMp catalog of serendipitous sources discovered with XMM-Newton and found a few possible INS candidates, among which the most promising is 2XMM J104608.7594306 (Pires et al., 2009a, 2015).
Based on a population synthesis model accounting for the distribution of neutron star birthplaces and of the local (3 kpc) interstellar absorption, Posselt et al. (2008), suggested that the most promising regions to look for INSs are in the direction of rich OB associations. The eROSITA/SRG instrument (Predehl et al., 2021) has recently completed the first of the planned four years of its all sky survey. This has provided the first coverage of the whole sky carried out in the soft X-rays after the RASS, although in a slightly different energy range: 0.1–10 keV wrt 0.1–2.4 keV. Predictions for the expected number of INS in the complete eROSITA survey have been reported by Pires et al. (2017), who estimate about 90 discoveries, down to 0.2–2 keV fluxes of 10-14 erg s-1 cm-2 in the whole sky. However, their secure identification in the large sample of eROSITA sources will require extensive multiwawelength follow-up observations.
Despite these difficulties, the recent release of the 4XMM-DR10 catalog, containing more than half a million X-ray sources seen with XMM-Newton, motivated us to perform a new search for INS candidates. This paper is organized as follows. In Section 2 we describe how we characterized the X-ray spectrum of the INS in a suitable way to browse the XMM-Newton source catalog. We then describe the filtering process to exclude extended and variable sources, and those with a bright optical and/or IR counterpart (Section 3), and finally we analyze the new possible INSs candidates (Section 4). The results are discussed in Section 5.
2 X-ray hardness ratios of 4XMM-DR10 sources
The 4XMM-DR10 source catalog was released on 2020 December 10 (Webb et al., 2020). It contains source detections drawn from XMM-Newton EPIC observations obtained in the first 20 years of satellite operations. The observations cover 1192 deg2 of the sky, and contain unique sources.
For each detection, the catalog lists many parameters derived by the pipelines of the Science Analysis System (SAS)111http://www.cosmos.esa.int/web/xmm-newton/sas.. These include the sky coordinates, the extension of the source, some flags indicating the quality of the detection and the possible variability, and the net (background-subtracted) count rates in five energy bands: (1) 0.2–0.5 keV, (2) 0.5–1 keV, (3) 1–2 keV, (4) 2–4.5 keV, and (5) 4.5–12 keV.
A convenient way to characterize the X-ray spectrum of a source when the available number of counts is too small for a spectral fitting, is to look at the X-ray hardness ratios (HRs). They are defined as
| (1) |
where CRi and CRi+1 are the count rates in two adjacent energy bands. Soft sources are best described by HR1 and HR2.
Figure 1 shows the HR1 and HR2 values of 4XMM-DR10 point-like sources (only sources with HR errors 0.1 are plotted). The majority of the sources are clearly grouped in two distinct regions. It has been shown in previous works (see e.g. Lin et al. 2012) that the active galactic nuclei (AGNs, comprising BL Lac, Blazars, Quasars…) are located in the center of the HR1–HR2 plane, while the lower right corner is mostly populated by stars. The blue line corresponds to the expected HR values (see below) for power-law spectra of photon index and different values of absorption. AGNs, which typically have , lie to the left of the blue line. The spectra of stars can be described by hot plasma thermal models. The red line corresponds to emission from a collisionally ionized gas with temperature keV and different absorption values. Most stars have a lower temperature and lie below this line.
Compact objects form a third group of sources, comprising INSs, supernova remnants (SNRs) (that appear point-like when located in other galaxies), and binary systems hosting a white dwarf, a neutron star or a stellar mass black hole. Their spectral and timing properties can be used to distinguish several classes (Fabbiano, 2006): The super-soft sources (SSSs), cataclysmic variables (CVs), novae, high-mass and low-mass X-ray binaries (HMXBs and LMXBs), ultraluminous X-ray sources (ULXs). The group of compact objects does not have a specific location on the HR1–HR2 plane. However, in the lower left corner of the plane (HR and HR), there are only cold INSs and SSSs (the green line represents a blackbody with keV, and hotter blackbodies are above it).
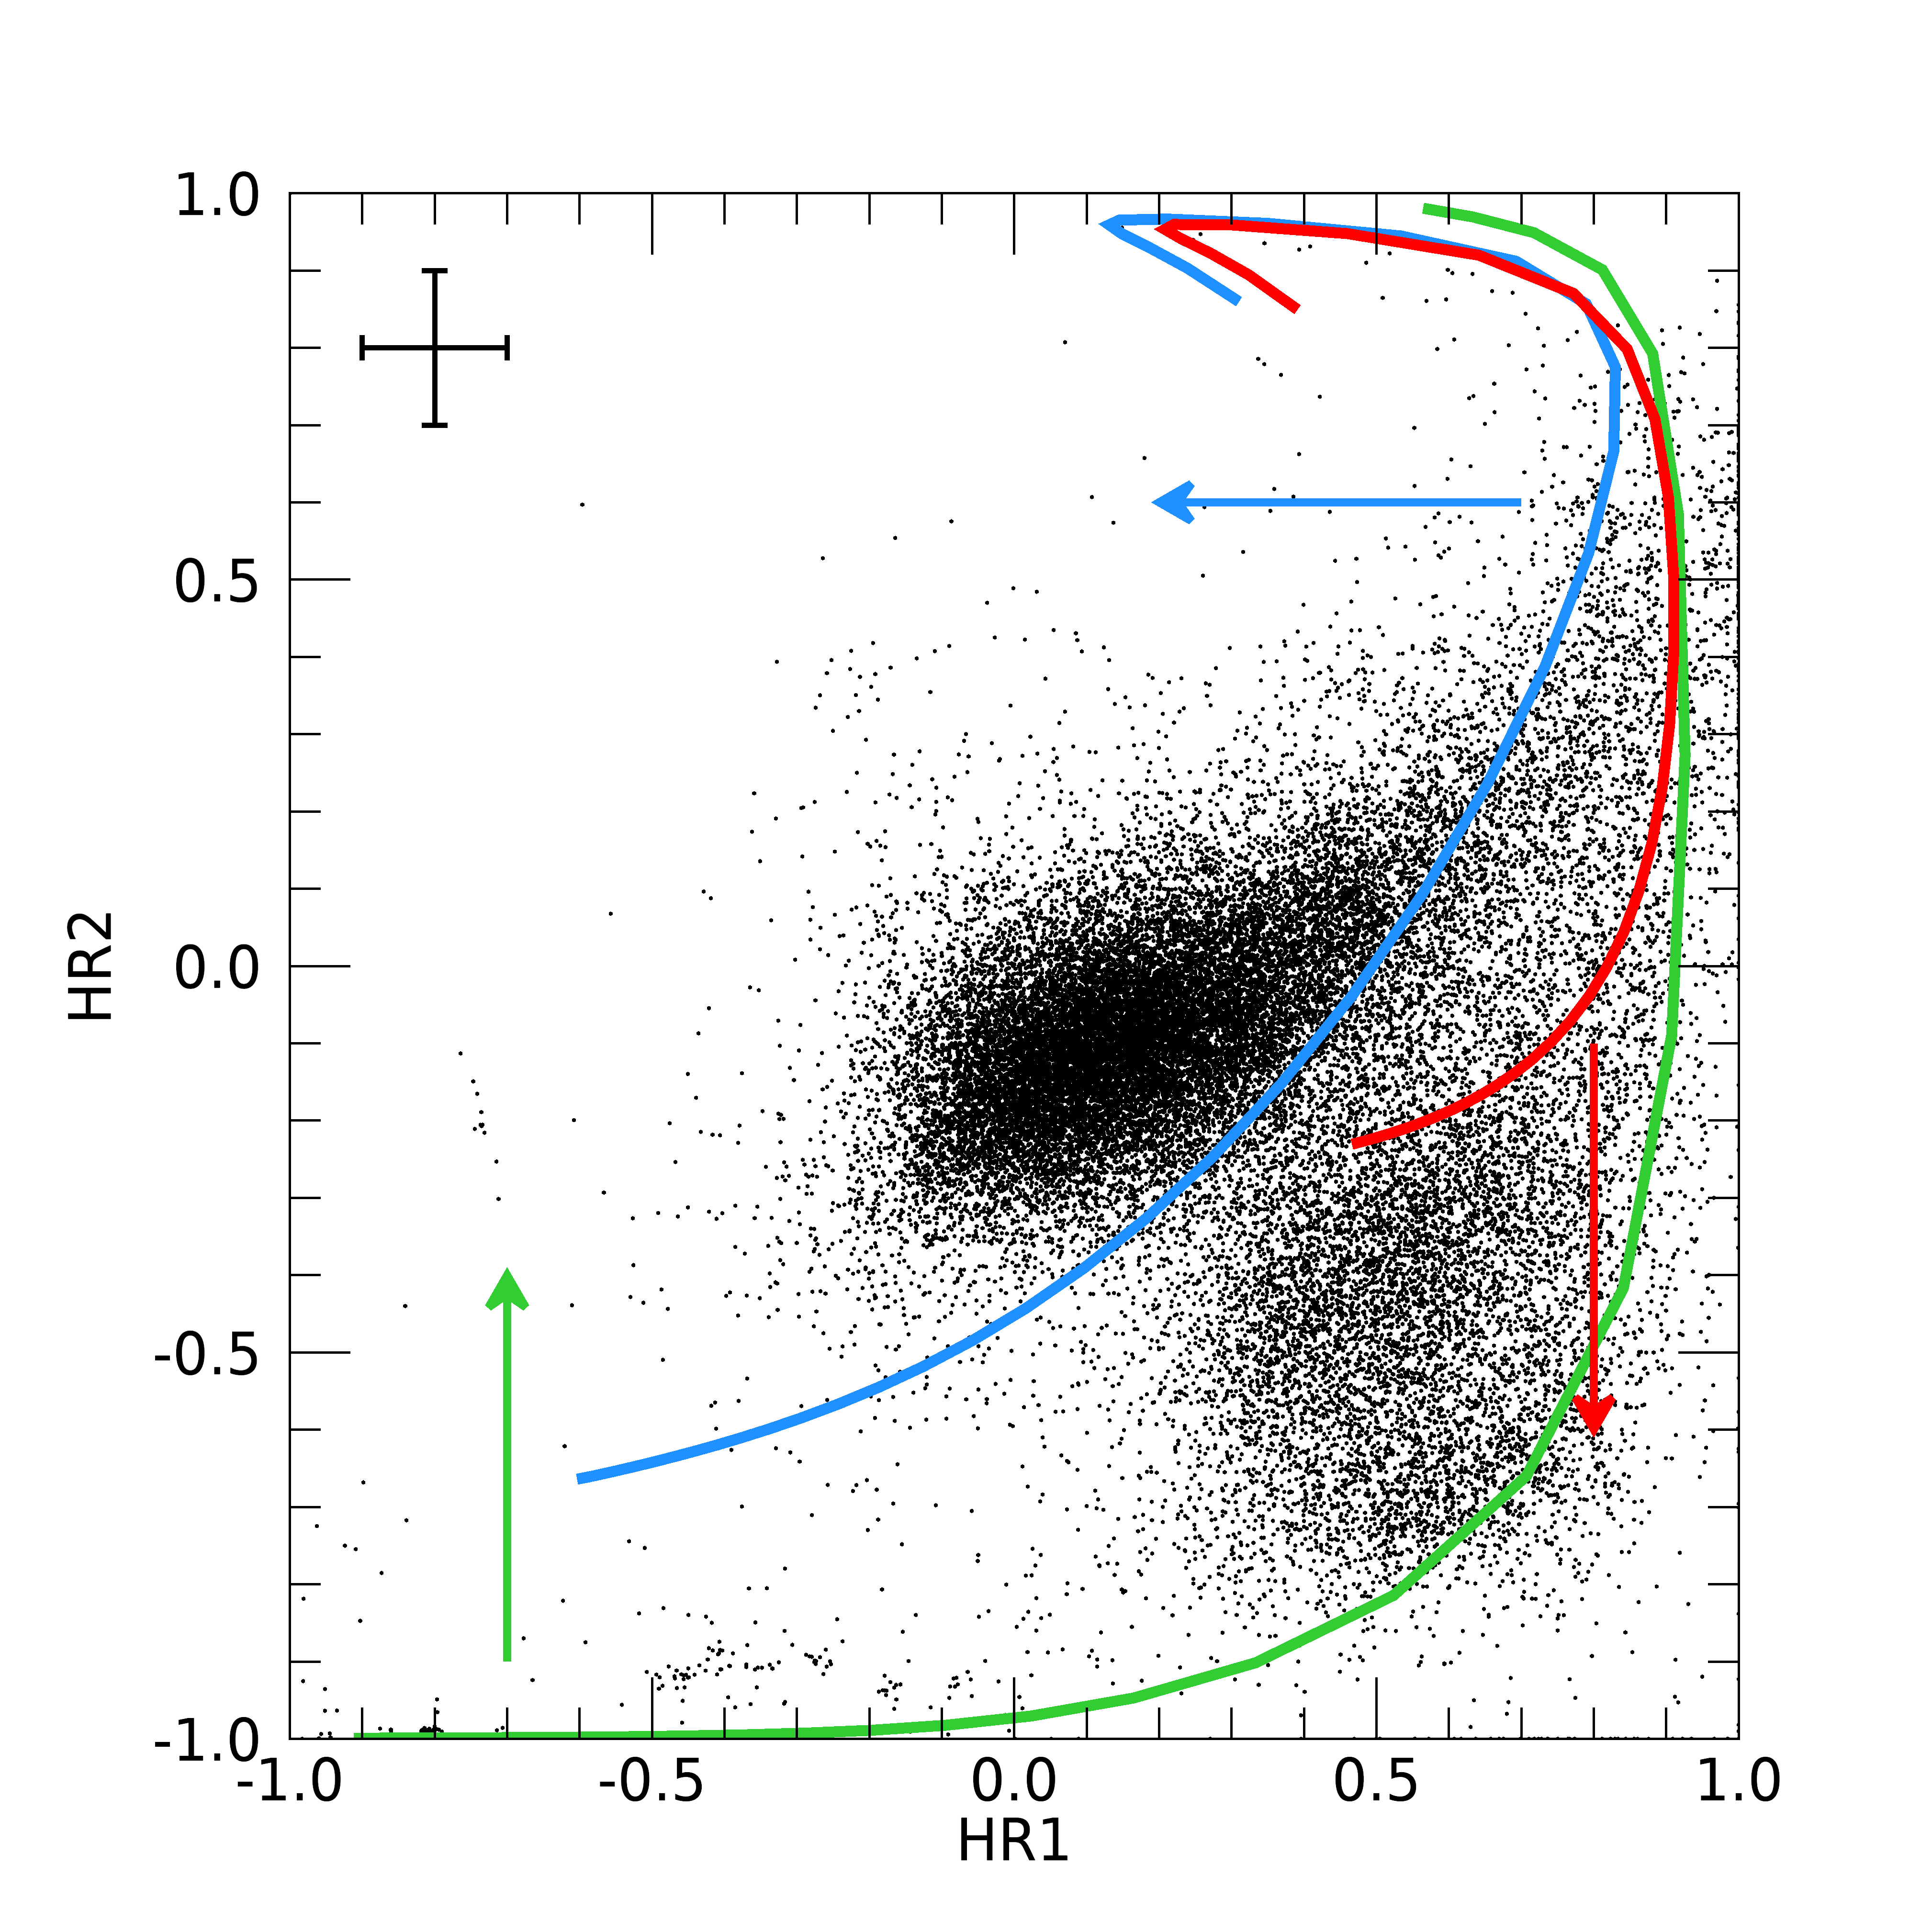
Knowing the spectral response of the X-ray detector, it is possible to compute the expected HR values for any specific source emission model and value of the interstellar absorption. For single-component models, one can fix the parameter (e.g. the photon index or the temperature) and vary the absorption to obtain tracks on the HR1–HR2 plane, such as those shown by the lines in Figure 1.
In order to derive HR values appropriate to select thermally emitting INSs, we considered a blackbody model with temperature keV and absorption column density cm-2. We used the models implemented in XSPEC, and the interstellar absorption with the Tuebingen-Boulder ISM absorption cross section, with abundances from Wilms et al. (2000). Folding the model with the response functions of the EPIC-pn camera for different operating modes, optical filters and off-axis angles, we computed the expected count rates in the five standard energy bands defined above. We found significant differences in the resulting HR values only as a function of the optical filters. In fact, the HRs computed for different observing modes and off-axis angles differ by less than 0.05. Therefore, in the following we adopted, for each of the three filters (thin, medium and thick) the corresponding HR values computed with the on-axis Full Frame response matrices.
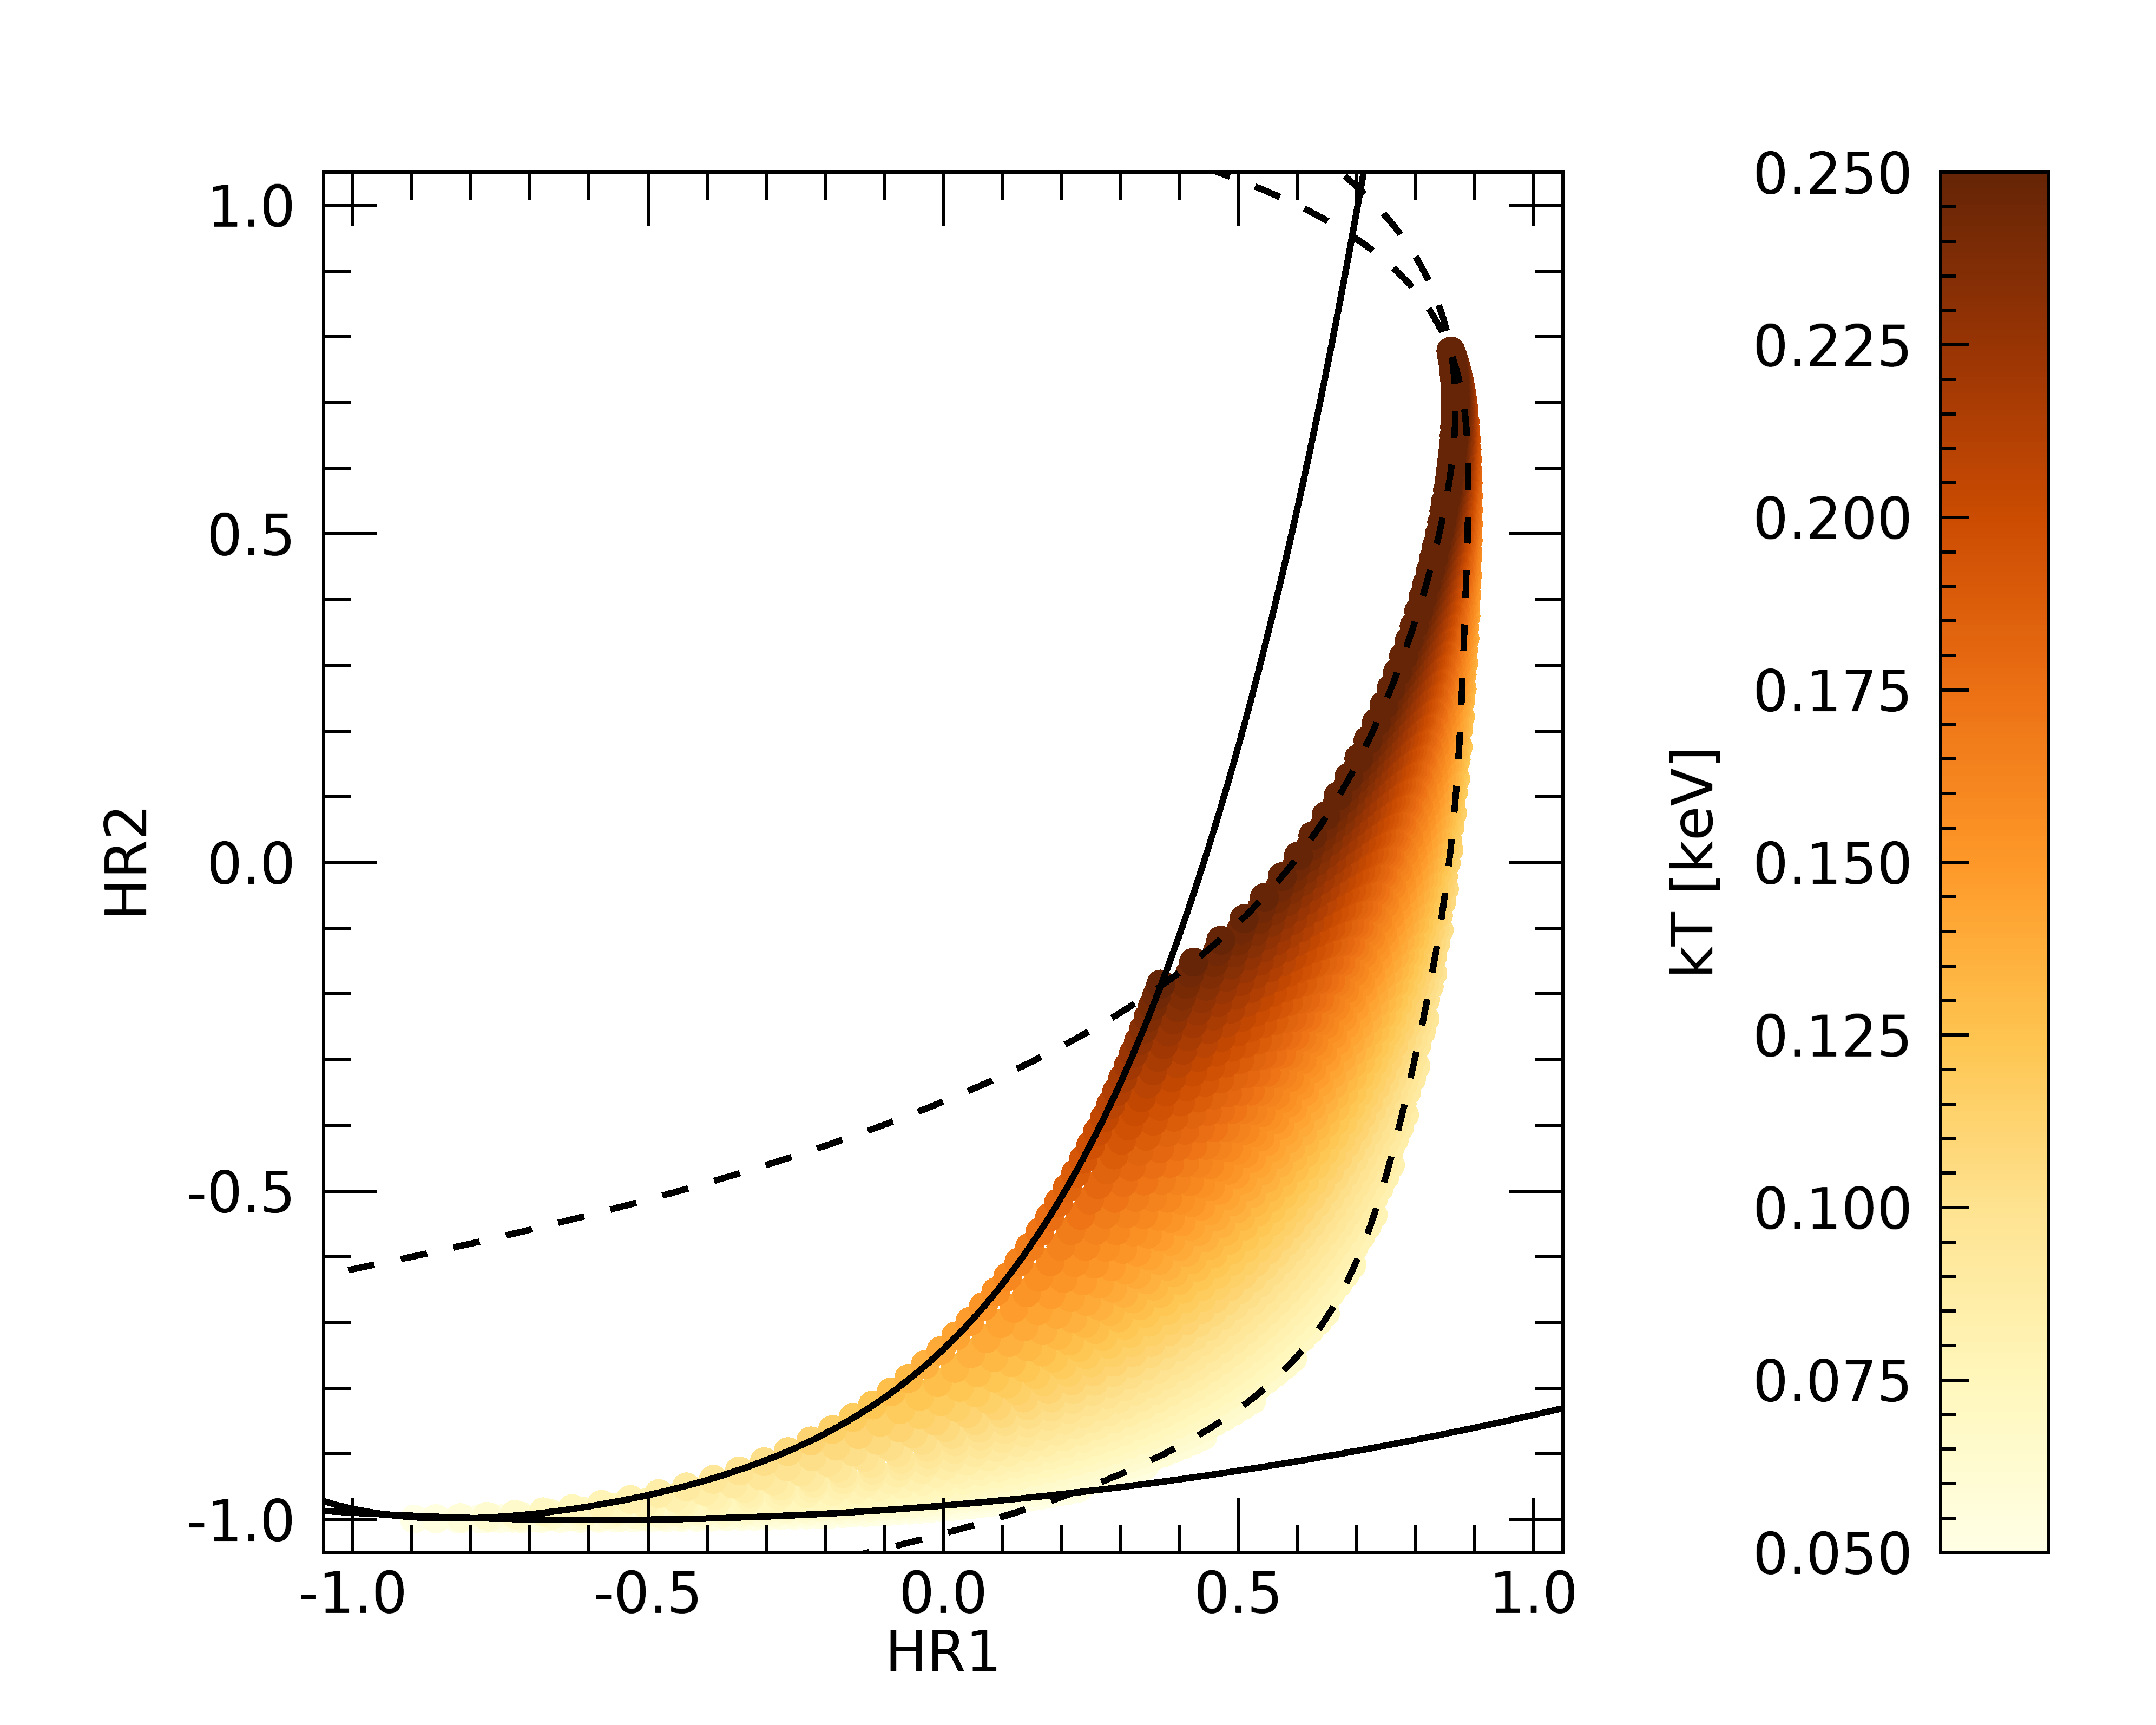
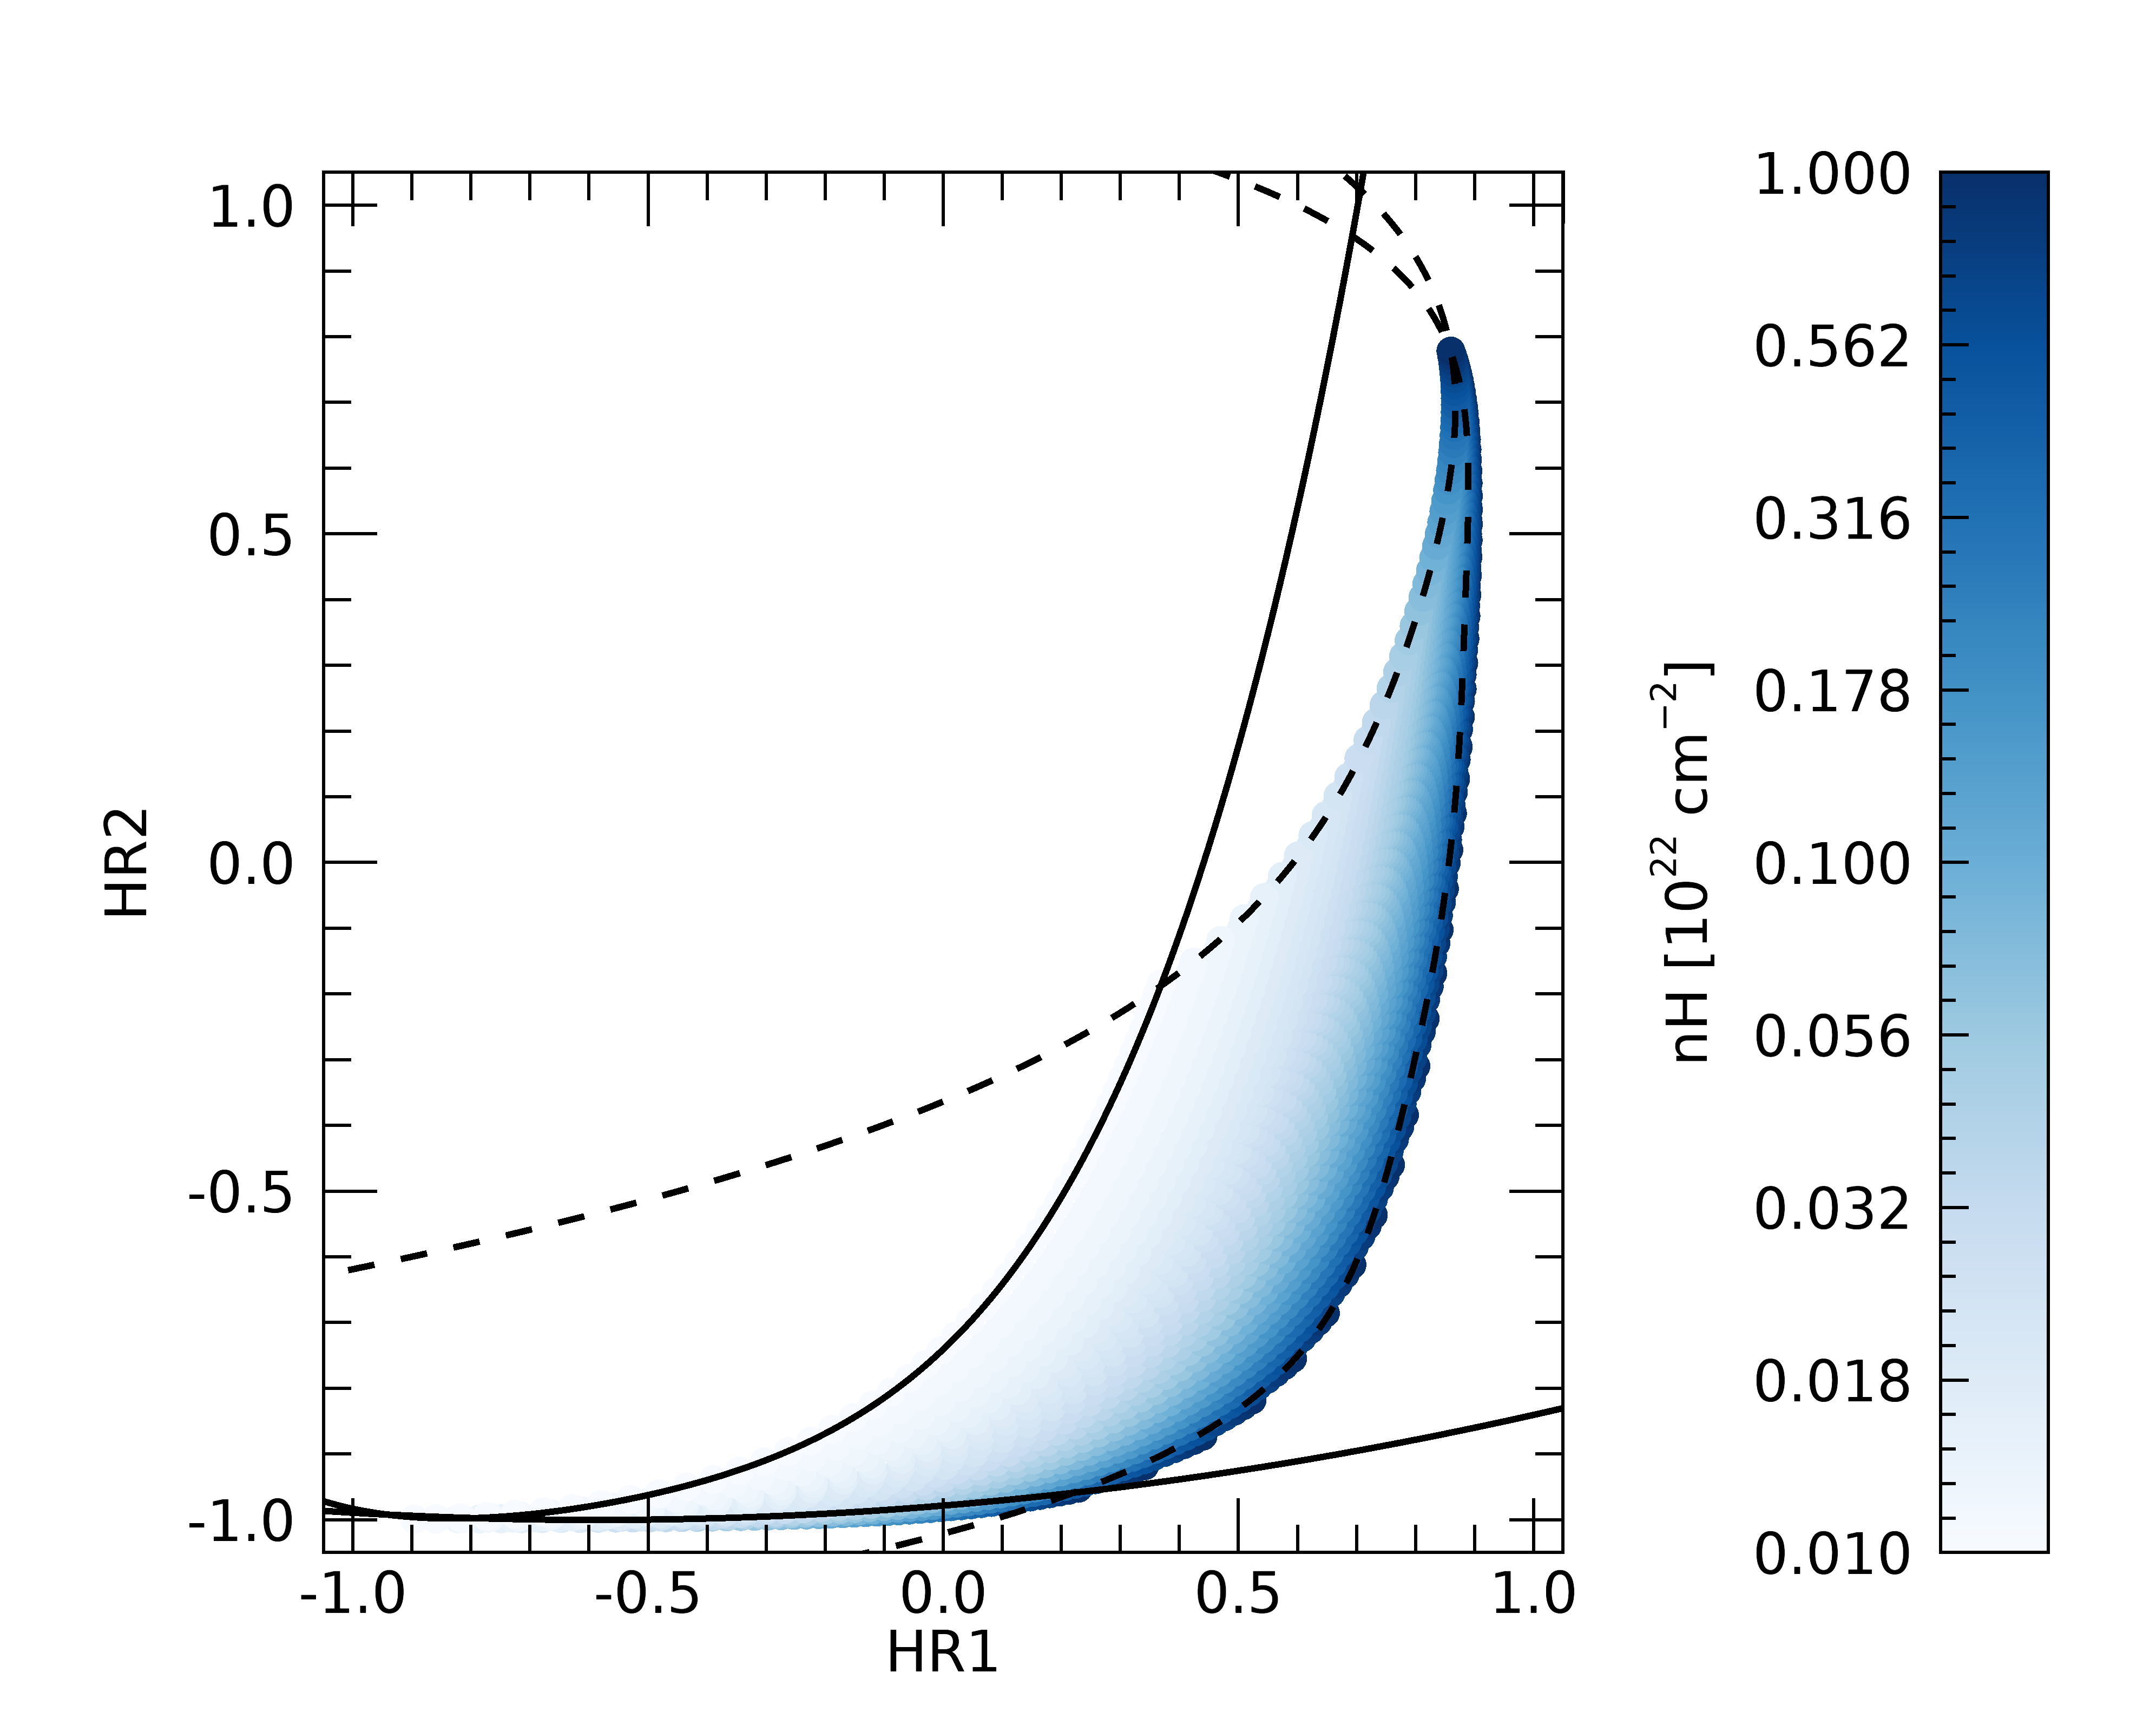
Figure 2 shows the HR1–HR2 plane for the thin filter. It is clear that, for the adopted model and range of parameters, only a specific region is occupied (HR HR1), and that to each (, ) pair corresponds a (HR1, HR2) pair. The temperature increases from low HR2 to high HR2 (left panel of Figure 2), while the absorption increases from low HR1 to high HR1 (right panel of Figure 2).
We performed polynomial fits to the curves that include the interesting region characterizing soft sources: The curves delimiting the left and the right sides were obtained varying and keeping fixed to and to cm-2, respectively; those for the lower and the upper sides were obtained varying and keeping fixed to 0.05 and 0.25 keV, respectively. We fitted the left and the lower sides with a function , while the right and the upper sides with , where refers to the different side and is the polynomial coefficient with varying from 0 to 6 at maximum. All the derived coefficients are listed in Table 1.
We performed the same kind of analysis on the HR3–HR4 plane, and we found that the numerical HRs are restricted in the lower left corner of the plane. Considering an error of 0.05, we obtained consistent values of maximum HRs for the three filters: , .
| Filter | Side | |||||||
|---|---|---|---|---|---|---|---|---|
| Thin | left | -0.741 | 0.853 | 1.271 | 1.146 | 0.486 | - | - |
| lower | -0.979 | 0.074 | 0.064 | - | - | - | - | |
| right | 0.857 | 0.133 | -0.222 | 0.024 | 0.399 | 0.100 | -0.692 | |
| upper | 0.593 | 0.881 | -1.328 | 1.628 | -1.042 | - | - | |
| Medium | left | -0.776 | 0.760 | 1.201 | 1.138 | 0.543 | - | - |
| lower | -0.979 | 0.074 | 0.065 | - | - | - | - | |
| right | 0.859 | 0.130 | -0.219 | 0.022 | 0.397 | 0.100 | -0.688 | |
| upper | 0.598 | 0.850 | -0.859 | 0.272 | - | - | - | |
| Thick | left | -0.834 | 0.592 | 1.038 | 1.238 | 0.690 | - | - |
| lower | -0.979 | 0.080 | 0.076 | - | - | - | - | |
| right | 0.862 | 0.125 | -0.207 | 0.022 | 0.360 | 0.103 | -0.651 | |
| upper | 0.599 | 0.771 | -0.558 | - | - | - | - |
Notes. Left and lower sides are obtained using the fitting function ; right and upper sides using .
3 Selection of INS candidates
Among all 849,991 detections contained in the 4XMM-DR10 catalog, we first excluded spurious detections (sc_sum_flag4) and those observations in which the pn was not operating. This reduced the total sample to detections, corresponding to unique sources. Then, we excluded sources that were flagged as extended (sc_ext_ml4) or as variable within the single observations (sc_var_flag"T").
In order to obtain reliable estimates of the source spectral shape, among the remaining sources, we retained only the detections with small HR errors, namely pn_hr1_err0.1 and pn_hr2_err0.1. This significantly reduced the number of selected detections: , corresponding to unique sources.
We searched for optical and/or infrared counterparts of the selected sources in the following catalogs: USNO A2.0 (Monet, 1998), USNO B1.0 (Monet et al., 2003), GAIA DR2 (Gaia Collaboration et al., 2018), SDSS DR12 (Alam et al., 2015), Pan-STARRS1 (Chambers et al., 2016) and 2MASS (Cutri et al., 2003).
We also considered the work of Khan (2017), which catalogs point-like sources in the vicinity of nearby galaxies (1.9 Mpc) observed by the Spitzer Space Telescope (3.6–8 m and 24 m, Werner et al. 2004). This allowed us to identify mid-IR luminous stars in the crowded and dusty disks of large star-forming galaxies, that are not detected in the near-IR and optical bands.
The cross-correlation task was performed using the online CDS X-Match Service222http://cdsxmatch.u-strasbg.fr/. The 4XMM-DR10 catalog provides for each source the radius of the statistical error region and a systematic error, that are added in quadrature to give the total positional uncertainty. Based on this uncertainty and on the positional errors of the used catalogs, we adopted a threshold in the correlation radius corresponding to a significance of , based on the prescription of Pineau et al. (2011).
In order to estimate the X-ray to optical/IR flux ratios, we computed the optical and IR fluxes from the magnitudes in the ( nm) and ( m) bands, following Maccacaro et al. (1988) and Cohen et al. (2003), respectively:
| (2) |
| (3) |
As already noticed by Lin et al. (2012), AGNs and stars are empirically separated by . We are interested in sources with or larger than 3, which do not appear in our sample due to the limiting magnitudes of the adopted catalogs. After removing the sources with an optical and/or IR counterpart, we are left with detections, corresponding to unique sources.
As a final step of the filtering process we wanted to select the softest sources, contained in the HR region shown in Figure 2, where for each observation we used the boundaries corresponding to the appropriate filter (see Table 1). We added in quadrature a systematic value of 0.05 to the statistical errors on HR to take into account the uncertainties in the predicted HR values described above. Sources were retained if their HR1 and HR2 were inside the boundaries and HR3 HR considering their 1 errors.
We did not use HR4 because such soft sources are not detected or have a very low signal to noise ratio above 2 keV. In this way we obtained detections, corresponding to unique sources. In Table 2 we summarize the steps of our filtering process of the 4XMM-DR10 catalog.
| Filter | N. detections | N. sources |
|---|---|---|
| Total | 849,991 | 575,158 |
| EPIC-pn | 688,081 | 496,716 |
| Point-like and non variable | 580,604 | 435,802 |
| pn_hr1,2_err0.1 | 34,141 | 24,961 |
| Without optical/IR counterpart | 3,755 | 2,290 |
| Soft sources according to Table 1 | 469 | 140 |
| Spurious or bright optical sources | 166 | 93 |
| Known | 288 | 41 |
| Unknown | 15 | 6 |
4 Characterization of soft sources
All the sources matching our selection criteria were checked individually in order to verify their nature. We found that a few tens of them were actually spurious detections caused by straylight from bright sources outside the field of view, or by point-like knots of extended sources such as bright SNRs. For other sources, we found plausible optical counterparts that were missed in the automatic cross-correlation due to a significant proper motion. We finally removed a couple of sources that lie within the soft region of the HR1–HR2 plane only in one detection out of many, but had average values of HR consistently outside of the region.
This further screening reduced the sample to 47 sources, six of which are not associated to any known X-ray object (see Table 3). The latter, being very soft, non-variable point-like sources can be considered as potential INS candidates.
Many of the sources already identified are superimposed, or close to, nearby galaxies. To verify a possible association, we compared their position with the apparent dimensions of the galaxy, defined by the minor and major isophotal () diameters, and their position angle, as reported in The Third Reference Catalogue of Bright Galaxies (de Vaucouleurs et al., 1991)333See also https://heasarc.gsfc.nasa.gov/W3Browse/all/rc3.html. Most of the sources with an associated galaxy in Table 3, are located inside the ellipse. Only two sources are located at much larger distances, at 3 and 5 times the isophotal radius. The first one, 4XMM J040325.2431721 is probably a background AGN (Ducci et al., 2014), while 4XMM J031722.7663704 is one of the unidentified sources (see Section 4.3).
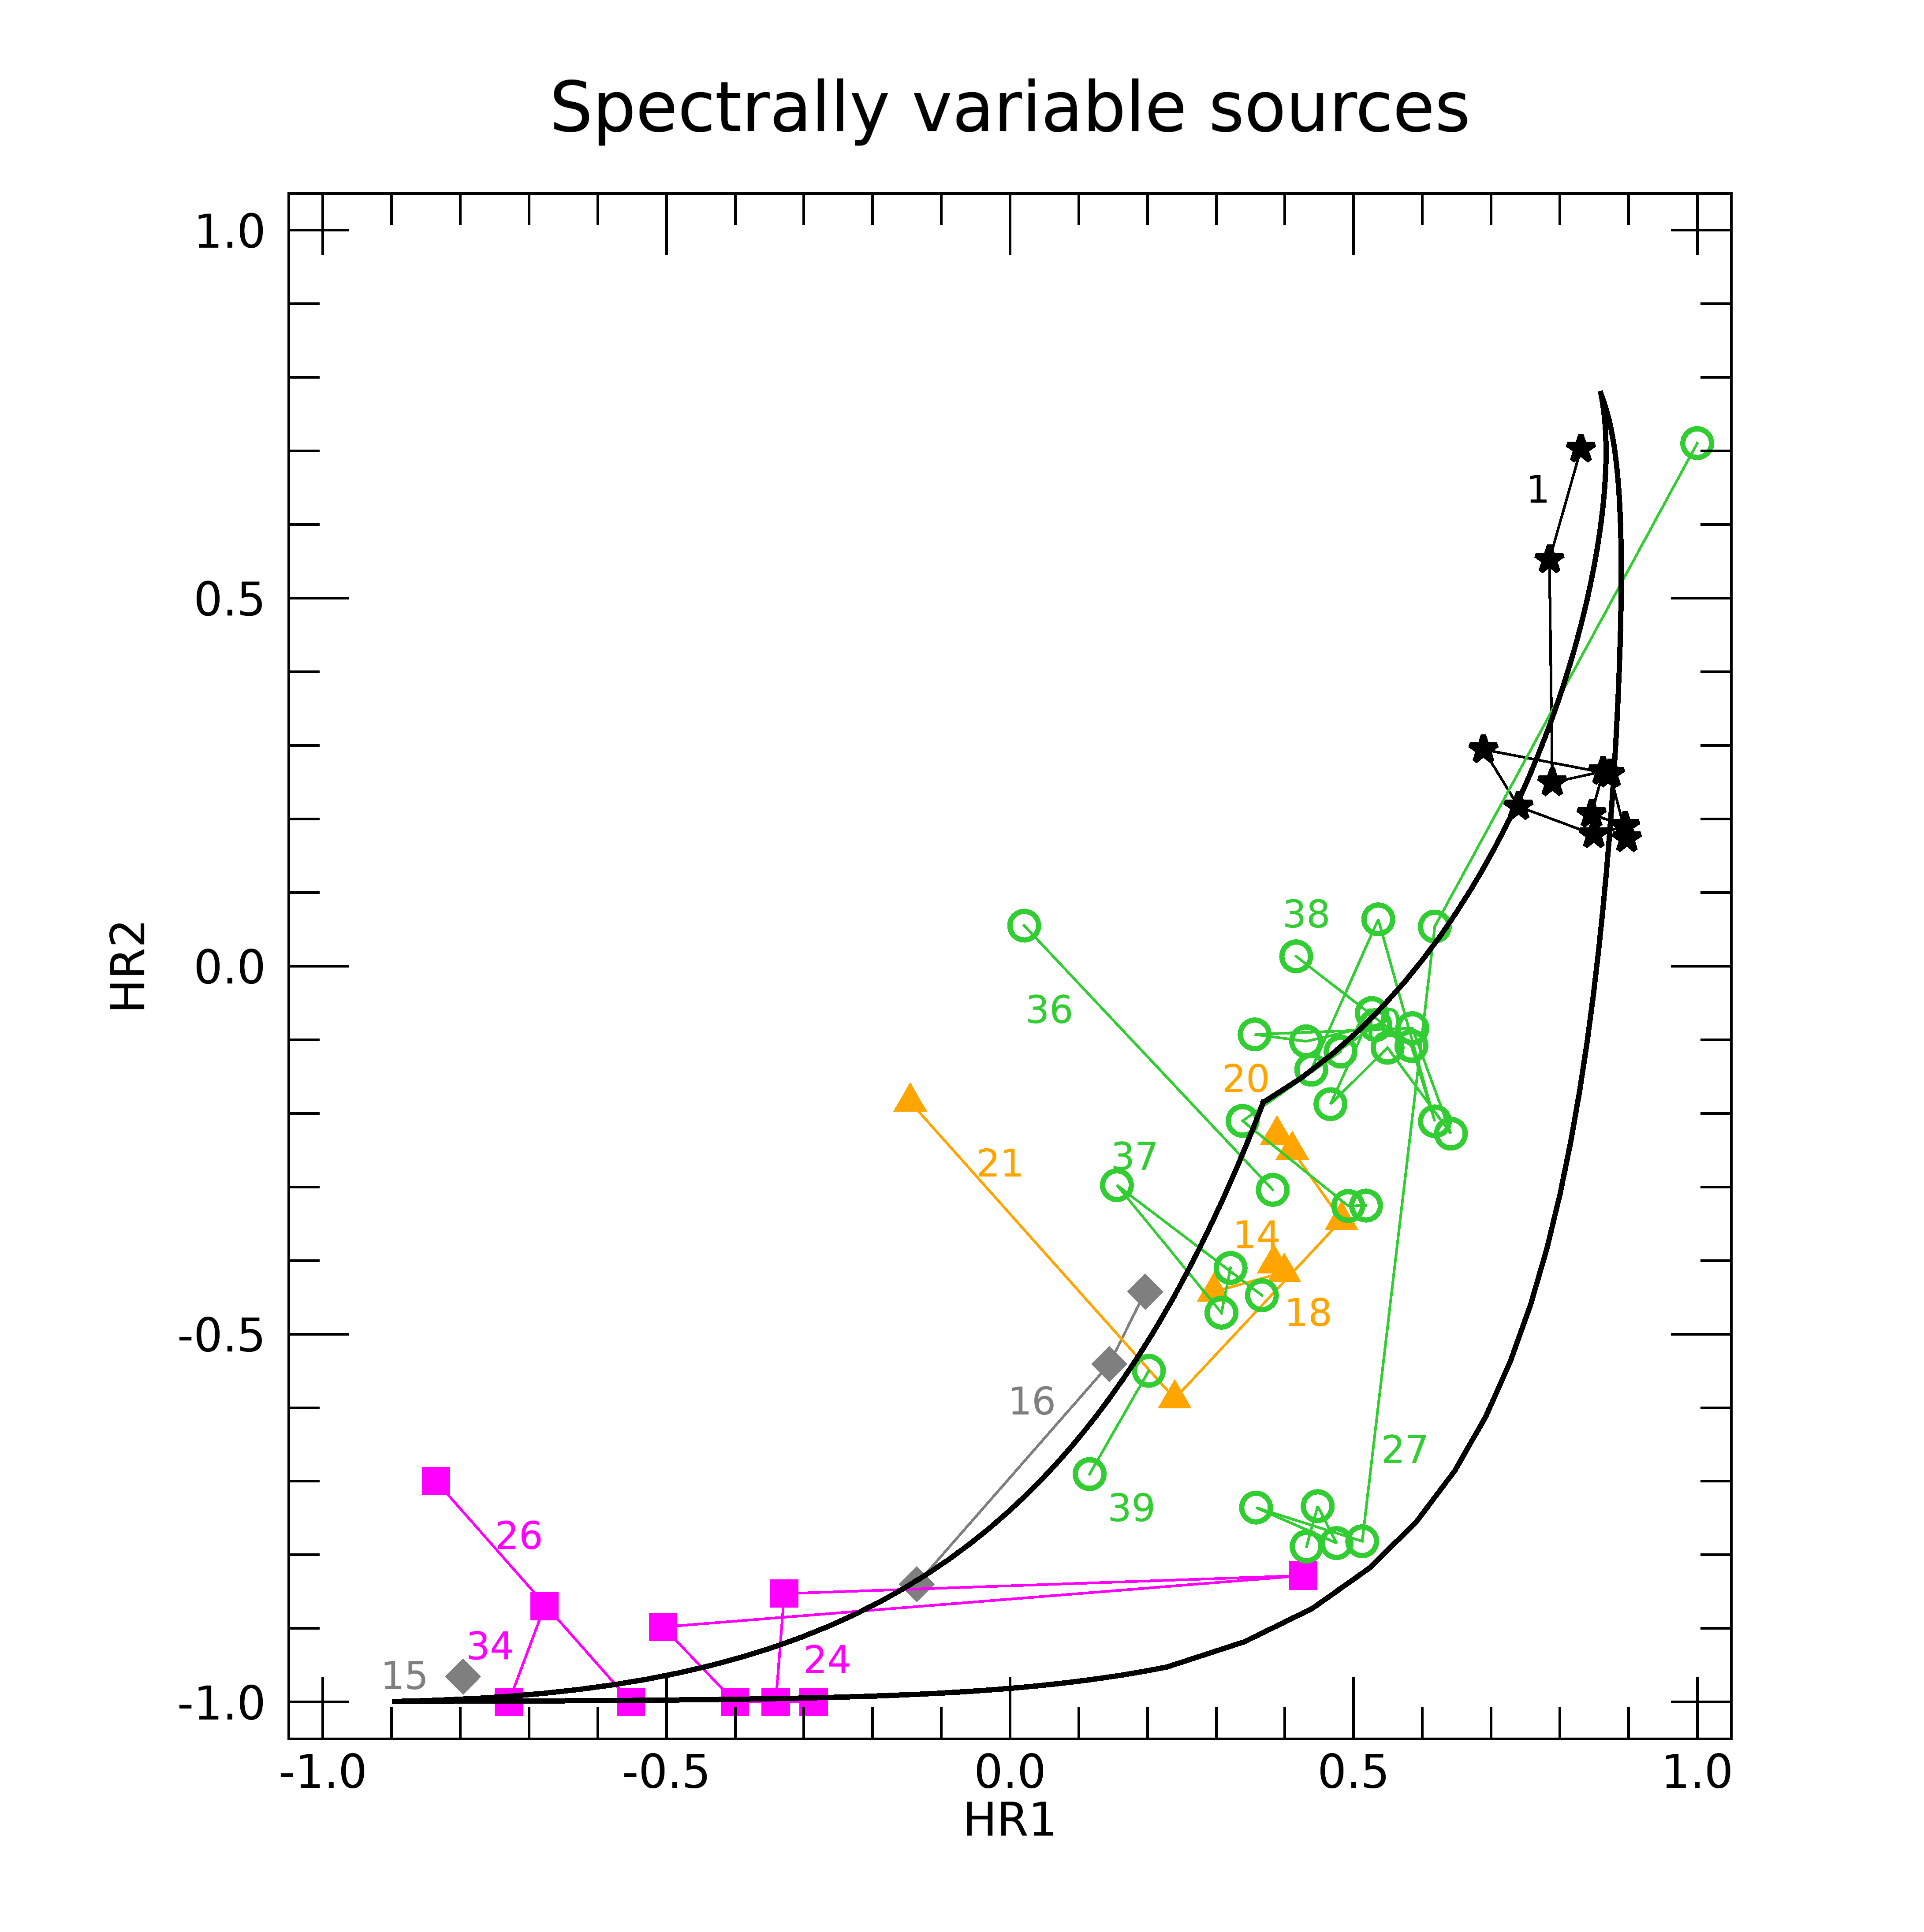
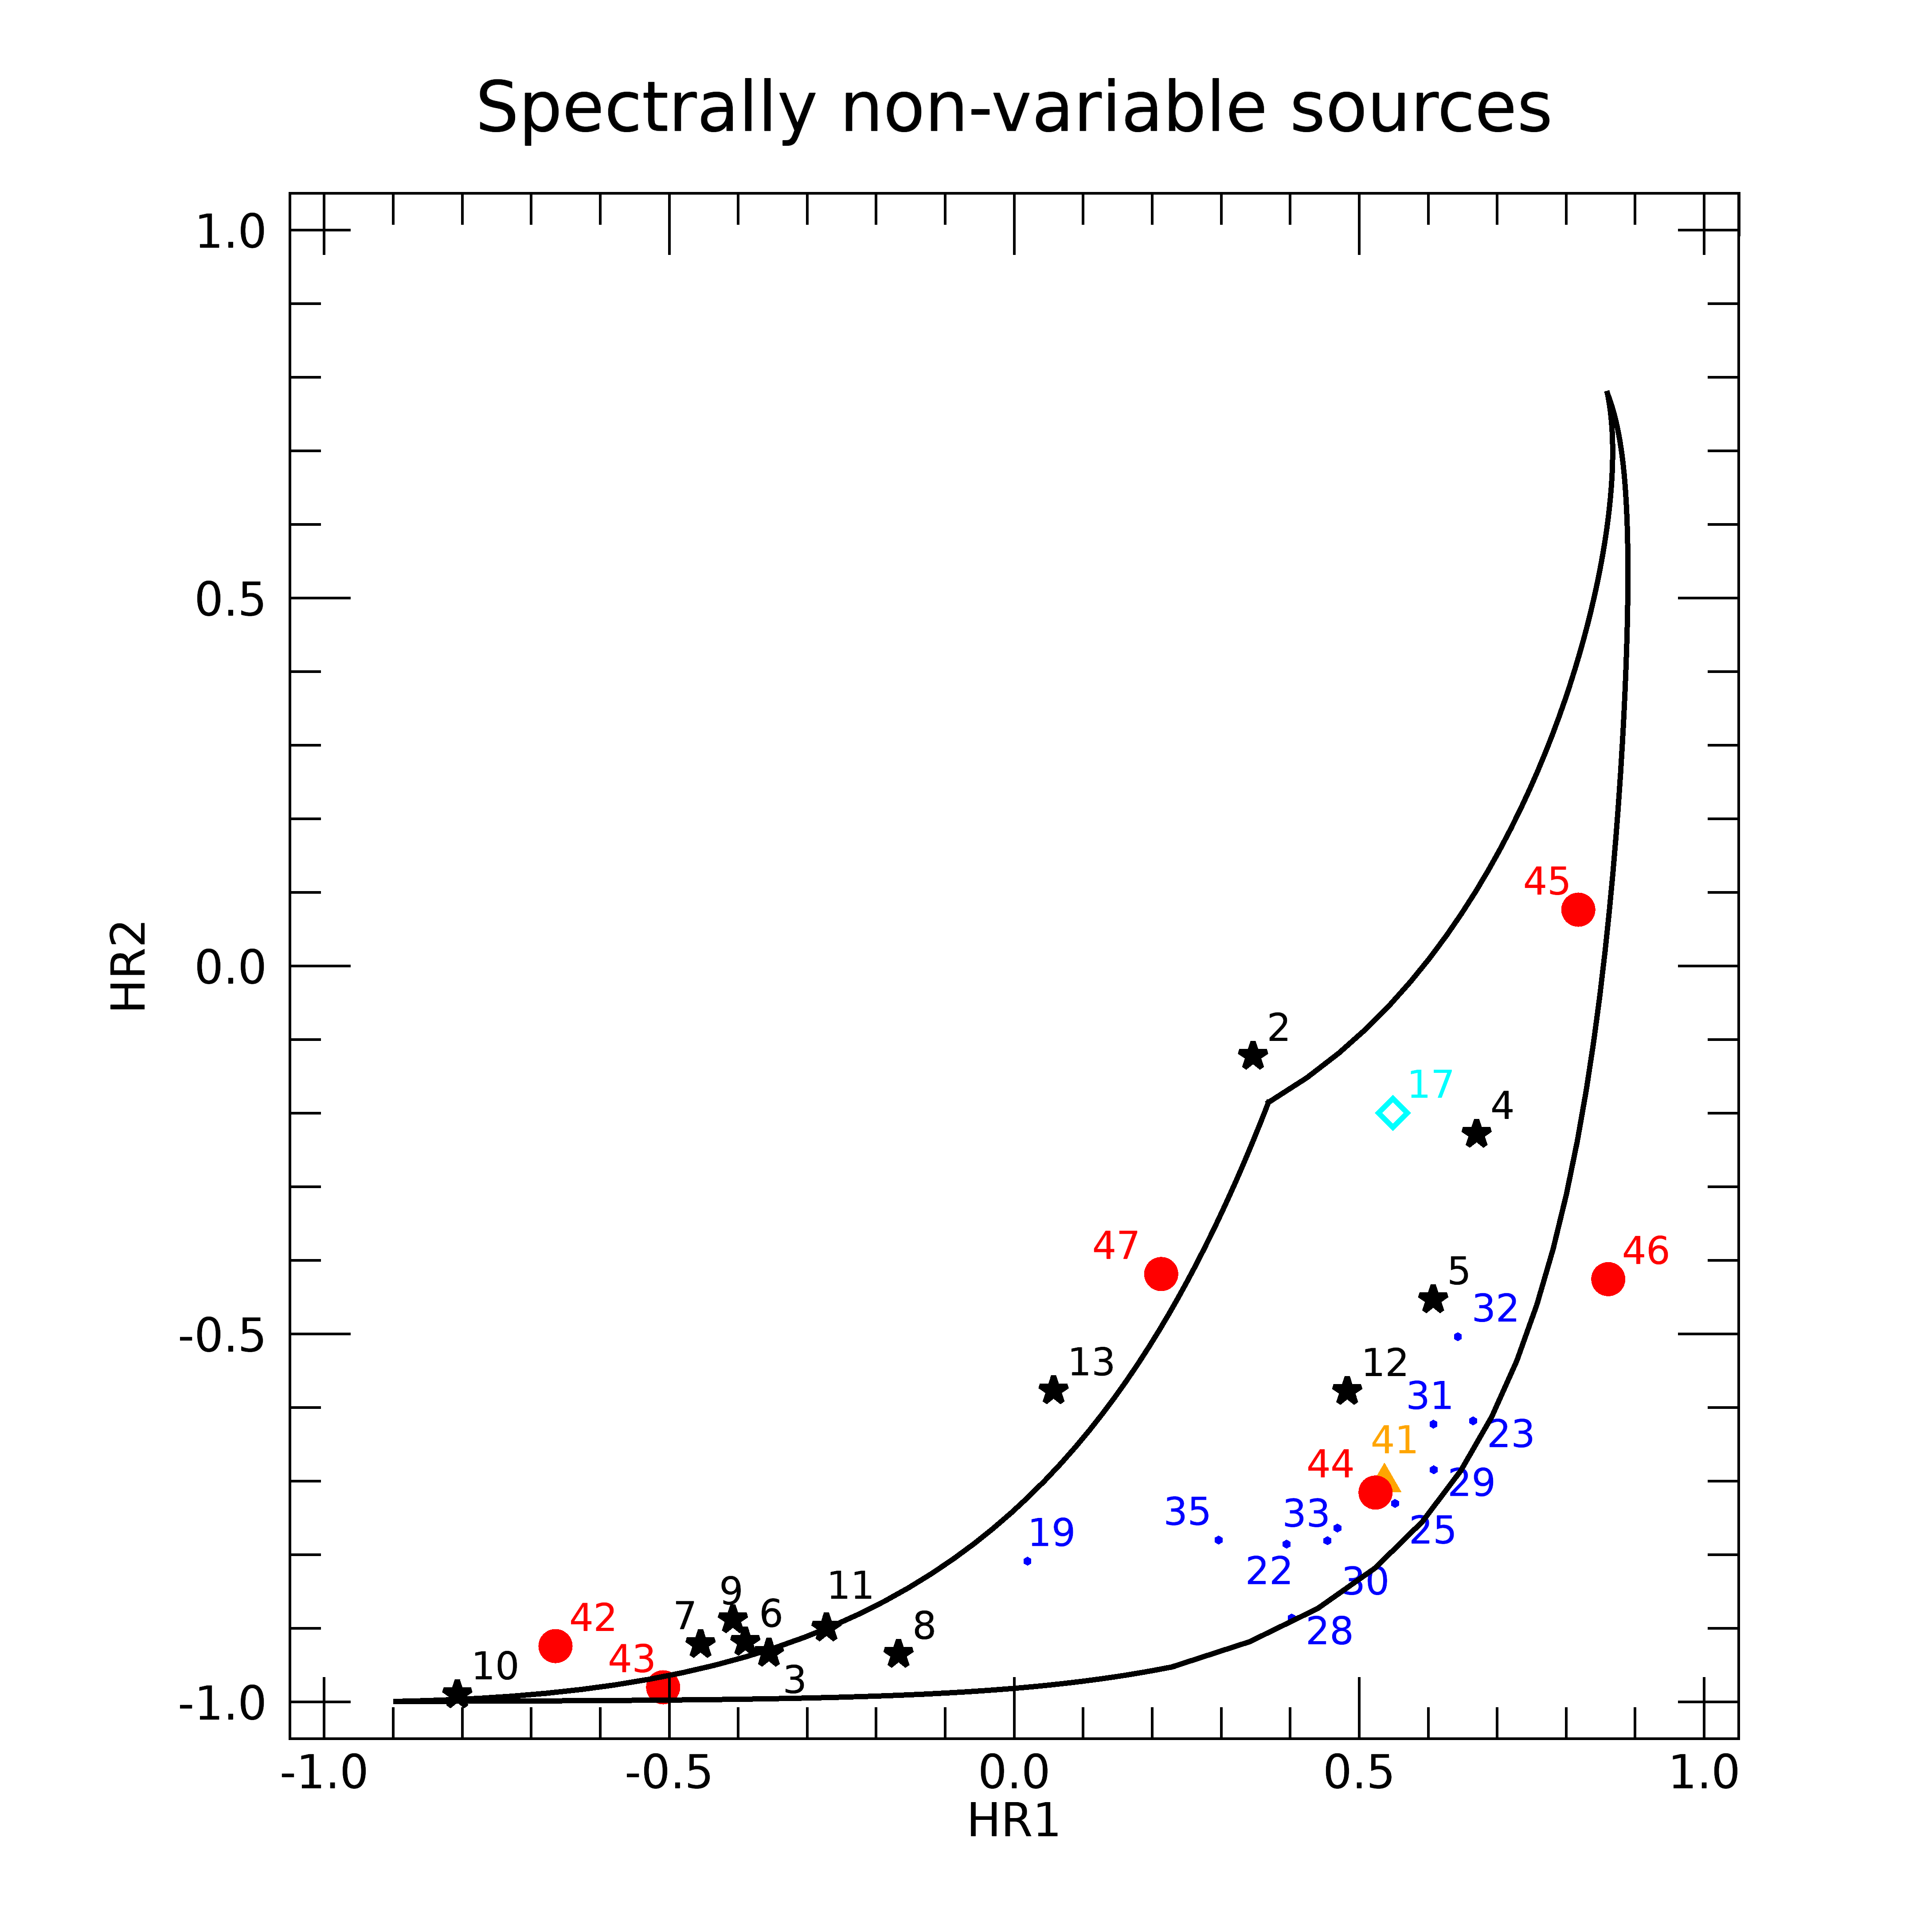
Another property that can help to classify X-ray sources is the evolution of the spectrum through different epochs. Most of the 47 selected sources were observed several times by XMM-Newton. We divided these sources into two groups: The spectrally non-variable ones, that have consistent HR values across all observations, and the spectrally variable sources, that have significantly different HR values in different epochs. This spectral variability can be visualized by tracks in the HR1–HR2 plane. Figure 3 shows the HR1 and HR2 values of the spectrally variable (left panel) and non-variable (right panel) sources.
We immediately notice the high correlation between the source class and its spectral variability: Among the variable sources there are extra-galactic objects as SSSs (magenta squares), ULXs (green empty dots), LMXBs (orange triangles), and one peculiar tidal disruption event (TDE, gray diamond), already noticed for its remarkably soft spectrum by Lin et al. (2018). We also included in the plot three sources (number 14, 15 and 20) even if they have only one XMM-Newton detection, because their variability was measured by Chandra and Swift-XRT. The first source, 4XMM J063045.4603131, is most likely either a TDE (Mainetti et al., 2016) or a galactic Nova (Oliveira et al., 2017), while the other two are LMXBs in the Centauri globular cluster (Cool et al., 2013) and in M31 (Barnard et al., 2014).
Strong spectral variability is also visible in the magnetar SGR J04185729 (Guillot et al., 2015). All the other INSs (black stars) have steady HRs: We found the central compact object 1E 1207.45209 (Bignami et al., 2003), the high magnetic field pulsar J07262612 (Rigoselli et al., 2019a), two thermally-emitting pulsars (McGowan et al., 2006; Ng et al., 2007), the INS candidate of Pires et al. (2015) and, as expected, six of the seven known XDINSs (the lack of RX J0420.05022 is due to the fact that its spectrum is so soft that its HR2 had error 0.1). We also found PSR J14001431, a binary system composed of a millisecond pulsar and a white dwarf (Swiggum et al., 2017).
The other bulk of spectrally non-variable sources is made up of SNRs (blue small dots) in nearby galaxies, as M31 and M33, the AGN candidate (cyan empty diamond) previously mentioned and one HMXB in NGC 7793 (Mineo et al., 2012). Finally, we showed with red dots the six INS candidates.
| Num. | Name | Detections | Class | Location | Ref. | ||||
| 4XMM | erg s-1 cm-2 | kpc | erg s-1 | ||||||
| 1 | J041833.8573223 | 11 | INS/magnetar | - | - | 2 | [1] | ||
| 2 | J121000.9522628 | 24 | INS/CCO | - | - | 2.1 | [2] | ||
| 3 | J072608.1261238 | 1 | INS/HB | - | - | 1 | [3] | ||
| 4 | J053825.1281709 | 1 | INS/RPP | - | - | 1.3 | [4] | ||
| 5 | J233705.7615101 | 1 | INS/RPP | - | - | 0.70 | [5] | ||
| 6 | J072024.9312549 | 20 | INS/XDINS | - | - | 0.286 | [6] | ||
| 7 | J080623.3412230 | 15 | INS/XDINS | - | - | 0.250 | [6] | ||
| 8 | J130848.1212706 | 13 | INS/XDINS | - | - | 0.500 | [6] | ||
| 9 | J160518.4324919 | 12 | INS/XDINS | - | - | 0.390 | [6] | ||
| 10 | J185635.9375436 | 39 | INS/XDINS | - | - | 0.123 | [6] | ||
| 11 | J214303.3065417 | 12 | INS/XDINS | - | - | 0.430 | [6] | ||
| 12 | J104608.7594306 | 8 | INS | - | - | - | - | [7][8] | |
| 13 | J140037.0143146 | 1 | MSP/WD | - | - | 0.278 | [9] | ||
| 14 | J132619.8472910 | 1 | LMXB | NGC 5139 c | - | 5.24 | [10] | ||
| 15 | J063045.4603113 | 1 | TDE/Nova | - | - | - | - | [11][12] | |
| 16 | J215022.4055109 | 3 | TDE | Gal1 d | - | 247,000 | [13] | ||
| 17 | J040325.2431721 | 1 | AGN | NGC 1512 e | 3.019 | - | - | [14] | |
| 18 | J004217.2411537 | 2 | LMXB | M31 | 0.017 | 778 | [15] | ||
| 19 | J004239.9404320 | 8 | SNR | M31 | 0.428 | 778 | [15] | ||
| 20 | J004252.5411631 | 1 | LMXB | M31 | 0.001 | 778 | [15][16] | ||
| 21 | J004315.5412439 | 4 | LMXB | M31 | 0.012 | 778 | [15] | ||
| 22 | J004339.2412653 | 41 | SNR | M31 | 0.029 | 778 | [15] | ||
| 23 | J004711.9252038 | 9 | SNR | NGC 253 | 0.187 | 3,500 | [17] | ||
| 24 | J005413.0373308 | 6 | SSS | NGC 300 | 1.227 | 1,860 | [18] | ||
| 25 | J005445.2374146 | 7 | SNR | NGC 300 | 0.039 | 1,860 | [19] | ||
| 26 | J005455.0374116 | 2 | SSS | NGC 300 | 0.001 | 1,860 | [20] | ||
| 27 | J022242.1422402 | 7 | ULX | NGC 891 | 0.381 | 12,000 | [21] | ||
| 28 | J013311.1303943 | 27 | SNR | M33 | 0.153 | 915 | [22] | ||
| 29 | J013311.7303841 | 28 | SNR | M33 | 0.139 | 915 | [22] | ||
| 30 | J013329.4304911 | 15 | SNR | M33 | 0.186 | 915 | [22] | ||
| 31 | J013331.2303333 | 29 | SNR | M33 | 0.047 | 915 | [22] | ||
| 32 | J013335.8303627 | 24 | SNR | M33 | 0.021 | 915 | [22] | ||
| 33 | J013354.8303311 | 18 | SNR | M33 | 0.050 | 915 | [22] | ||
| 34 | J013409.9303220 | 2 | SSS | M33 | 0.121 | 915 | [22] | ||
| 35 | J013410.6304224 | 17 | SNR | M33 | 0.033 | 915 | [22] | ||
| 36 | J121657.0374335 | 2 | ULX | NGC 4244 | 1.081 | 4,800 | [23] | ||
| 37 | J122601.4333131 | 4 | ULX | NGC 4395 | 0.187 | 4,300 | [21] | ||
| 38 | J151607.2561552 | 13 | ULX | NGC 5907 | 0.476 | 16,400 | [21] | ||
| 39 | J223545.0260451 | 2 | ULX | NGC 7314 | 0.633 | 16,750 | [21] | ||
| 40 | J231823.9422354 | 4 | ULX | NGC 7582 | 0.720 | 21,200 | [21] | ||
| 41 | J235800.3323454 | 10 | HMXB | NGC 7793 | 0.285 | 3,900 | [24] | ||
| 42 | J022141.5735632 | 1 | ? | - | - | - | - | - | |
| 43 | J031722.7663704 | 29 | ? | NGC 1313 e | 4.825 | - | - | - | |
| 44 | J175437.8294149 | 4 | ? | - | - | - | - | - | |
| 45 | J180528.2273158 | 1 | ? | - | - | - | - | - | |
| 46 | J181844.3120751 | 3 | ? | - | - | - | - | - | |
| 47 | J220221.4015330 | 1 | ? | - | - | - | - | - |
Notes. Sources are listed according to their locations and their classes: Central compact object (CCO); high-B pulsar (HB); rotation-powered pulsar (RPP); X-ray-dim isolated neutron star (XDINS); millisecond pulsar (MSP); white dwarf (WD); low-mass and high-mass X-ray binary (LMXB and HMXB); tidal disruption event (TDE); active galactic nuclei (AGN); supernova remnant (SNR); super-soft source (SSS); ultraluminous X-ray source (ULX). In brackets are tentative classifications.
a Parameter computed from and to determine if the source is within the isophotal ellipse.
b Flux in 0.2–2 keV reported in the 4XMM-DR10 catalog and calculated assuming a power-law spectrum (; cm-2). In case of sources with multiple detections, we reported the average value.
c Globular cluster also known as Centauri.
d Galaxy 2MASX J21502221-0550590.
e Due to the large value of an association with the galaxy is unlikely.
References: [1] Guillot et al. (2015); [2] Bignami et al. (2003); [3] Rigoselli
et al. (2019a); [4] McGowan et al. (2006); [5] Ng et al. (2007); [6] Turolla (2009); [7] Pires
et al. (2009b); [8] Pires et al. (2015); [9] Swiggum
et al. (2017); [10] Cool
et al. (2013); [11] Mainetti
et al. (2016); [12] Oliveira et al. (2017); [13] Lin
et al. (2018); [14] Ducci et al. (2014); [15] Stiele
et al. (2011); [16] Barnard et al. (2014); [17] Barnard
et al. (2008); [18] Lin
et al. (2014); [19] Pannuti et al. (2000); [20] Carpano et al. (2006); [21] Earnshaw et al. (2019); [22] Pietsch
et al. (2004); [23] Cagnoni et al. (2003); [24] Mineo
et al. (2012).
4.1 Analysis of the six unknown sources
To study in more detail the six sources of unknown nature and located far from nearby galaxies that we consider as potential INS candidates, we analyzed other observations in the Chandra, Swift-XRT and XMM-Newton public archives.
In order to maximize the signal-to-noise ratio for these generally faint sources, we extracted their EPIC-pn spectra using the maximum likelihood method as described in Rigoselli et al. (2019b); Rigoselli et al. (2021). The energy bins are chosen in such a way to have a significant detection, that means at least 50 counts per bin. Spectral fitting was done with the XSPEC software.
For all the sources discussed below, power-law models could be rejected with high confidence either because of reduced or because of unphysically large photon indices ().
| Name | Spectral | a | dof | nhp | |||||
| 4XMM | model | cm-2 | cm-2 | keV | km | erg s-1 cm-2 | b | ||
| J022141.5735632 | BB | 1.4 | 23.10 / 16 | 0.111 | |||||
| J022141.5735632 | PL+BB | 1.4 | 13.51 / 15 | 0.563 | |||||
| J022141.5735632 | BB+BB | 1.4 | 9.08 / 15 | 0.873 | |||||
| J031722.7663704 | BB | 0.6 | 112.41 / 76 | 0.004 | |||||
| J175437.8294149 c | BB | 3.9 | 8.50 / 10 | 0.580 | |||||
| J180528.2273158 | BB | 2.9 | 15.62 / 17 | 0.551 | |||||
| J181844.3120751 | APEC | 7.1 | - | - | 39.53 / 23 | 0.017 | |||
| J220221.4015330 d | PL+BB | 0.4 | - | 49.41 / 40 | 0.146 | ||||
| J220221.4015330 d | BB+BB | 0.4 | - | 43.89 / 40 | 0.310 | ||||
| J220221.4015330 d | BREMSS | 0.4 | - | - | 49.10 / 42 | 0.210 |
Notes. Best-fit parameters of the EPIC-pn spectra of the listed sources. Errors at 1. The fluxes, corrected for the absorption, are evaluated between 0.2 and 2 keV. a Total Hi column density for the source position according to the sky map of HI4PI Collaboration et al. (2016). b Computed extrapolating at optical wavelengths ( nm) the best-fitting X-ray blackbody. c A Chandra ACIS-I spectrum is jointly fitted. d A Chandra ACIS-S and a Swift-XRT spectra are jointly fitted. Given that the source flux is variable, we reported the ones measured from the XMM-Newton detection.
4.2 4XMM J022141.5735632
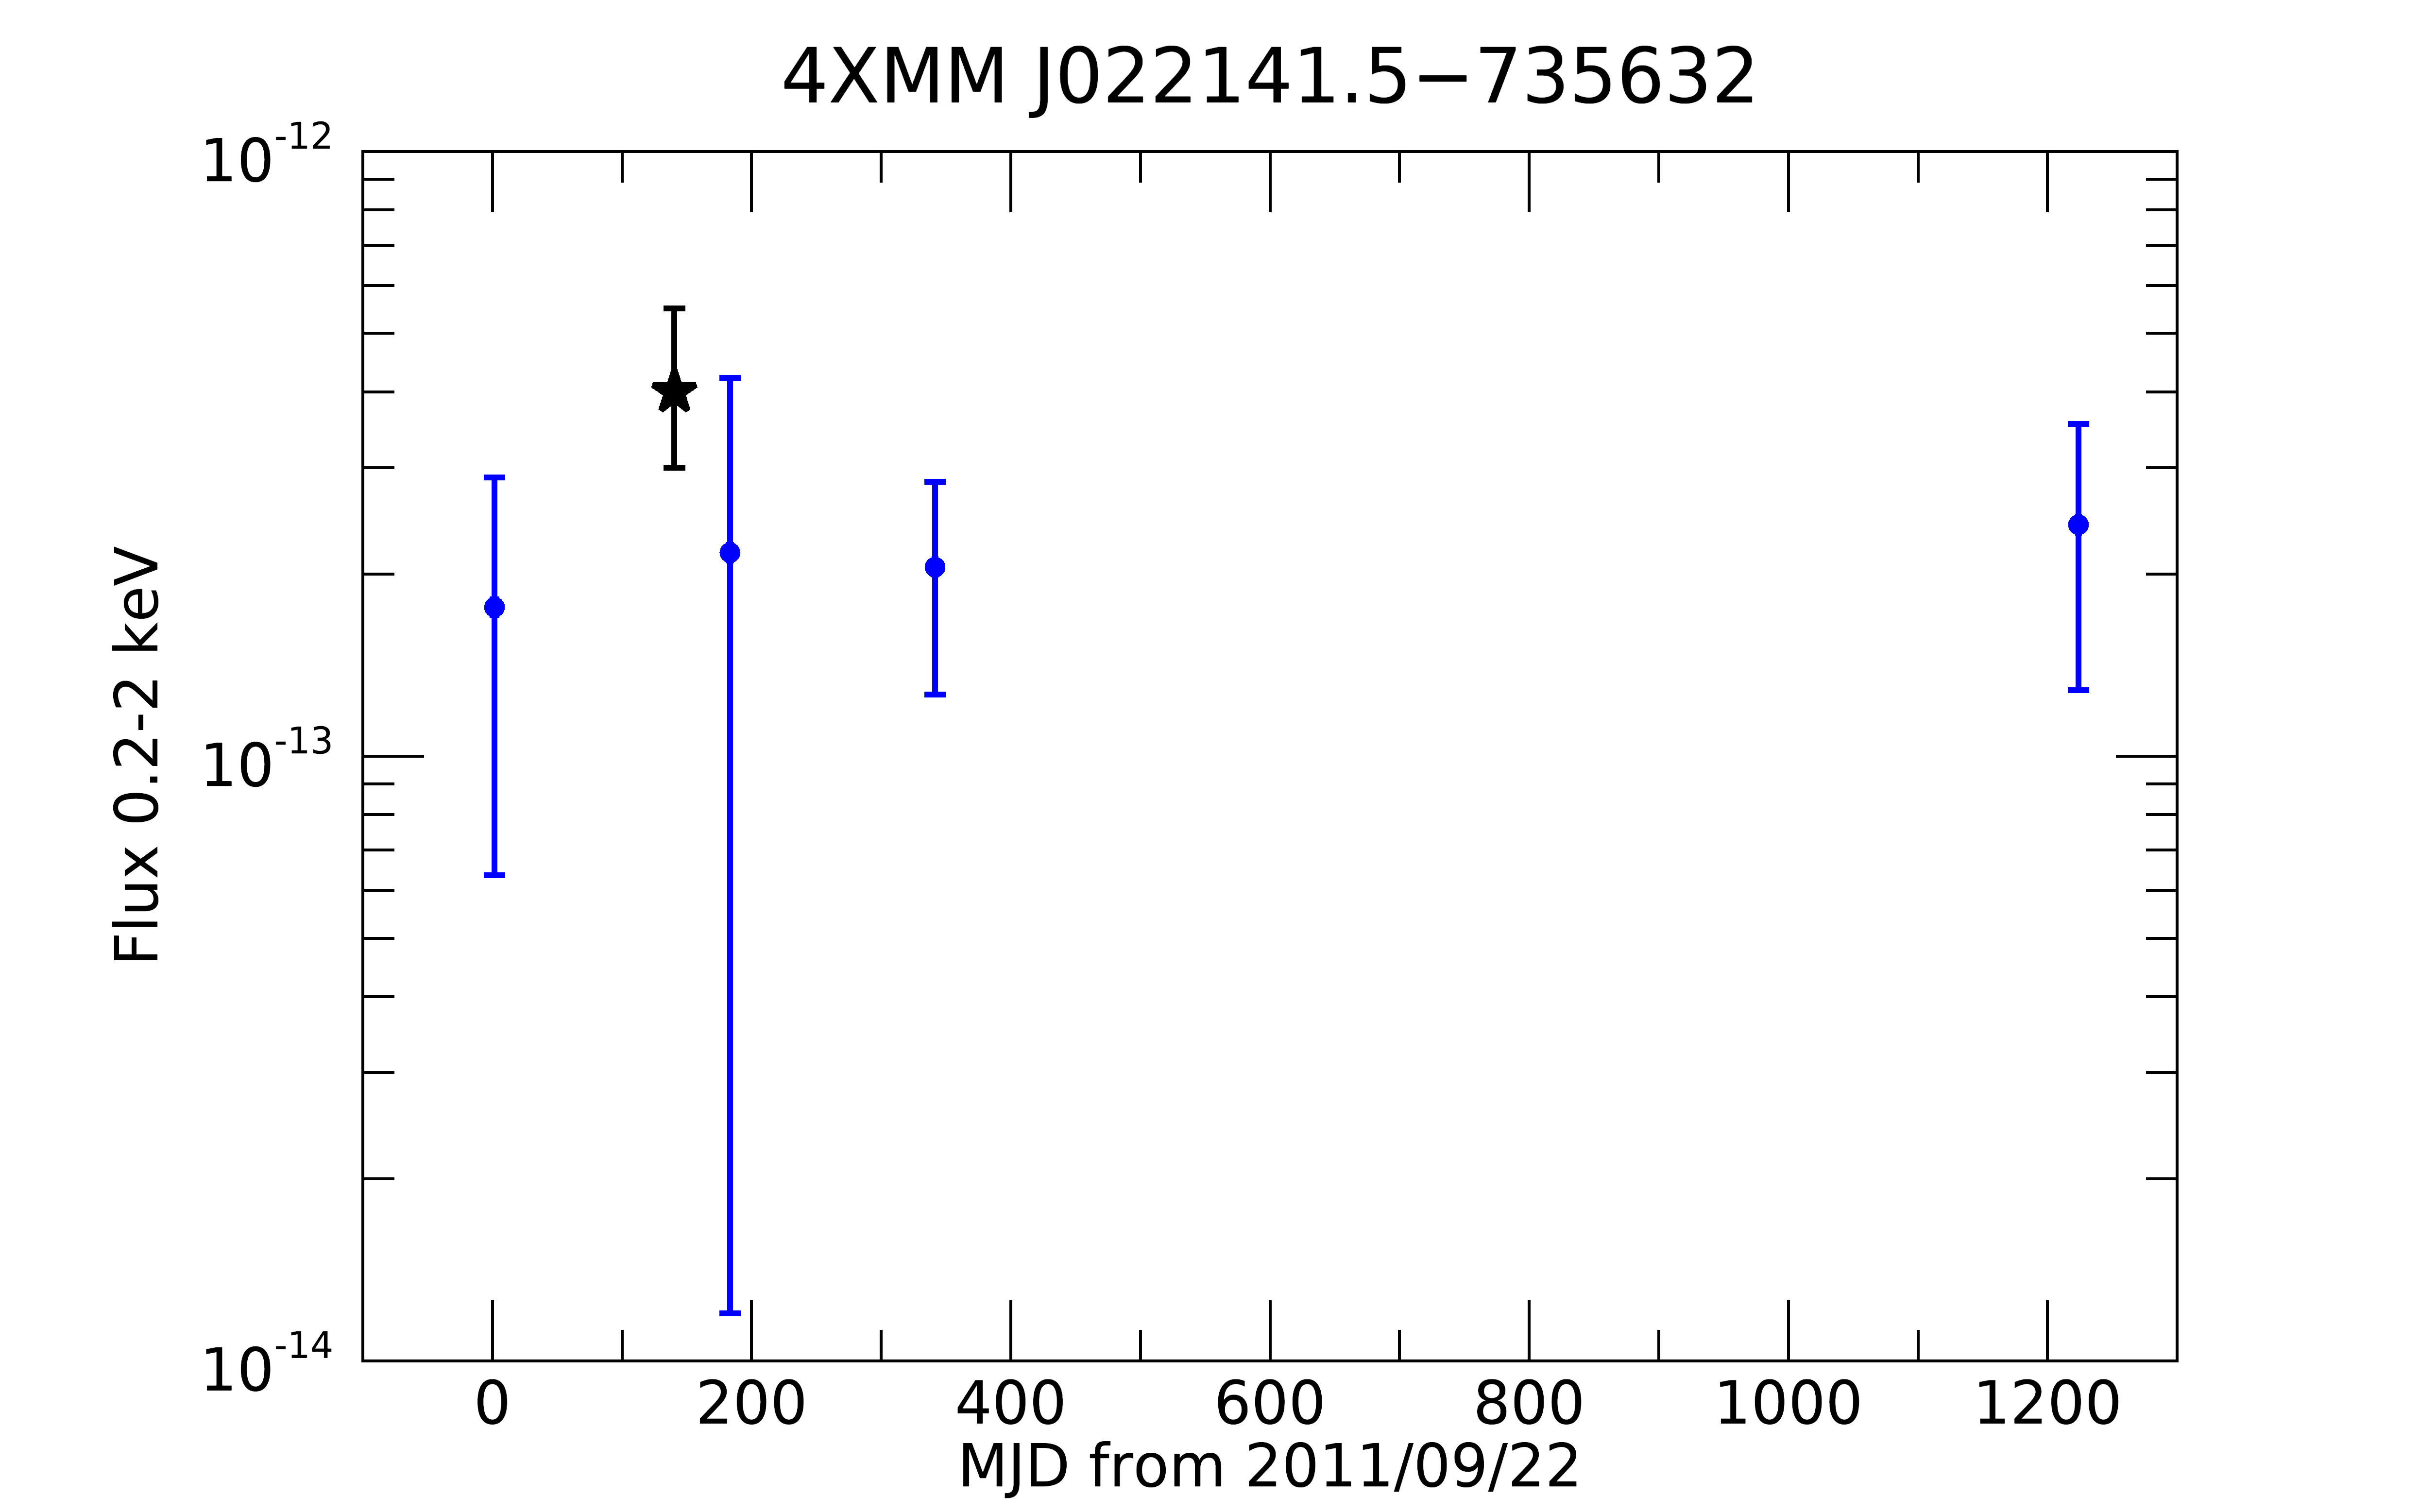
The source 4XMM J022141.5735632 was detected only once by XMM-Newton on 2012 February 10 (obs.ID 0674110401), in an observation of the Magellanic Bridge, an Hi gaseous structure connecting the Small and the Large Magellanic Clouds (Hindman et al., 1963).
The fit with an absorbed blackbody is in reasonably good agreement with the data ( for 16 dof, nhp = 0.11), yielding temperature keV, unabsorbed 0.2–2 keV flux of erg s-1 cm-2, and cm-2. This value is significantly smaller than the total Galactic column density in this direction, cm-2 (HI4PI Collaboration et al., 2016), suggesting that this source is a nearby Galactic object. For an assumed distance of 1 kpc, the blackbody emitting radius is km and the luminosity is erg s-1. Other fits with single component models gave worse values.
A better fit can be obtained adding to the blackbody a second spectral component, such as a power law or a hotter blackbody, but, owing to the small number of counts above 1 keV, we had to fix the photon index or the second temperature to reasonable values in order to constrain the other parameters. In the case of the addition of a power law with photon index , the blackbody has keV, km, and erg s-1 cm-2 ( for 15 dof). In the case of a hot blackbody with keV, we obtained keV, km, and erg s-1 cm-2 ( for 15 dof). In both cases, the fitted absorption column is smaller than and the spectral parameters are plausible for a INS at 1 kpc.
On the other hand, if we assume that the source is in the Magellanic Bridge, its luminosity would be of the order of ( kpc)2 erg s-1. Although this luminosity is consistent with that of an X-ray binary, the absence of an optical counterpart and lack of variability (see below) disfavor this possibility.
4XMM J022141.5735632 was in the field of view of Swift-XRT seven times, between 2011 and 2015. The individual measurements are consistent with a constant count rate of cts s-1, which, assuming the best fit parameters of the single-blackbody fit, corresponds to a flux of . The light curve shown in Figure 4 does not give evidence for significant variability on long timescales.
4.3 4XMM J031722.7663704
4XMM J031722.7663704 is the softest source of our sample, with almost no signal above 1 keV. It was observed many times by XMM-Newton, Chandra and Swift-XRT because it is located close to the galaxy NGC 1313, which hosts two ULXs (Bachetti et al., 2013) and the ultraluminous supernova SN 1978K (Ryder et al., 1993). The angular distance of 9’ from the center of the galaxy is about five times larger than the isophotal radius, implying that 4XMM J031722.7663704 is likely not associated to NGC 1313, as also noticed by Liu (2011).
Only ten444obs.ID 0405090101, 0693850501, 0693851201, 0764770101, 0782310101, 0803990101, 0803990201, 0803990301, 0803990501, 0803990601. of the about thirty available XMM-Newton observations that span more than 17 years, have enough counts to perform a spectral analysis. We fitted these spectra simultaneously with an absorbed blackbody, linking the column density to a common value and obtaining for 58 dof (nhp = 0.86). The best-fitting is cm-2, while temperatures and emitting radii were consistent within the errors, with average values of keV and km. The fluxes, represented in the lowermost panel of Figure 4 by black stars, are consistent with a constant value of 1.2 erg s-1 cm-2 ( for a fit with a constant).
Imposing a common gave a similar for 67 dof ( cm-2 and ), while imposing the same parameters in all the spectra gave a worse fit ( for 76 dof). The spectral parameters are summarized in Table 4.
The remaining XMM-Newton data, for which spectral analysis was not feasible, gave detections or upper limits consistent with a constant flux (see Figure 4). We also checked that the observations obtained with Chandra ( net counts on 2003/10/02, obs.ID 3551) and Swift-XRT (hundreds of observations from 2006/02/03 to 2021/04/25) do not give evidence for variability.
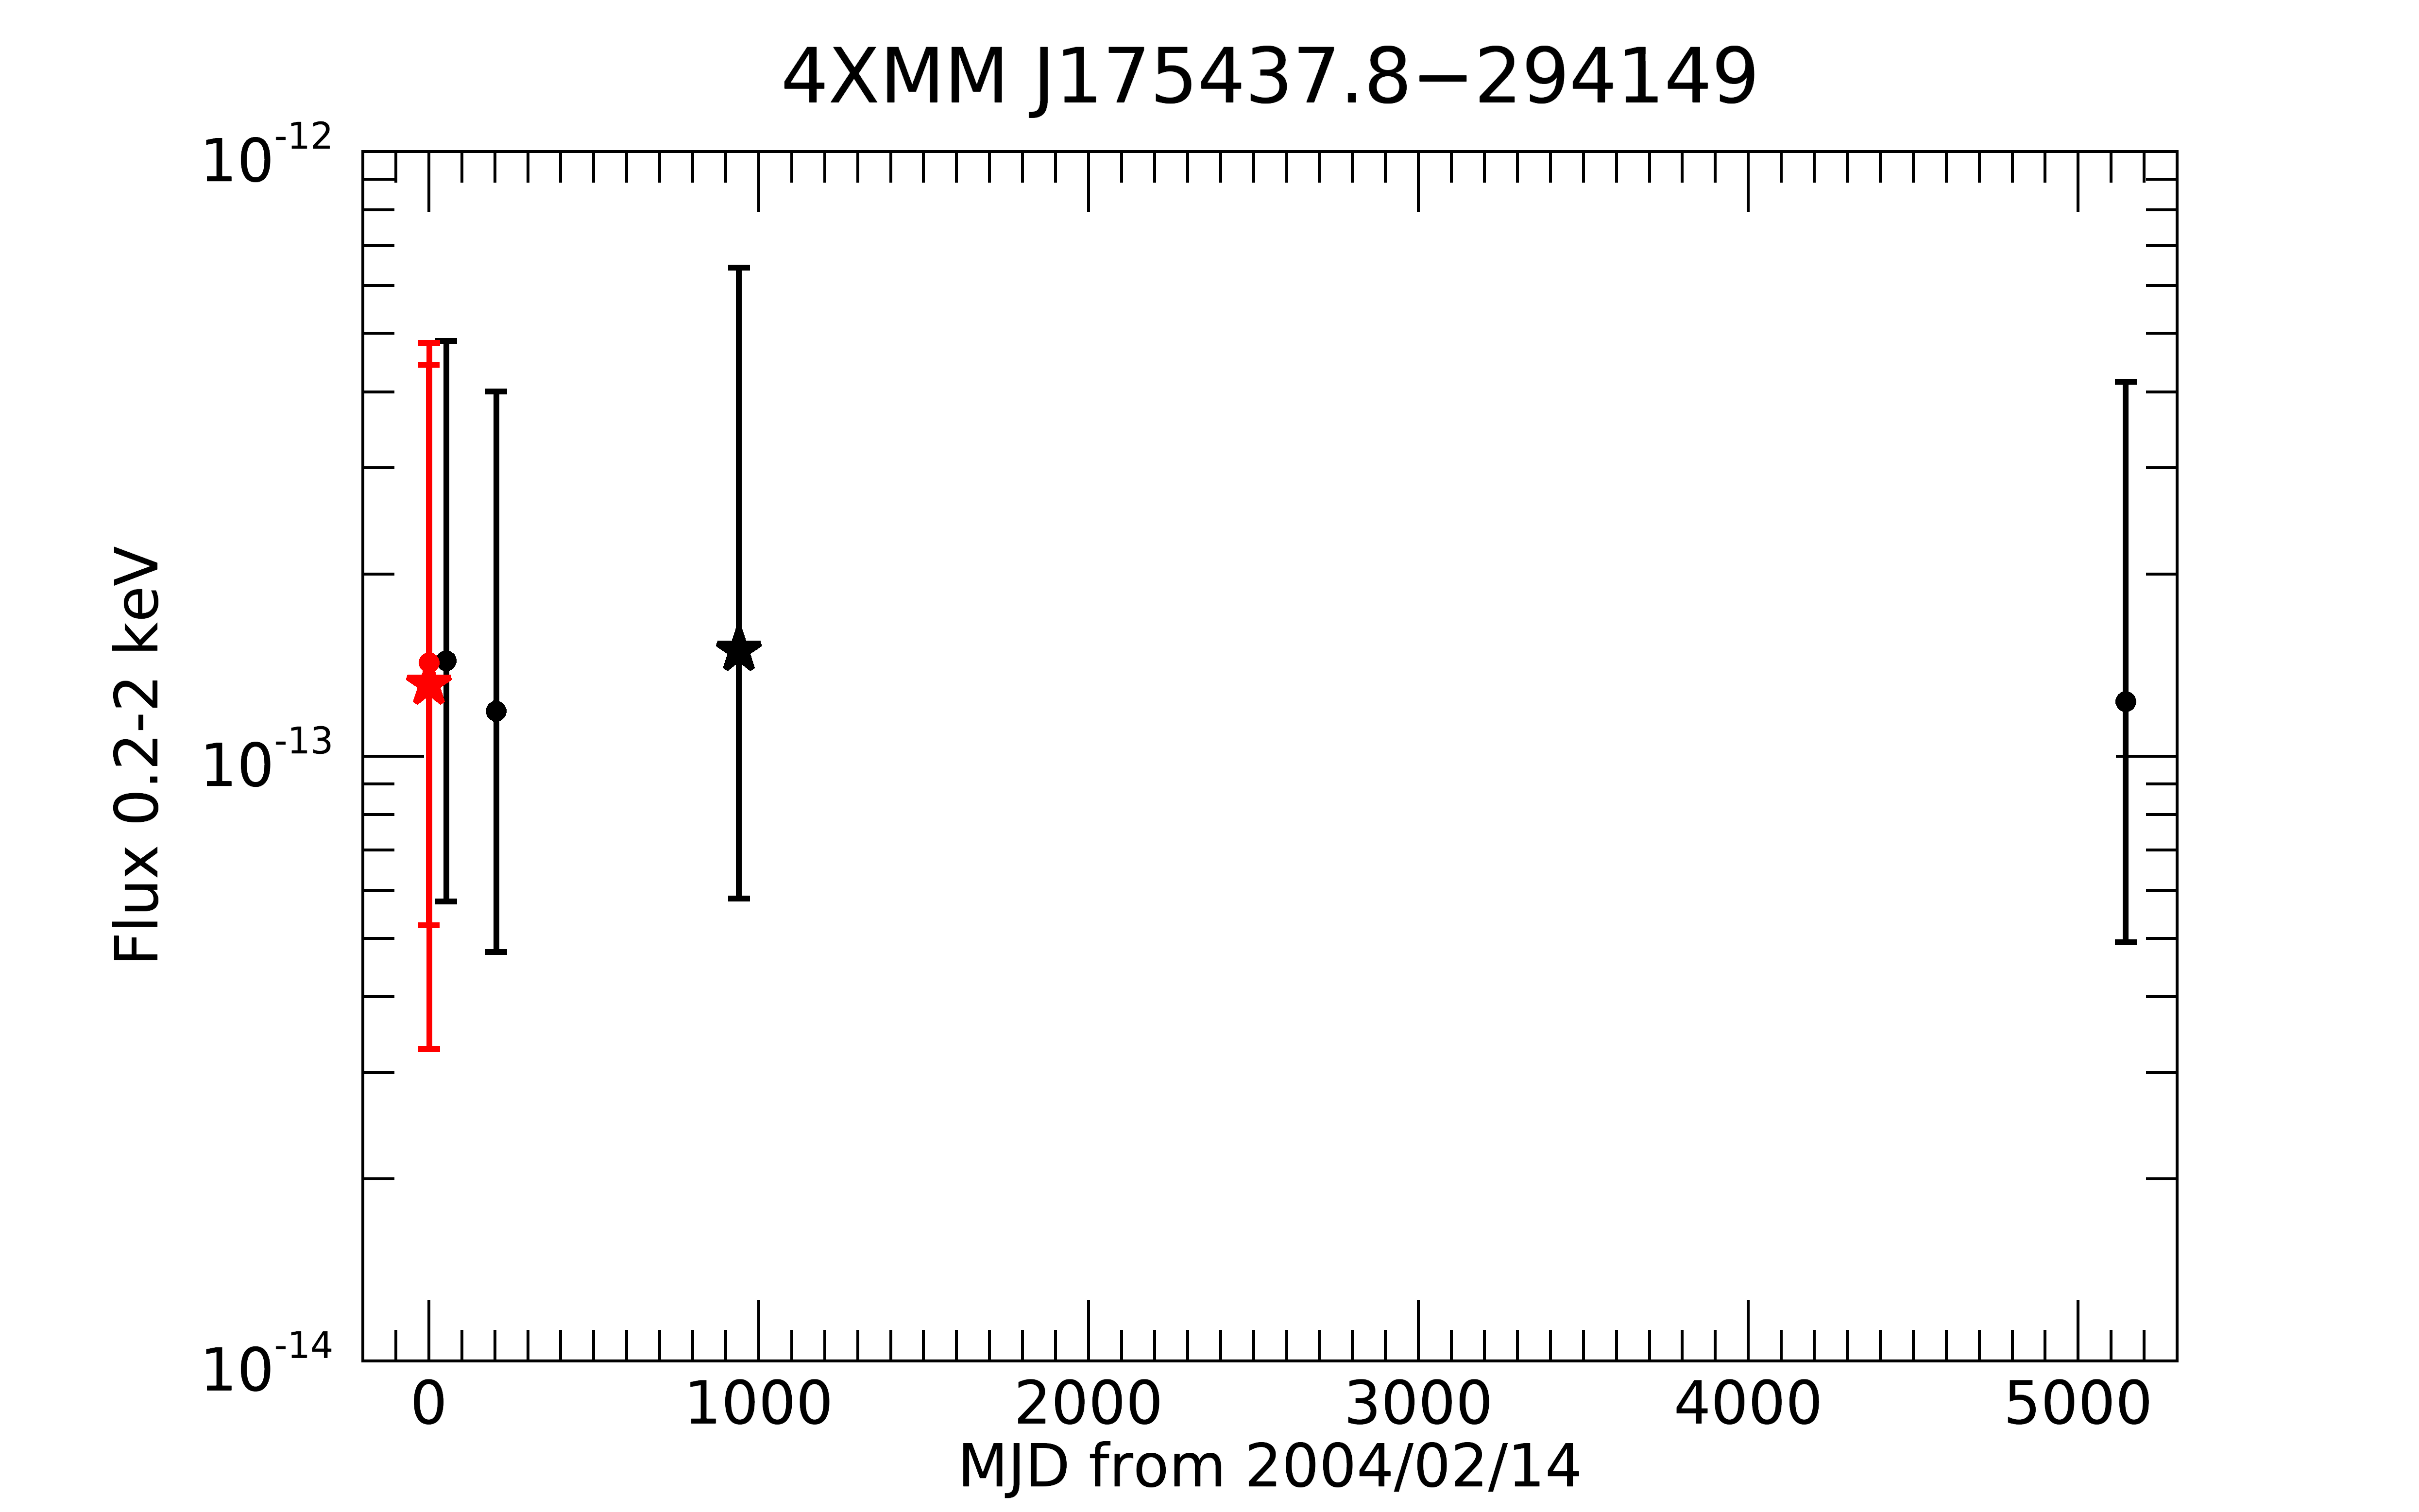
4.4 4XMM J175437.8294149
The source 4XMM J175437.8294149 was detected four times by XMM-Newton and twice by Chandra, in the course of a campaign started in 2004 to characterize the X-ray sources of the Galactic Bulge in a region of low extinction, called ‘Stanek’s window’ (van den Berg et al., 2006). Only one Chandra (obs.ID 4547) and one XMM-Newton (obs.ID 0402280101) observations had enough counts for a spectral analysis.
We fitted the two spectra with an absorbed blackbody, imposing a common absorption value but letting the other parameters free to vary. We found a good fit ( for 8 dof) with cm-2, temperatures keV, keV and fluxes erg s-1 cm-2, erg s-1 cm-2 (unabsorbed, 0.2–2 keV).
Given that temperatures and fluxes were consistent with the same values, we fitted the two spectra linking all the parameters. This gave cm-2, keV, and erg s-1 cm-2 ( for 10 dof). We used these best fit parameters, also reported in Table 4, to convert the count rates of the other Chandra (obs.ID 5303) and XMM-Newton detections (obs.ID 0206590101, 0206590201, and 0801683001) into unabsorbed fluxes. The source flux remained constant from 2004 to 2018 (see Figure 4).
The best fit is similar to the total column density in the direction of the source, cm-2 (HI4PI Collaboration et al., 2016), but its relatively large uncertainty does not allow us to estimate the source distance. For a reference distance of one kpc, the blackbody normalization corresponds to an emitting radius of 4.6 km and bolometric luminosity of 1032 erg s-1. This is consistent with a cooling INS at distances up to a few kpc.
4.5 4XMM J180528.2273158
The source 4XMM J180528.2273158 was detected in an observation (obs.ID 0305970101) of the Galactic Center region (, ). There are no X-ray observations from Swift-XRT or Chandra of this sky region.
The source spectrum can be well fitted ( for 17 dof, nhp = 0.55) by an absorbed blackbody with keV and cm-2 (the total absorption in this direction is cm-2, HI4PI Collaboration et al. 2016). The 0.2–2 keV flux, corrected for absorption, is erg s-1 cm-2. If we assume a distance in the range 1–10 kpc, the emitting radius would be km, smaller than the size of a neutron star, but consistent with emission from a hot spot on the star surface.
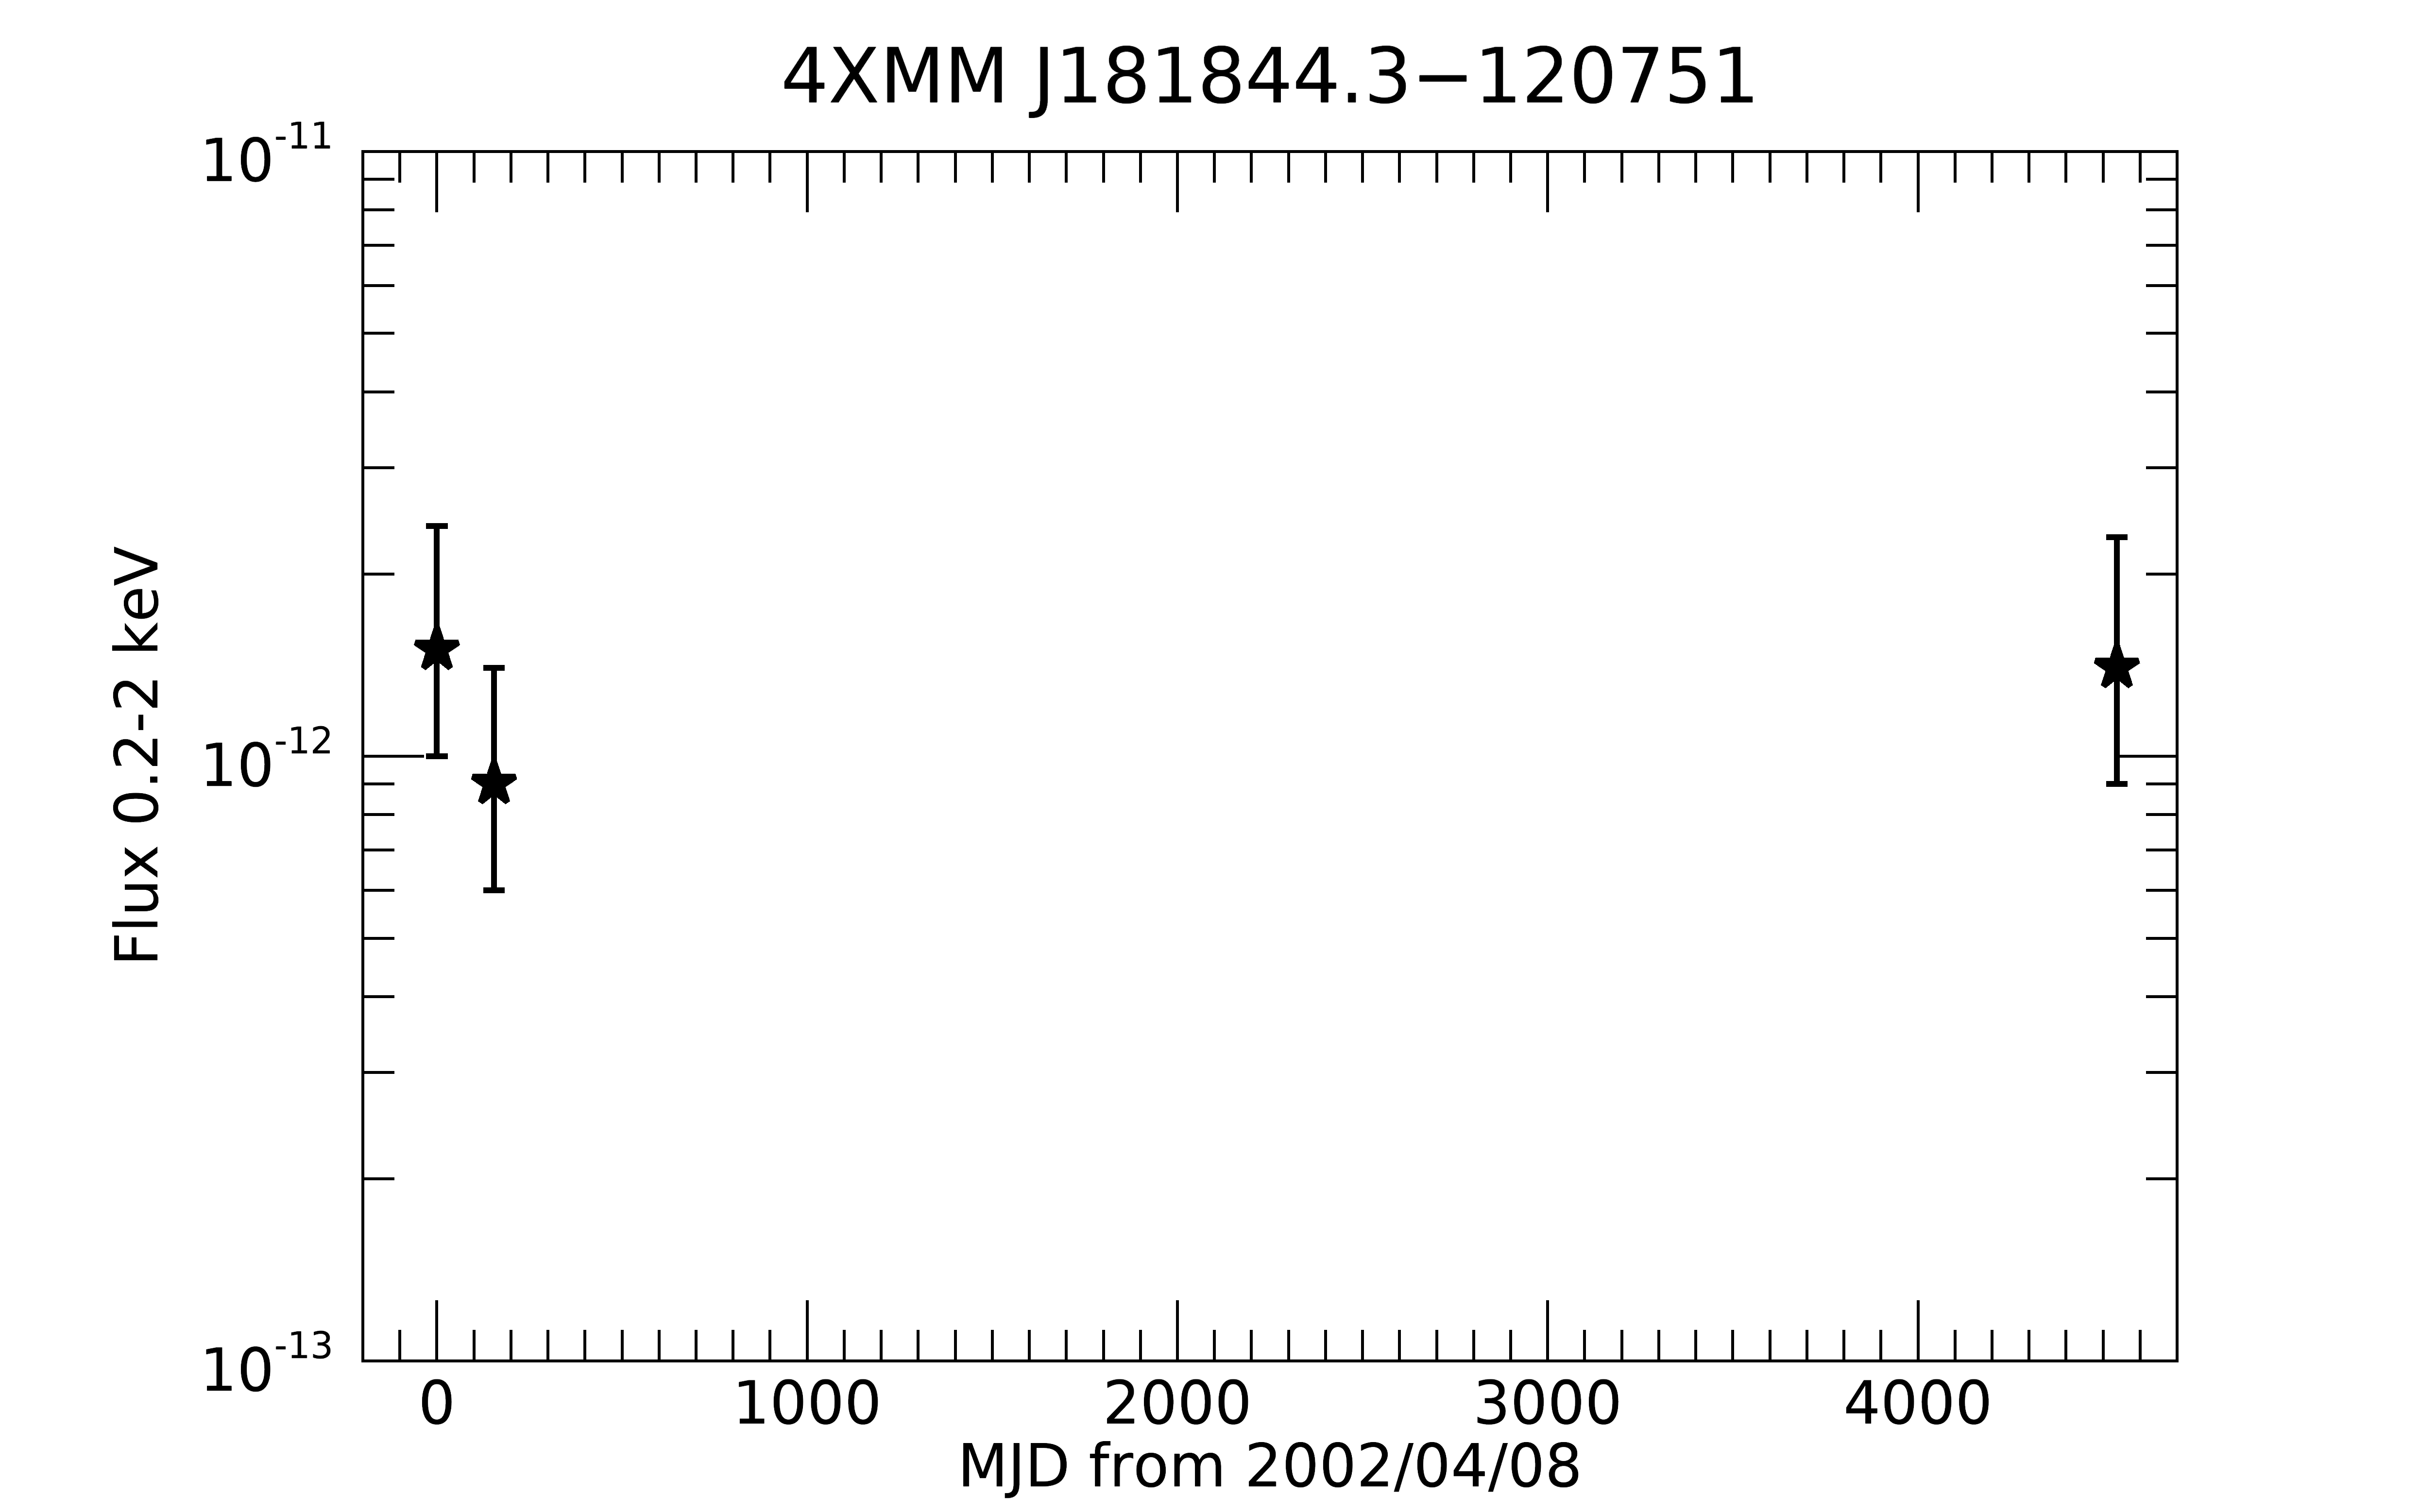
4.6 4XMM J181844.3120751
The source 4XMM J181844.3120751 was detected by XMM-Newton in 2002 and in 2014 in three observations (obs.ID 0008820301, 0008820601, and 0740990101) aimed at characterizing two collinding-wind binaries in the Open Cluster NGC 6604, which is at a distance of 1.7 kpc (De Becker et al., 2004; De Becker et al., 2005; De Becker, 2015). This region was never observed by Chandra or Swift-XRT.
4XMM J181844.3120751, located at 12′ from the center of the cluster, was also noticed by De Becker et al. (2005) and Lin et al. (2012), who suggested that it is a compact object, based on its soft spectrum and the absence of an optical counterpart.
None of the three spectra gave an acceptable fit with the blackbody model ( for 19 dof, nhp ). Also fits with other simple single-component models (power law, bremsstrahlung, thermal disk), as well as with the combination of a blackbody plus power-law, were rejected ().
A good fit ( for 19 dof, nhp = 0.22) was instead obtained with a model of collisionally-ionized diffuse gas with abundances fixed at solar values (apec in XSPEC). The best-fit is cm-2, similar to cm-2 (HI4PI Collaboration et al., 2016) and to the values obtained for the two binaries in NGC 6604 (De Becker et al., 2005; De Becker, 2015).
The three temperatures are consistent within errors ( keV, keV, and keV), as well as the unabsorbed fluxes (see Figure 4). Imposing the same parameters in all the spectra gave a still acceptable fit ( for 23 dof), with keV and erg s-1 cm-2.
4.7 4XMM J220221.4015330
4XMM J220221.4+015330, the brightest source of our sample, was detected three times in Swift-XRT (obs.ID 00036084001), Chandra (obs.ID 10142) and XMM-Newton (obs.ID 0655346833) short observations. The three corresponding spectra have a good signal-to-noise ratio and clearly indicate spectral variability. They could not be fitted by either a blackbody or a power law (). Acceptable fits were obtained adding a second component, but only when the cooler component has a normalization free to vary among the epochs.
The power-law plus blackbody best-fit parameters are cm-2, , photons cm-2 s-1 keV-1 at 1 keV, and keV ( for 40 dof, nhp = 0.15). The blackbody flux shows significant variations across the three observations: erg s-1 cm-2, erg s-1 cm-2, and erg s-1 cm-2.
The two-blackbody model gives a better (nhp = 0.31), a small absorption column ( cm-2), keV, and keV. The hotter blackbody has a radius of km for a distance of 1 kpc. The longterm light curve of the colder blackbody is shown in Figure 4. The fluxes of the cooler blackbody vary similarly to the previous case: erg s-1 cm-2, erg s-1 cm-2, and erg s-1 cm-2).
We notice that a good fit ( for 42 dof, nhp = 0.21) can also be achieved with an absorbed bremsstrahlung, yielding cm-2 and keV. The fluxes are higher than the previous ones, but a significant variability is still present: erg s-1 cm-2, erg s-1 cm-2, and erg s-1 cm-2.
The source has a possible optical counterpart with magnitudes and detected by VIPERS-MLS (Moutard et al., 2016). From its high X-ray flux 10-12 erg s-1 cm-2, we derived and , that are typical of a compact object. However, the observed variability excludes 4XMM J220221.4015330 from the list of the INS candidates.
5 Discussion and conclusions
We searched for new INS candidates in the 4XMM-DR10 source catalog, using selection criteria based on their spectral shape, as inferred from X-ray HRs in the softest energy bands (0.2–0.5, 0.5–1, 1–2 keV), and on cross correlations with catalogs of possible optical/IR counterparts. In particular, we identified a region in the HR1–HR2 plane, assuming a blackbody spectrum absorbed by the interstellar medium folded through the response of the EPIC-pn detector, and used it to select the softest sources.
From more than half a million X-ray sources contained in the 4XMM-DR10 catalog, we finally obtained a sample of 47 point-like sources. This sample includes about twenty SNRs or X-ray binaries located in nearby galaxies, a few AGNs and, as expected, several already-known INSs. The remaining six sources have an unknown nature and are located far from nearby galaxies, therefore we considered them as potential INS candidates. A more detailed spectral and timing analysis, using also Chandra and Swift-XRT data, showed that two of them are unlikely to be INSs. 4XMM J181844.3120751 has a spectrum inconsistent with blackbody emission, and is instead well fit with a thermal plasma model with keV. This source is close to the Open Cluster NGC 6604, but the lack of a bright optical counterpart disfavors a stellar origin. 4XMM J220221.4015330 showed clear spectral and flux variability. Its faint optical counterpart implies , consistent with a peculiarly soft AGN or an X-ray binary.
The remaining four sources (4XMM J022141.5735632, 4XMM J031722.7663704, 4XMM J175437.8294149, and 4XMM J180528.2273158) have soft thermal spectra and show no evidence for long-term variability. Their temperatures and emission radii, as inferred from blackbody fits, are consistent with emission from hot spots or from (a large fraction of) the whole surface of INSs. The spectrum of the source with the highest signal to noise ratio, 4XMM J022141.5735632, was better fitted with two components models: Either two blackbodies ( keV and keV), or a power law plus blackbody ( and keV), as typically observed in INSs.
In Table 4 we also report the expected magnitude of these candidates, obtained extrapolating their best-fitting X-ray blackbody. These magnitudes are rather faint, but we note that these can be considered as lower limits, because the optical counterparts identified for INSs are a factor 5–10 brighter than the extrapolation of the Planckian spectra (Mignani, 2009). Whether this is due to a deviation from blackbody emission and/or a non-uniform temperature distribution, or a contamination from a nearby diffuse source, is still an open issue (Wang et al., 2017, 2018). Deep multiwavelength observations are needed to identify the counterparts of these four sources, and possibly confirm the suggested neutron star nature, e.g., through the measurement of proper motions.
The small number of candidate INSs we found in the 4XMM-DR10 catalog is not surprising, considering the rarity of thermally-emitting neutron stars sufficiently close to be detected in soft X-rays (Posselt et al., 2008). The Log–Log derived by these authors with a detailed evolutionary synthesis model, and taking into account the nonuniform distribution of interstellar absorption, predicts of the order of 100 cooling INSs in the whole sky above 0.001 ROSAT counts s-1 (corresponding to a 0.2–2 keV flux of a few 10-15 erg s-1 cm-2). The XMM-Newton observations used in the 4XMM-DR10 catalog have a non uniform sensitivity, down to erg s-1 cm-2 for the faintest detected sources. However, our requirement of having HRs with errors 0.1 limited our search to sources with fluxes above 10-15 erg s-1 cm-2. Considering that the sky coverage of the catalog is 3% only, the small number of candidates found in our work is consistent with the expectations. It is possible that other INSs are among the weakest 4XMM-DR10 sources for which an accurate spectral characterization is currently impossible.
Acknowledgements
The scientific results reported in this article are based on data obtained with XMM-Newton, Swift, and Chandra. The data analysis has benefited from the software provided by the NASA’s High Energy Astrophysics Science Archive Research Center (HEASARC). We extensively made use of the Simbad, VizieR and X-Match databases, operated at CDS, Strasbourg, France. We acknowledge the whole XMM-Newton SSC Consortium for the 4XMM-DR10 catalog production. We thank F. Pintore for help with the Chandra data and the referee F. Walter for useful comments. We acknowledge financial support from the Italian Ministry for University and Research through grant 2017LJ39LM “UNIAM” and the INAF “Main-streams” funding grant (DP n.43/18).
Data availability
All the data used in this article are available in public archives.
References
- Abdollahi et al. (2020) Abdollahi S., et al., 2020, ApJS, 247, 33
- Alam et al. (2015) Alam S., et al., 2015, ApJS, 219, 12
- Bachetti et al. (2013) Bachetti M., et al., 2013, ApJ, 778, 163
- Barnard et al. (2008) Barnard R., Greening L. S., Kolb U., 2008, MNRAS, 388, 849
- Barnard et al. (2014) Barnard R., Garcia M. R., Primini F., Murray S. S., 2014, ApJ, 780, 169
- Bignami et al. (2003) Bignami G. F., Caraveo P. A., De Luca A., Mereghetti S., 2003, Nature, 423, 725
- Cagnoni et al. (2003) Cagnoni I., Turolla R., Treves A., Huang J. S., Kim D. W., Elvis M., Celotti A., 2003, ApJ, 582, 654
- Carpano et al. (2006) Carpano S., Wilms J., Schirmer M., Kendziorra E., 2006, A&A, 458, 747
- Chambers et al. (2016) Chambers K. C., et al., 2016, arXiv e-prints, p. arXiv:1612.05560
- Cohen et al. (2003) Cohen M., Wheaton W. A., Megeath S. T., 2003, AJ, 126, 1090
- Cool et al. (2013) Cool A. M., Haggard D., Arias T., Brochmann M., Dorfman J., Gafford A., White V., Anderson J., 2013, ApJ, 763, 126
- Cutri et al. (2003) Cutri R. M., et al., 2003, VizieR Online Data Catalog, p. II/246
- De Becker (2015) De Becker M., 2015, MNRAS, 451, 1070
- De Becker et al. (2004) De Becker M., et al., 2004, A&A, 420, 1061
- De Becker et al. (2005) De Becker M., Rauw G., Blomme R., Pittard J. M., Stevens I. R., Runacres M. C., 2005, A&A, 437, 1029
- Ducci et al. (2014) Ducci L., Kavanagh P. J., Sasaki M., Koribalski B. S., 2014, A&A, 566, A115
- Earnshaw et al. (2019) Earnshaw H. P., Roberts T. P., Middleton M. J., Walton D. J., Mateos S., 2019, MNRAS, 483, 5554
- Fabbiano (2006) Fabbiano G., 2006, ARA&A, 44, 323
- Gaia Collaboration et al. (2018) Gaia Collaboration et al., 2018, A&A, 616, A1
- Guillot et al. (2015) Guillot S., Perna R., Rea N., Viganò D., Pons J. A., 2015, MNRAS, 452, 3357
- HI4PI Collaboration et al. (2016) HI4PI Collaboration et al., 2016, A&A, 594, A116
- Haberl (2007) Haberl F., 2007, Ap&SS, 308, 181
- Hindman et al. (1963) Hindman J. V., Kerr F. J., McGee R. X., 1963, Australian Journal of Physics, 16, 570
- Khan (2017) Khan R., 2017, ApJS, 228, 5
- Lin et al. (2012) Lin D., Webb N. A., Barret D., 2012, ApJ, 756, 27
- Lin et al. (2014) Lin D., Webb N. A., Barret D., 2014, ApJ, 780, 39
- Lin et al. (2018) Lin D., et al., 2018, Nature Astronomy, 2, 656
- Liu (2011) Liu J., 2011, ApJS, 192, 10
- Maccacaro et al. (1988) Maccacaro T., Gioia I. M., Wolter A., Zamorani G., Stocke J. T., 1988, ApJ, 326, 680
- Mainetti et al. (2016) Mainetti D., Campana S., Colpi M., 2016, A&A, 592, A41
- Manchester et al. (2005) Manchester R. N., Hobbs G. B., Teoh A., Hobbs M., 2005, VizieR Online Data Catalog, 7245
- McGowan et al. (2006) McGowan K. E., Zane S., Cropper M., Vestrand W. T., Ho C., 2006, ApJ, 639, 377
- Mignani (2009) Mignani R., 2009, The Messenger, 138, 19
- Mineo et al. (2012) Mineo S., Gilfanov M., Sunyaev R., 2012, MNRAS, 419, 2095
- Monet (1998) Monet D. G., 1998, in American Astronomical Society Meeting Abstracts. p. 120.03
- Monet et al. (2003) Monet D. G., et al., 2003, AJ, 125, 984
- Moutard et al. (2016) Moutard T., et al., 2016, A&A, 590, A102
- Ng et al. (2007) Ng C. Y., Romani R. W., Brisken W. F., Chatterjee S., Kramer M., 2007, ApJ, 654, 487
- Oliveira et al. (2017) Oliveira A. S., Rodrigues C. V., Cieslinski D., Jablonski F. J., Silva K. M. G., Almeida L. A., Rodríguez-Ardila A., Palhares M. S., 2017, AJ, 153, 144
- Pannuti et al. (2000) Pannuti T. G., Duric N., Lacey C. K., Goss W. M., Hoopes C. G., Walterbos R. A. M., Magnor M. A., 2000, ApJ, 544, 780
- Pietsch et al. (2004) Pietsch W., Misanovic Z., Haberl F., Hatzidimitriou D., Ehle M., Trinchieri G., 2004, A&A, 426, 11
- Pineau et al. (2011) Pineau F. X., Motch C., Carrera F., Della Ceca R., Derrière S., Michel L., Schwope A., Watson M. G., 2011, A&A, 527, A126
- Pires et al. (2009a) Pires A. M., Motch C., Turolla R., Treves A., Popov S. B., 2009a, A&A, 498, 233
- Pires et al. (2009b) Pires A. M., Motch C., Janot-Pacheco E., 2009b, A&A, 504, 185
- Pires et al. (2015) Pires A. M., Motch C., Turolla R., Popov S. B., Schwope A. D., Treves A., 2015, A&A, 583, A117
- Pires et al. (2017) Pires A. M., Schwope A. D., Motch C., 2017, Astronomische Nachrichten, 338, 213
- Posselt et al. (2008) Posselt B., Popov S. B., Haberl F., Trümper J., Turolla R., Neuhäuser R., 2008, A&A, 482, 617
- Potekhin et al. (2020) Potekhin A. Y., Zyuzin D. A., Yakovlev D. G., Beznogov M. V., Shibanov Y. A., 2020, MNRAS, 496, 5052
- Predehl et al. (2021) Predehl P., et al., 2021, A&A, 647, A1
- Rigoselli et al. (2019a) Rigoselli M., Mereghetti S., Suleimanov V., Potekhin A. Y., Turolla R., Taverna R., Pintore F., 2019a, A&A, 627, A69
- Rigoselli et al. (2019b) Rigoselli M., Mereghetti S., Turolla R., Taverna R., Suleimanov V., Potekhin A. Y., 2019b, ApJ, 872, 15
- Rigoselli et al. (2021) Rigoselli M., Mereghetti S., Taverna R., Turolla R., De Grandis D., 2021, A&A, 646, A117
- Ryder et al. (1993) Ryder S., Staveley-Smith L., Dopita M., Petre R., Colbert E., Malin D., Schlegel E., 1993, ApJ, 416, 167
- Stiele et al. (2011) Stiele H., Pietsch W., Haberl F., Hatzidimitriou D., Barnard R., Williams B. F., Kong A. K. H., Kolb U., 2011, A&A, 534, A55
- Swiggum et al. (2017) Swiggum J. K., et al., 2017, ApJ, 847, 25
- Tiengo & Mereghetti (2007) Tiengo A., Mereghetti S., 2007, ApJ, 657, L101
- Turolla (2009) Turolla R., 2009, Isolated Neutron Stars: The Challenge of Simplicity. p. 141, doi:10.1007/978-3-540-76965-1_7
- Voges et al. (1999) Voges W., et al., 1999, A&A, 349, 389
- Walter et al. (1996) Walter F. M., Wolk S. J., Neuhäuser R., 1996, Nature, 379, 233
- Wang et al. (2017) Wang W., Lu J., Tong H., Ge M., Li Z., Men Y., Xu R., 2017, ApJ, 837, 81
- Wang et al. (2018) Wang W.-Y., Feng Y., Lai X.-Y., Li Y.-Y., Lu J.-G., Chen X., Xu R.-X., 2018, RAA, 18, 082
- Webb et al. (2020) Webb N. A., et al., 2020, A&A, 641, A136
- Werner et al. (2004) Werner M. W., et al., 2004, ApJS, 154, 1
- Wilms et al. (2000) Wilms J., Allen A., McCray R., 2000, ApJ, 542, 914
- de Vaucouleurs et al. (1991) de Vaucouleurs G., de Vaucouleurs A., Corwin Herold G. J., Buta R. J., Paturel G., Fouque P., 1991, Third Reference Catalogue of Bright Galaxies
- van den Berg et al. (2006) van den Berg M., et al., 2006, ApJ, 647, L135