The impact of cosmic rays on dynamical balance and disk-halo interaction in disk galaxies
Abstract
Cosmic rays (CRs) are an important component in the interstellar medium (ISM), but their effect on the dynamics of the disk-halo interface (< 10 kpc from the disk) is still unclear. We study the influence of CRs on the gas above the disk with high-resolution FIRE-2 cosmological simulations of late-type galaxies at redshift . We compare runs with and without CR feedback (with constant anisotropic diffusion and streaming). Our simulations capture the relevant disk halo interactions, including outflows, inflows, and galactic fountains. Extra-planar gas in all of the runs satisfies dynamical balance, where total pressure balances the weight of the overlying gas. While the kinetic pressure from non-uniform motion ( scale) dominates in the midplane, thermal and bulk pressures (or CR pressure if included) take over at large heights. We find that with CR feedback, (1) the warm () gas is slowly accelerated by CRs; (2) the hot () gas scale height is suppressed; (3) the warm-hot () medium becomes the most volume-filling phase in the disk-halo interface. We develop a novel conceptual model of the near-disk gas dynamics in low-redshift galaxies: with CRs, the disk-halo interface is filled with CR-driven warm winds and hot super-bubbles that are propagating into the CGM with a small fraction falling back to the disk. Without CRs, most outflows from hot superbubbles are trapped by the existing hot halo and gravity, so typically they form galactic fountains.
keywords:
ISM: cosmic rays — galaxies: spiral — galaxies: kinematics and dynamics — ISM: kinematics and dynamics1 Introduction
An important question in astrophysics is what supports the gas a few kpc above galactic disks, i.e. at the disk-halo interface. Early models for pressure support above the disk included only warm gas, which lead to observational and theoretical challenges. First, a thin gas disk is unstable due to convective and Parker instabilities (Parker, 1953). Second, this thermal pressure is inadequate to support the significant weight far above the mid-plane (Boulares & Cox, 1990).
One possible solution is to have a dynamical model. Shapiro & Field (1976) proposed that hot gas is injected from superbubbles (Castor et al., 1975) that form a galactic corona, hot gas, at high-galactic-latitude suggested by Spitzer 1956. The hot gas then cools down and falls back to the disk, forming galactic fountain. This infalling gas could constitute some of the observed high velocity clouds (Bregman, 1980). To explain the amount of hot gas observed in the interstellar medium (ISM), Norman & Ikeuchi (1989) proposed that the SN-driven superbubbles are elongated inside galactic disks and hot gas is released above, namely the galactic chimney model.
Another type of models assumes hydrostatic equilibrium and takes into account non-thermal pressure, e.g. magnetic fields and cosmic rays (CRs) (Chevalier & Fransson, 1984; Boulares & Cox, 1990; Ferrière, 2001; Boettcher et al., 2016). These models are justified by the significant non thermal pressure observed in the solar neighbourhood (Bloemen, 1987; Bowyer et al., 1995), and the large scale heights of magnetic fields and CRs (Bloemen et al., 1993; Beck, 2015; Grenier et al., 2015). CR pressure above the disk can also help explain the observed extent of the warm ionized gas layer, e.g. Girichidis et al. (2016); Vandenbroucke et al. (2018). Furthermore, Benjamin (2002) suggested that non-thermal pressure, e.g. CR pressure or magnetic tension, can naturally produce “lagging halos”: extra-planar gas is observed to be lagging behind the galactic rotation (Swaters et al., 1997; Fraternali et al., 2002)111But this lagging could be explained with gas inflows (Fraternali & Binney, 2008)..
Finally, the CR-driven wind model suggests that CRs are not only able to balance the gas weight, but also drive galactic winds (Ipavich, 1975). Breitschwerdt et al. (1991, 1993) developed more sophisticated 1D analytic models accounting for more realistic magnetic field and galaxy morphologies (see also Recchia et al. 2016; Socrates et al. 2008; Mao & Ostriker 2018; Crocker et al. 2021; Quataert et al. 2022). Notably, models with CR-driven winds (or hybrid thermal-CR winds) are more successful in explaining the mild radial gradient of Milky Way’s (MW) -ray emission (Breitschwerdt et al., 2002) and the soft X-ray emission (Everett et al., 2008) than the hydrostatic models. CR-driven winds have been subsequently explored in many ISM, isolated galactic disk, and cosmological simulations (e.g. Hanasz et al. 2009; Booth et al. 2013; Salem & Bryan 2014; Girichidis et al. 2016; Pakmor et al. 2016; Ruszkowski et al. 2017; Hopkins et al. 2021a; Bustard et al. 2020; Bustard & Zweibel 2021; Buck et al. 2020).
In reality, gas around galaxies is likely a mixture of these models (Cox, 2005). For example, many X-ray emitting hot bubbles are observed in late type galaxies (Tyler et al., 2004). Many spiral galaxies also emit strongly in radio, suggesting the existence of strong CR and/or magnetic field pressures (Tüllmann et al., 2000).
Furthermore, we must also consider the interactions of outflows with circumgalactic medium (CGM) and infalling gas (e.g. Kereš et al., 2005; Muratov et al., 2015; Anglés-Alcázar et al., 2017; Hafen et al., 2019). Infalling gas and the CGM can co-rotate with galactic disks (Kereš & Hernquist, 2009; Stewart et al., 2017) and dynamically affect outflows and fountains (Fraternali & Binney, 2008). Cosmological simulations provide natural and suitable boundary conditions (de Avillez & Breitschwerdt, 2004; Hill et al., 2012; Martizzi et al., 2016; Fielding et al., 2017) for modeling the disk halo interaction.
Consequently, the support of gas above galactic disks is best studied with cosmological galaxy simulations with magnetic fields and CRs. However, simulating CR propagation (diffusion and streaming) was thought to be extremely computationally expensive at high resolution (Sharma et al., 2010; Sharma & Hammett, 2011). Recently, Jiang & Oh (2018), Thomas & Pfrommer (2019), and Chan et al. (2019) developed computationally efficient algorithms for CR diffusion and streaming. Using the algorithm developed in Chan et al. (2019), Hopkins et al. (2020b) performed and analysed an extensive suite of high resolution cosmological galaxy simulations with magneto-hydrodynamics (MHD) and CRs. In this work, we select the set of CR runs from Hopkins et al. (2020b) calibrated to reproduce the observed -ray emission to gas density relation (Chan et al., 2019; Hopkins et al., 2020b), which also matches the MW grammage constraint (Hopkins et al., 2021c). They yield a better match to the cool CGM properties (Ji et al., 2020) when compared to simulations without CRs.
In this paper, we investigate the disk-halo interaction of galaxies with the high resolution cosmological simulations with/without CRs (Hopkins et al., 2020b). These simulations also include a comprehensive set of stellar feedback processes, including stellar winds, radiation, and supernovae (Hopkins et al., 2018b). In particular, the momentum imparted by SNe to the surrounding gas is calculated in a resolution insensitive way. Collective effects of spatial and temporal clustering of stellar feedback naturally lead to strong galactic outflows that regulate growth of galaxies on cosmological timescales (Muratov et al., 2015, 2017).
The paper is organized as follows. In §2, we start with a brief description of the simulation code, simulated physics, simulation suite, and analysis methods. In §4.1, we compare different pressure components and assess the dynamical equilibrium with and without CRs. We investigate the effects of CR feedback on the gas flows around galaxies in §4.2, and the multiphase gas distribution in §4.3. Finally, we point out the caveats, some implications on the global ISM model, and the future work in §5 and §6.
2 Methods
2.1 Simulation code, simulated physics, and simulation setup
The simulations used in this analysis are first introduced in Hopkins et al. (2020b), where the details of simulated physics and numerical schemes can be found. We briefly summarize their key ingredients below.
2.1.1 Simulated physics
We simulate with the GIZMO222http://www.tapir.caltech.edu/phopkins/Site/GIZMO code (Hopkins, 2015) in the Lagrangian mesh-free finite mass (MFM) mode for hydrodynamics. This Lagrangian Godunov-type method has the advantage of both Lagrangian (smoothed particle hydrodynamics) and Eulerian methods. It captures shocks and fluid mixing instability accurately, allows adaptive spatial resolution, and conserves energy and momentum.
GIZMO uses an updated version of the PM+Tree algorithm from Gadget-3 (Springel, 2005) to calculate gravitational forces and adopts fully conservative adaptive gravitational softening for gas (Price & Monaghan, 2007). We apply the redshift-dependent and spatially uniform ultraviolet (UV) background model from Faucher-Giguère et al. (2009) that ionizes and heats gas in an optically thin approximation and use an approximate prescription to account for self-shielding of dense gas. We include atomic, metal-line, and molecular cooling for K with the tabulated cooling rates from CLOUDY (Ferland et al., 2013). We also include the explicit treatment of turbulent diffusion of metals, as in Colbrook et al. (2017) and Escala et al. (2018).
Star formation and stellar feedback are implemented with the FIRE-2 scheme (Hopkins et al., 2018b)333http://fire.northwestern.edu/, an updated version of the FIRE model (Hopkins et al., 2014). Stars form in dense (), self-gravitating, molecular gas with 100% instantaneous star formation efficiency (SFE) per local free fall time 444 We emphasize that 100% SFE applies only to dense, molecular, self-shielding, and locally-self-gravitating gas, while we set 0% SFE elsewhere. Hopkins et al. (2013) and Orr et al. (2018) showed that our simulations with this star formation algorithm match the observed effective star formation efficiency in giant molecular clouds (GMCs) (1-10%) (Bigiel et al., 2008; Leroy et al., 2008; Lee et al., 2016). Observations (e.g. Kauffmann et al. 2013) show that most of the gas in massive GMC complexes has a local virial parameter , so only a small fraction of this gas would satisfy our SF criteria.
After stars form, we follow stellar feedback, including stellar winds, Type II and Type Ia supernovae (SNe) (Hopkins et al., 2018a), and radiation (photoelectric and photo-ionization heating, UV/optical/IR radiation pressure) (Hopkins et al., 2020a). We use the Kroupa initial mass function (IMF) (Kroupa, 2002) and the STARBURST99 stellar population synthesis model (Leitherer et al., 1999) to calculate the energy, momentum, mass and metal return from stars.
We model magnetic fields with idealized magnetohydrodynamics (MHD) following Hopkins & Raives (2016). Fully anisotropic Spitzer-Braginskii conduction and viscosity are implemented as described in Hopkins (2017) and Su et al. (2017). The numerical implementation of CR physics is described in Chan et al. (2019). We approximate CRs as an ultra-relativistic fluid in a “single energy bin” approximation with adiabatic index . We assume strong coupling between CRs and gas, so CRs also contribute to the the effective sound speed.
We inject 10% of SNe (II & Ia) kinetic and stellar wind energy into CRs, which can dissipate and heat the surrounding medium through hadronic and Coulomb interactions (Guo & Oh, 2008). CRs can transport via advection, anisotropic diffusion with a constant diffusion coefficient of calibrated to match the relation between total -ray luminosity and gas density (Chan et al., 2019)555The diffusion coefficient of the order near galactic disk is also favored by Evoli et al. (2018). They derived similar order of magnitude diffusion coefficients (for GeV CR protons) from wave self-generation and advection as the best fit for the CR spectra.. We also consider Alfvenic streaming with streaming speed equal to the Alfven speed () and streaming losses equal to . CR transport is implemented with a two-moment method (Chan et al., 2019), which is computationally efficient and can simultaneously simulate diffusion and streaming (see also Jiang & Oh 2018; Thomas & Pfrommer 2019).
We consider a standard flat cold dark matter cosmology with , , , and . The initial conditions (ICs) of the runs are generated with the MUSIC code (Hahn & Abel, 2011)666The configuration files for the IC generation are publicly available here http://www.tapir.caltech.edu/phopkins/publicICs/. To achieve high resolution to resolve the multiphase ISM and incorporate our feedback model, we adopt the “zoom-in” technique(Porter, 1985; Katz & White, 1993; Oñorbe et al., 2014).
2.1.2 Simulation Suite
In this paper, we consider three variations of physics and adapt notations used in Hopkins et al. 2020b:
We select three simulated galaxies close to the MW-mass (simulated ) from Hopkins et al. (2020b). Their properties are summarized in Table 1. The initial conditions of m12i, m12f, and m12b are identical to those in the Wetzel et al. (2016); Hopkins et al. (2018b) simulations. Note that the “Hydro+” runs in general have higher stellar masses and star formation rates (SFRs) than the “CR+” runs. m12f has slightly higher SFRs around caused by the interaction and gas accretion from a nearby satellite.
We emphasise that is our adopted minimum allowed value of the gravitational force softening length under the adaptive softening scheme. In practice, this softening length is not reached, e.g. the minimum gas smoothing length and corresponding softening are around 8 pc in the m12i CR+ run. Therefore, we cannot resolve the thermal Jeans scale of gas around or above the star formation threshold of 1000 777 Since we don’t resolve the thermal Jeans length and related (physical) fragmentation for individual stars, we are using a model for the IMF in our stellar particles (Hopkins et al., 2018b). .
But even if the simulations do not resolve the thermal Jeans scale of cold dense gas, our Lagrangian method does not have artificial fragmentation of differentially rotating disks in the sense of Truelove et al. (1997) (unlike in grid codes), as long as the consistency between gravitational and hydrodynamic resolution is maintained (Bate & Burkert, 1997; Hopkins et al., 2018b; Grudić et al., 2021; Yamamoto et al., 2021). However, physical fragmentation might be prevented or slowed down if the thermal Jeans scale is not resolved, i.e. “under-fragmentation”.
Nonetheless, the thermal Jeans scale is only a conservative resolution requirement for fragmentation, since thermal pressure is sub-dominant compared to kinetic (or turbulent) and CR pressures (see below). In particular, Hopkins et al. (2018b) showed, even though the thermal Jeans mass in cold gas is not resolved, the GMC mass function is convergent at the resolution we adopt.
| Name | |||||||
|---|---|---|---|---|---|---|---|
| m12i | 1.2 | 7.4 | 2.6 | 7.8 | 2.3 | 7.0 | 2.0 |
| m12f | 1.6 | 8.9 | 3.6 | 10.2 | 4.7 | 7.0 | 1.9 |
| m12b | 1.3 | 9.1 | 3.4 | 8.5 | 2.3 | 7.0 | 2.2 |
2.1.3 Halo finding and galaxy orientation
We locate halos and calculate their virial masses and radii with the Amiga Halo Finder (AHF) (Knollmann & Knebe, 2009)888http://popia.ft.uam.es/AHF/Download.html. AHF locates the prospective halo center with an adaptive mesh refinement hierarchy. We use the MergerTree code in AHF to follow the main progenitor of a halo and study its time evolution (whenever mentioned in the text). We determine the virial over-density and radius with the Bryan & Norman (1998) formulae and define the halo mass as the total mass within the virial radius.
We rotate the galaxy such that the galactic midplane is perpendicular to the total angular momentum of stars within 5 kpc from the halo center. To locate the galactic center, we place stars (within 5 kpc from the halo center) onto resolution mesh and define the highest density peak as the galactic center.
2.2 Theoretical framework for dynamical balance
2.2.1 Volume-weighted quantities
To calculate the volume-weighted quantities , we divide the simulation volume around a galaxy into cubes with side length (=0.25 kpc in the fiducial case). We consider the volume weighted quantity inside a cube (with a volume ) to be:
| (1) |
where is the quantity X of particle i and we sum over all particles in , so denotes volume-average within cube j.
2.2.2 Dynamical Equilibrium: Definition
We define “dynamical balance” following e.g. Boulares & Cox (1990). In an appropriate inertial Cartesian frame (which we take to be the center-of-momentum frame of the galaxy, with the axis defined to point along the total angular momentum vector of the galaxy), take the kinetic MHD momentum equation in conservative form (assuming tight-coupling of CRs), and assume local steady-state (so the Eulerian time derivatives vanish), giving
| (2) |
where is the gas density, gas velocity, the thermal pressure tensor which we take in our analysis be with (we ignore the anisotropic Braginskii kinetic terms here, as they are generally small), the CR pressure tensor (which we again approximate as isotropic, , with ), is the magnetic pressure tensor, and is the gravitational acceleration.
Then we take the component of Eq. 2, and average it over thin “slab” between , assuming that mass flux in the directions and the cross terms (e.g. off-diagonal terms) between and (or and ) are negligible after integration, giving:
| (3) |
where is the magnetic tension and is the kinetic pressure, and refers to the volume-average of quantity within the slab. Note that we have omitted the momentum source terms because the momentum source terms are shown to be small away from galactic midplane and galactic center (Gurvich et al., 2020).
In order to calculate the gravity and other pressure components, we further divide the slabs into cube . Note that the kinetic component can be separated into a local bulk flow component (due to the mass weighted mean velocity within the cube j, ) and a dispersion component with , i.e.
| (4) |
We stress that the dispersion term simply includes all kinetic energy of non-uniform motion – we make no effort to actually determine if this motion is turbulent in any rigorous sense, and it should not be interpreted as such.
The right hand side shows the gravity, where is the magnitude of gravity in the vertical direction. The sum of the left hand side is the total support (total), which will be equal to the gravity in dynamical balance.
Our approach is nearly equivalent to Gurvich et al. (2020), except that we include all of the gas in the calculation, whereas they exclude dense gas. Since we are focusing more on pressure above the disk, this difference should not be important. Furthermore, Gurvich et al. (2020) deposited gas particles into meshes according to their kernels, but we deposit according to their locations. The difference is insignificant if we average over galactic disks and tens of Myrs, as we do in the next section.
This definition of dispersion pressure is also similar to other simulation work, e.g. Joung et al. (2009) (although they took the mean of velocity dispersion in three orthogonal directions). On the other hand, Kim & Ostriker (2018) adapted in the turbulent pressure, so their turbulent pressure is what we refer to as the total kinetic pressure.
Note that the dispersion pressure is a function of the cube size , e.g. it is weaker with a smaller grid (Gurvich et al., 2020). We pick the fiducial cube length to be 0.25 kpc because it is close to the turbulence generation scale (Elmegreen et al., 2003; Bournaud et al., 2010) and Joung & Mac Low (2006) found most of the turbulence energy is within 200 pc scale. But we also show the dispersion pressure for other cube sizes in the next section.
We define hydrostatic balance by pressure balance excluding the bulk flow pressure, and dynamical balance by including the bulk flow pressure term (consistent with the terminology in Gurvich et al. 2020).
Some of the non-hydrostatic solutions, e.g. with steady inflows/outflows/fountains, can be still in dynamical balance, where the bulk flow pressure helps to balances gravity, i.e. . In our definition, dynamical equilibrium means that the system is in a steady state, at least in the vertical direction. Note that this terminology is different from some literature (e.g. Hill et al., 2012; Boettcher et al., 2016, 2019).
We estimate the gravitational acceleration at the center of the cube by summing over only particles within 100 kpc from the galactic center and pick one particle from every hundred, but increase its mass by one hundred times999Comparing the gravitational force without this approximation, we found that the error is 10% around the midplane and even smaller above the plane..
2.3 Multiphase medium and temperature cut
We divide gas into five phases, the cold medium (CM; ), warm neutral medium (WNM; ), warm ionized medium (WIM; ), warm hot ionized medium (WHM; ), and hot ionized medium (HIM; ). Note that CM includes both molecular gas and cold neutral gas. The WHM is the transitional phase, which means gas is unlikely to stay in this phase for a long time under pure thermal pressure. Note that these temperature cuts are different from Gurvich et al. (2020), but similar to Vijayan et al. (2020), who performed a similar analysis on the TIGRESS simulations.
3 Conceptual Models of the disk-halo interaction
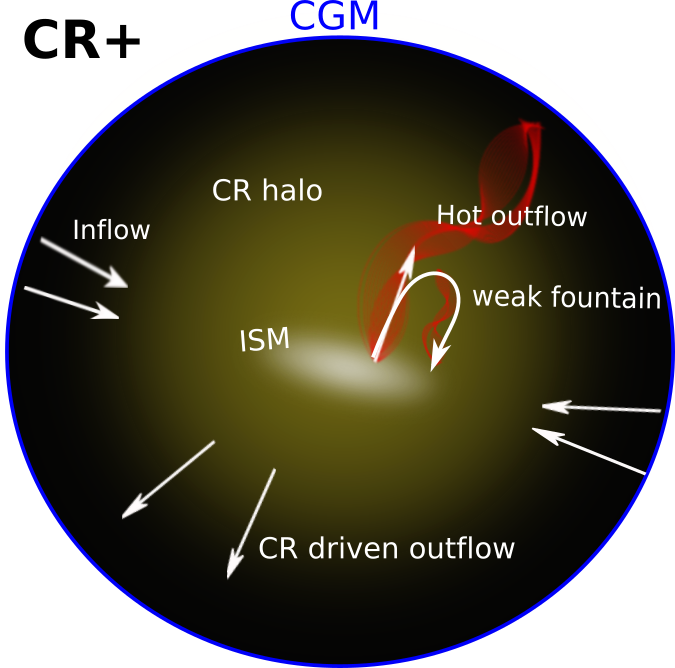
In the introduction, we mentioned different models for the disk-halo interface. Based on our results in Section 4 we construct the following conceptual model of the zone between galactic ISM and the CGM. The models differ significantly for Hydro+ and CR+ and is illustrated in Fig. 1.
Hydro+ is best described with a “galactic fountain” model, where superbubbles break out above the disk and, once cooled, the gas falls back to the disk. Hot gas from the bubbles is not able to escape from the halo (Muratov et al., 2015), possibly due to strong gravity and hot gas confinement (see discussion in §4.2.2 and Hopkins et al. 2021a). Additional infall of hot gas is supplied from the hot CGM (produced by virial shocks; see Ji et al. 2021).
The CR+ simulations can be described with a hybrid model with CR-driven wind and hot gas bubbles. Around the galactic disks, there are hot super-bubbles and gas is supported by kinetic pressure. At a larger height, gas is supported or even pushed out by CR pressure, so the galaxies are embedded in a WIM/WHM halo. CR pressure dominates in the halo and prevents rapid recycling of fast winds (i.e. there are only weak galactic fountains), but instead, allows fast SN heated gas to escape from the inner halo.
While not explored in this work, the bulk of the infalling gas in our simulated galaxies accretes radially in the disk midplane and is not contributing significantly to the vertical gas flows (see Hafen et al. 2019; Trapp et al. 2022.
We have presented two distinctive conceptual models for no CRs and CR-dominated cases, but reality might lie between these two cases. For example, Ji et al. (2020) found that the no-CR simulations were in tension with observed OVI absorption, while the CR-dominated model had difficulty reproducing observations for high ions.

4 Results
4.1 Vertical Support and Dynamical Equilibrium
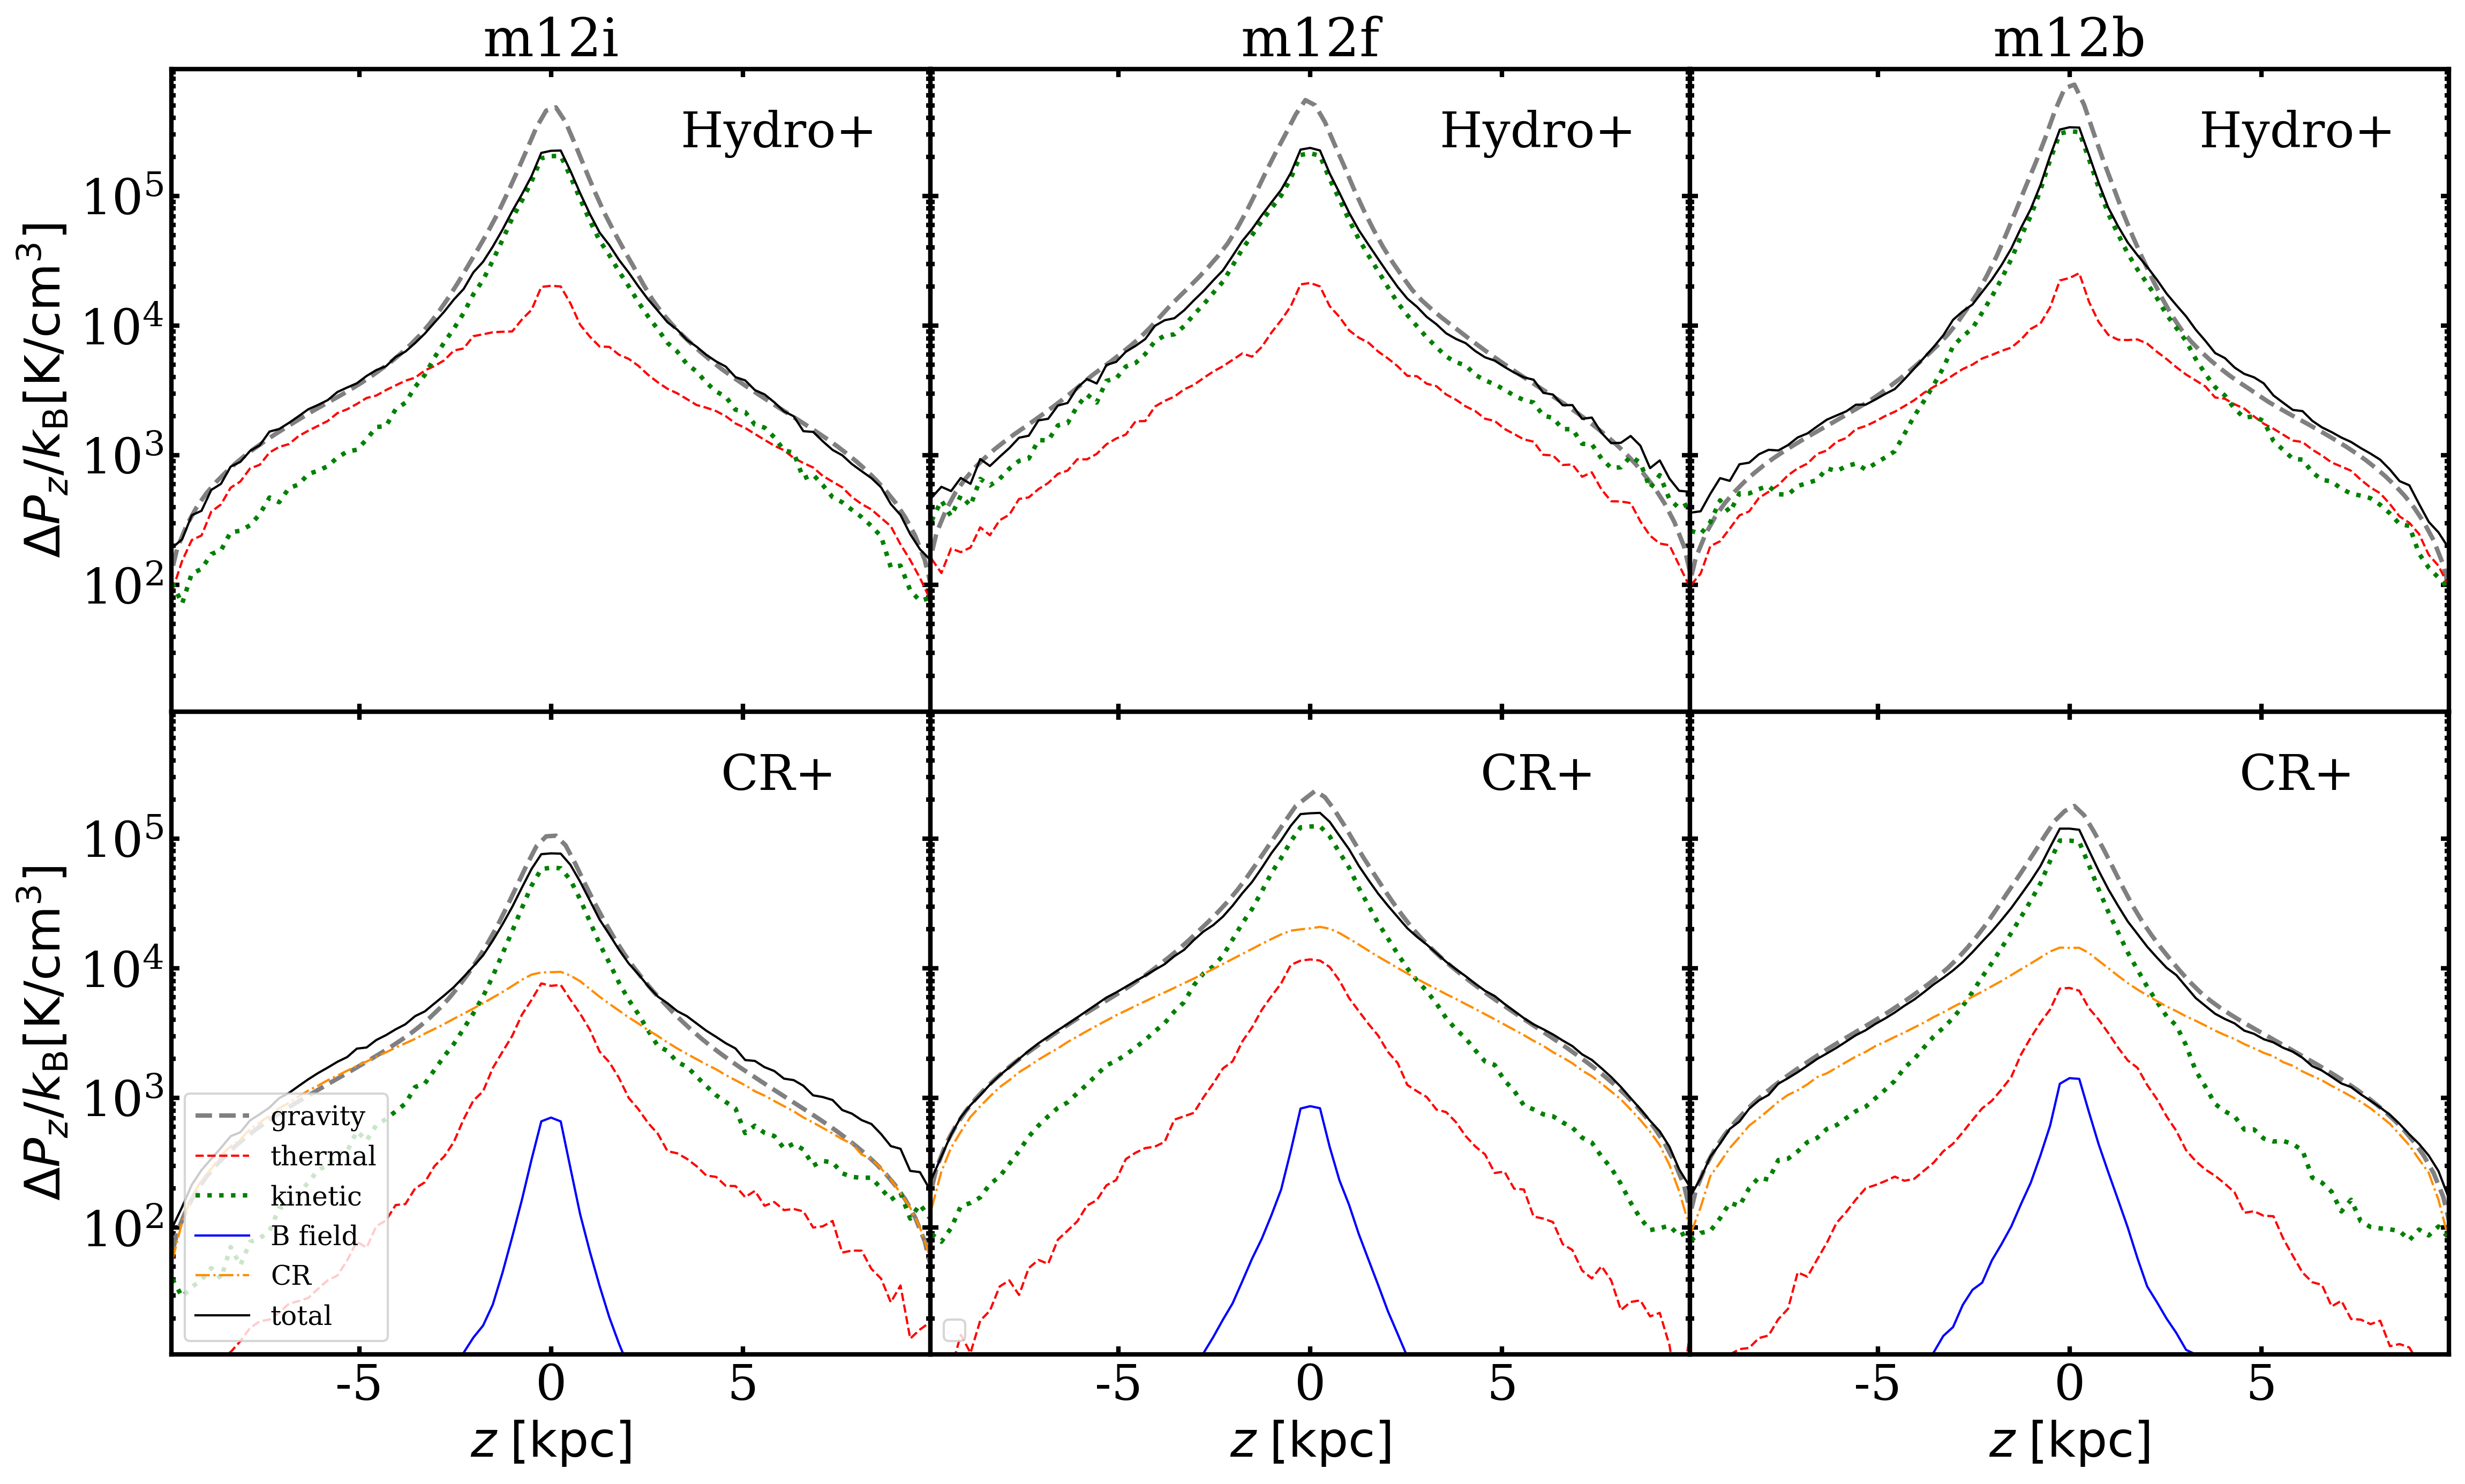
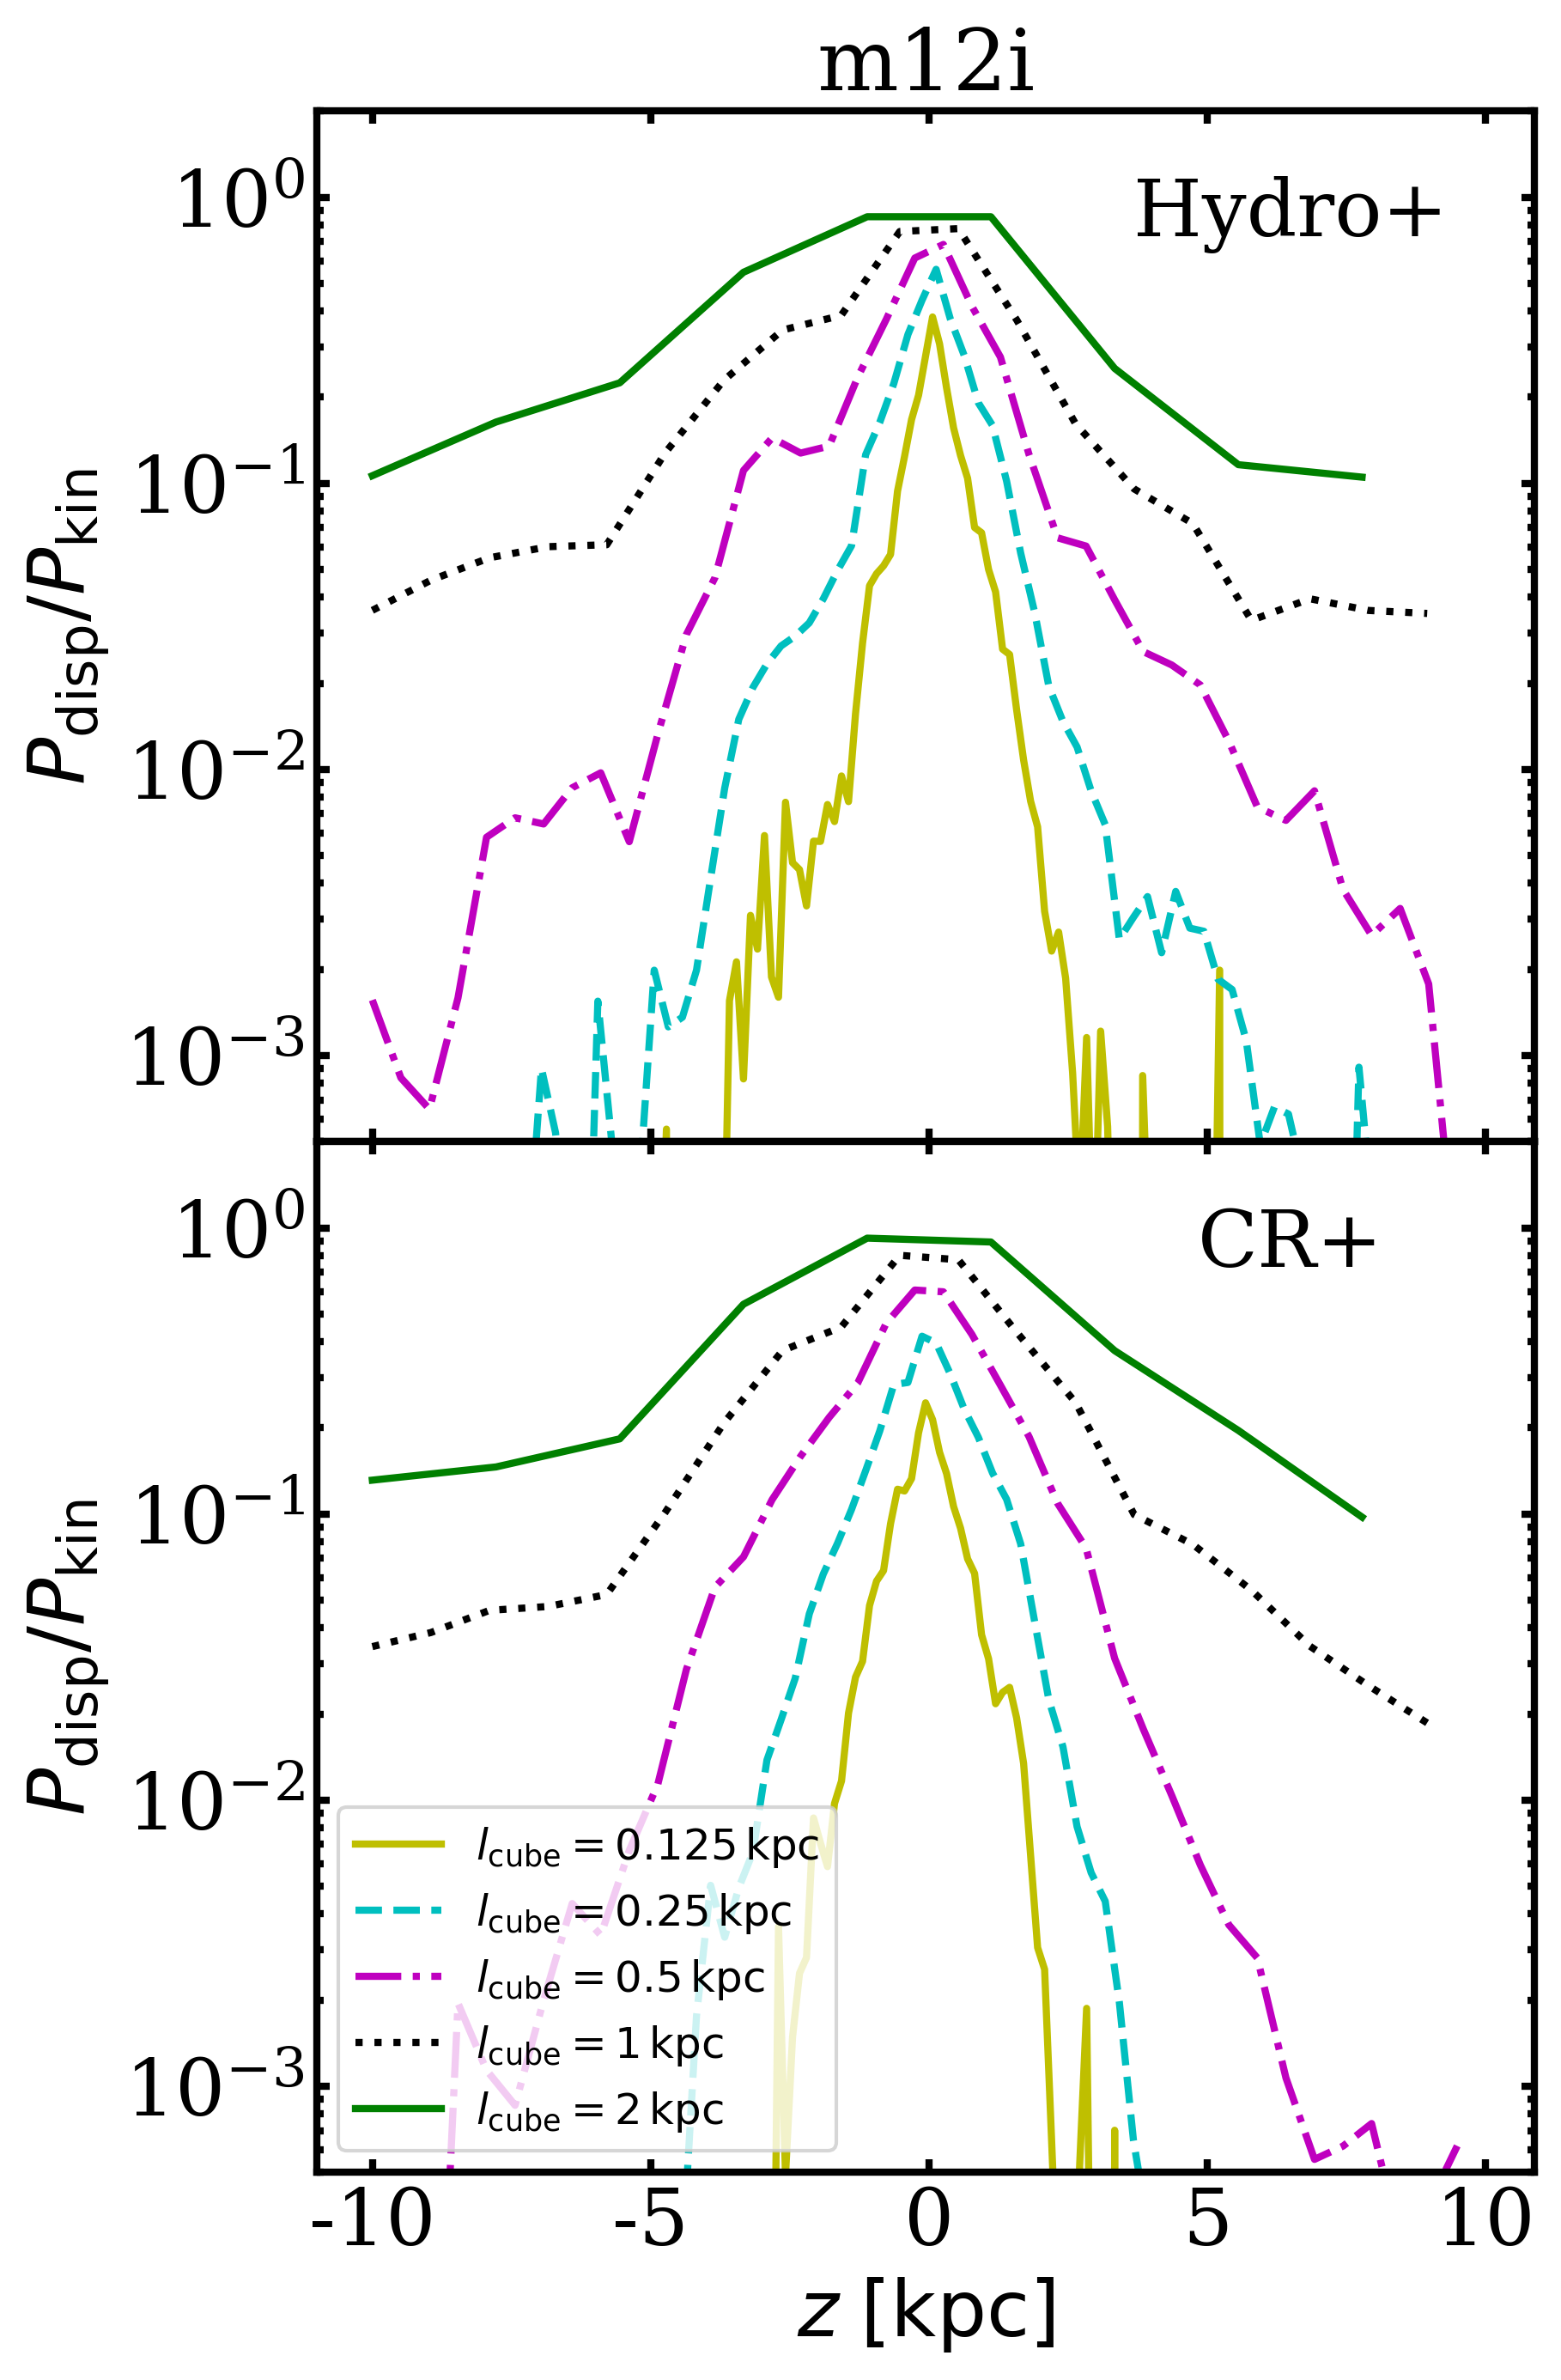
Fig. 2 compares different pressure components from Eq. 3 averaged over the last 250 Myr. Specifically, we integrate from to a given height to get the pressure (tension) difference , or equivalently take the pressure difference between the gas at the height and away from the mid-plane. Note that this subtraction can be lead to very low values of pressure difference. For example, Fig. 15 shows that difference in thermal or CR pressure can drop by a factor of a few near after the subtraction, since thermal or CR pressure vertical profile can be very flat.
In both Hydro+ and CR+ runs, we find a good balance from to between vertical support and gas weight (“gravity”), which implies that the dynamical equilibrium is a reasonable assumption, at least when averaged over 250 Myr. Only in m12i CR+, the total pressure is slightly higher than the gravity at heights of several kpc owing to the recent strong superbubbles (see Fig. 4). But the deviation is less than a factor of two even in this worst case.
However, dynamical balance appears to be violated around the midplane in all runs likely as a combination of approximations made in our equations and our calculation of physical quantities. In deriving the dynamical equilibrium (Eq. 3), following Boulares & Cox (1990) we neglect the large scale correlations between and , e.g. rotation, shear flows, fountains etc, which can be important near the midplane101010Numerically, the gravitational acceleration is averaged over finite-size grids, so the location at which we estimate gravity is slightly mismatched with the gas center of gravity near the midplane; we find the balance is better at smaller grid sizes, but it already converges at the grid size we used, so we use this grid size to reduce computational expense..
Gurvich et al. (2020) also noted an apparent pressure deficit of up to 30% near the midplane, which can potentially be explained by a combination of effects neglected in the dynamical balance: (a) in general, the left-hand side of Eq. 3 should also include an average over momentum source terms, which is non-zero when (as in the FIRE simulations) mechanical and radiative feedback is injected over a finite-size regions; and (b) in detail, our vertical balance analysis neglects correlations between density and velocity components, including motions in the disk plane.
Our midplane pressures are seemingly larger than the MW fiducial value. It is because the usually-quoted MW value (; Ferrière 2001) is measured at the solar circle (i.e. ). In contrast, Fig. 2 includes the central region (from to ), where midplane pressure is much higher. We have explicitly checked that the m12 midplane pressures are an order of magnitude lower at , so they are not in conflict with the MW value.
Fig. 2 and Fig. 15 show B-field does not affect the pressure balance in runs with MHD (with or without CRs). It is because the vertical magnetic tension is very weak, compared to other components, in all of the runs. Note that magnetic tension is only a fraction of the total magnetic pressure (Eq. 3), so it will be weaker than , especially when B field is perpendicular to the disks. Hill et al. (2012), for example, found a good cancellation of and terms in their elongated box ISM simulations, so the vertical magnetic tension is very small. Kim & Ostriker (2018) also found that magnetic field provides insignificant vertical support in their solar neighborhood TIGRESS simulations. Observations, e.g. Stein et al. (2020), also suggest B fields have significant perpendicular components (hence a weak tension).
In both Hydro+ and CR+ runs, kinetic pressure is the most dominant component around mid-plane, much stronger than thermal, magnetic, and CR pressures. Kinetic pressure is weaker in CR+ than in Hydro+, since the SFR and the inflow rate are lower (Hopkins et al. 2021a; Trapp et al. 2022).
In Fig. 3, we show that most of the kinetic pressure around mid-plane is from non-uniform gas motion within scale around 1-2 kpc, consistent with what Gurvich et al. (2020) found. Other pressures play only subdominant roles at the mid-plane. At height > 1 kpc, most of the kinetic pressure instead comes from bulk motions, which we will explore in the next section.
The more prominent difference between Hydro+ and CR+ is the pressure support at a large height. In Hydro+, thermal pressure takes over from kinetic pressure at a height as expected from hot halos in galaxies without CRs (Ji et al., 2020). However, in CR+, the thermal pressure at a large height is weakened significantly (Salem et al., 2016; Butsky & Quinn, 2018; Hopkins et al., 2021c)). This is because CR feedback modifies the multiphase gas flows and the phase structure of the CGM (Hopkins et al., 2021a; Ji et al., 2020; Ji et al., 2021). We discuss this in the next section and later show that the near-disk hot gas content is still proportional to the SFR in §5.2.1, consistent with a star formation driven origin.
Instead of thermal pressure, in CR+, CR pressure takes over at . Thermal and kinetic pressures are strongly suppressed, compared to the Hydro+ runs. Several lines of argument can explain why CR pressure, instead of thermal pressure, can dominate.
First, CRs have a smaller “effective” adiabatic index () than the thermal adiabatic index (), so CR adiabatic losses are weaker. Second, CRs cool only weakly through hadronic and streaming losses (at low density), and do not suffer from radiative cooling. At the same time, dominant CR pressure slows down gas infall into the halo, lowering post shock temperature and increasing overall density, resulting in increase of radiative losses of the volume filling gas phase and prevention of formation of the hot halo in our galaxies with CRs (Ji et al., 2021).
A simple estimate can demonstrate that thermal or kinetic pressures are not needed at large to support the gas, if CRs are present. For our assumption, the CR injection rate is
| (5) |
where is the energy per SNe, SFR is star formation rate (), is the mean stellar mass, and is the fraction of stars that can produce SNe (Kroupa, 2002). We assume steady state so that diffusion out of the region is approximately compensated by injection and the losses are small (for high diffusion coefficient)and estimate the CR energy density at 10 kpc (Hopkins et al., 2020b) as:
| (6) |
where is the effective isotropically-averaged CR diffusion coefficient ().
This CR energy density is comparable to the thermal energy density of halo gas at 10 kpc in our non-CR simulations with and , so thermal (or kinetic) pressure is not required to support the gas away from galactic disks. In fact, CR pressure can be important even out to virial radii if the diffusion coefficient is constant (see Ji et al. 2020; Hopkins et al. 2021a), effectively supporting a large fraction of the halo gas.
In the CR-dominated regime, we find that gas density is carefully adjusted to the CR pressure so that the gas weight balances the CR pressure, since hot and rarefied gas will flow out along CR pressure gradient and dense gas will fall in, until the CR pressure gradient balances gravity (Hopkins et al., 2020b).
However, near galactic disks, the gravitational force is strong owing to concentration of baryons. For example, the typical galaxy stellar surface density is and gas surface density is in our CR+ and Hydro+ simulations (Gurvich et al., 2020; Hopkins et al., 2020b). These give the gravitational pressure , which is larger than the midplane CR pressure , so the additional support from kinetic pressure is required to prevent gas collapse.
Our simulated CR distribution is roughly consistent with the observations, e.g. CR halo scale height is kpc and the midplane energy density around (Ferrière, 2001; Grenier et al., 2015). Our total ray emission is also consistent with galaxies with similar gas surface densities (Hopkins et al., 2020b). However, it is currently uncertain whether CR halos can extend and be dynamically important out to tens or even hundred kpc, since observations of CRs and magnetic fields in those regimes are sparse.
While kinetic pressure is suppressed by CR feedback, the ratio between kinetic pressure and SFR is not reduced, likely because kinetic pressure is roughly fueled by stellar feedback and gas inflow, which correlate tightly with SFR.
Note that our analysis includes pressure from the bulk flows so we only demonstrate dynamical balance in Hydro+ instead of hydrostatic balance, as also found in Gurvich et al. (2020). A steady inflow/outflow/fountain solution will still satisfy dynamical balance, but it will violate hydrostatic balance. We have shown in Fig. 3 that the pressure from non-uniform motion (on scale) dominates kinetic pressure around the mid-plane, but bulk flow pressure is more important above the plane. CR+ runs are close to hydrostatic balance. The gas is supported by kinetic pressure from non-uniform gas motion near the midplane and CR pressure above the disks.
In Appendix A, we also examine the pressure balance in runs with CRs with a lower diffusion coefficient (CR+3e28). We find that they maintain dynamical balance, but the CR pressure in CR+3e28 drops much faster, so the kinetic and CR pressures are roughly in equipartition at even a great height.
4.2 Vertical Gas Flows
4.2.1 Multiphase gas flows
We found in the last section that the sources of pressure support in Hydro+ and CR+ runs are different. We now explore whether CR+ and Hydro+ differ also in the gas kinematics and phase distributions.

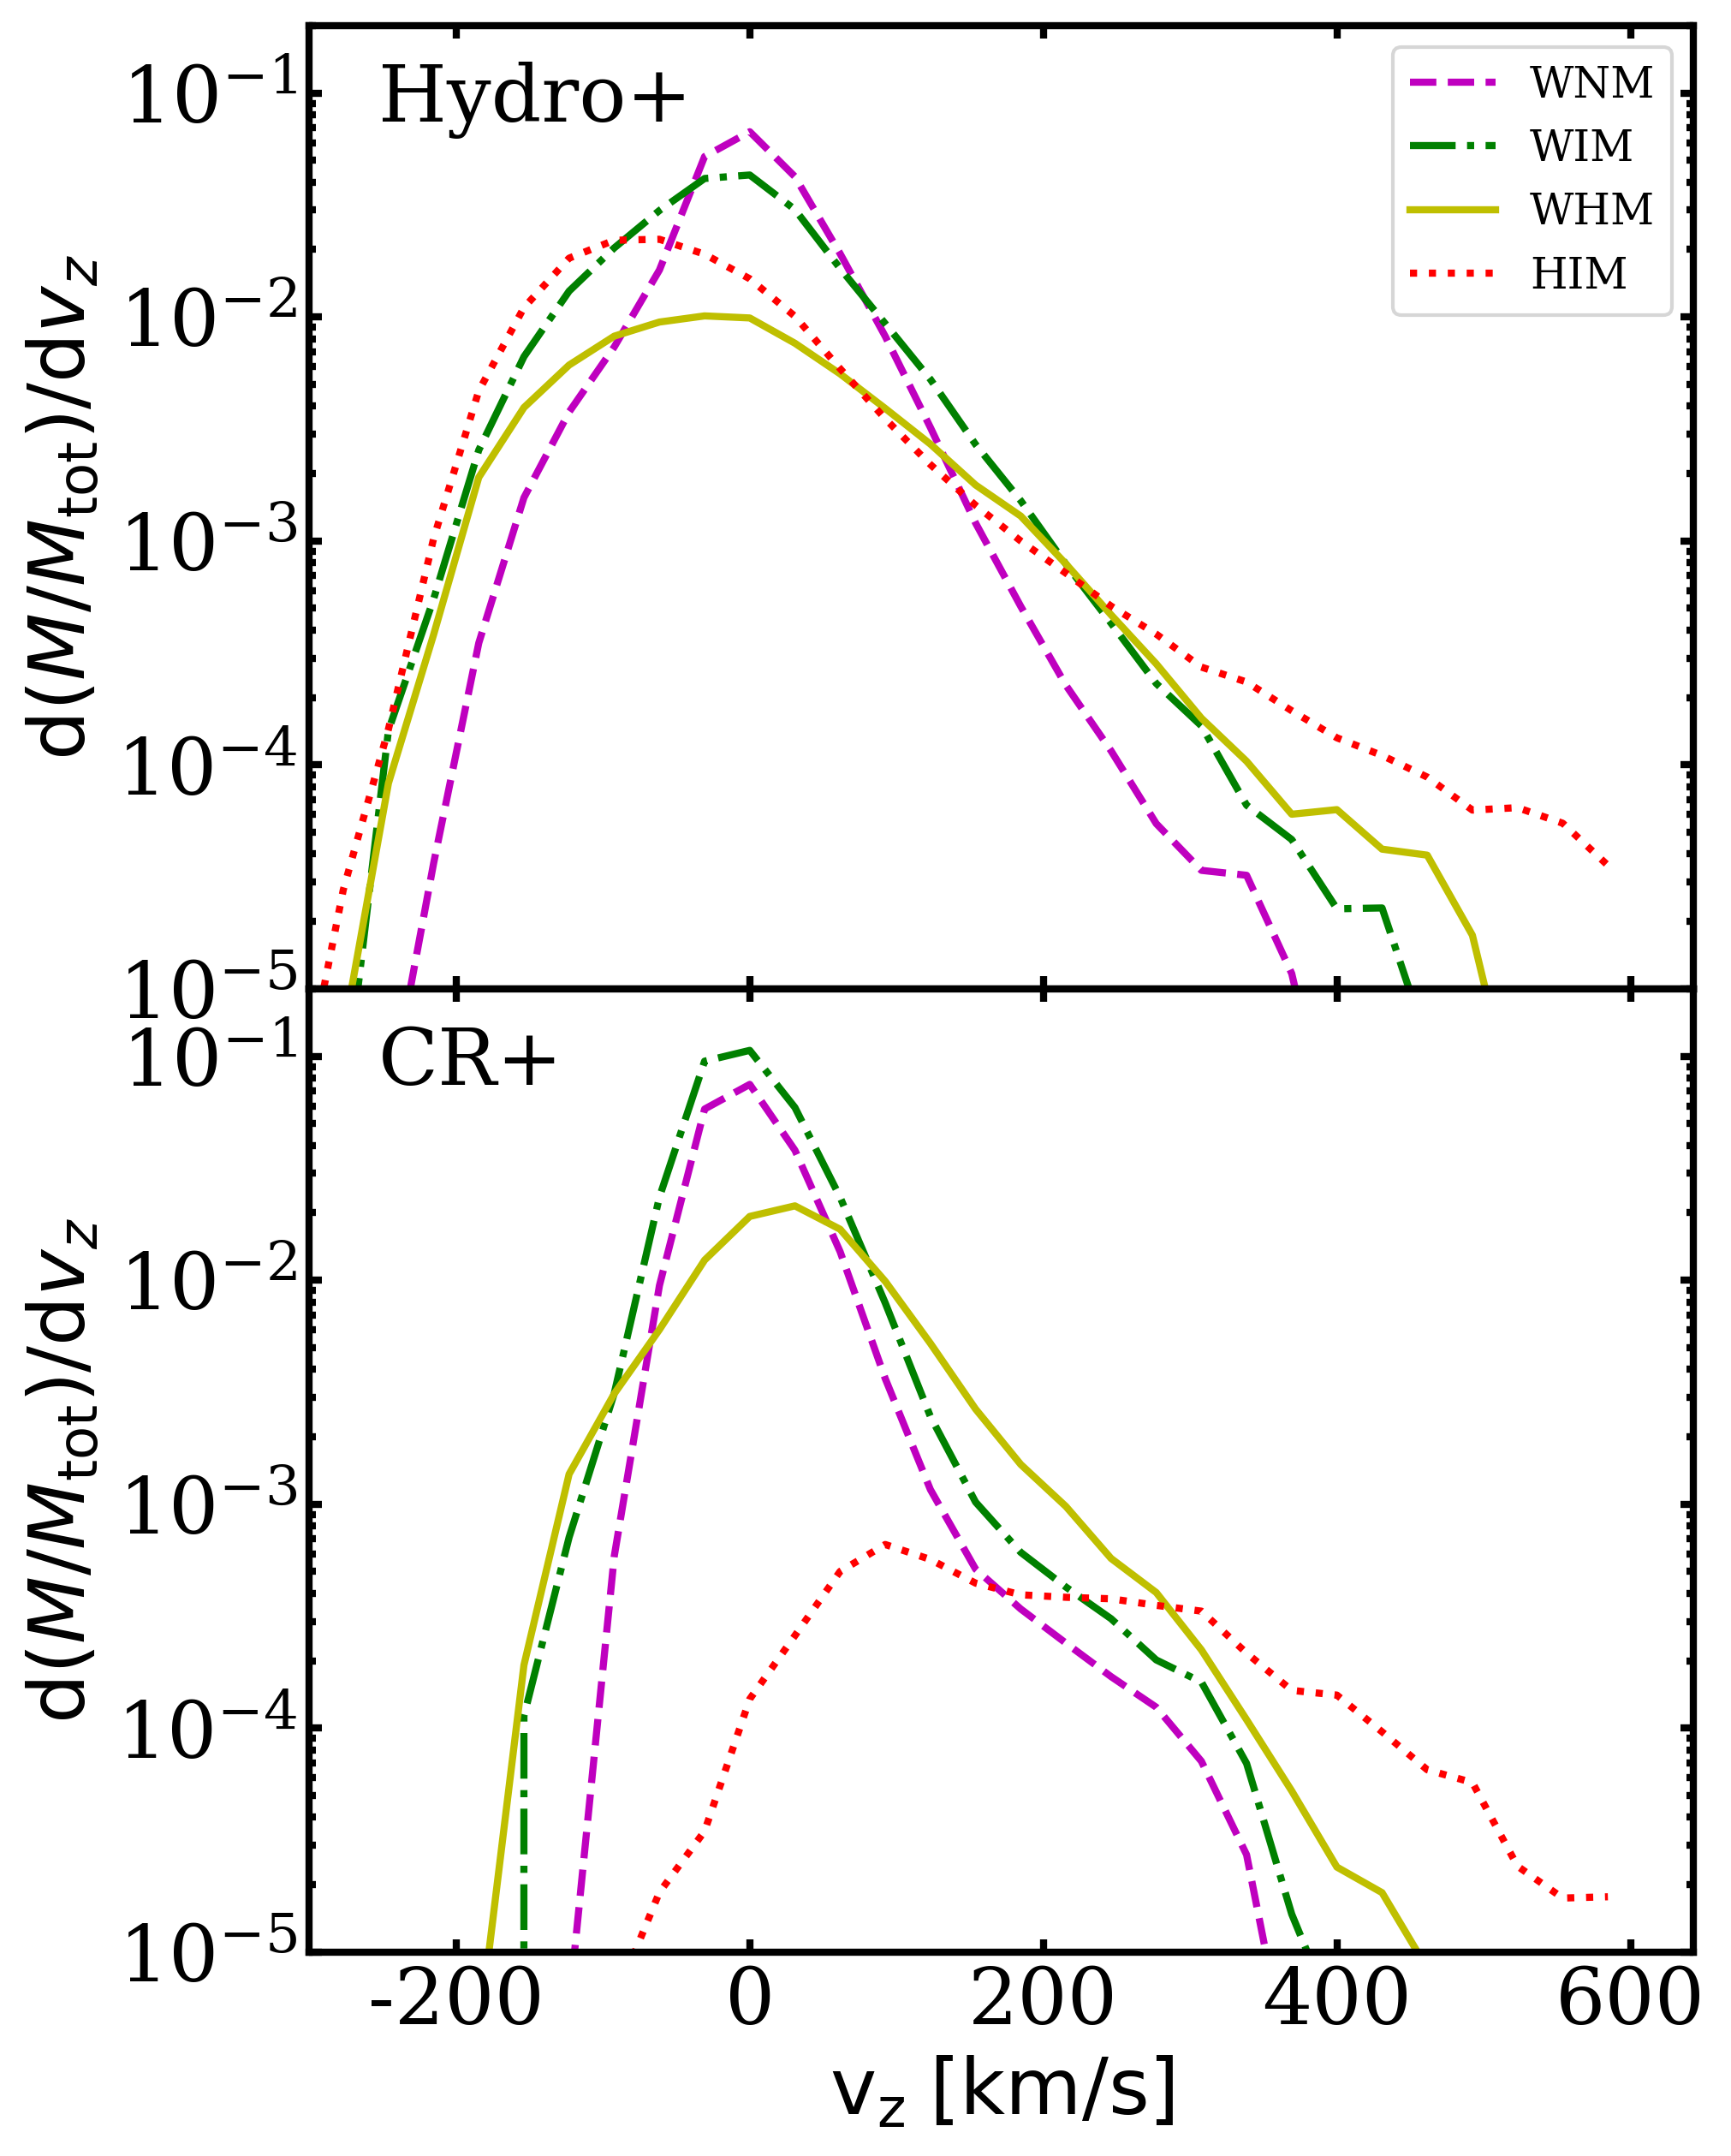
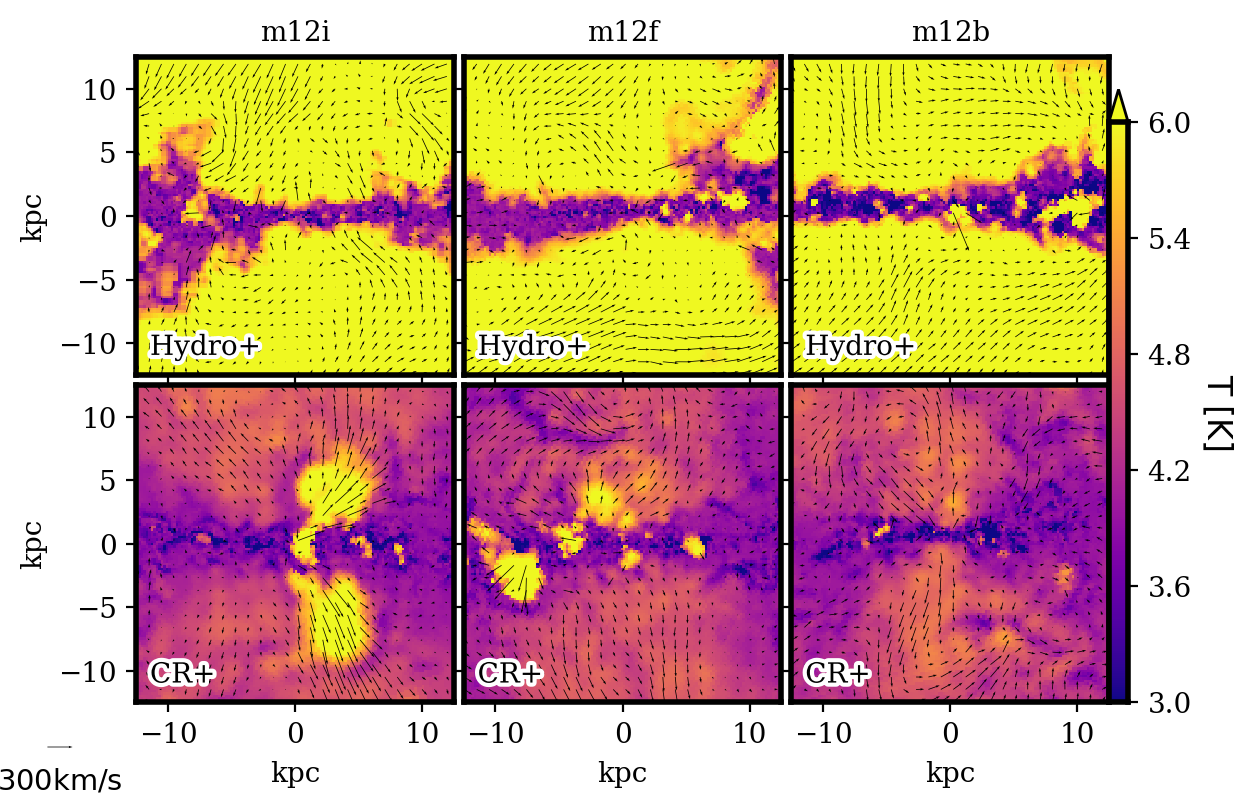
Fig. 4 reveals the gas motions in the Hydro+ and CR+ runs, where arrows represent gas velocity and colors represent gas temperature. The most striking feature is the outflows from galaxies, as we also illustrated schematically in Fig. 1. In Hydro+, there are some hot () and fast () superbubbles in the gaseous disks, some of which will break out from the disk, but most of the hot gas is not outflowing beyond 2 kpc, as we confirmed in Fig. 5. In CR+, there are two types of outflows, the hot-fast (; ) and warm-slow (; ) types. The first type is still associated with SN bubbles, but the second type is likely wind driven by the CR pressure gradient (e.g. Breitschwerdt et al. 1991; Salem & Bryan 2014; Hopkins et al. 2021a).
There are also morphological differences between the outflows in Hydro+ and CR+. The hot fast outflowing gas in m12i CR+ resemble galactic chimneys (Norman & Ikeuchi, 1989): the bubbles are elongated along the perpendicular direction within < 2 kpc, but then propagate radially beyond = 2 kpc. It is easier to see galactic chimney in CR+ than Hydro+, since hot gas more easily moves away from the disk along CR gradient, whereas in Hydro+ hot gas is confined by the ambient hot gaseous halos and gravity (see §4.2.2). Compared to SN bubble driven winds, CR-driven winds are more uniform and moving more radially away from the galactic centers, since the CR distribution is roughly ellipsoidal around the galaxies.
Another prominent difference between Hydro+ and CR+ is in the infalling gas, as we quantified in Figs. 5 and 6. In Hydro+, the infalling gas is mostly with high relatively velocities () when high above the disk plane. There is a small amount of infalling gas, but it is mostly close to and associated with gaseous disks. On the other hand, with CRs, even the infalling gas is predominantly warm () and slow (). In CR+, the hot ionized gas almost never falls to the disk due to its strong thermal plus CR pressure.
We only show the net vertical outflows above the galactic disk, but the complementary analysis of FIRE-2 galaxies indicates that the bulk of galactic gas accretion actually proceeds largely along the disk plane at larger galactic radii (Trapp et al., 2022).
In general, Hydro+ runs have faster infalling and outflowing gas than CR+ (see Fig. 6). The higher inflow rates in Hydro+ and thus the higher SFRs (Table 1) cause stronger feedback and gas velocity in the Hydro+ runs. The weaker inflow in CR+ is likely a consequence of large-scale galactic outflows driven by CRs and the slowdown caused by non-thermal pressure gradients (Ji et al., 2021). This results in lower SFR and explains why the kinetic pressure in CR+ is weaker than in Hydro+ in Fig. 2.
4.2.2 The fate of hot/warm outflows
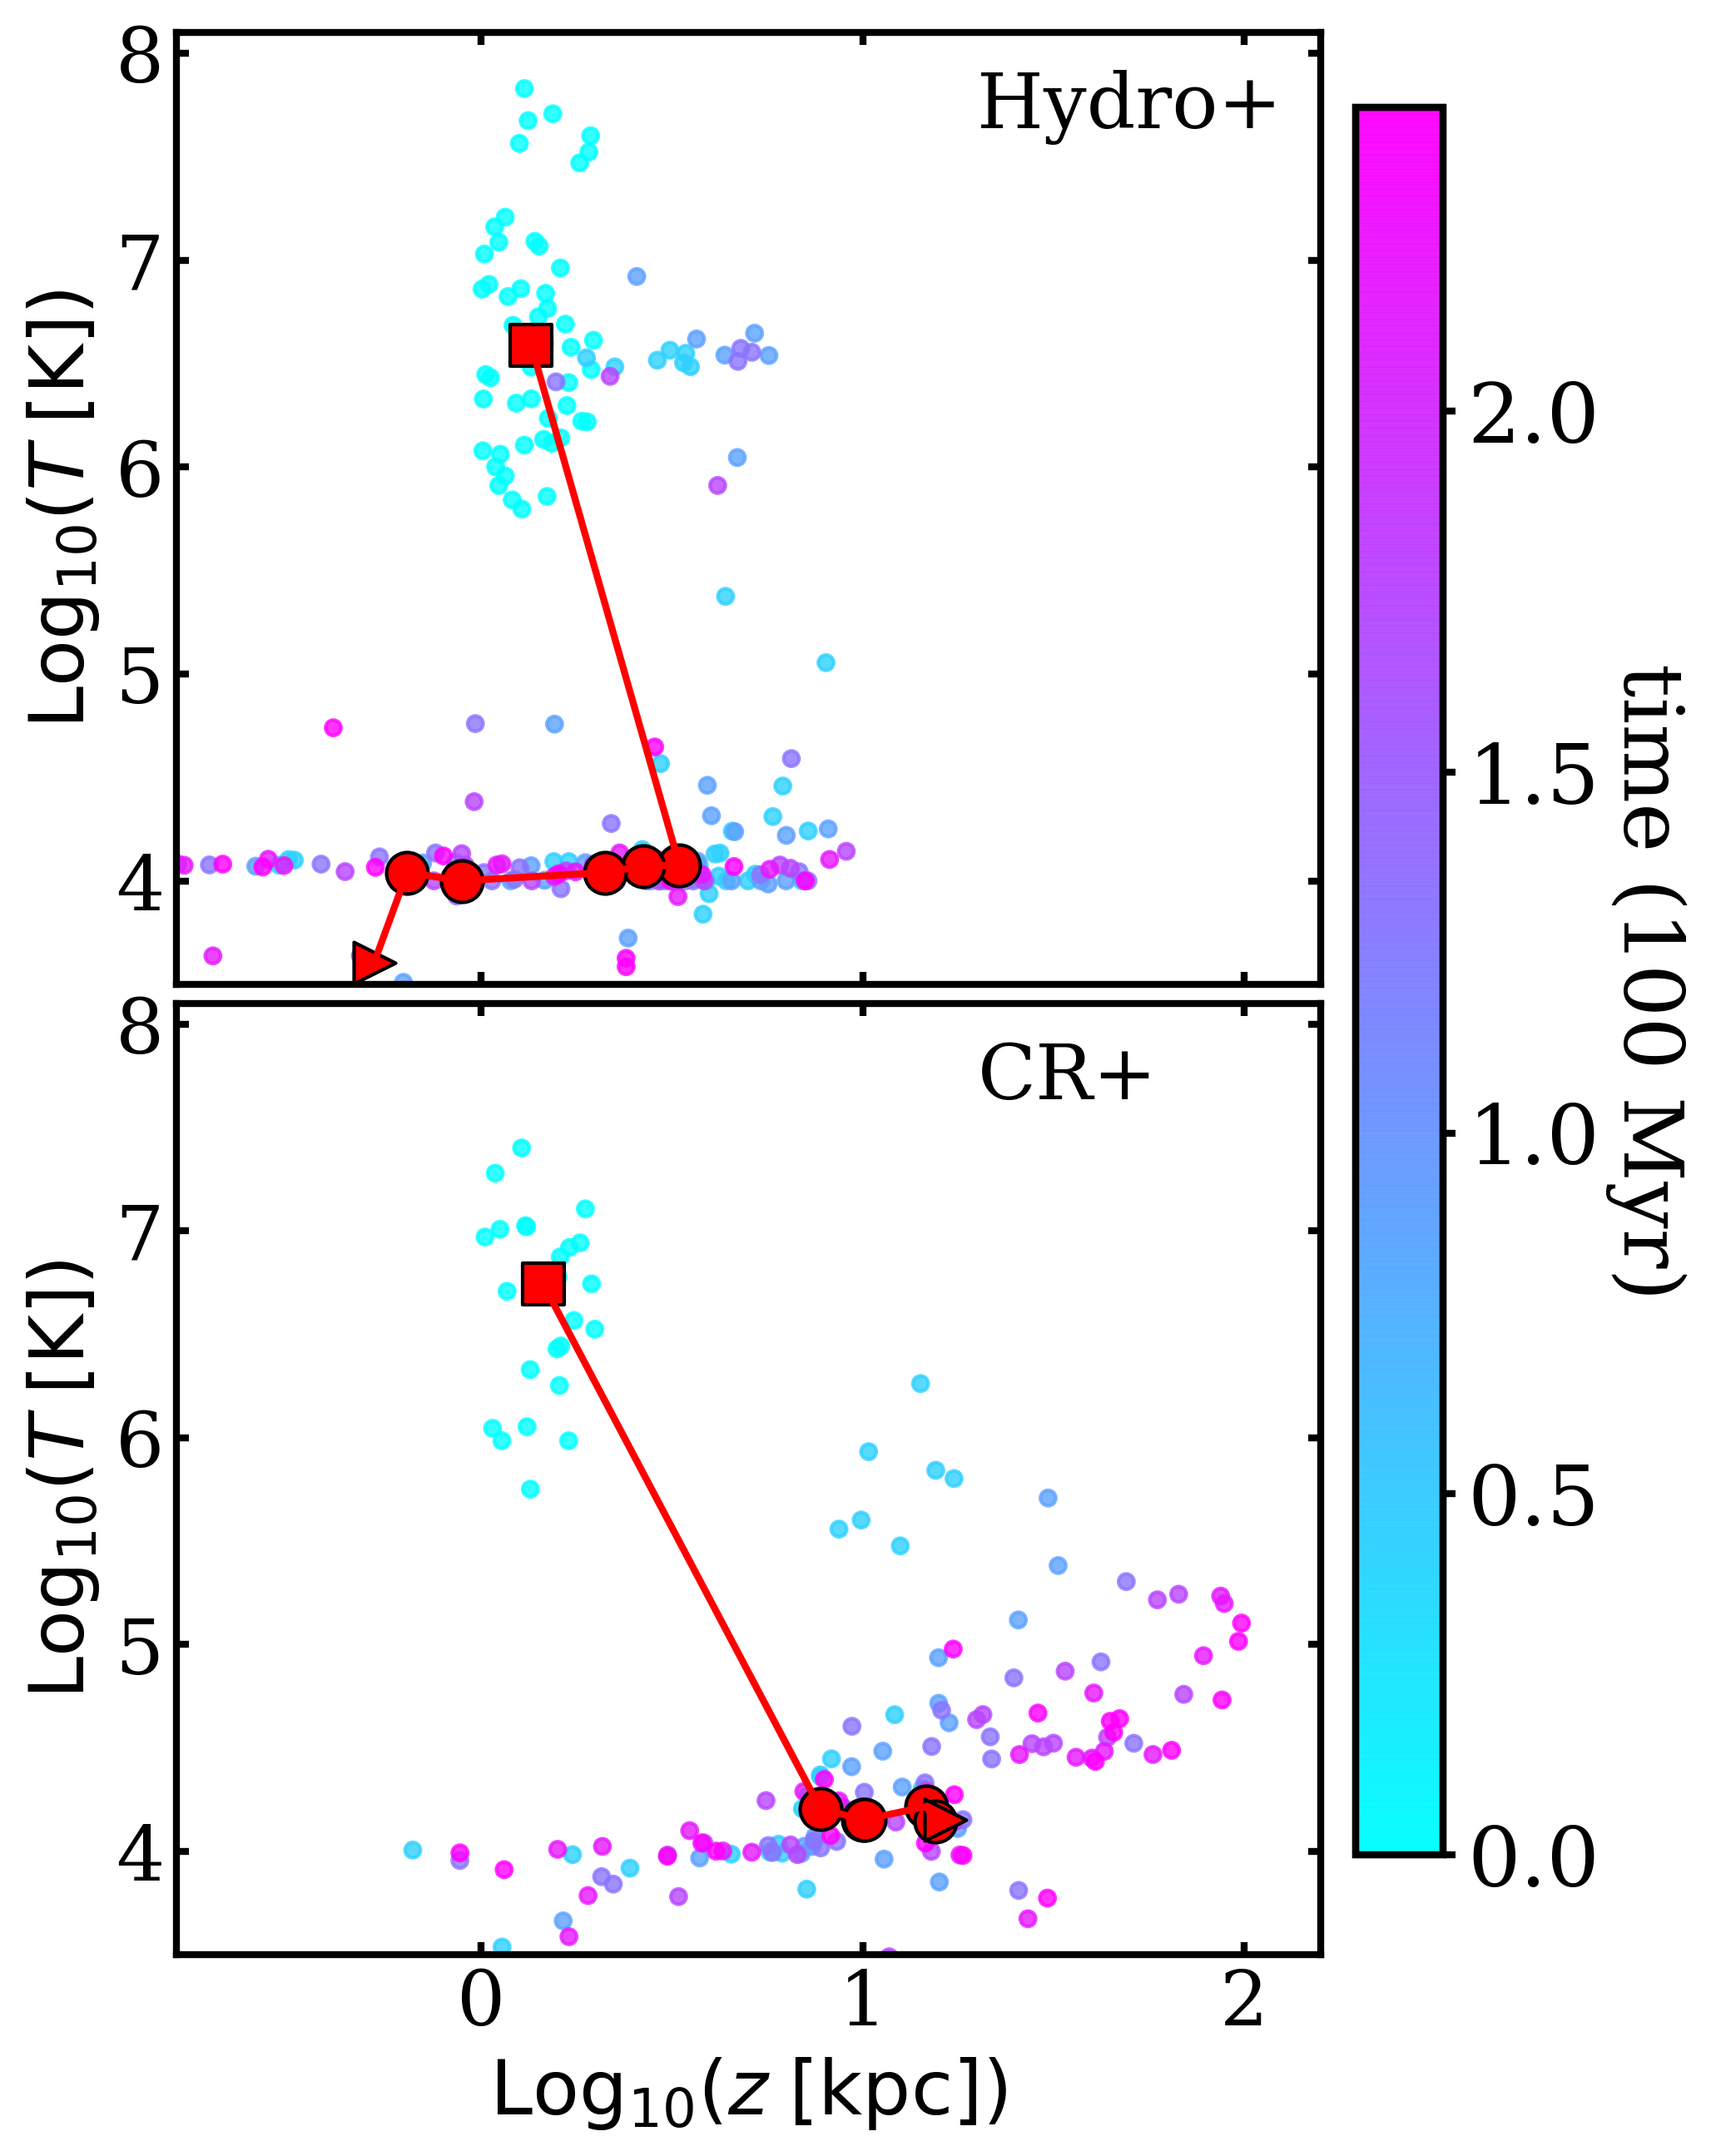
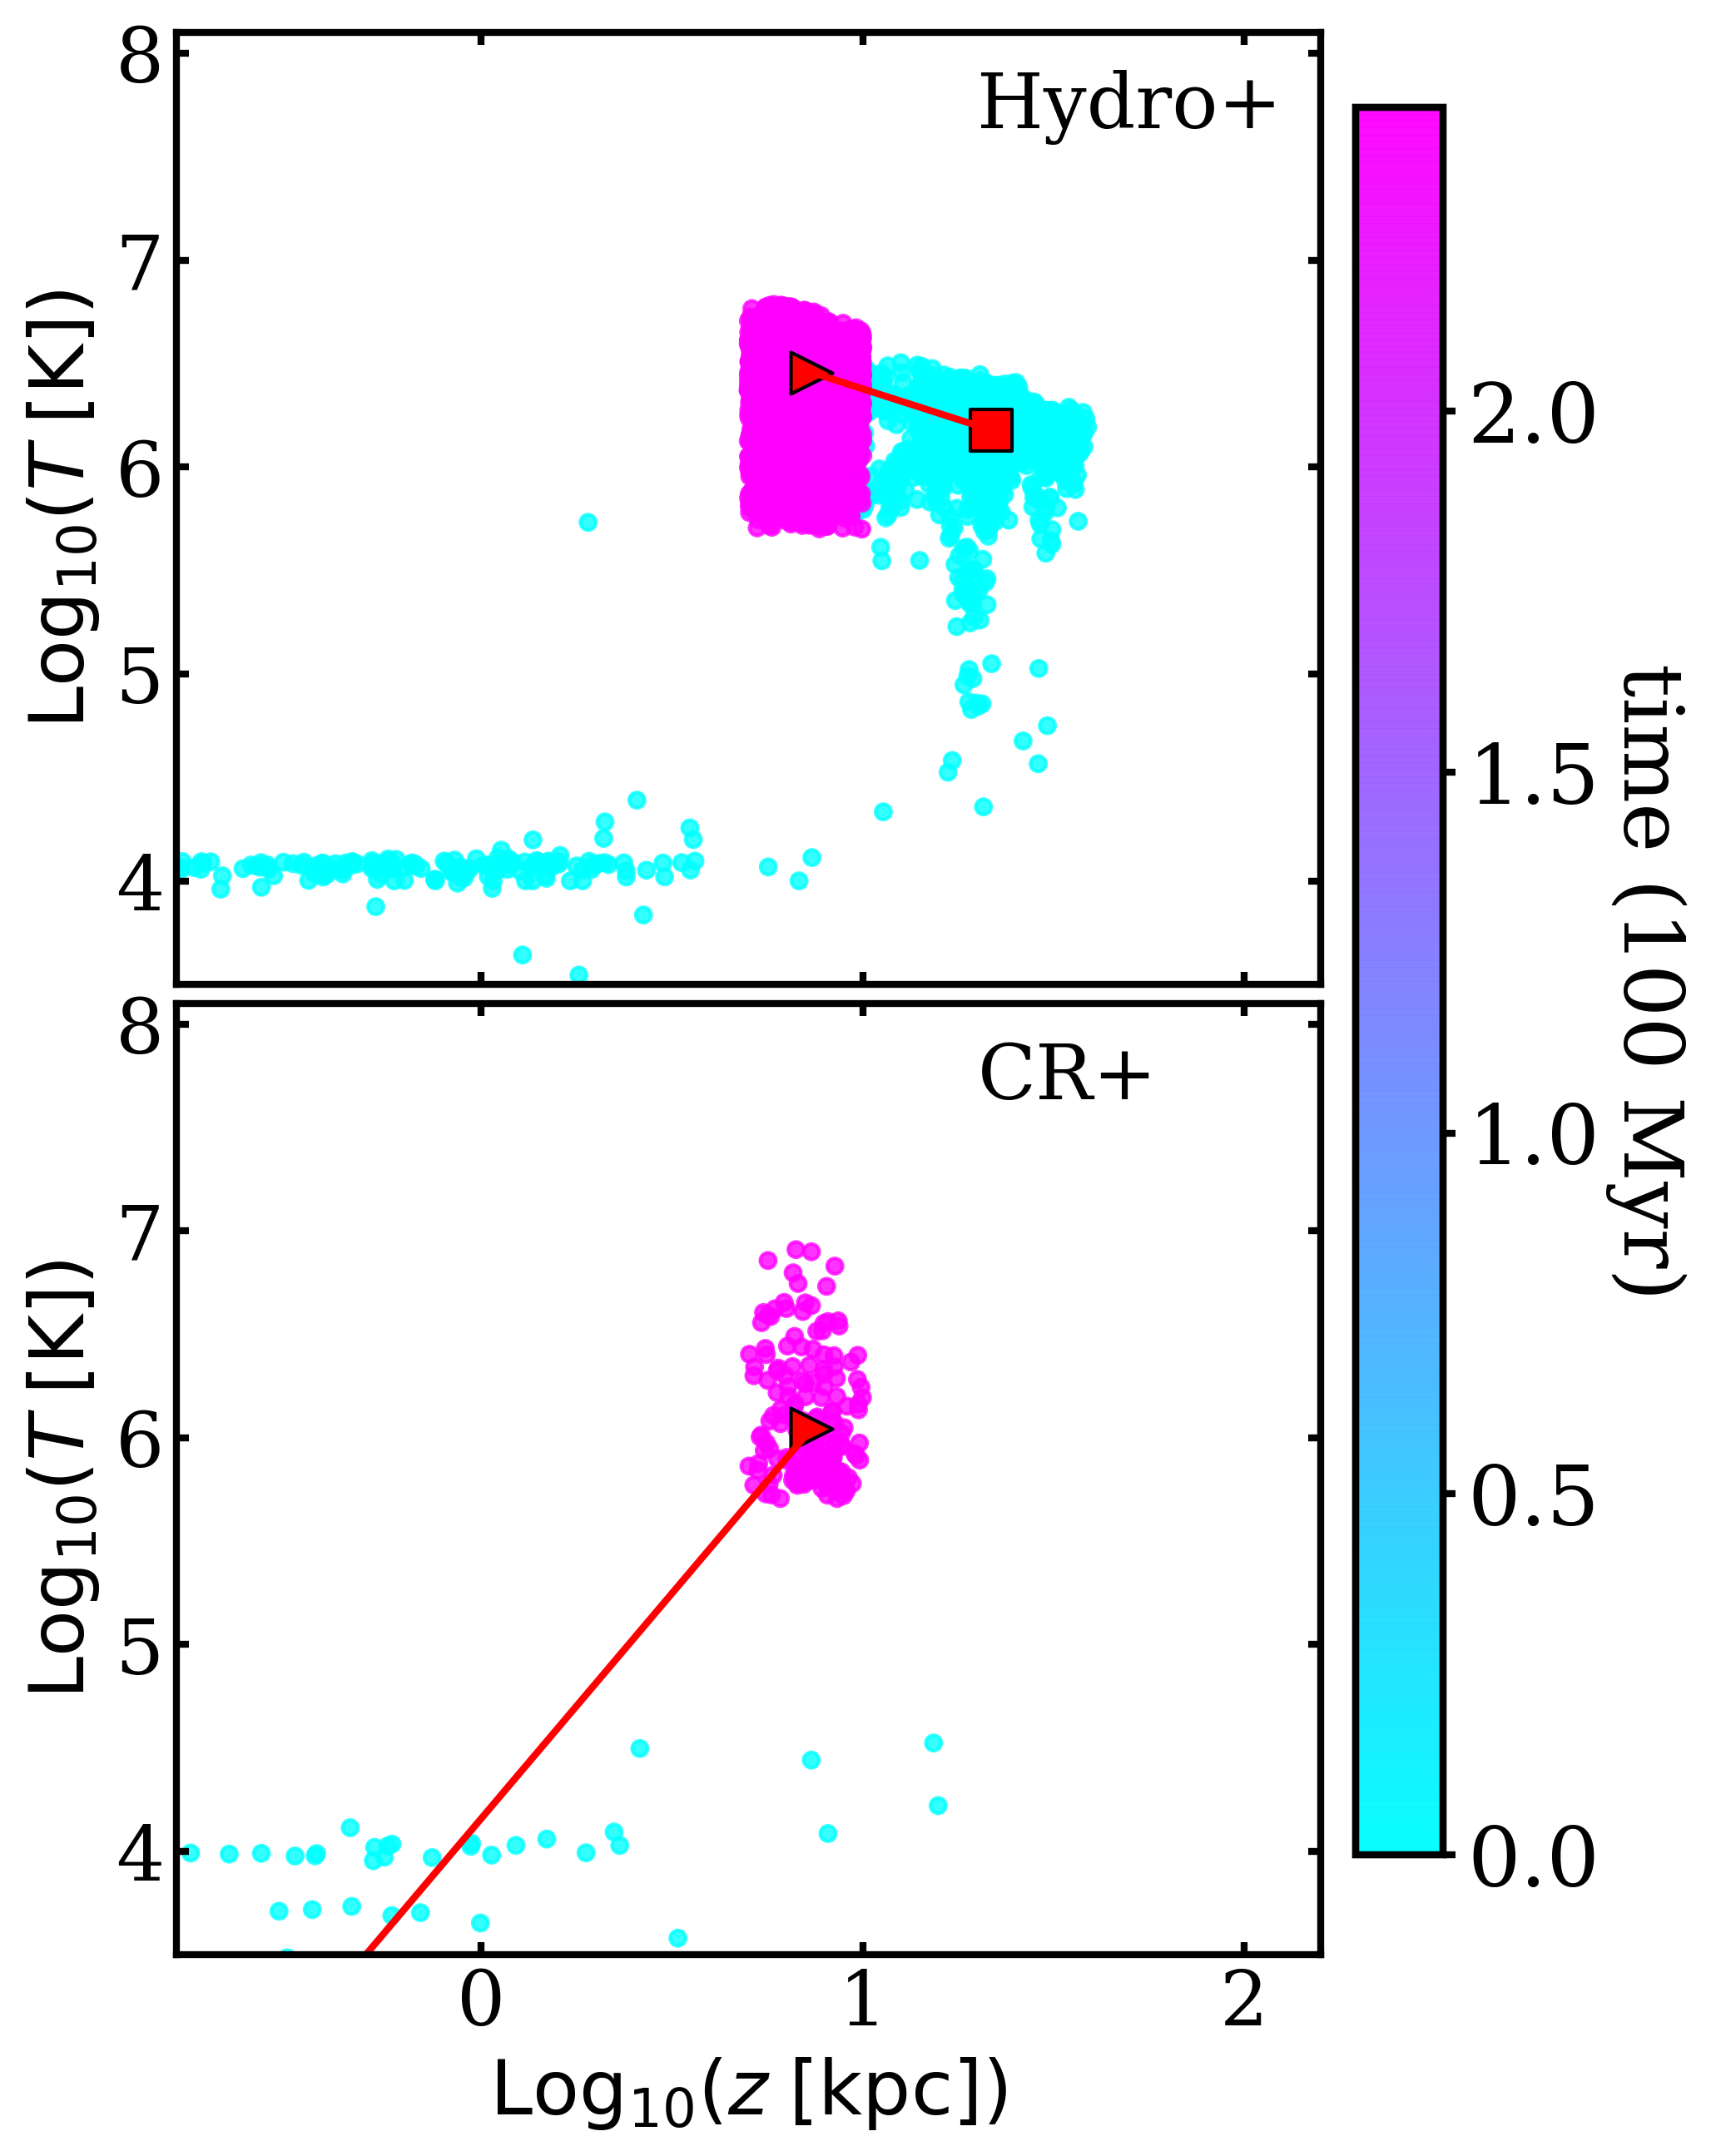
The previous results seem to suggest that the fast moving gas from super-bubbles is trapped near galactic disk in Hydro+. Here we verify this by tracking fast hot gas particles near galactic disks in Fig. 7.
In Hydro+, initially hot and fast gas particles cool down to through adiabatic and radiative cooling, and return back to the midplane within 100 Myr. Gas particles are not able to reach the CGM (), and end up in galactic fountains.
On the other hand, with the support of CRs, although hot fast outflows still cool down to , the bulk of this gas travels to a few tens of kpc above the disk and remain in the CGM for > 250 Myr. Thus, some of the warm and warm-hot gas in the CGM originates from hot galactic outflows.
We have checked that a fraction of the gas even leaves the virial radius, contributing to the winds on scales of hundreds of kpc described in Hopkins et al. (2021a). Since only a tiny amount falls back to , most of the hot fast outflows do not result in galactic fountains on short (< 250 Myr) time-scales.
The dramatic difference between the fates of hot superbubbles can be understood when special properties of CRs are taken into account. Chandran & Dennis (2006) showed that (see also Kempski & Quataert 2020) if (1) CR pressure is significant111111We have checked that the CR pressure is greater than the thermal pressure in most of the gas particles above the disk (with radii and heights ), except the hottest HIM and the most dense WIM., (2) CR diffusion is much faster than the dynamical time, and (3) CR pressure is decreasing outward, which is true if CRs are generated in the galaxy, then the gas is unstable for convection. Hence, the gas in the CR-dominated regime is rising through the “effective” buoyancy. On the other hand, the gas particles in Hydro+ cannot escape from the inner halo, partly because of the hot halo confinement. Hopkins et al. (2021a) concluded that isotropic winds cannot escape above 10 kpc in a hot halo (without CRs), since the SN-driven winds do not have enough energy to plow through it.
Even if we allow the winds to escape anisotropically (e.g. venting through holes in the gaseous halo), the hot halos can act against outflows by reducing their buoyancy, compared to warm halos (see similar phenomenon in Bower et al. 2017). Furthermore, we find that the fast hot outflowing gas particles cool too fast (in less than 40 Myr; Fig. 7), which also limits the upward buoyancy. This might explain why the mass-loading factors of the MW-mass galaxies vanish in the FIRE simulations without CRs at low redshift (Muratov et al., 2015, 2017; Stern et al., 2021)121212Even in Hydro+, occasionally intense star formation () and the subsequent feedback can drive gas to (Pandya et al., 2021), e.g. during mergers in m12f, but such events are rare in normal galaxies..
CR pressure gradient also reduces the required velocity to escape from the inner halo. Unlike gas thermal pressure which mostly follows gas particles, CRs can diffuse rapidly, so CR pressure gradient acts like a background to counter-balance a significant fraction of the gravitational force. Thus the gas particles at the midplane could reach with , a factor of two smaller than the required velocity without CRs.
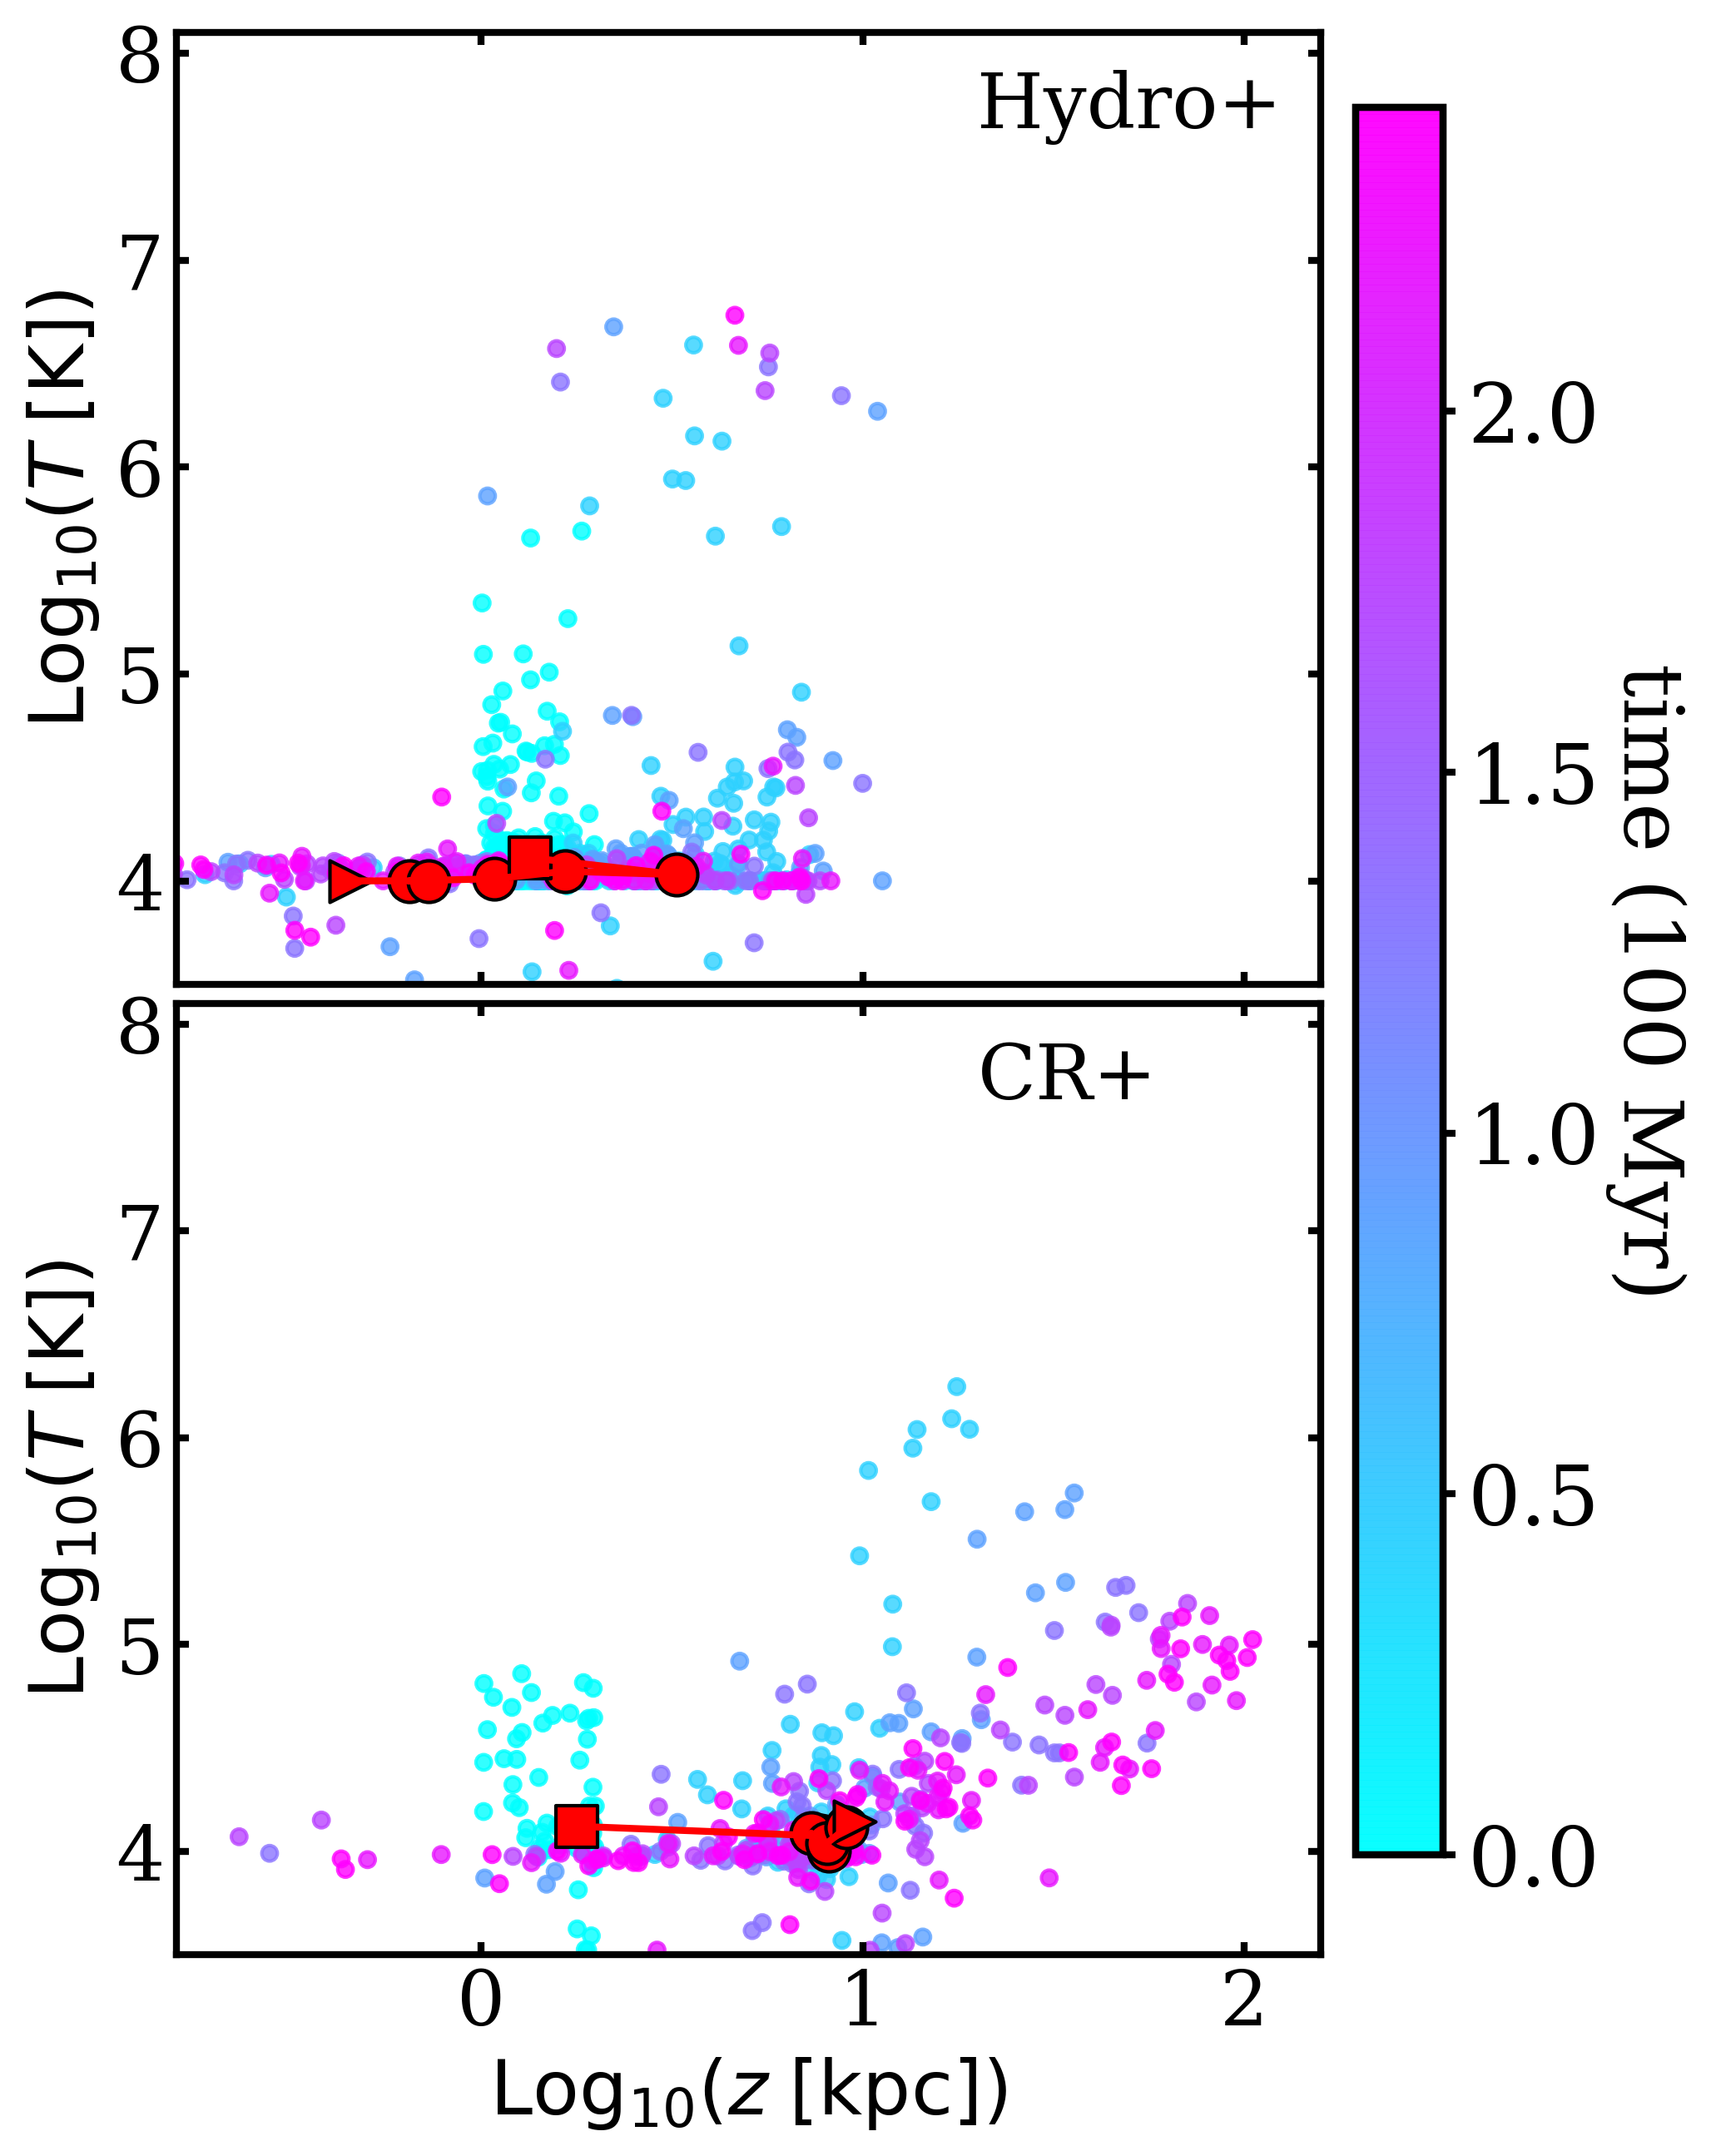
Finally, we investigate the fate of the fast warm gas outflow in Fig. 8, which shows that, in CR+, this gas is able to escape from the inner halo, some of which is able to reach 100 kpc, contributing to the warm CGM. In Hydro+, fast warm or hot gas particles are trapped within 10 kpc from the galaxies, so they constitute classical or warm galactic fountain flows (Houck & Bregman, 1990).
4.3 Distribution of multiphase gas
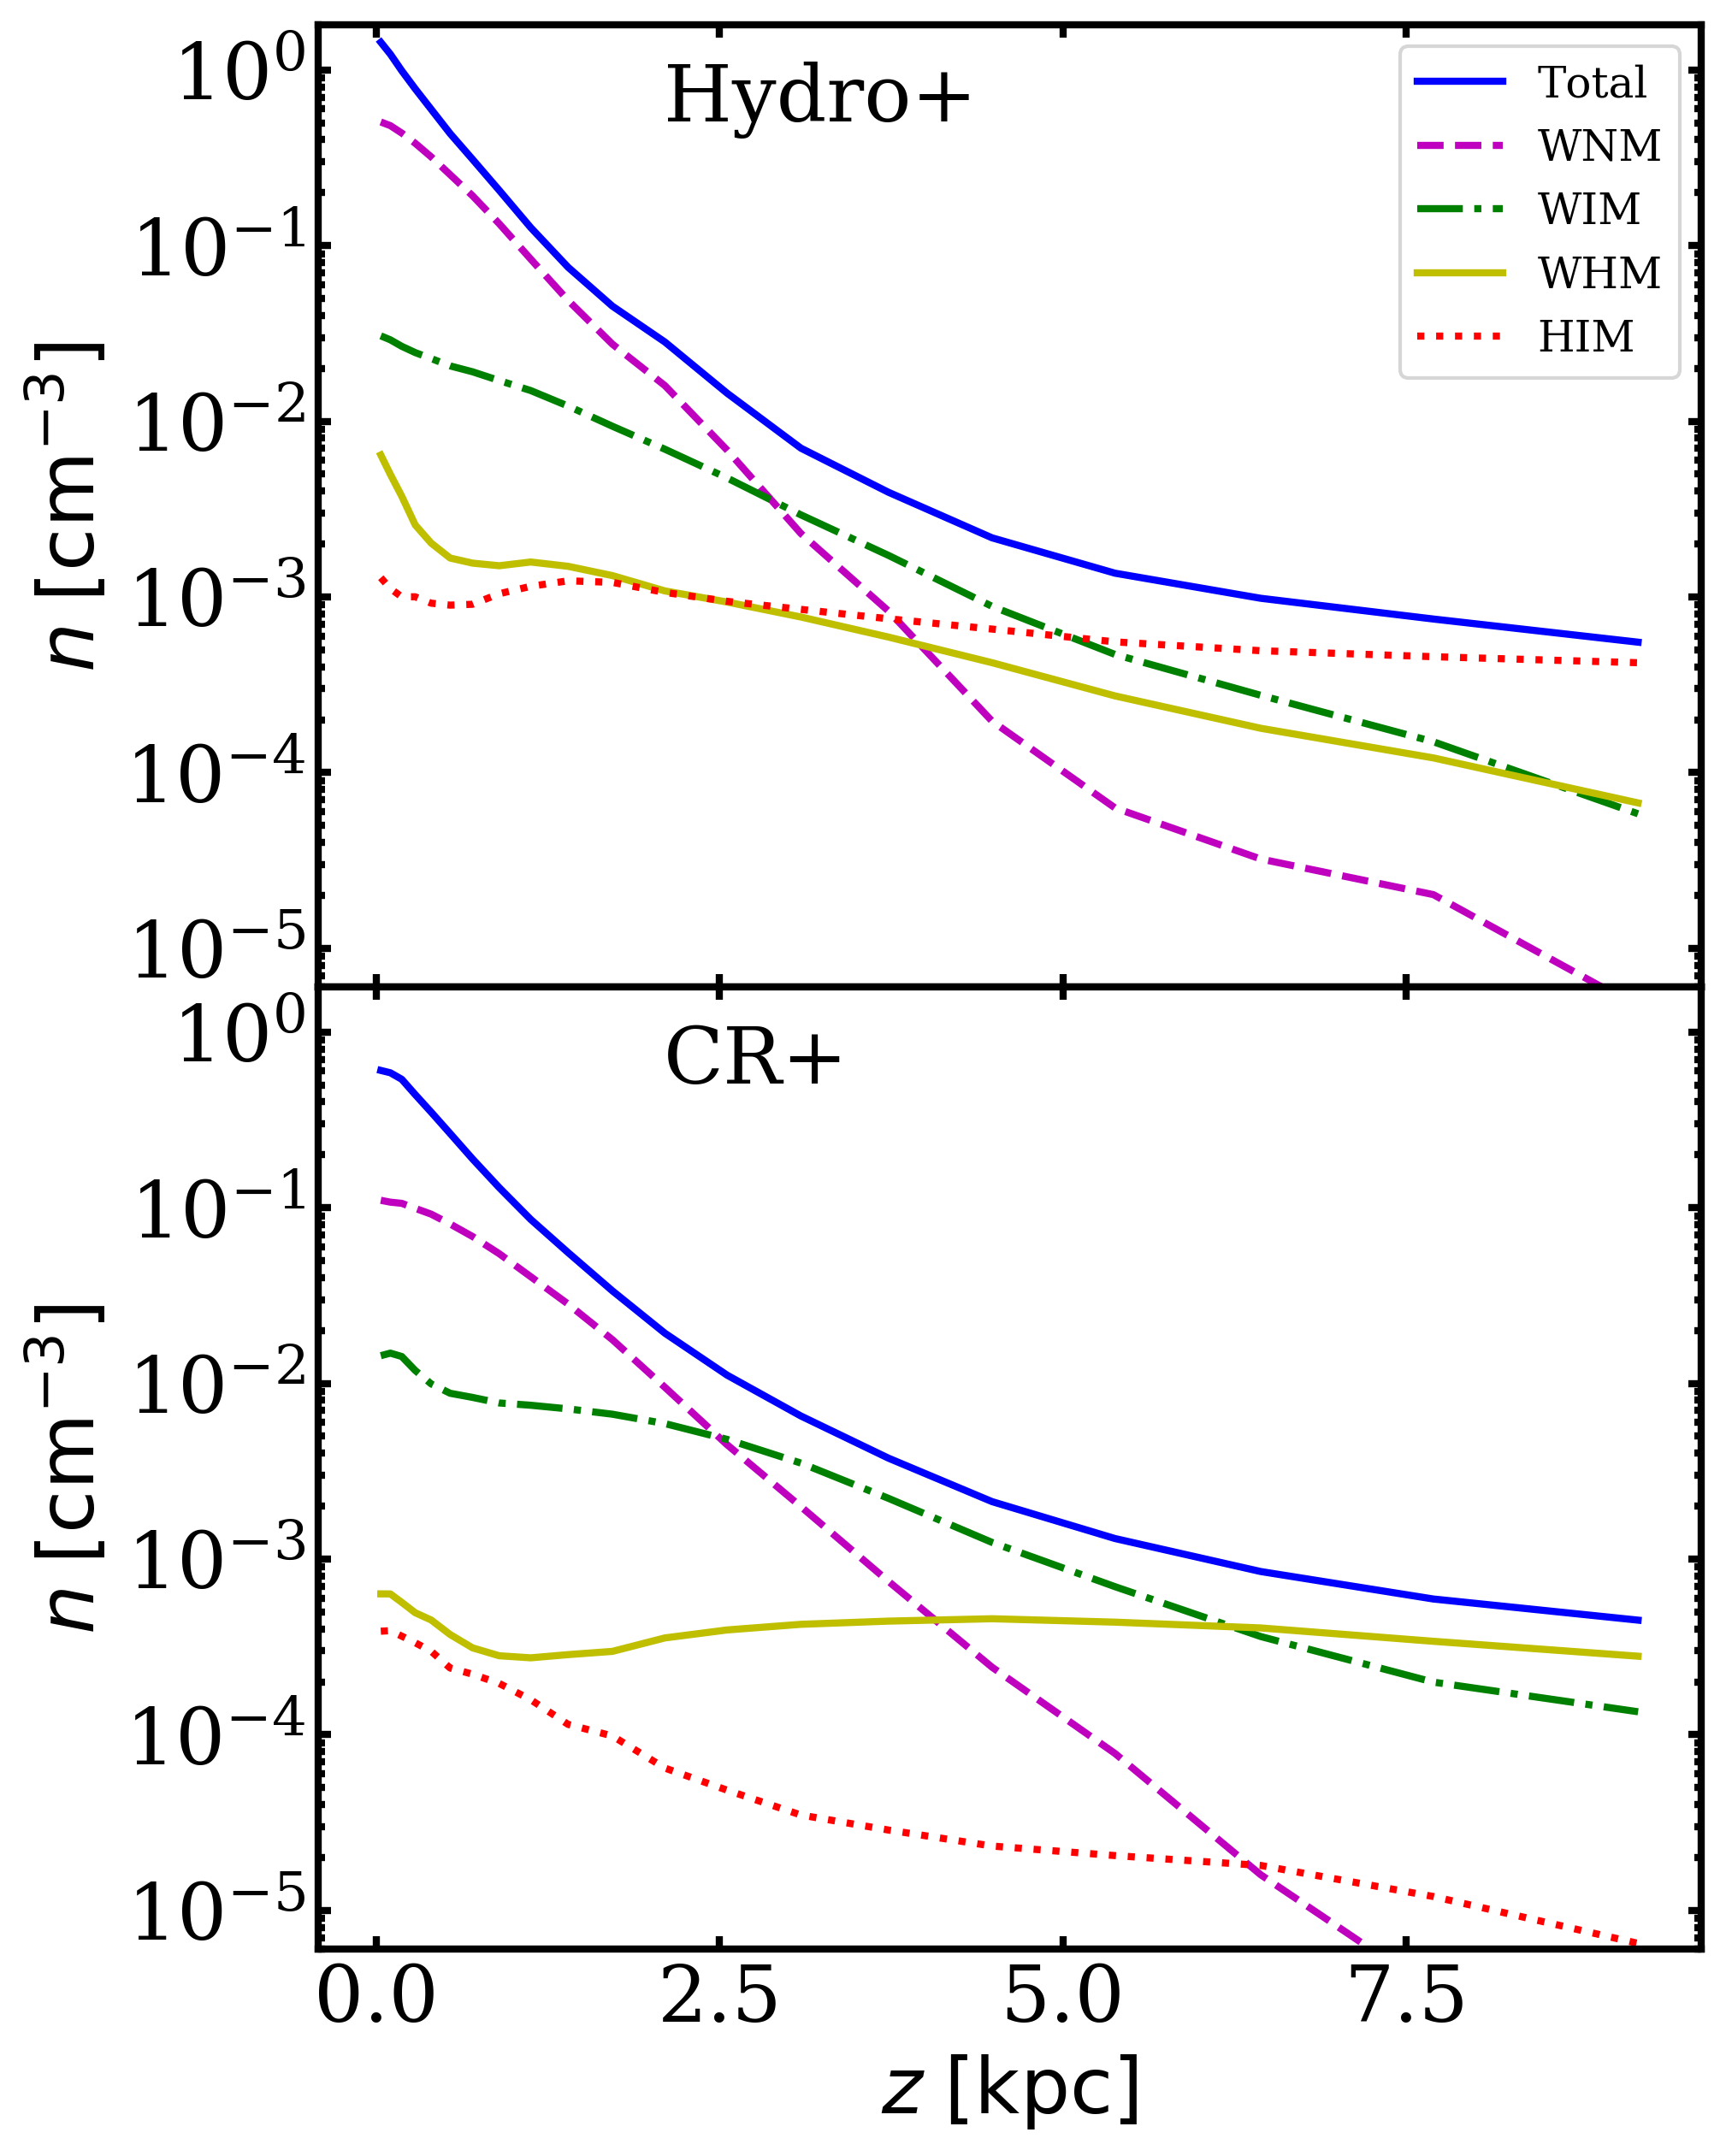
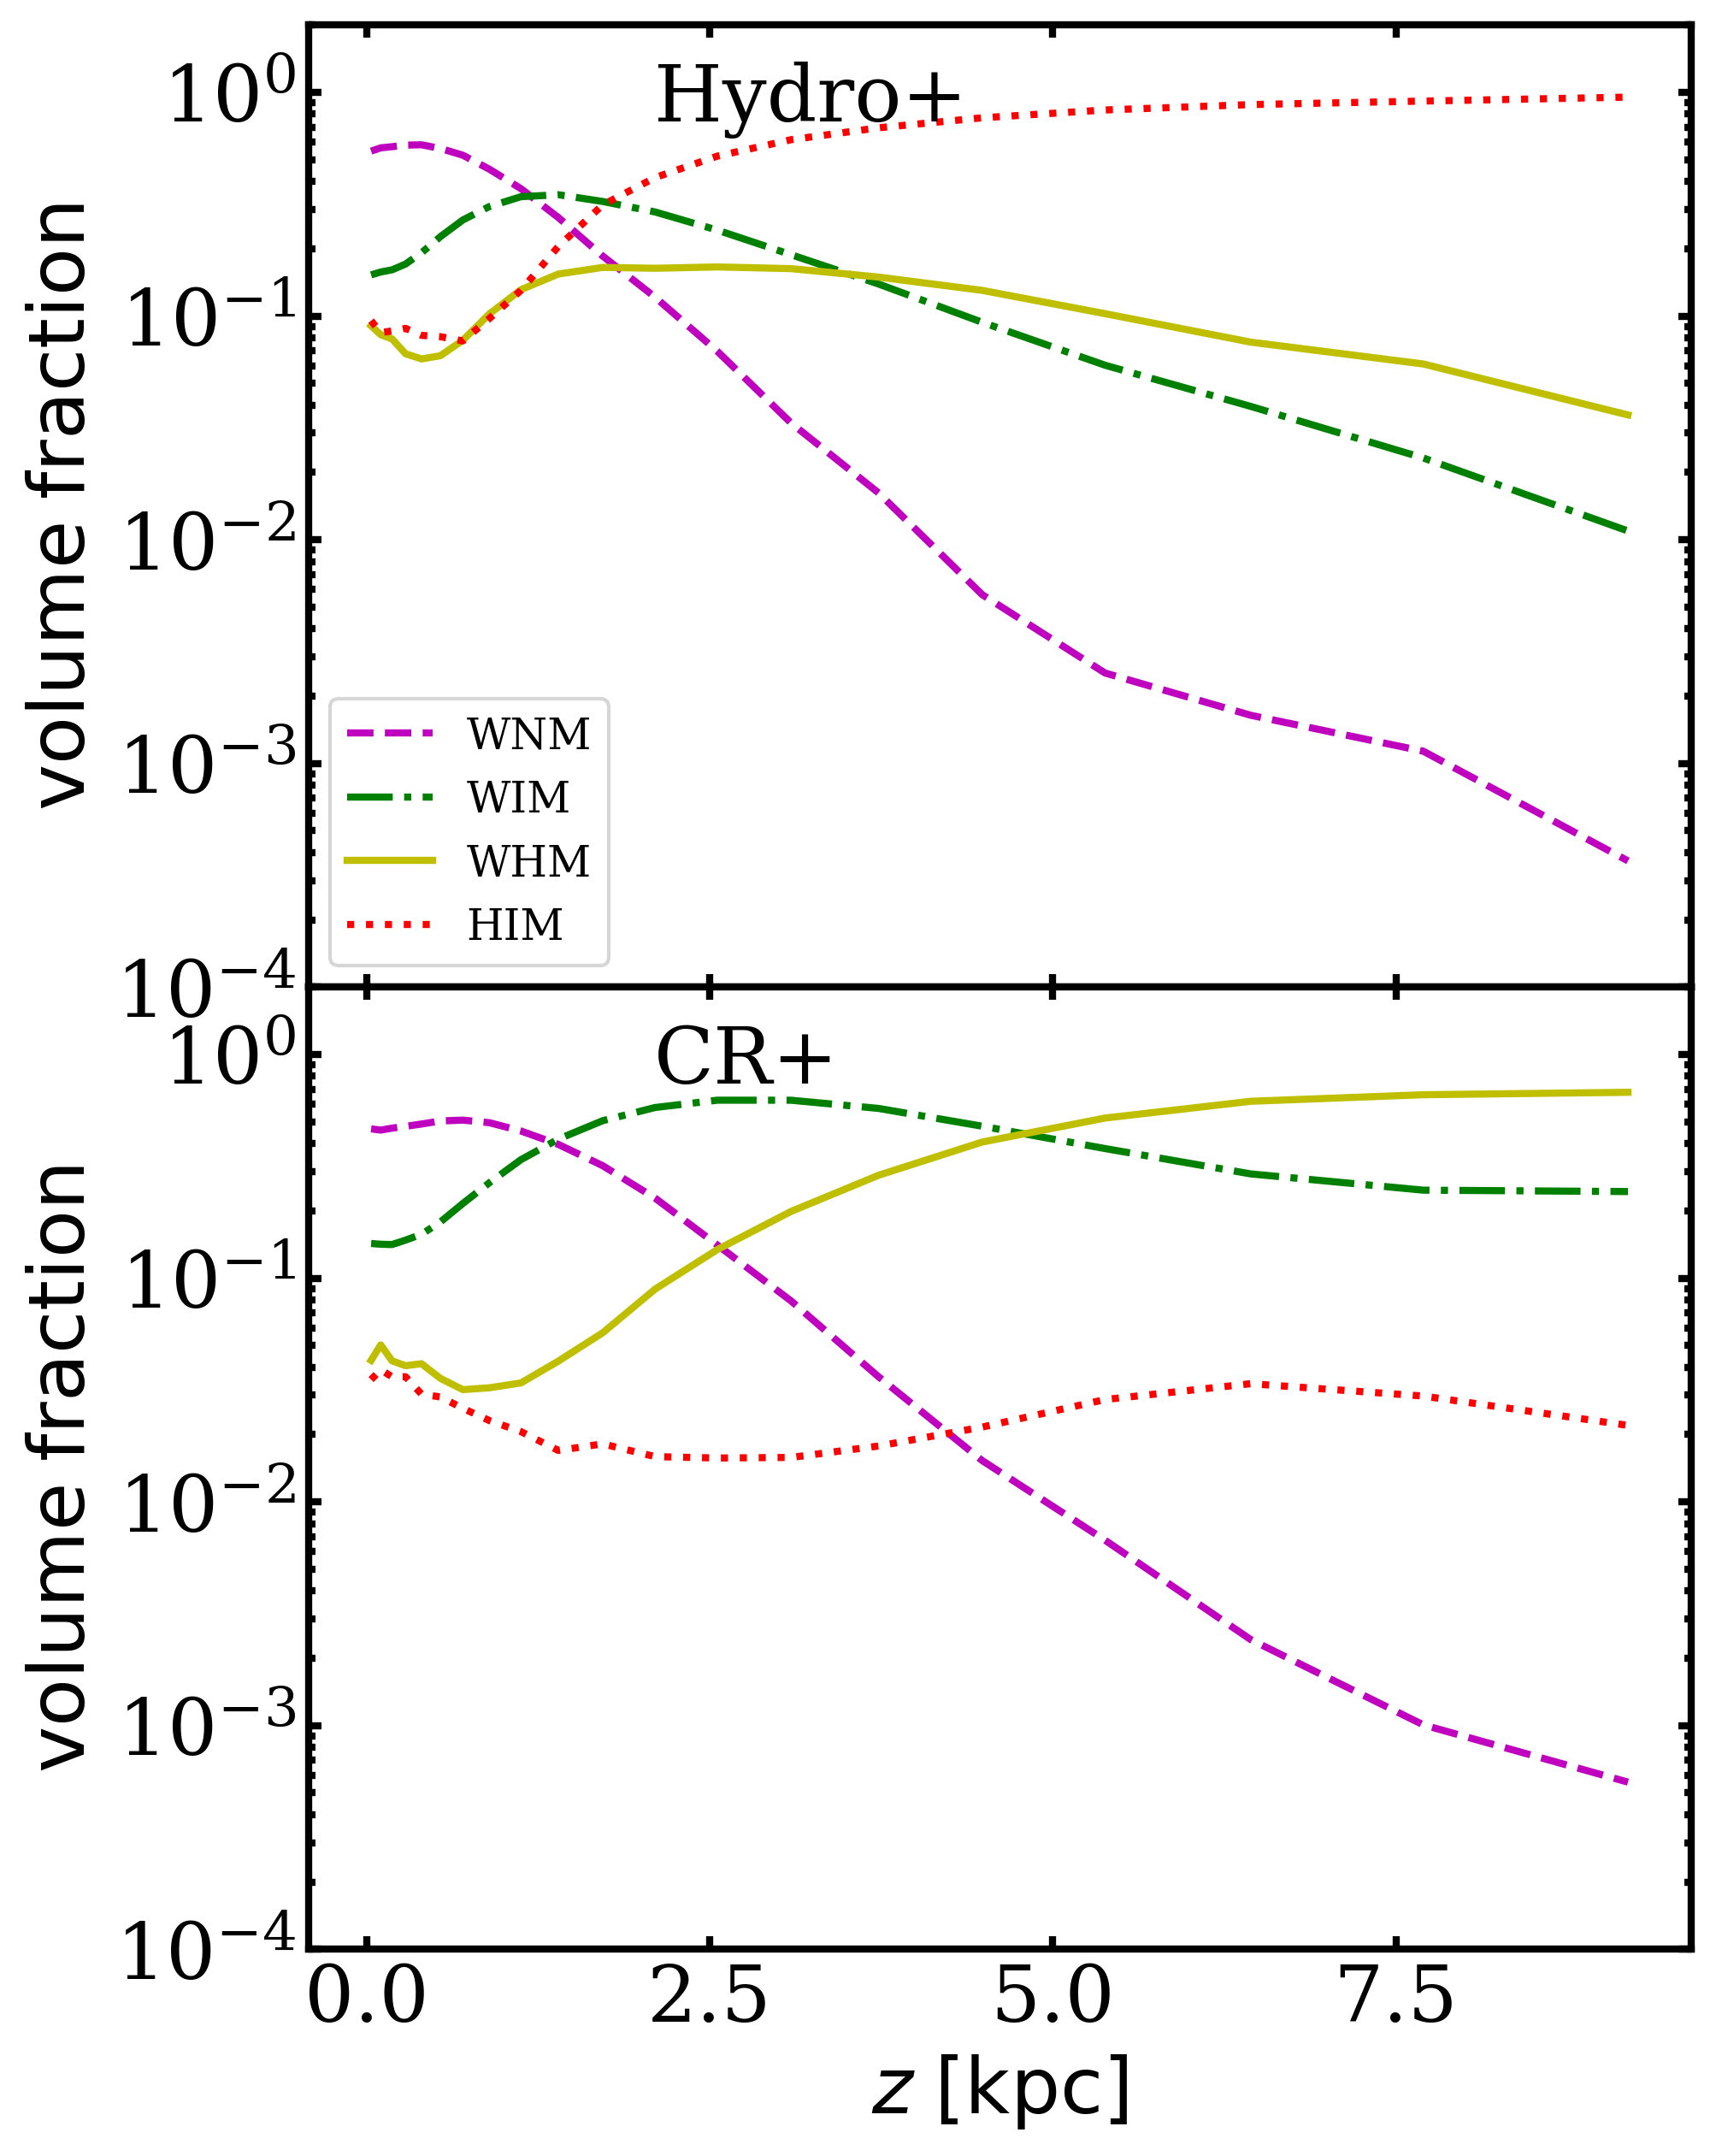
Fig. 9 shows the vertical distribution of volume-weighted gas density , defined as . CRs have a strong impact on the vertical distribution of gas phases. The total vertical gas density distribution in Hydro+ is slightly more concentrated than in CR+. Hydro+ has midplane density two to three times larger than CR+ (as expected from higher SFRs in Hydro+ simulations). Due to their similar total pressure support, CR+ and Hydro+ have similar gas densities at a large height. In CR+, the warm and warm-hot phase are more extended and contain more mass at large , while the hot gas is more concentrated.
There are two major reasons for the difference in the gas distribution. First, the gas density distribution, especially at a large height, depends on the influence of the CGM. As shown in Ji et al. (2020), the CGM is predominantly hot without CRs. The HIM density in Hydro+ has much flatter profile because the CGM close to the galaxy () is supplied by the hot gas that originates further out (and moves inward in a “cooling-flow” fashion) as we have verified in Fig. 10. In CR+, Ji et al. (2020) found the gas in the CGM is mostly around with little hot component, so the WHM gas distribution is extended, but the hot gas distribution is more concentrated.
Second, CRs can support the WHM though CR pressure and heat the gas through turbulent heating shown in Ji et al. (2021). CR hadronic and streaming heating can also provide extra heating to the WHM (Wiener et al., 2013; Vandenbroucke et al., 2018), although it is less important in our runs (Ji et al., 2020).
Consequently, the WHM is the most dominant gas phase at a large height in CR+, while the HIM is the most dominant at a large height in Hydro+ 131313Note that in ISM observations, the WHM with gas is included in the “coronal” or “hot” component (e.g. Jenkins 1978). We should account for this when comparing with the ISM studies, e.g. the volume filling in the ISM..
Finally, we also show the volume fractions of different gas phase in Fig. 9. In Hydro+, hot gas fills most of the volume, whereas in CR+, the WIM and WNM phases fill the largest volume fraction. CRs not only suppress the volume of hot gas, they also boosts the WIM and WHM volumes by supporting them in the disk-halo interface.
In Appendix A, we find that the CR diffusion coefficient has large effect on the vertical gas distribution. A lower CR diffusion coefficient (CR+3e28) leads to a lower CR pressure away from the disk and less extended CR halo, Consequently, the kinetic pressure plays a bigger role. While in this model, CRs still supports a lot of warm gas a few kpc away from the disk, hot gas is more extended than that in the default CR+. However, this low diffusion coefficient is disfavored by the observed -ray emission from nearby galaxies (Chan et al., 2019; Hopkins et al., 2020b).
4.4 The Effects of Cosmic Rays on Midplane Velocity Dispersion
In §2.2.2, we found that kinetic pressure from velocity dispersion dominates the midplane pressure. Although CR pressure is not important at the mid-plane owing to its large scale height (Fig. 2), the question remains if CRs can affect the velocity dispersion in the midplane indirectly (e.g. by suppressing or enabling winds or inflows).
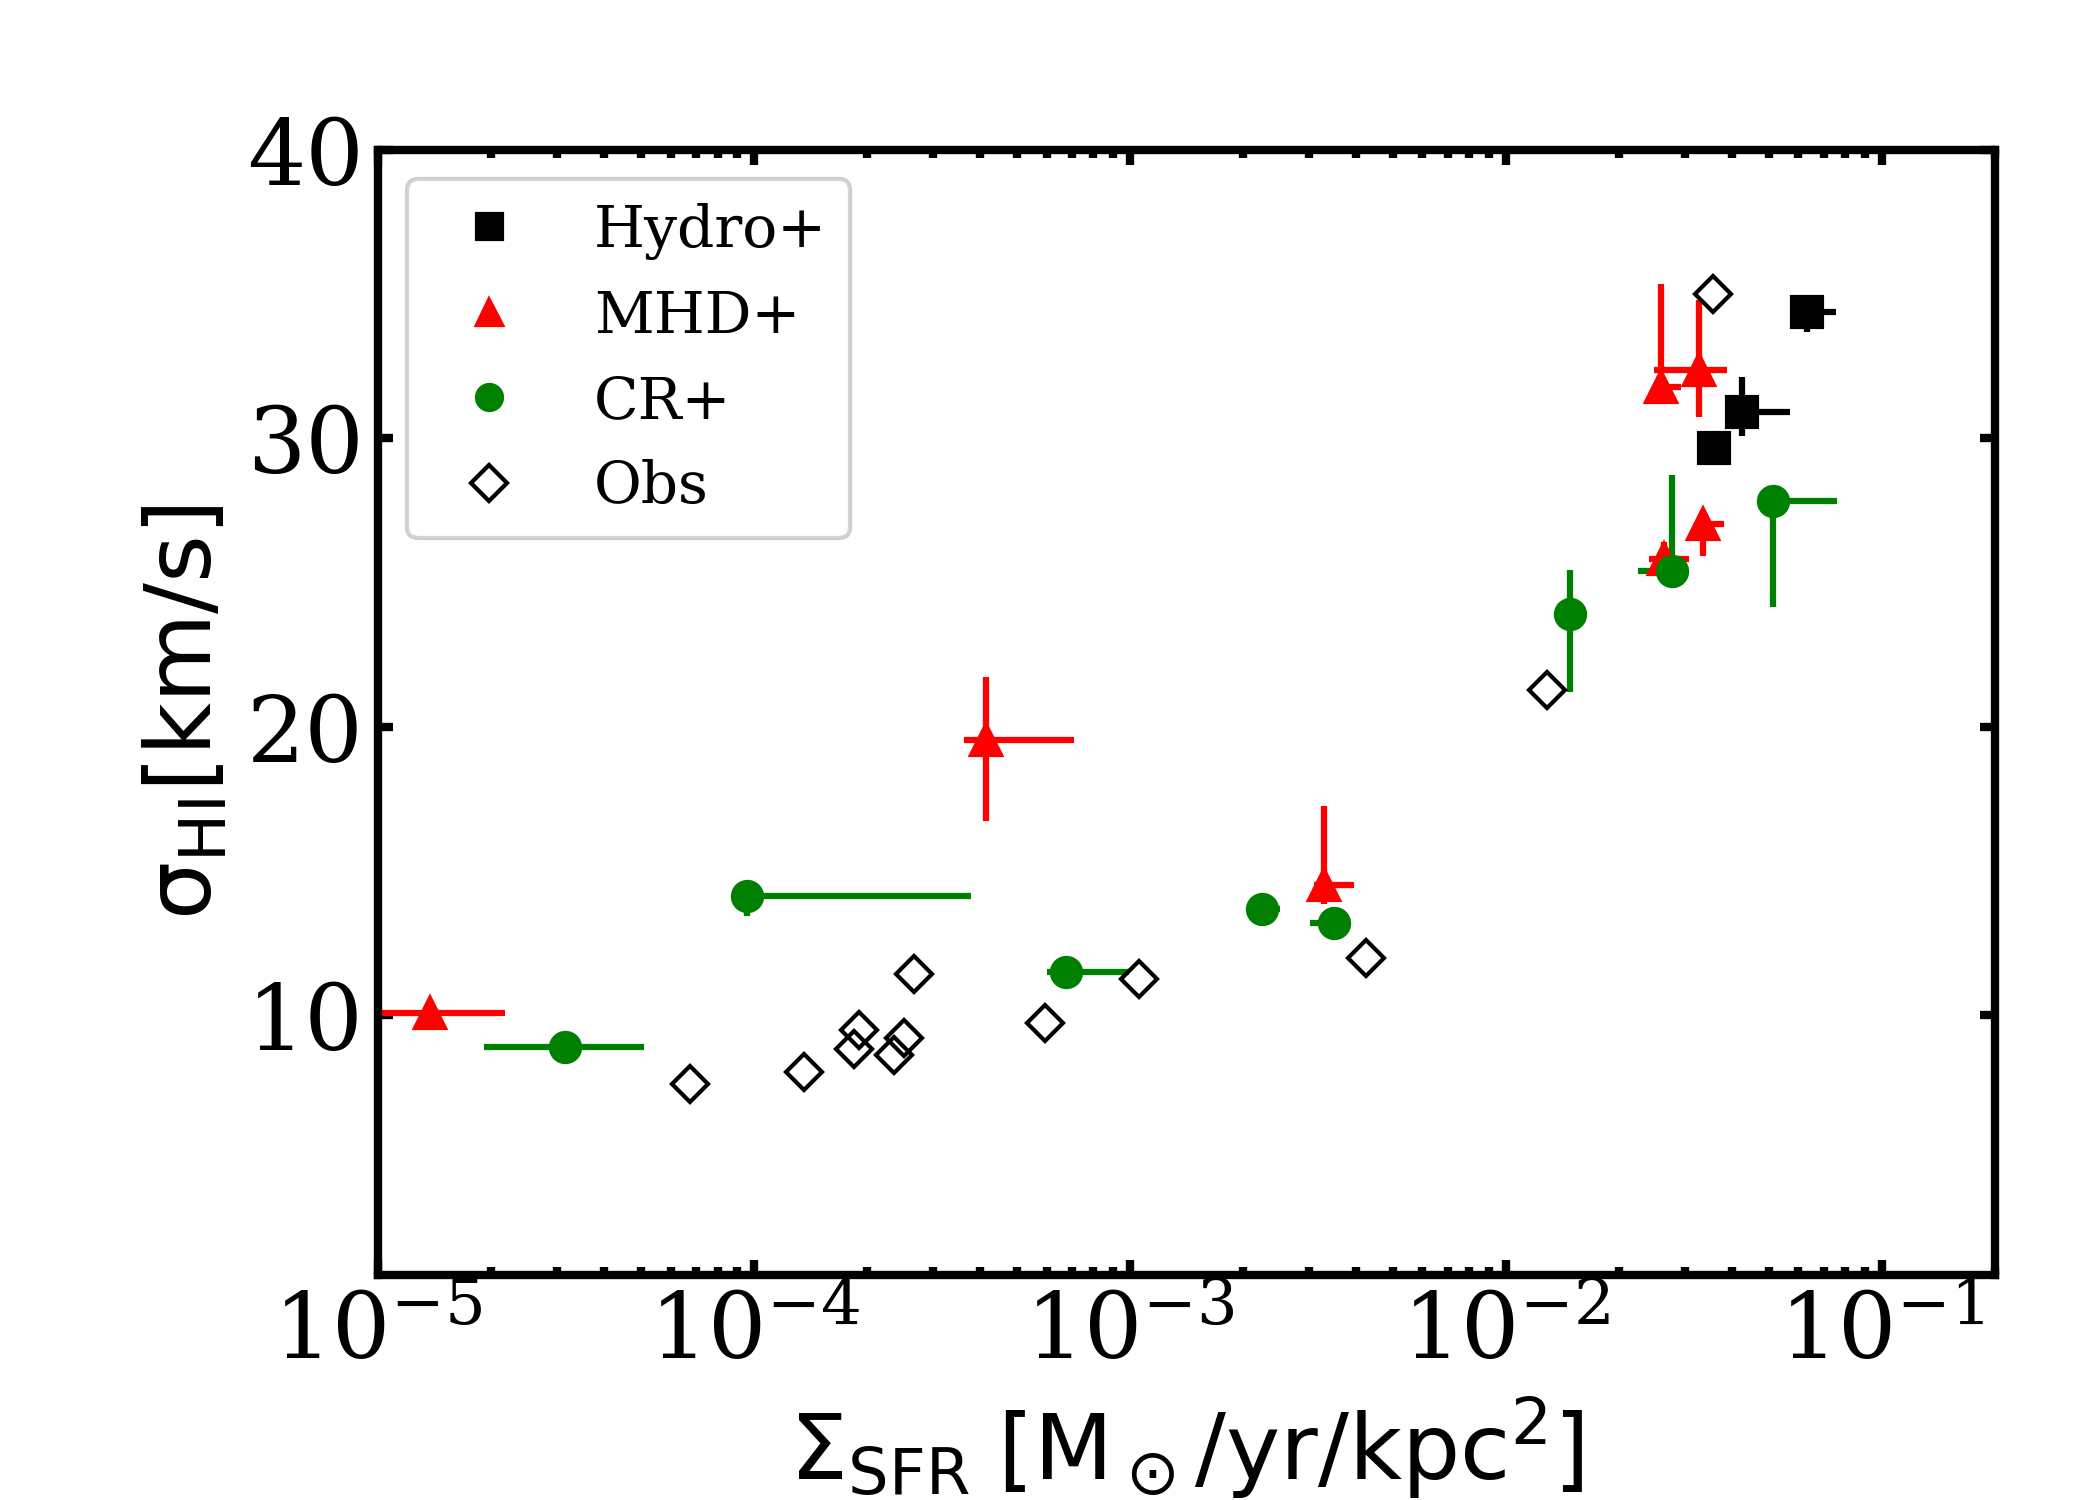
Fig. 11 addresses this question by comparing the total velocity dispersion (kinetic plus thermal) of the HI gas, 141414We estimate HI by subtracting molecular hydrogen fraction, , calculated using the Krumholz & Gnedin (2011) approximation based on local metallicity and gas column density. We applied the Sobolev approximation and take the gas kernel length as the local density scale height. Finally, we measure the mass-weighted velocity dispersion (in vertical direction) within +/-250pc of the disk plane., as a function of SFR per unit area in simulations and observations151515For a pixel by pixel comparison of the FIRE simulation (without CRs) with spectrally-resolved observations of the ISM gas velocity dispersion, see Orr et al. (2020).. In order to compare with the observations at lower SFRs, we have also included additional runs from Hopkins et al. (2020b), expanding our sample to include m11g, m11d, m11h, m11b, m11f, m12i, m12f, and m12b simulations.
The observational data is obtained from Dib et al. (2006) and references therein161616Note that the rightmost observation point is from the inner region of NGC 2915, while all other points are averaged for whole galaxies.. We find a good agreement between simulations and observations. Velocity dispersion is constant at low SFRs (usually dwarf galaxies), because most of the velocity dispersion is from thermal broadening of HI gas. This is not affected by CR feedback, as CR pressure is not significant in the ISM of dwarf galaxies due to the rapid escape of CRs at low density (Lopez et al., 2018).
In galaxy runs, mid-plane turbulence increases with with a steepening at high . The CR+ runs have a lower and along the observed relation, confirming that CRs reduce velocity dispersion indirectly through suppressing inflow rates, SFRs, and/or feedback.
5 Discussion
5.1 Comparison with other theoretical studies
5.1.1 Dynamical balance
We showed that with or without CRs, the bulk flow pressure is not negligible a few kpc above the galactic disk (Figs. 2 and 3), so hydrostatic balance (balance without bulk flow pressure) is violated. This is in disagreement with the early theoretical studies, e.g. Boulares & Cox (1990) and Ferrière (1998). Our finding is more inline with the recent theoretical studies by Boettcher et al. (2016, 2019) which found that hydrostatic balance does not hold in some spiral galaxies.
In our simulations, dynamical balance (that includes also the bulk flow pressure) is approximately satisfied: for , the deviations are typically less than 10% (see also Gurvich et al. 2020). These findings are in qualitative agreement with previous vertical balance studies using a variety of codes and assumptions while neglecting CRs, e.g. Hill et al. (2012), Kim & Ostriker (2015), Vijayan et al. (2020), Benincasa et al. (2016), and Gurvich et al. (2020). Similar to our findings, these studies found that kinetic pressure dominates near the mid-plane while thermal (plus kinetic) pressure dominates a few kpc above the midplane. We also agree with Hill et al. (2012), Kim & Ostriker (2015), and Vijayan et al. (2020) that the magnetic tension is not important in supporting the gas above the disk.
When CRs are included, we found that CR pressure dominates well above disks while kinetic pressure dominates around the mid-plane. This is in contrast to Girichidis et al. (2018) who found CR pressure is most important even at the midplane, likely because of their weaker thermal feedback and slower CR diffusion (see the discussion in Kim & Ostriker 2018).
By post-processing high resolution ISM simulations with CRs, Armillotta et al. (2022) also found that the CR pressure gradient is dominant for , while the CR pressure gradient is insignificant for . This agrees qualitatively with our findings – CRs are important in supporting gas and driving winds in the disk-halo interface ().
5.1.2 Vertical gas structure and flows
Our Hydro+ and CR+ runs have extended gas distribution; e.g. warm gas with scale heights kpc, in agreement with the observation. This differs from the results from the local or stratified box simulations with small vertical extents (Wood et al., 2010; Kim & Ostriker, 2015).
There are several reasons for the difference. First and most importantly, a simulation domain with a sufficient height () is required to capture galactic fountain flows and allow extended vertical gas distributions (Hill et al., 2012; Vijayan et al., 2020). Second, our simulations are cosmological, so they include the CGM, which can increase the scale height (especially for the hot gas; see Fig. 10). Finally, local or vertical stratified boxes cannot capture the correct outflow boundary conditions (Martizzi et al., 2016).
In our simulations, CR pressure boosts gas scale height. But the boost is modest compared to Girichidis et al. (2016), who found that CR feedback extends gas scale height by more than an order of magnitude, likely because their thermal feedback is too weak (see the previous section) and because they assume a much lower diffusion coefficient that traps most of the CR energy density in the disk.
Our simulations without CRs (Hydro+) are consistent with other studies finding that the warm-hot () gas is not substantial (owing to thermal instability) and the hot gas dominates at a large height (Hill et al., 2012; Vijayan et al., 2020). In contrast, CR feedback can increase the amount of warm-hot gas, and reduce the amount hot gas away from the galaxies, as also noted previously in, e.g., Booth et al. (2013) and Salem et al. (2016).
CR-driven warm galactic winds have already been found in several other studies (e.g. Booth et al. 2013; Girichidis et al. 2018). Our study differs from them by focusing on how thermal and CR pressures can drive winds in coordination in cosmological galaxy formation simulations. Our simulations include both warm CR-driven and hot thermal/super-bubble driven winds.
Hybrid thermal-CR winds were studied in previous 1D analytic, idealized, models (Breitschwerdt et al., 1991; Breitschwerdt & Schmutzler, 1999; Everett et al., 2008). However our work is unique in the following aspects:
First, our CR propagation models are distinct from previous 1D models. We consider streaming and constant diffusion coefficient everywhere calibrated to match the -ray emission, whereas most 1D models assume Alfvénic streaming above galactic disks. However, regardless of the propagation models, both our simulations and these 1D models predict CRs can help drive winds in MW-mass galaxies.
Second, we are able to simulate and quantify the combination of hot super-bubble-driven winds and CR-driven warm winds in galaxies in 3D cosmological settings. Cosmological setting and more complete physics enable us to also show how CR feedback can suppress galactic fountains or, at least, significantly increase their return periods by preventing the cooled winds from falling back (§4.2.2).
5.2 Comparison with observations
5.2.1 Hot ionized gas
Hot () gaseous halos have been detected in the MW and many external spiral galaxies from their soft X-ray emission (Snowden et al., 1998; Henley & Shelton, 2013) and absorption of high ions (Gupta et al., 2012). Recently, Kaaret et al. (2020) observed the soft X ray emission in the MW and inferred that the midplane hot gas density around solar circle is around and its scale height is around 2 kpc (see also Hagihara et al. 2010). This scale height is slightly larger than that in our CR+ runs, but smaller than our Hydro+ runs (Fig. 9).
Hot halos can be extended to 50-80 kpc around some spiral galaxies, e.g. Anderson et al. (2016); Dai et al. (2012), which could be at odds with our concentrated hot gas halo in CR+. However, to the best of our knowledge, these extended hot halos are detected only around galaxies much more massive than our simulated galaxies, objects with the AGNs, or in starbursts (Wang et al., 2001; Fraternali et al., 2002; Das et al., 2020), which are not included in our simulation sample.
For less massive spiral galaxies, with masses closer to our simulated ones, soft X-ray emitting halos halos are not observed to tens of kpc (Tyler et al., 2004; Tüllmann et al., 2006), although the low density hot gas tens of kpc away from these galaxies is likely below current X-ray observational limits.
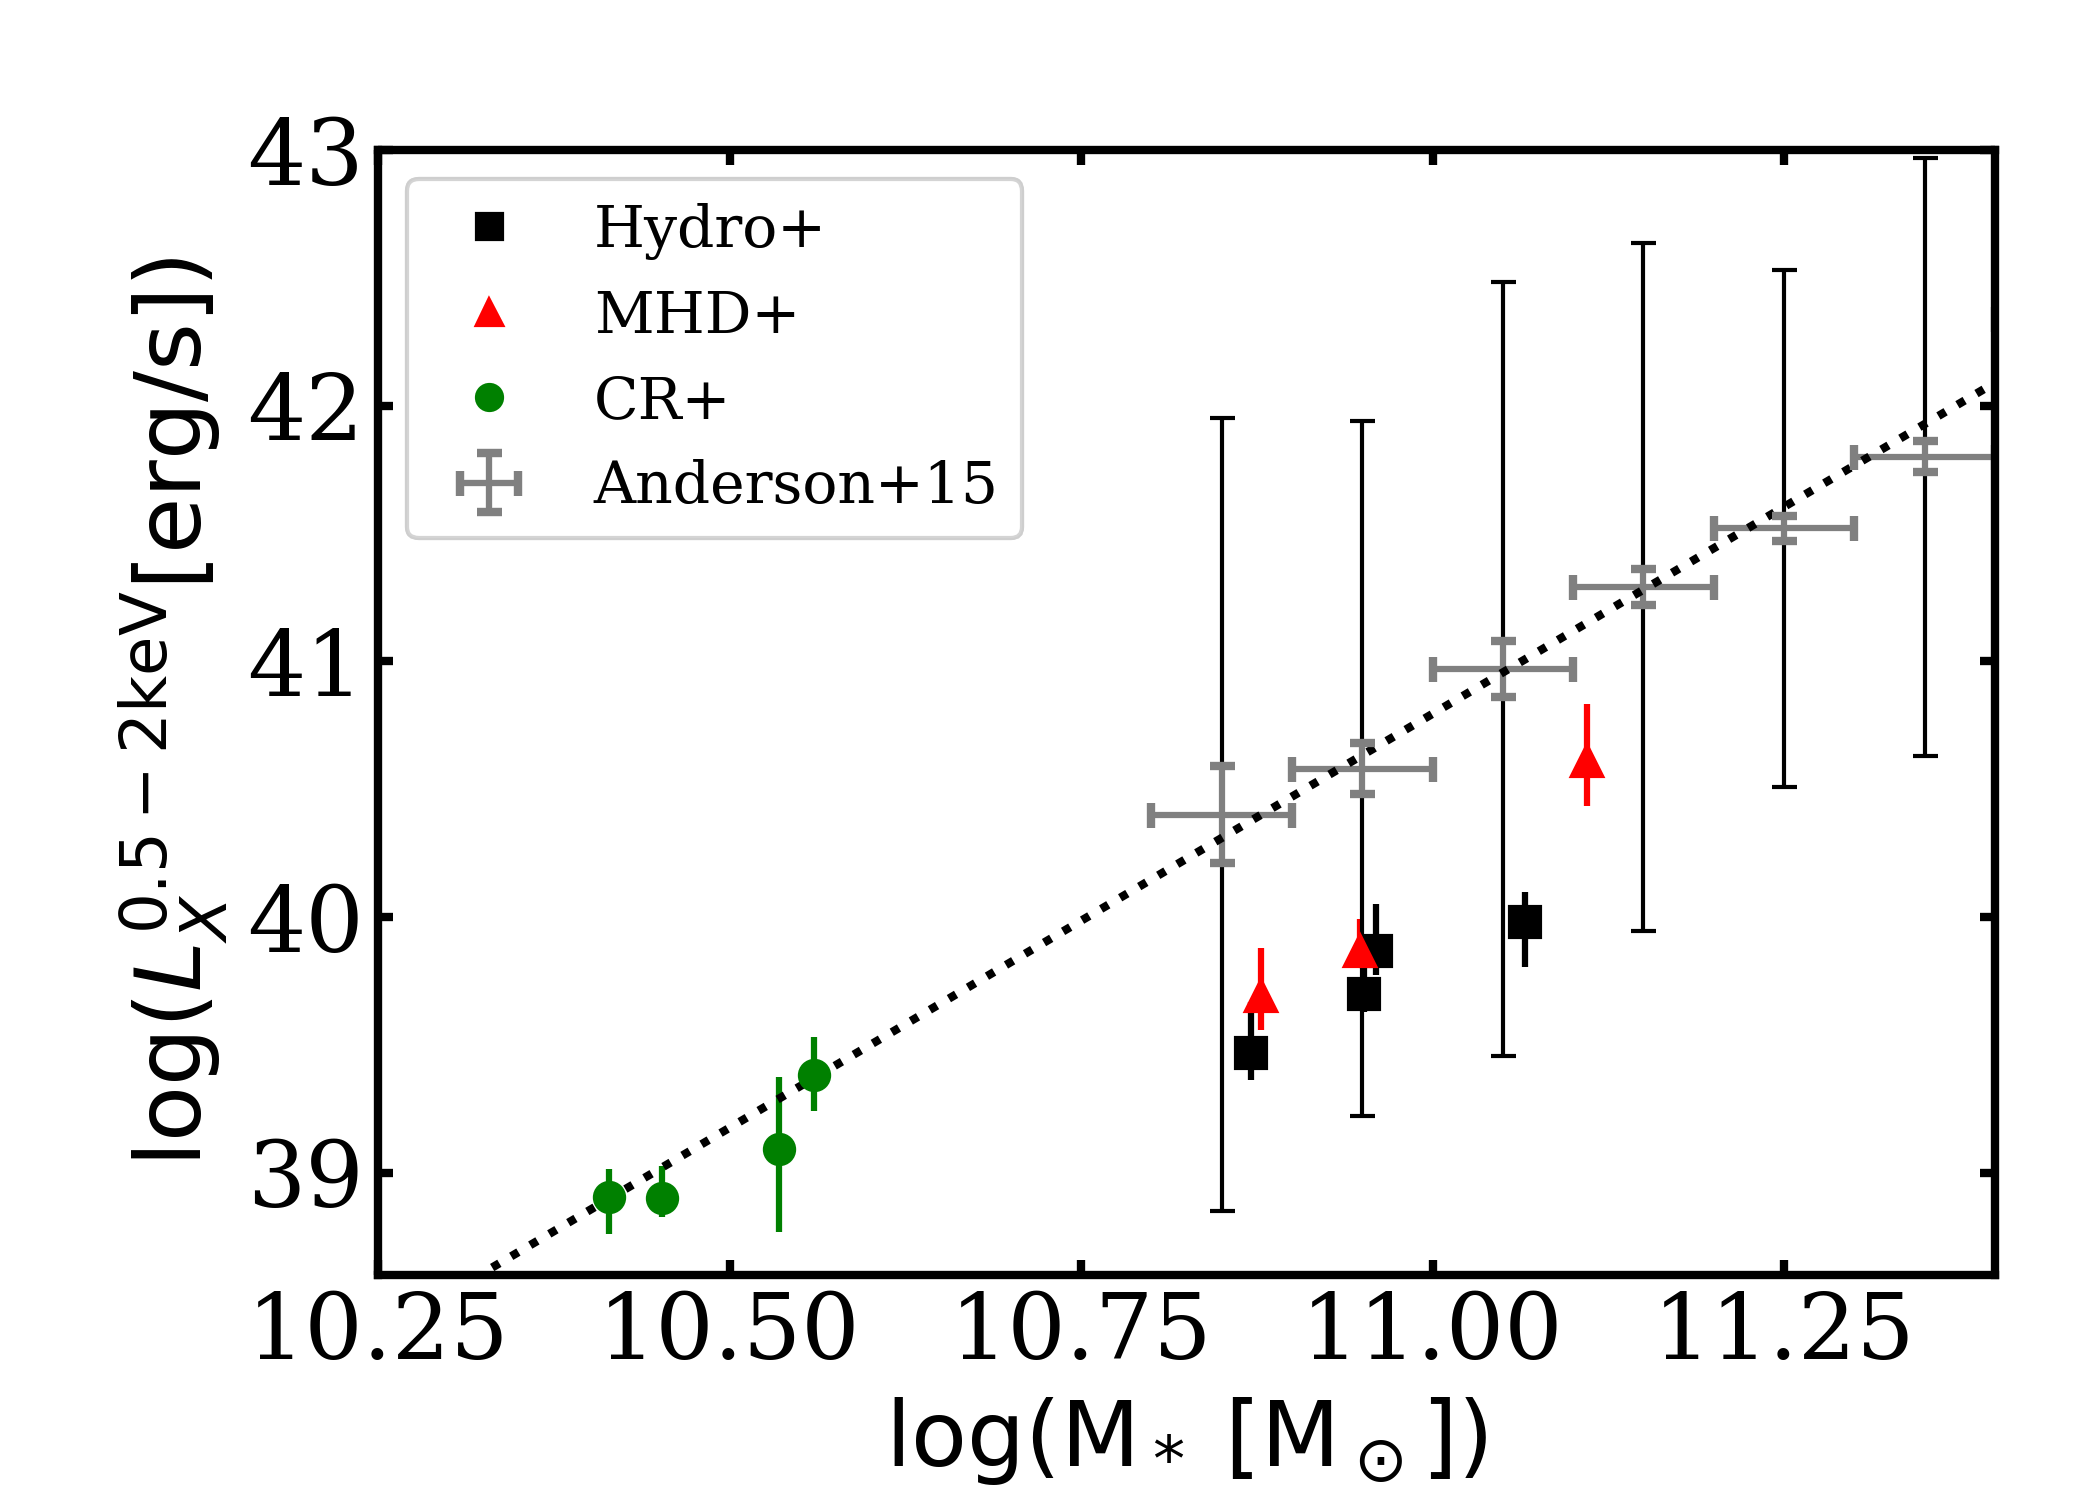
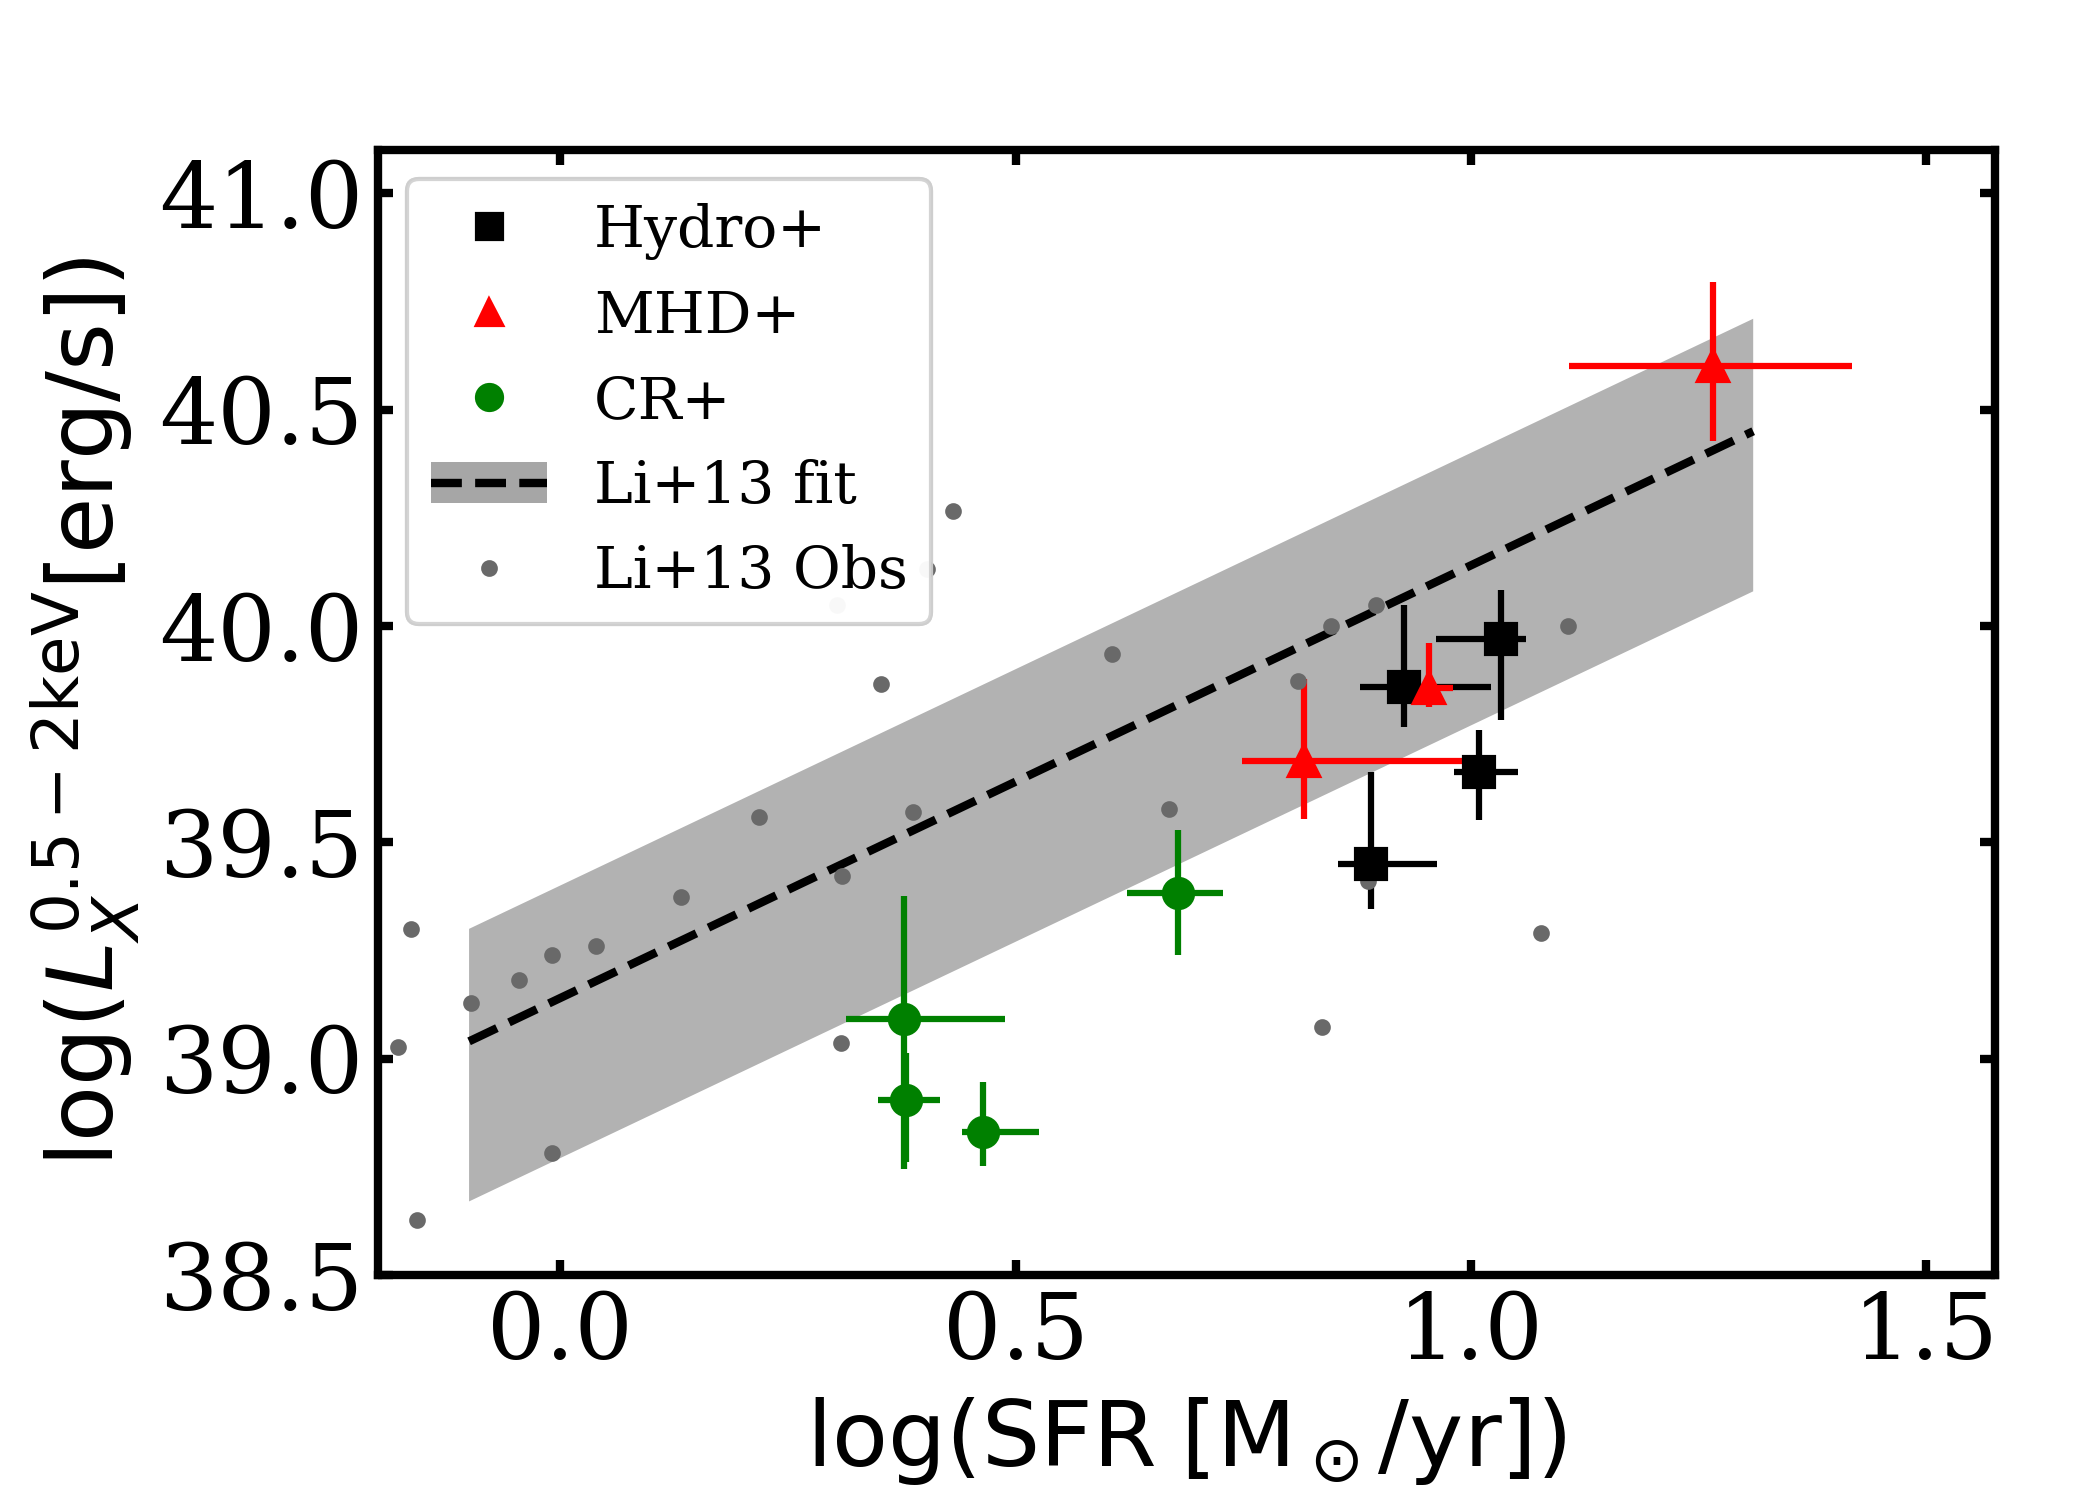
We compare our simulations to diffuse soft X-ray observation in Fig. 12. We considered all of the available m12 galaxies here, including m12m, to show X-ray in more massive or starburst galaxies171717For a comparison with the X-ray observation in the FIRE-1 galaxies without CRs, see van de Voort et al. (2016).. We calculate the soft X-ray emission of individual gas particles by interpolating a table computed with the Astrophysical Plasma Emission Code (APEC, v3.0.9; Smith et al. 2001; Foster et al. 2012), which assumes the gas is optically thin and in collisional equilibrium181818We neglect absorption from HI in the calculation of X-ray luminosity; observations typically correct for this effect and often found it to be negligible (Li & Wang, 2013). Then we sum over all of the X-ray luminosities from diffuse emission of hot gas within a given (3D) radius.
In the top panel of Fig.12, we compare our simulation against the stacked soft X-ray observation from Anderson et al. (2015)191919We do not include observations lower than due to the contamination of low mass X-ray binaries, but the contamination is small above that mass (see Anderson et al. 2015 for the estimate of the contributions from X-ray binaries). . The thin grey errorbars represent the intrinsic scatters, which come from some unknown contribution from X-ray binaries and low luminosity AGN activities. Hydro+ and MHD+ runs lie slightly below the observation points, but still within the estimated range. Note that the Hydro+ and MHD+ runs are slightly above the observed stellar-to-halo mass relation (Hopkins et al., 2020b), so their X-ray luminosity is likely even a better match for a given halo mass. The CR+ runs agree well with the extrapolation of the observational points.
In the lower panel of Fig. 12, we show that the amount of hot gas is roughly proportional to SFRs for all Hydro+, MHD+, and CR+ runs (see also Tüllmann et al. 2006). Hydro+ and MHD+ broadly agree with the observation data listed in Li & Wang (2013). Although the CR+ runs have weaker X-ray emission, at the same time they have lower SFRs, so they still lie close to the low end of the observed luminosities.
Another observational constraint on the hot gas is the Sunyaev-Zel’dovich (S-Z) effect (Sunyaev & Zeldovich, 1970). However, current observations (Planck Collaboration et al., 2013; Schaan et al., 2021) are limited to halos more massive than , and/or exclude the central regions (Bregman et al., 2022). Thus, these results are not yet able to probe the disk-halo interface of galaxies.
In the CGM, the low and intermediate ion absorbers are in a very good agreement between CR+ and observations (Ji et al., 2020). But there may be some tension in the high ions (e.g. NeVIII), although the observation data is sparse. Future comparisons with high ion absorption could provide extra constraints.
5.2.2 Warm gas distribution and flows
At the solar circle, the observed HI scale height is around 200 pc (Dickey & Lockman, 1990) and WIM scale height around 1-2 kpc (Reynolds, 1991; Gaensler et al., 2008). A number of external spiral galaxies also keep a fraction of their HI gas in a thick layer (with thickness a few kpc) above the midplane (Swaters et al., 1997; Fraternali et al., 2001). The WIM is also observed in many edge-on spiral galaxies (Hoopes et al., 1999; Rand, 1996, 2000). with very extended H emissions (up to 5 kpc in some cases). These HI and WIM scale heights are in general agreement with our simulations with or without CRs.
There are some signatures of WIM outflows (Voigtländer et al., 2013) in moderately star forming galaxies, which could be driven by CRs. For example, using the observational data of nearby radio halos and 1D CR propagation models, Heesen et al. (2018) and Schmidt et al. (2019) found evidence of CR-driven disk winds.
5.2.3 Warm-hot (transitional) gas
The WHM is observed in the galactic corona with a 3 kpc scale height around the MW (Putman et al., 2012; Savage & Wakker, 2009) and 8 kpc in an edge-on spiral galaxy (NGC 4631)(Otte et al., 2003). Observations of quasar absorption sightlines suggest that the WHM can extend to , which may be responsible for a significant fraction of the missing baryons (see, e.g. Tumlinson et al. 2011; Werk et al. 2013; Lehner et al. 2020).
However, it is challenging to maintain the warm-hot () gas away from galaxies without CRs, since the WHM is thermally unstable. For example, Fig. 9 shows that our Hydro+ runs have less extended WHM than CR+ runs. In a more quantitative study, Ji et al. (2021) found the distribution of the OVI absorption in the CGM in the CR+ runs agree well with observations, while our Hydro+ runs underestimate the absorption strength of OVI.
5.3 Caveats
The resolution of our simulations is not sufficient to directly resolve some important processes, such as (a) the cooling radii of SN explosions (Hopkins et al., 2018a; Gutcke et al., 2021), (b) instabilities that disrupt small warm clouds moving through hot medium (Cowie & McKee, 1977; Klein et al., 1994), (c) physical processes that prevent the disruptions of the clouds (McCourt et al., 2015; Scannapieco & Brüggen, 2015), (d) the sub-pc thermal instabilities (McCourt et al., 2018; Sparre et al., 2019) (e) the thermal instabilities enhanced by weak magnetic fields (Ji et al., 2018). Thus, the precise multiphase gas distribution, especially in Hydro+ or MHD+, is still uncertain.
Interestingly, consequences of some of these processes can be less severe with significant CR pressure, e.g. thermal instabilities might not results in poorly resolved, dense clouds (Butsky et al., 2020) and clouds can be accelerated without disruption (Wiener et al., 2017; Bustard & Zweibel, 2021).
However, the microphysics of CR transport still remains order-of-magnitude uncertain. We parameterize this here with a simple streaming+constant diffusivity model, with the constant diffusion coefficient calibrated to reproduce -ray and grammage observations. Realistically, CRs interact locally with Alfvén waves and thermal gas, resulting in variable streaming speeds and diffusion coefficients in different ISM phases (e.g. Zweibel 2013; Thomas et al. 2021; Armillotta et al. 2021; Thomas et al. 2022).
In particular, Hopkins et al. (2021c, b) showed that a variety of models with more complicated dependence of CR transport on local plasma properties (see e.g. Zweibel, 2013) can reproduce the same observables close to the disk (primarily coming from the ISM of the MW and nearby galaxies) while behaving differently in the CGM. These models generally gave rise to faster CR escape outside the inner halo. Hence, CR pressure profiles drop more rapidly, so the results are “in-between” our CR+ and MHD+ runs here. Constraining which (if any) of these best represents reality remains an important question for the future work.
Since the CR propagation physics is uncertain away from galaxy disks (§5.3), future observations of extended synchrotron emission (e.g. van Haarlem et al. 2013) and -ray emission of nearby galaxies can provide valuable constraints (e.g. Karwin et al. 2019).
Another related concern is the effective diffusion coefficient (determined by the observed hadronic -ray luminosity and grammage) could be dependent on resolution. However, Hopkins et al. (2021c) showed that the required diffusion coefficients were not dominated by the cold/dense clouds (since they are small, the residence time of CRs is very small there, even with a lower diffusion coefficient). They showed most of the hadronic rays comes from volume-filling phases like the WIM and inner CGM. Bustard & Zweibel (2021) also found similar results using high-resolution ISM simulations with CRs. Chan et al. (2019) found that the ray emission is much more extended than the cold/thin disks, so the emission is not dominated by the cold gas. Therefore, the effective diffusion coefficient required by observations is likely insensitive to resolution, as long as the WIM and inner CGM are resolved.
Here we only consider averaged quantities over time and radius. However, the dynamical balance of the gas above galactic disks is violated on short time (Benincasa et al., 2016) and small spatial scales (Gurvich et al., 2020). Mass fluxes and temperature distributions can also vary due to non-uniform star formation and gravity (Vijayan et al., 2020; Kim et al., 2020). These variations need to be considered in more detailed comparisons with observations.
We do not include AGN feedback in this work (though see Su et al. 2020), which can heat gas and inject CRs (see §5.2.1), potentially changing properties of the CGM and disk-halo interface. To determine their role, one would have to implement realistic AGN feedback with CR injection in cosmological settings, which is a promising research direction for the future.
Finally, both Hydro+ and CR+ runs are not direct analogues to the MW, but are similar to some actively star-forming galaxies. As seen in Table 1, stellar masses of Hydro+ are higher than the MW’s, whereas CR+ galaxies are less massive than the MW.
Both of them have higher specific star formation rates than the MW’s, although they are not atypical in star forming galaxies at these stellar masses, see e.g. Salim et al. (2007). In fact, the SFR of MW is a factor of 2-3 lower than the typical galaxies (Licquia et al., 2015).
Hence, unsurprisingly, some quantities in our simulations deviate from the MW’s value. For example, the HI vertical velocity dispersions of our m12 runs are around 30 km/s (the rightmost points in Fig. 11), which are three times higher than the MW’s value (Boulares & Cox, 1990) 202020 But our m12 runs still follow the observed - relation, because their are also higher than the MW’s value (; Kennicutt & Evans 2012).. How to reproduce the MW properties (lower velocity dispersions and SFRs) would be one potential topic for the future.
6 Conclusions
We study the disk-halo interaction using cosmological simulations of galaxies with the FIRE feedback scheme that includes CR feedback with diffusion and streaming. Our simulations include the full range of processes relevant for the evolution of gas around disks, e.g. galactic fountains, inflows, and outflows. We focus on the pressure balance and the distribution of the multiphase gas near galaxies in simulations with and without CRs. Our major findings are summarized below:
-
•
The extra-planar gas of galaxies in our sample is in approximate dynamical equilibrium, but not in hydro-static equilibrium. In all of the runs, gas is supported predominately by kinetic pressure near the galactic midplane. Without CRs, significant thermal and kinetic pressure are required to support gas far above () the disks. However, if included, CRs become the major support at a large height above the galactic disk;
-
•
Pressure from gas motion (with scale ) dominates the mid-plane pressure in all of the runs. CR feedback does not affect the relation between SFR surface density and mid-plane turbulent velocity (§4.4).
-
•
Our simulations without CRs form the traditional “galactic fountains” (§4.2), where winds are mostly trapped due to the strong gravitational potential, efficient radiative cooling, and hot halo confinement. With CR-dominated halos (for ), the disk-halo interface is governed by CR-driven warm winds and hot gas bubbles. Superbubble-driven winds can escape the inner halo more easily with CRs. Fig.1 shows the schematic diagrams of these processes.
-
•
CRs drastically modify gas phase structures above galactic disks (§4.3). CRs can boost the scale height of the warm-hot gas and suppress the hot gas, so the warm-hot () gas becomes the dominant voluming-filling component away from galaxies.
-
•
The soft X-ray luminosity of the CR runs is close to the lower bound of the observation. Future higher resolution simulations with a more realistic CR propagation models are needed to clarify this tension.
Note that we do not necessarily assert that galaxies have CR-dominated halos (see also Ji et al. 2020). However, several lines of arguments suggest that CRs play an important role in the disk-halo interface. First, CR pressure is strong in the ISM (Boulares & Cox, 1990; Ferrière, 2001), and should be significant also in the disk-halo interface due to fast diffusion (Chan et al., 2019)212121For example, using the observed CR species, Trotta et al. (2011) inferred the CR halo in the MW has a height at least around 5 kpc.. Second, there is evidence of CR-driven winds in moderately star forming galaxies (Heesen et al., 2018; Schmidt et al., 2019). Third, CRs (and other non-thermal pressure) are a possible explanation of the prevalent WHM observations (Ji et al., 2020; Faerman et al., 2017). Therefore, CRs are an indispensable component in future studies of the disk-halo interface.
ACKNOWLEDGEMENTS
We gratefully thank the referee, Mordecai-Mark Mac Low, for the careful reading and suggestions. We thank Bili Dong for the help with YT. We thank Eliot Quataert, Norman Murray, and Matthew Orr for helpful discussions. We are grateful for stimulating ideas and discussions during the KITP program – Fundamentals of Gaseous Halos (grant number NSF PHY-1748958). TKC was supported by the Science and Technology Facilities Council (STFC) through Consolidated Grants ST/P000541/1 and ST/T000244/1 for Astronomy at Durham. DK was supported by NSF through grants: AST-1715101 and AST-2108314 and Cottrell Scholar Award from the Research Corporation for Science Advancement. ABG was supported by a National Science Foundation Graduate Research Fellowship Program under grant DGE-1842165 and was additionally supported by the NSF under grants DGE-0948017 and DGE-145000, and from Blue Waters as a graduate fellow which is itself supported by the NSF (awards OCI-0725070 and ACI-1238993). Support for PFH and co-authors was provided by an Alfred P. Sloan Research Fellowship, NSF Collaborative Research Grant #1715847 and CAREER grant #1455342, and NASA grants NNX15AT06G, JPL 1589742, 17-ATP17-0214. SJ is supported by a Sherman Fairchild Fellowship from Caltech, the Natural Science Foundation of China (grants 12133008, 12192220, and 12192223), and the science research grants from the China Manned Space Project (No. CMS-CSST-2021-B02). CAFG was supported by NSF through grants AST-1715216, AST-2108230, and CAREER award AST-1652522; by NASA through grant 17-ATP17-0067; by STScI through grant HST-AR-16124.001-A; and by the Research Corporation for Science Advancement through a Cottrell Scholar Award. The simulation presented here used computational resources granted by the Extreme Science and Engineering Discovery Environment (XSEDE), which is supported by National Science Foundation grant no. OCI-1053575, specifically allocation TG-AST120025. The simulations are additional supported by allocations AST21010 and AST20016 from the NSF and TACC. Our analysis is run on the Triton Shared Computing Cluster in the San Diego Supercomputer Center (San Diego Supercomputer Center, 2022). This work also made use of YT (Turk et al., 2011), matplotlib (Hunter, 2007), numpy (van der Walt et al., 2011), scipy (Jones et al., 2001), and NASA’s Astrophysics Data System. The data used in this work here were, in part, hosted on facilities supported by the Scientific Computing Core at the Flatiron Institute, a division of the Simons Foundation.
This is a pre-copyedited, author-produced PDF of an article accepted for publication in Monthly Notices of the Royal Astronomical Society following peer review. The version of record is available online at: https://doi.org/10.1093/mnras/stac2236 .
DATA AVAILABILITY
The data underlying this article will be shared on reasonable request to the corresponding author (TKC). The simulation initial conditions, snapshot files, and visualization can be found in https://fire.northwestern.edu/data/. A public version of the GIZMO simulation code is available http://www.tapir.caltech.edu/ phopkins/Site/GIZMO.html.
References
- Anderson et al. (2015) Anderson M. E., Gaspari M., White S. D. M., Wang W., Dai X., 2015, MNRAS, 449, 3806
- Anderson et al. (2016) Anderson M. E., Churazov E., Bregman J. N., 2016, MNRAS, 455, 227
- Anglés-Alcázar et al. (2017) Anglés-Alcázar D., Faucher-Giguère C.-A., Kereš D., Hopkins P. F., Quataert E., Murray N., 2017, MNRAS, 470, 4698
- Armillotta et al. (2021) Armillotta L., Ostriker E. C., Jiang Y.-F., 2021, ApJ, 922, 11
- Armillotta et al. (2022) Armillotta L., Ostriker E. C., Jiang Y.-F., 2022, ApJ, 929, 170
- Bate & Burkert (1997) Bate M. R., Burkert A., 1997, MNRAS, 288, 1060
- Beck (2015) Beck R., 2015, A&A Rev., 24, 4
- Benincasa et al. (2016) Benincasa S. M., Wadsley J., Couchman H. M. P., Keller B. W., 2016, MNRAS, 462, 3053
- Benjamin (2002) Benjamin R. A., 2002, in Taylor A. R., Landecker T. L., Willis A. G., eds, Astronomical Society of the Pacific Conference Series Vol. 276, Seeing Through the Dust: The Detection of HI and the Exploration of the ISM in Galaxies. p. 201
- Bigiel et al. (2008) Bigiel F., Leroy A., Walter F., Brinks E., de Blok W. J. G., Madore B., Thornley M. D., 2008, AJ, 136, 2846
- Bloemen (1987) Bloemen J. B. G. M., 1987, ApJ, 322, 694
- Bloemen et al. (1993) Bloemen J. B. G. M., Dogiel V. A., Dorman V. L., Ptuskin V. S., 1993, A& A, 267, 372
- Boettcher et al. (2016) Boettcher E., Zweibel E. G., Gallagher J. S. I., Benjamin R. A., 2016, ApJ, 832, 118
- Boettcher et al. (2019) Boettcher E., Gallagher J. S. I., Zweibel E. G., 2019, ApJ, 885, 160
- Booth et al. (2013) Booth C. M., Agertz O., Kravtsov A. V., Gnedin N. Y., 2013, ApJL, 777, L16
- Boulares & Cox (1990) Boulares A., Cox D. P., 1990, ApJ, 365, 544
- Bournaud et al. (2010) Bournaud F., Elmegreen B. G., Teyssier R., Block D. L., Puerari I., 2010, MNRAS, 409, 1088
- Bower et al. (2017) Bower R. G., Schaye J., Frenk C. S., Theuns T., Schaller M., Crain R. A., McAlpine S., 2017, MNRAS, 465, 32
- Bowyer et al. (1995) Bowyer S., Lieu R., Sidher S. D., Lampton M., Knude J., 1995, Nature, 375, 212
- Bregman (1980) Bregman J. N., 1980, ApJ, 236, 577
- Bregman et al. (2022) Bregman J. N., Hodges-Kluck E., Qu Z., Pratt C., Li J.-T., Yun Y., 2022, ApJ, 928, 14
- Breitschwerdt & Schmutzler (1999) Breitschwerdt D., Schmutzler T., 1999, A& A, 347, 650
- Breitschwerdt et al. (1991) Breitschwerdt D., McKenzie J. F., Voelk H. J., 1991, A& A, 245, 79
- Breitschwerdt et al. (1993) Breitschwerdt D., McKenzie J. F., Voelk H. J., 1993, A& A, 269, 54
- Breitschwerdt et al. (2002) Breitschwerdt D., Dogiel V. A., Völk H. J., 2002, A& A, 385, 216
- Bryan & Norman (1998) Bryan G. L., Norman M. L., 1998, ApJ, 495, 80
- Buck et al. (2020) Buck T., Pfrommer C., Pakmor R., Grand R. J. J., Springel V., 2020, MNRAS, 497, 1712
- Bustard & Zweibel (2021) Bustard C., Zweibel E. G., 2021, ApJ, 913, 106
- Bustard et al. (2020) Bustard C., Zweibel E. G., D’Onghia E., Gallagher J. S. I., Farber R., 2020, ApJ, 893, 29
- Butsky & Quinn (2018) Butsky I. S., Quinn T. R., 2018, ApJ, 868, 108
- Butsky et al. (2020) Butsky I. S., Fielding D. B., Hayward C. C., Hummels C. B., Quinn T. R., Werk J. K., 2020, ApJ, 903, 77
- Castor et al. (1975) Castor J., McCray R., Weaver R., 1975, ApJL, 200, L107
- Chan et al. (2019) Chan T. K., Kereš D., Hopkins P. F., Quataert E., Su K. Y., Hayward C. C., Faucher-Giguère C. A., 2019, MNRAS, 488, 3716
- Chandran & Dennis (2006) Chandran B. D., Dennis T. J., 2006, ApJ, 642, 140
- Chevalier & Fransson (1984) Chevalier R. A., Fransson C., 1984, ApJL, 279, L43
- Colbrook et al. (2017) Colbrook M. J., Ma X., Hopkins P. F., Squire J., 2017, MNRAS, 467, 2421
- Cowie & McKee (1977) Cowie L. L., McKee C. F., 1977, ApJ, 211, 135
- Cox (2005) Cox D. P., 2005, ARA& A, 43, 337
- Crocker et al. (2021) Crocker R. M., Krumholz M. R., Thompson T. A., 2021, MNRAS, 502, 1312
- Dai et al. (2012) Dai X., Anderson M. E., Bregman J. N., Miller J. M., 2012, ApJ, 755, 107
- Das et al. (2020) Das S., Mathur S., Gupta A., 2020, ApJ, 897, 63
- Dib et al. (2006) Dib S., Bell E., Burkert A., 2006, ApJ, 638, 797
- Dickey & Lockman (1990) Dickey J. M., Lockman F. J., 1990, ARA& A, 28, 215
- Elmegreen et al. (2003) Elmegreen B. G., Elmegreen D. M., Leitner S. N., 2003, ApJ, 590, 271
- Escala et al. (2018) Escala I., et al., 2018, MNRAS, 474, 2194
- Everett et al. (2008) Everett J. E., Zweibel E. G., Benjamin R. A., McCammon D., Rocks L., Gallagher III J. S., 2008, ApJ, 674, 258
- Evoli et al. (2018) Evoli C., Blasi P., Morlino G., Aloisio R., 2018, Phys. Rev. Lett., 121, 021102
- Faerman et al. (2017) Faerman Y., Sternberg A., McKee C. F., 2017, ApJ, 835, 52
- Faucher-Giguère et al. (2009) Faucher-Giguère C.-A., Lidz A., Zaldarriaga M., Hernquist L., 2009, ApJ, 703, 1416
- Ferland et al. (2013) Ferland G. J., et al., 2013, RMxAA, 49, 137
- Ferrière (1998) Ferrière K., 1998, ApJ, 497, 759
- Ferrière (2001) Ferrière K. M., 2001, Reviews of Modern Physics, 73, 1031
- Fielding et al. (2017) Fielding D., Quataert E., Martizzi D., Faucher-Giguère C.-A., 2017, MNRAS, 470, L39
- Foster et al. (2012) Foster A. R., Ji L., Smith R. K., Brickhouse N. S., 2012, ApJ, 756, 128
- Fraternali & Binney (2008) Fraternali F., Binney J. J., 2008, MNRAS, 386, 935
- Fraternali et al. (2001) Fraternali F., Oosterloo T., Sancisi R., van Moorsel G., 2001, ApJL, 562, L47
- Fraternali et al. (2002) Fraternali F., Cappi M., Sancisi R., Oosterloo T., 2002, ApJ, 578, 109
- Gaensler et al. (2008) Gaensler B. M., Madsen G. J., Chatterjee S., Mao S. A., 2008, PASA, 25, 184
- Girichidis et al. (2016) Girichidis P., et al., 2016, ApJL, 816, L19
- Girichidis et al. (2018) Girichidis P., Naab T., Hanasz M., Walch S., 2018, MNRAS, 479, 3042
- Grenier et al. (2015) Grenier I. A., Black J. H., Strong A. W., 2015, ARA& A, 53, 199
- Grudić et al. (2021) Grudić M. Y., Guszejnov D., Hopkins P. F., Offner S. S. R., Faucher-Giguère C.-A., 2021, MNRAS, 506, 2199
- Guo & Oh (2008) Guo F., Oh S. P., 2008, MNRAS, 384, 251
- Gupta et al. (2012) Gupta A., Mathur S., Krongold Y., Nicastro F., Galeazzi M., 2012, ApJL, 756, L8
- Gurvich et al. (2020) Gurvich A. B., et al., 2020, MNRAS, 498, 3664
- Gutcke et al. (2021) Gutcke T. A., Pakmor R., Naab T., Springel V., 2021, MNRAS, 501, 5597
- Hafen et al. (2019) Hafen Z., et al., 2019, MNRAS, 488, 1248
- Hagihara et al. (2010) Hagihara T., Yao Y., Yamasaki N. Y., Mitsuda K., Wang Q. D., Takei Y., Yoshino T., McCammon D., 2010, PASJ, 62, 723
- Hahn & Abel (2011) Hahn O., Abel T., 2011, MNRAS, 415, 2101
- Hanasz et al. (2009) Hanasz M., Wóltański D., Kowalik K., 2009, ApJL, 706, L155
- Heesen et al. (2018) Heesen V., et al., 2018, MNRAS, 476, 158
- Henley & Shelton (2013) Henley D. B., Shelton R. L., 2013, ApJ, 773, 92
- Hill et al. (2012) Hill A. S., Joung M. R., Mac Low M.-M., Benjamin R. A., Haffner L. M., Klingenberg C., Waagan K., 2012, ApJ, 750, 104
- Hoopes et al. (1999) Hoopes C. G., Walterbos R. A. M., Rand R. J., 1999, ApJ, 522, 669
- Hopkins (2015) Hopkins P. F., 2015, MNRAS, 450, 53
- Hopkins (2017) Hopkins P. F., 2017, MNRAS, 466, 3387
- Hopkins & Raives (2016) Hopkins P. F., Raives M. J., 2016, MNRAS, 455, 51
- Hopkins et al. (2013) Hopkins P. F., Narayanan D., Murray N., Quataert E., 2013, MNRAS, 433, 69
- Hopkins et al. (2014) Hopkins P. F., Kereš D., Oñorbe J., Faucher-Giguère C.-A., Quataert E., Murray N., Bullock J. S., 2014, MNRAS, 445, 581
- Hopkins et al. (2018a) Hopkins P. F., et al., 2018a, MNRAS, 477, 1578
- Hopkins et al. (2018b) Hopkins P. F., et al., 2018b, MNRAS, 480, 800
- Hopkins et al. (2020a) Hopkins P. F., Grudić M. Y., Wetzel A., Kereš D., Faucher-Giguère C.-A., Ma X., Murray N., Butcher N., 2020a, MNRAS, 491, 3702
- Hopkins et al. (2020b) Hopkins P. F., et al., 2020b, MNRAS, 492, 3465
- Hopkins et al. (2021a) Hopkins P. F., Chan T. K., Ji S., Hummels C. B., Kereš D., Quataert E., Faucher-Giguère C.-A., 2021a, MNRAS, 501, 3640
- Hopkins et al. (2021b) Hopkins P. F., Chan T. K., Squire J., Quataert E., Ji S., Kereš D., Faucher-Giguère C.-A., 2021b, MNRAS, 501, 3663
- Hopkins et al. (2021c) Hopkins P. F., Squire J., Chan T. K., Quataert E., Ji S., Kereš D., Faucher-Giguère C.-A., 2021c, MNRAS, 501, 4184
- Houck & Bregman (1990) Houck J. C., Bregman J. N., 1990, ApJ, 352, 506
- Hunter (2007) Hunter J. D., 2007, Computing in Science and Engineering, 9, 90
- Ipavich (1975) Ipavich F. M., 1975, ApJ, 196, 107
- Jenkins (1978) Jenkins E. B., 1978, ApJ, 220, 107
- Ji et al. (2018) Ji S., Oh S. P., McCourt M., 2018, MNRAS, 476, 852
- Ji et al. (2020) Ji S., et al., 2020, MNRAS, 496, 4221
- Ji et al. (2021) Ji S., Kereš D., Chan T. K., Stern J., Hummels C. B., Hopkins P. F., Quataert E., Faucher-Giguère C.-A., 2021, MNRAS, 505, 259
- Jiang & Oh (2018) Jiang Y.-F., Oh S. P., 2018, ApJ, 854, 5
- Jones et al. (2001) Jones E., Oliphant T., Peterson P., et al., 2001, SciPy: Open source scientific tools for Python, http://www.scipy.org/
- Joung & Mac Low (2006) Joung M. K. R., Mac Low M.-M., 2006, ApJ, 653, 1266
- Joung et al. (2009) Joung M. R., Mac Low M.-M., Bryan G. L., 2009, ApJ, 704, 137
- Kaaret et al. (2020) Kaaret P., et al., 2020, Nature Astronomy, 4, 1072
- Karwin et al. (2019) Karwin C. M., Murgia S., Campbell S., Moskalenko I. V., 2019, ApJ, 880, 95
- Katz & White (1993) Katz N., White S. D. M., 1993, ApJ, 412, 455
- Kauffmann et al. (2013) Kauffmann J., Pillai T., Goldsmith P. F., 2013, ApJ, 779, 185
- Kempski & Quataert (2020) Kempski P., Quataert E., 2020, MNRAS, 493, 1801
- Kennicutt & Evans (2012) Kennicutt R. C., Evans N. J., 2012, ARA& A, 50, 531
- Kereš & Hernquist (2009) Kereš D., Hernquist L., 2009, ApJL, 700, L1
- Kereš et al. (2005) Kereš D., Katz N., Weinberg D. H., Davé R., 2005, MNRAS, 363, 2
- Kim & Ostriker (2015) Kim C.-G., Ostriker E. C., 2015, ApJ, 815, 67
- Kim & Ostriker (2018) Kim C.-G., Ostriker E. C., 2018, ApJ, 853, 173
- Kim et al. (2020) Kim C.-G., et al., 2020, ApJ, 900, 61
- Klein et al. (1994) Klein R. I., McKee C. F., Colella P., 1994, ApJ, 420, 213
- Knollmann & Knebe (2009) Knollmann S. R., Knebe A., 2009, ApJS, 182, 608
- Kroupa (2002) Kroupa P., 2002, Science, 295, 82
- Krumholz & Gnedin (2011) Krumholz M. R., Gnedin N. Y., 2011, ApJ, 729, 36
- Lee et al. (2016) Lee E. J., Miville-Deschênes M.-A., Murray N. W., 2016, ApJ, 833, 229
- Lehner et al. (2020) Lehner N., et al., 2020, ApJ, 900, 9
- Leitherer et al. (1999) Leitherer C., et al., 1999, ApJS, 123, 3
- Leroy et al. (2008) Leroy A. K., Walter F., Brinks E., Bigiel F., de Blok W. J. G., Madore B., Thornley M. D., 2008, AJ, 136, 2782
- Li & Wang (2013) Li J.-T., Wang Q. D., 2013, MNRAS, 435, 3071
- Licquia et al. (2015) Licquia T. C., Newman J. A., Brinchmann J., 2015, ApJ, 809, 96
- Lopez et al. (2018) Lopez L. A., Auchettl K., Linden T., Bolatto A. D., Thompson T. A., Ramirez-Ruiz E., 2018, ApJ, 867, 44
- Mao & Ostriker (2018) Mao S. A., Ostriker E. C., 2018, ApJ, 854, 89
- Martizzi et al. (2016) Martizzi D., Fielding D., Faucher-Giguère C.-A., Quataert E., 2016, MNRAS, 459, 2311
- McCourt et al. (2015) McCourt M., O’Leary R. M., Madigan A.-M., Quataert E., 2015, MNRAS, 449, 2
- McCourt et al. (2018) McCourt M., Oh S. P., O’Leary R., Madigan A.-M., 2018, MNRAS, 473, 5407
- Muratov et al. (2015) Muratov A. L., Kereš D., Faucher-Giguère C.-A., Hopkins P. F., Quataert E., Murray N., 2015, MNRAS, 454, 2691
- Muratov et al. (2017) Muratov A. L., et al., 2017, MNRAS, 468, 4170
- Norman & Ikeuchi (1989) Norman C. A., Ikeuchi S., 1989, ApJ, 345, 372
- Oñorbe et al. (2014) Oñorbe J., Garrison-Kimmel S., Maller A. H., Bullock J. S., Rocha M., Hahn O., 2014, MNRAS, 437, 1894
- Orr et al. (2018) Orr M. E., et al., 2018, MNRAS, 478, 3653
- Orr et al. (2020) Orr M. E., et al., 2020, MNRAS, 496, 1620
- Otte et al. (2003) Otte B., Murphy E. M., Howk J. C., Wang Q. D., Oegerle W. R., Sembach K. R., 2003, ApJ, 591, 821
- Pakmor et al. (2016) Pakmor R., Pfrommer C., Simpson C. M., Springel V., 2016, ApJL, 824, L30
- Pandya et al. (2021) Pandya V., et al., 2021, MNRAS, 508, 2979
- Parker (1953) Parker E. N., 1953, ApJ, 117, 431
- Planck Collaboration et al. (2013) Planck Collaboration et al., 2013, A& A, 557, A52
- Porter (1985) Porter D. H., 1985, PhD thesis, California Univ., Berkeley.
- Price & Monaghan (2007) Price D. J., Monaghan J. J., 2007, MNRAS, 374, 1347
- Putman et al. (2012) Putman M. E., Peek J. E. G., Joung M. R., 2012, ARA& A, 50, 491
- Quataert et al. (2022) Quataert E., Thompson T. A., Jiang Y.-F., 2022, MNRAS, 510, 1184
- Rand (1996) Rand R. J., 1996, ApJ, 462, 712
- Rand (2000) Rand R. J., 2000, ApJL, 537, L13
- Recchia et al. (2016) Recchia S., Blasi P., Morlino G., 2016, MNRAS, 462, 4227
- Reynolds (1991) Reynolds R. J., 1991, in Bloemen H., ed., IAU Symposium Vol. 144, The Interstellar Disk-Halo Connection in Galaxies. pp 67–76
- Ruszkowski et al. (2017) Ruszkowski M., Yang H.-Y. K., Zweibel E., 2017, ApJ, 834, 208
- Salem & Bryan (2014) Salem M., Bryan G. L., 2014, MNRAS, 437, 3312
- Salem et al. (2016) Salem M., Bryan G. L., Corlies L., 2016, MNRAS, 456, 582
- Salim et al. (2007) Salim S., et al., 2007, ApJS, 173, 267
- San Diego Supercomputer Center (2022) San Diego Supercomputer Center 2022, Triton Shared Computing Cluster. University of California, San Diego. Service., doi:10.57873/T34W2R
- Savage & Wakker (2009) Savage B. D., Wakker B. P., 2009, ApJ, 702, 1472
- Scannapieco & Brüggen (2015) Scannapieco E., Brüggen M., 2015, ApJ, 805, 158
- Schaan et al. (2021) Schaan E., et al., 2021, Phys. Rev. D, 103, 063513
- Schmidt et al. (2019) Schmidt P., et al., 2019, A& A, 632, A12
- Shapiro & Field (1976) Shapiro P. R., Field G. B., 1976, ApJ, 205, 762
- Sharma & Hammett (2011) Sharma P., Hammett G. W., 2011, Journal of Computational Physics, 230, 4899
- Sharma et al. (2010) Sharma P., Colella P., Martin D., 2010, SIAM Journal on Scientific Computing, 32, 3564
- Smith et al. (2001) Smith R. K., Brickhouse N. S., Liedahl D. A., Raymond J. C., 2001, ApJL, 556, L91
- Snowden et al. (1998) Snowden S. L., Egger R., Finkbeiner D. P., Freyberg M. J., Plucinsky P. P., 1998, ApJ, 493, 715
- Socrates et al. (2008) Socrates A., Davis S. W., Ramirez-Ruiz E., 2008, ApJ, 687, 202
- Sparre et al. (2019) Sparre M., Pfrommer C., Vogelsberger M., 2019, MNRAS, 482, 5401
- Spitzer (1956) Spitzer Jr. L., 1956, ApJ, 124, 20
- Springel (2005) Springel V., 2005, MNRAS, 364, 1105
- Stein et al. (2020) Stein Y., et al., 2020, A& A, 639, A111
- Stern et al. (2021) Stern J., et al., 2021, ApJ, 911, 88
- Stewart et al. (2017) Stewart K. R., et al., 2017, ApJ, 843, 47
- Su et al. (2017) Su K.-Y., Hopkins P. F., Hayward C. C., Faucher-Giguère C.-A., Kereš D., Ma X., Robles V. H., 2017, MNRAS, 471, 144
- Su et al. (2020) Su K.-Y., et al., 2020, MNRAS, 491, 1190
- Sunyaev & Zeldovich (1970) Sunyaev R. A., Zeldovich Y. B., 1970, Ap&SS, 7, 3
- Swaters et al. (1997) Swaters R. A., Sancisi R., van der Hulst J. M., 1997, ApJ, 491, 140
- Thomas & Pfrommer (2019) Thomas T., Pfrommer C., 2019, MNRAS, 485, 2977
- Thomas et al. (2021) Thomas T., Pfrommer C., Pakmor R., 2021, MNRAS, 503, 2242
- Thomas et al. (2022) Thomas T., Pfrommer C., Pakmor R., 2022, arXiv e-prints, p. arXiv:2203.12029
- Trapp et al. (2022) Trapp C. W., et al., 2022, MNRAS, 509, 4149
- Trotta et al. (2011) Trotta R., Jóhannesson G., Moskalenko I. V., Porter T. A., Ruiz de Austri R., Strong A. W., 2011, ApJ, 729, 106
- Truelove et al. (1997) Truelove J. K., Klein R. I., McKee C. F., Holliman John H. I., Howell L. H., Greenough J. A., 1997, ApJL, 489, L179
- Tüllmann et al. (2000) Tüllmann R., Dettmar R. J., Soida M., Urbanik M., Rossa J., 2000, A& A, 364, L36
- Tüllmann et al. (2006) Tüllmann R., Pietsch W., Rossa J., Breitschwerdt D., Dettmar R. J., 2006, A& A, 448, 43
- Tumlinson et al. (2011) Tumlinson J., et al., 2011, Science, 334, 948
- Turk et al. (2011) Turk M. J., Smith B. D., Oishi J. S., Skory S., Skillman S. W., Abel T., Norman M. L., 2011, ApJS, 192, 9
- Tyler et al. (2004) Tyler K., Quillen A. C., LaPage A., Rieke G. H., 2004, ApJ, 610, 213
- Vandenbroucke et al. (2018) Vandenbroucke B., Wood K., Girichidis P., Hill A. S., Peters T., 2018, MNRAS, 476, 4032
- Vijayan et al. (2020) Vijayan A., Kim C.-G., Armillotta L., Ostriker E. C., Li M., 2020, ApJ, 894, 12
- Voigtländer et al. (2013) Voigtländer P., Kamphuis P., Marcelin M., Bomans D. J., Dettmar R. J., 2013, A& A, 554, A133
- Wang et al. (2001) Wang Q. D., Immler S., Walterbos R., Lauroesch J. T., Breitschwerdt D., 2001, ApJL, 555, L99
- Werk et al. (2013) Werk J. K., Prochaska J. X., Thom C., Tumlinson J., Tripp T. M., O’Meara J. M., Peeples M. S., 2013, ApJS, 204, 17
- Wetzel et al. (2016) Wetzel A. R., Hopkins P. F., Kim J.-h., Faucher-Giguère C.-A., Kereš D., Quataert E., 2016, ApJL, 827, L23
- Wiener et al. (2013) Wiener J., Zweibel E. G., Oh S. P., 2013, ApJ, 767, 87
- Wiener et al. (2017) Wiener J., Oh S. P., Zweibel E. G., 2017, MNRAS, 467, 646
- Wood et al. (2010) Wood K., Hill A. S., Joung M. R., Mac Low M.-M., Benjamin R. A., Haffner L. M., Reynolds R. J., Madsen G. J., 2010, ApJ, 721, 1397
- Yamamoto et al. (2021) Yamamoto Y., Okamoto T., Saitoh T. R., 2021, MNRAS, 504, 3986
- Zweibel (2013) Zweibel E. G., 2013, Physics of Plasmas, 20, 055501
- de Avillez & Breitschwerdt (2004) de Avillez M. A., Breitschwerdt D., 2004, A& A, 425, 899
- van Haarlem et al. (2013) van Haarlem M. P., et al., 2013, A& A, 556, A2
- van de Voort et al. (2016) van de Voort F., Quataert E., Hopkins P. F., Faucher-Giguère C.-A., Feldmann R., Kereš D., Chan T. K., Hafen Z., 2016, MNRAS, 463, 4533
- van der Walt et al. (2011) van der Walt S., Colbert S. C., Varoquaux G., 2011, Computing in Science Engineering, 13, 22
Appendix A The effects of MHD and CR diffusion coefficient
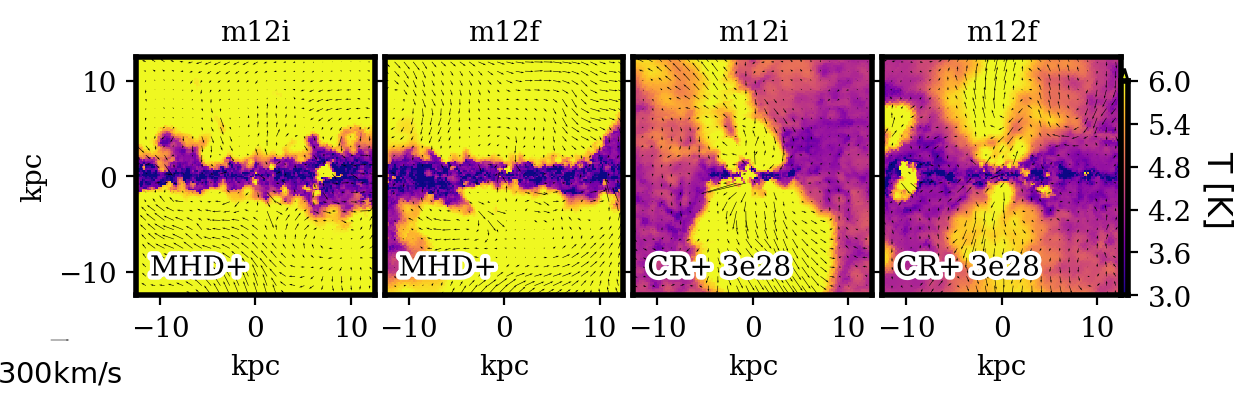
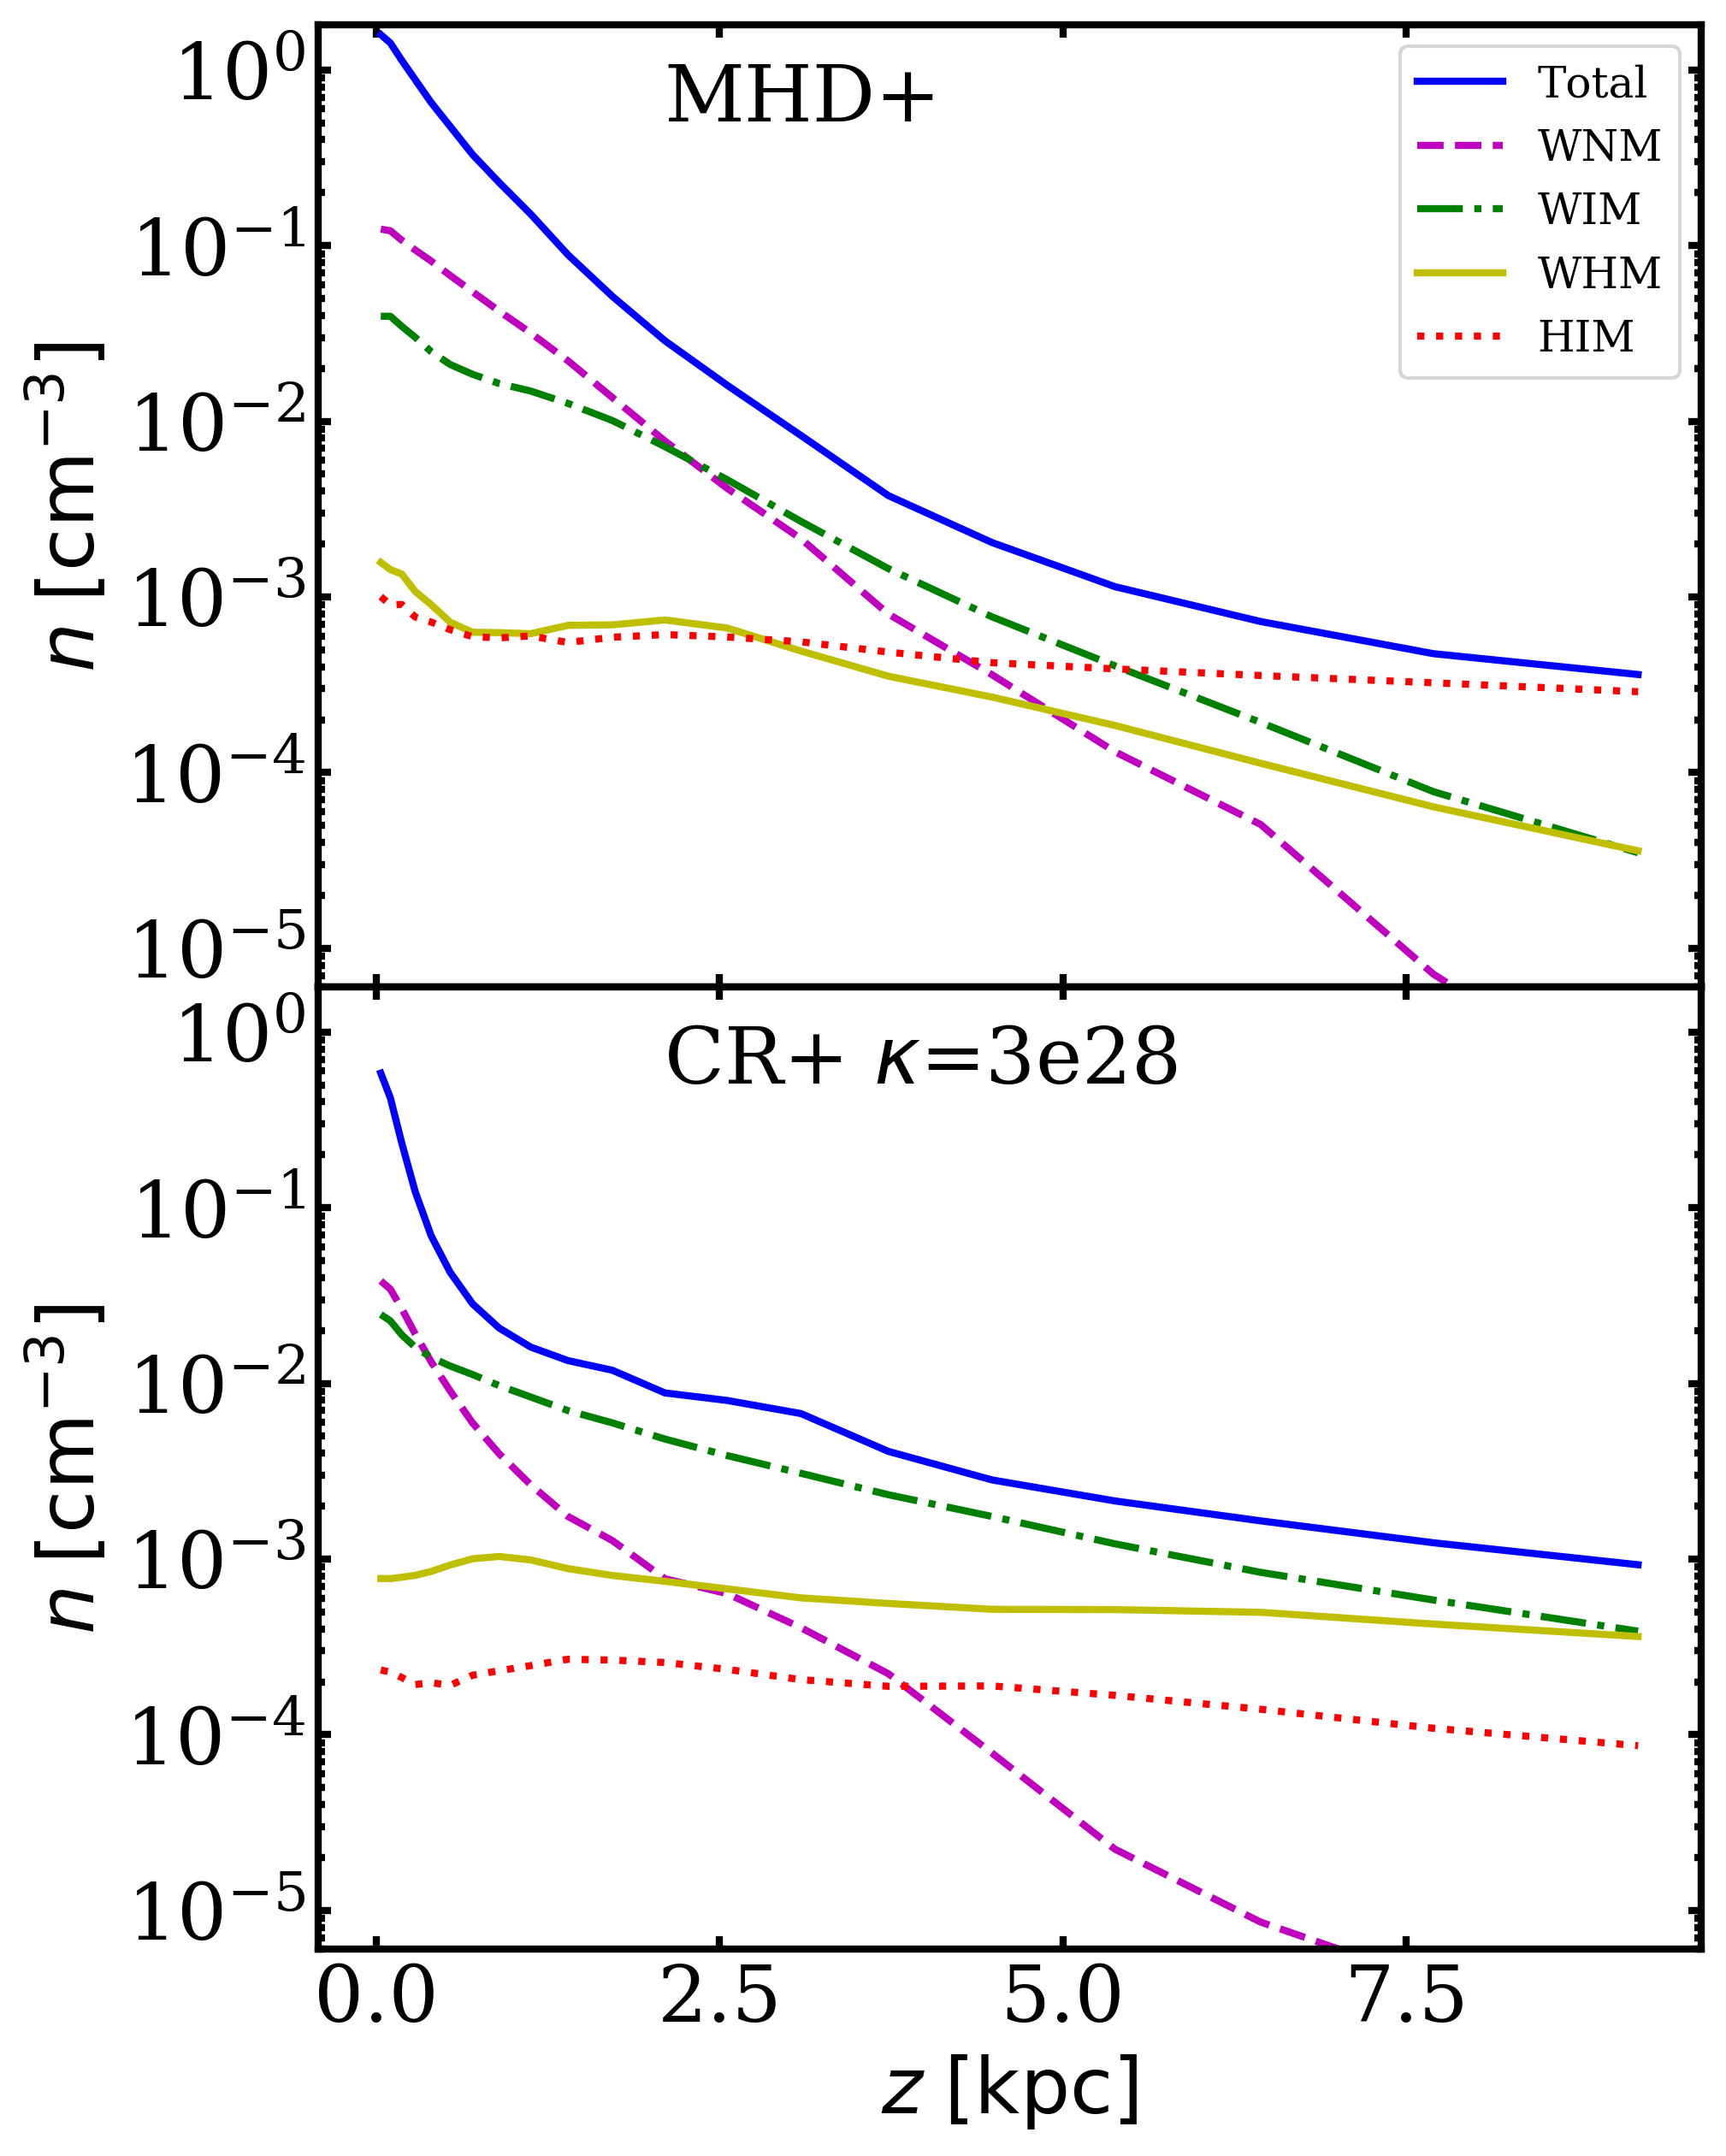
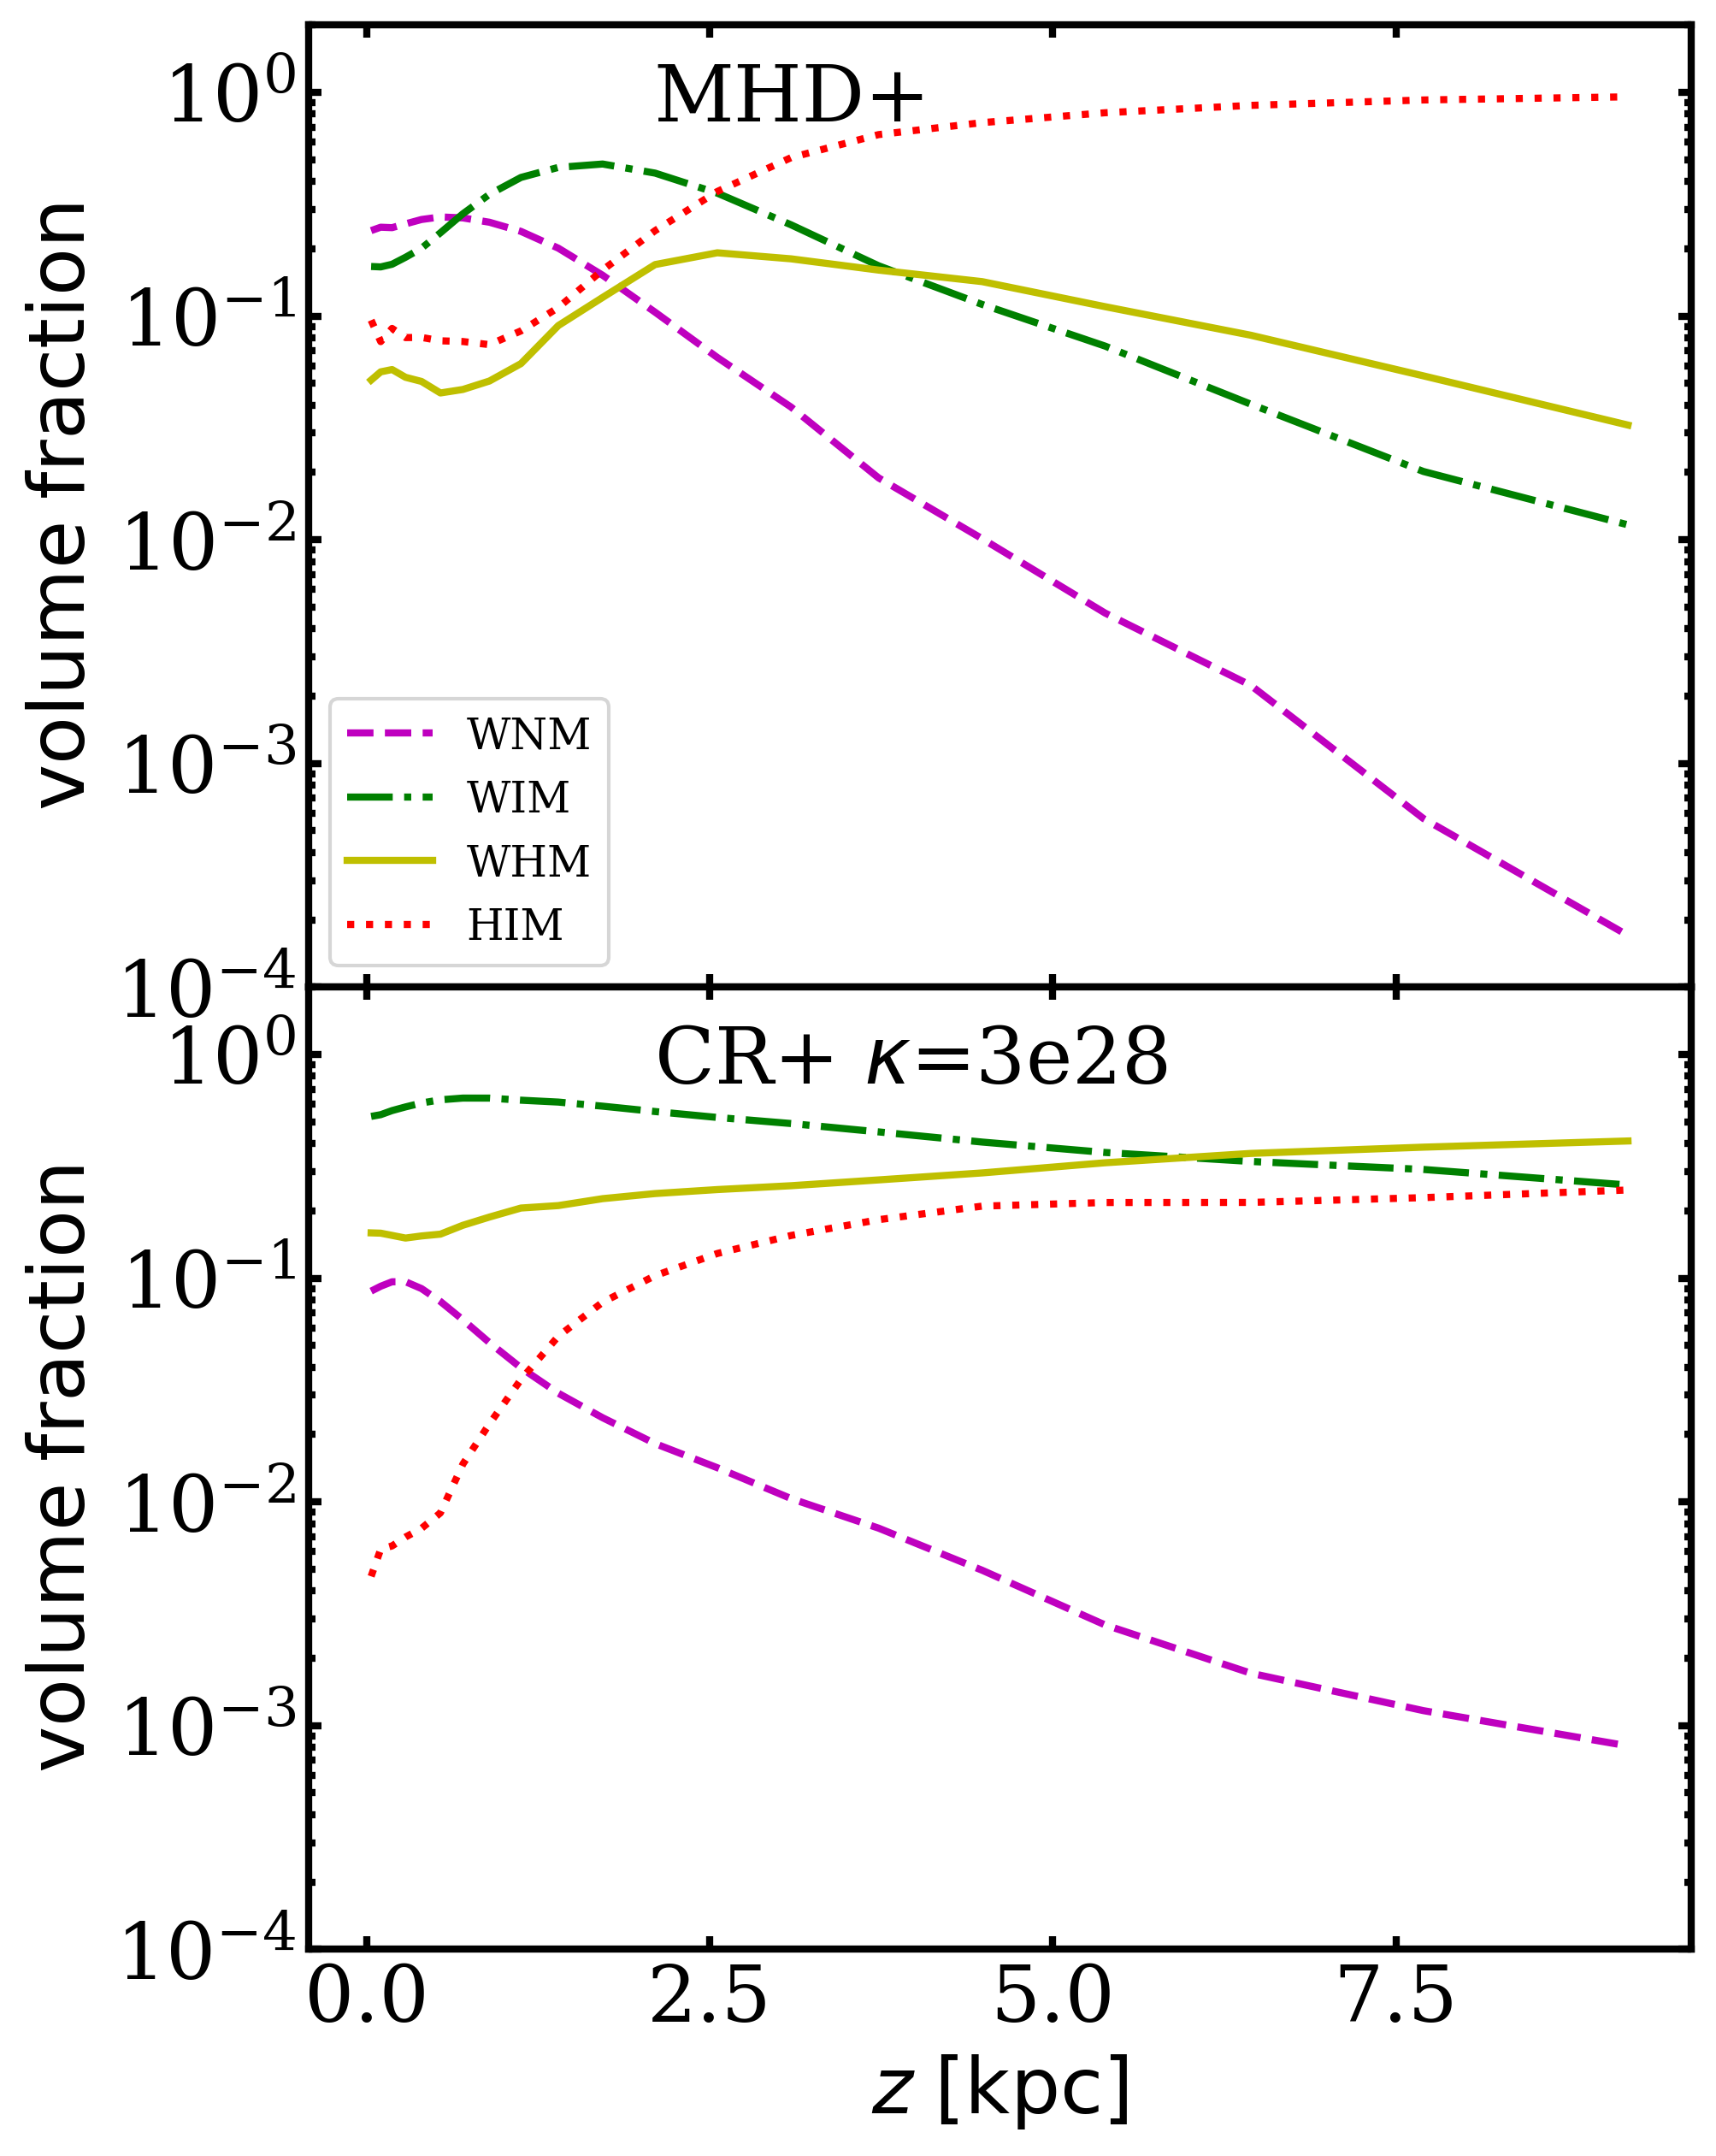
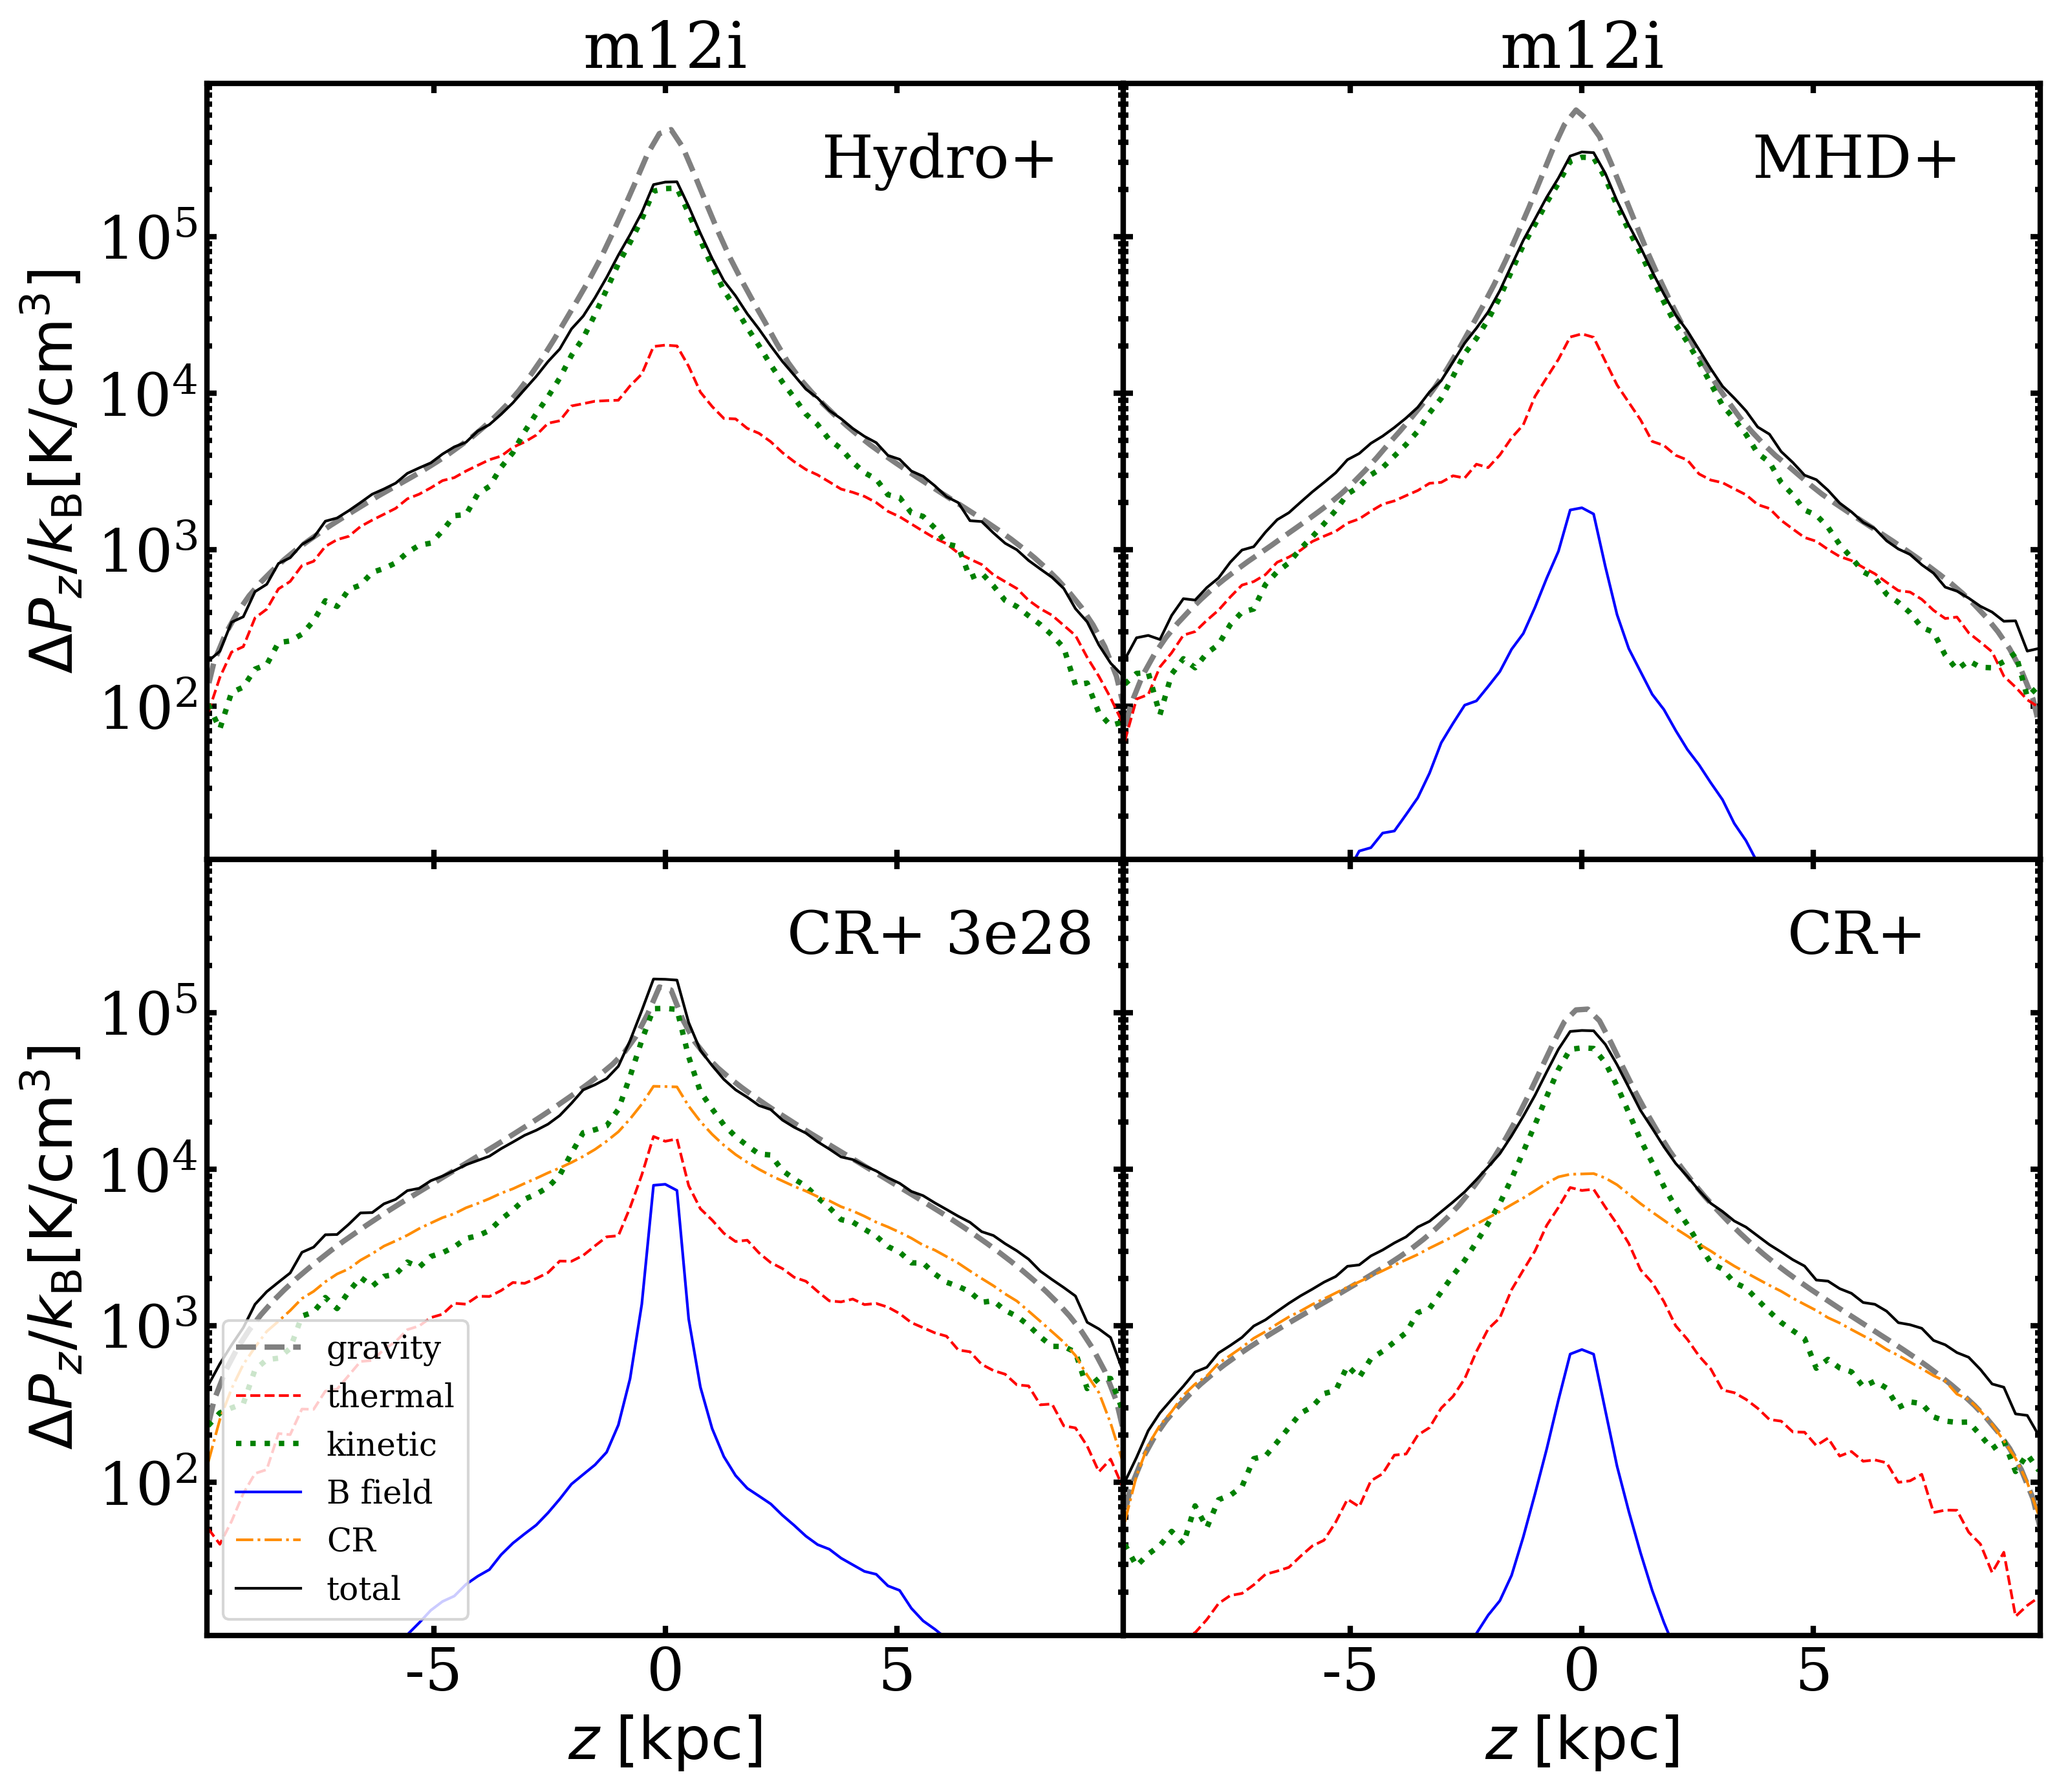
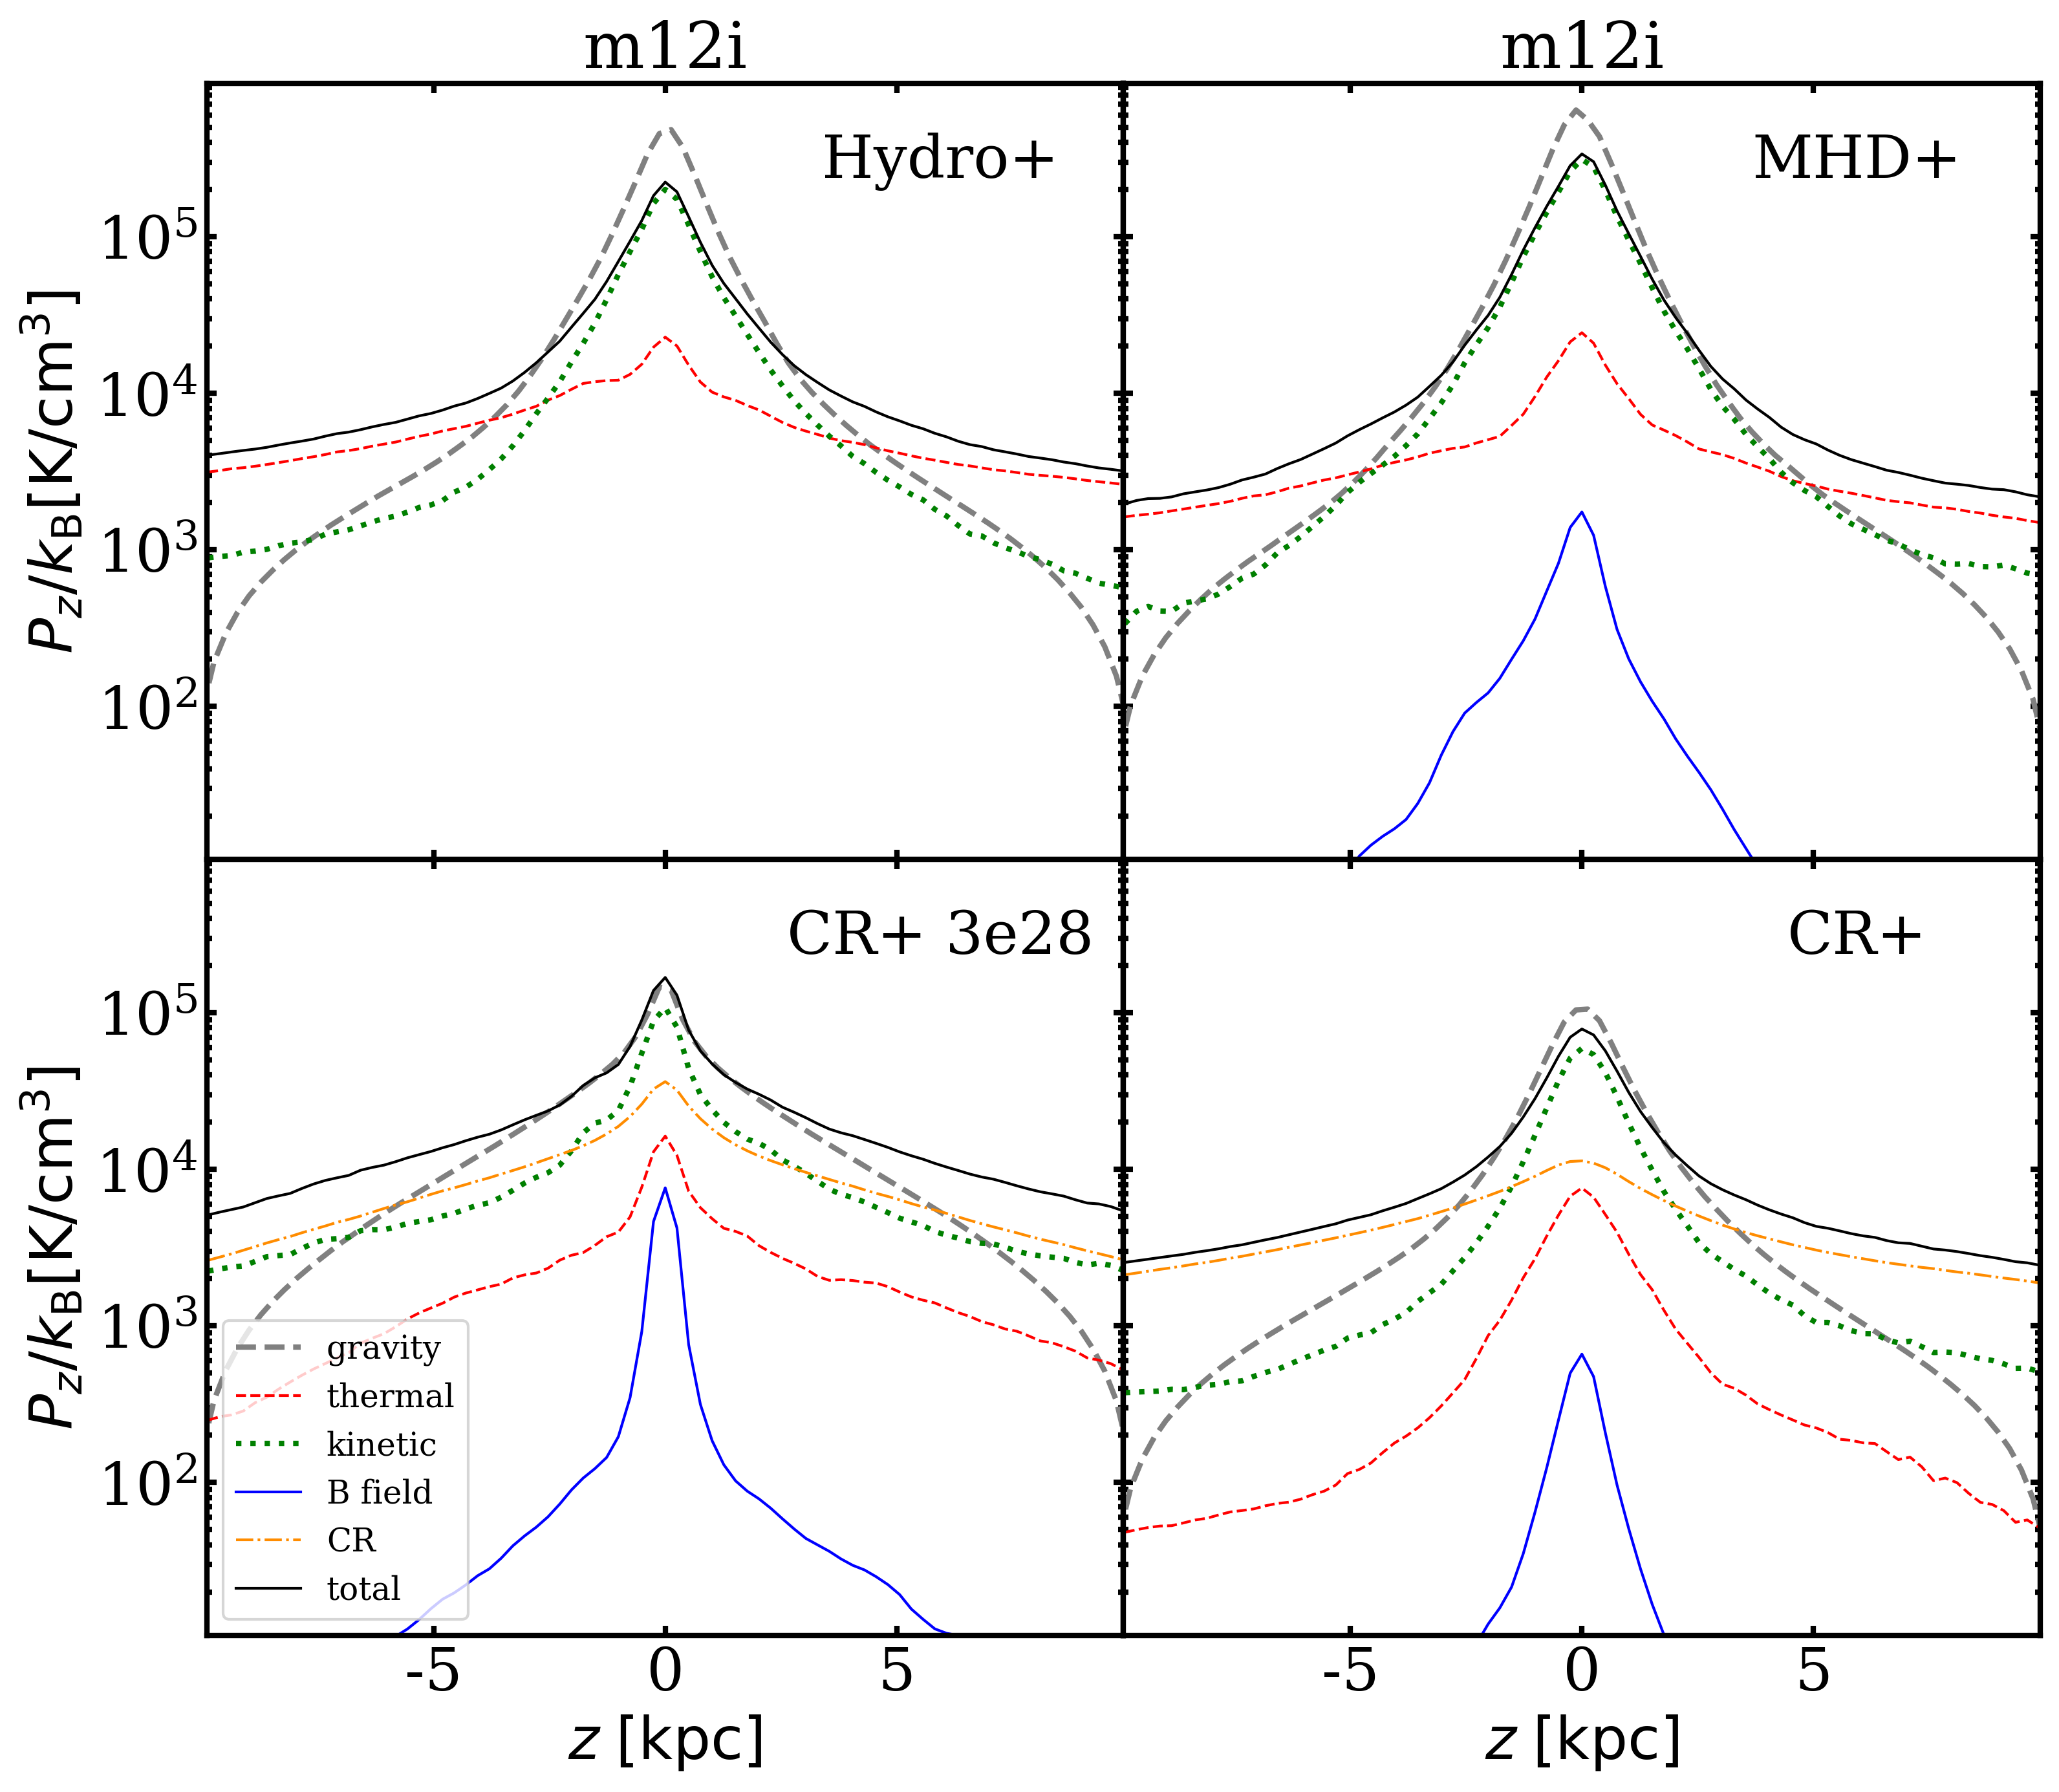
In the main text, we compare the FIRE simulations with hydrodynamics and CR feedback. Here we add comparisons with simulations with magneto-hydrodynamics without CRs (MHD+), and with a lower CR diffusion coefficient (anisotropic diffusion coefficient = , CR+3e28).
Fig. 13 shows the velocity and temperature of m12i and m12f in MHD+ and with lower diffusion coefficient. Hydro+ and MHD+ appear very similar to each other, but differ from CR+, which has significantly more warm gas and less hot gas. CR+3e28 has more hot gas than CR+, as expected from the weaker CR pressure outside of the ISM.
In Fig. 14 we show the vertical gas distribution in m12i simulations. MHD+ has similar behaviours as Hydro+, e.g. the HIM takes over others at large height. On the other hand, CR+3e28 is similar to CR+, except the hot gas is more extended. Volume filling fraction of the hot gas is also significantly higher in CR+3e28 compared to our default CR+ simulation.
The upper panels of Fig. 15 shows the dynamical support of these simulations. All of the runs satisfy approximate dynamical equilibrium. Hydro+ and MHD+ are both supported by thermal and kinetic pressures, whereas CR+ are supported by CRs at a large height . Magnetic tension is unimportant in both MHD+ and CR+ runs.
CR+3e28 has more extended and stronger thermal and kinetic pressures compared to the default CR+(3e29) with higher diffusivity. This is because the CR pressure is weaker above the disk, since CRs cannot escape the galaxies before significant hadronic loss, which also leads to higher -ray emission. The CR halos are less extended due to slower diffusion. However, dynamical balance still holds.
The lower panels of Fig. 15 shows the absolute pressure (not subtracting the pressure at 10 kpc). The panels emphasize the thermal (CR) pressures are the most extended and dominant components at > 5 kpc in Hydro+ (CR+).