Thermal melting of a quantum electron solid in the presence of strong disorder: Anderson versus Wigner
Abstract
We consider temperature-induced melting of a Wigner solid in one dimensional (1D) and two dimensional (2D) lattices of electrons interacting via the long-range Coulomb interaction in the presence of strong disorder arising from charged impurities in the system. The system simulates semiconductor-based 2D electron layers where Wigner crystallization is often claimed to be observed experimentally. Using exact diagonalization and utilizing the inverse participation ratio as well as conductance to distinguish between the localized insulating solid phase and the extended metallic liquid phase, we find that the effective melting temperature may be strongly enhanced by disorder since the disordered crystal typically could be in a localized glassy state incorporating the combined nonperturbative physics of both Anderson localization and Wigner crystallization. This disorder-induced enhancement of the melting temperature may explain why experiments often manage to observe insulating disorder-pinned Wigner solids in spite of the experimental temperature being decisively far above the theoretical melting temperature of the pristine Wigner crystal phase in many cases.
Introduction and background - Wigner predicted more than 80 years ago that an interacting electron liquid would crystallize at into a quantum solid at a sufficiently low density, below some dimension-dependent critical density, because of their long range Coulomb interaction Wigner (1934). The basic idea is simple: the quantum non-interacting kinetic energy (i.e. “quantum fluctuations”) for an electron density of in a -dimensional system typically goes as (for parabolic band dispersion typical of semiconductors) simply by virtue of the uncertainty principle whereas the Coulomb interaction potential energy ( 1/distance) goes as , implying that for low enough , the system would minimize the potential energy by crystalizing into a solid phase instead of being a liquid (as happens at higher densities) which minimizes the kinetic energy. Typically, the critical density separating the quantum Wigner solid and the electron liquid phase is very low, and observing a density-tuned quantum Wigner solid is a huge experimental challenge. On the other hand, if the temperature is much higher than the non-interacting Fermi temperature, the electrons undergo a liquid-to-solid transition with increasing density (in contrast to the quantum crystallization, happening with decreasing density at ) at a finite temperature. This is because the delocalization effect is now generated by thermal fluctuations instead of quantum fluctuations . Such a classical liquid to solid transition was indeed observed in two-dimensional (2D) electrons on the surface of liquid helium a long time ago Grimes and Adams (1979); Marty et al. (1980)
The current work focuses on the thermal melting of the quantum Wigner solid () in the presence of disorder. The density-temperature mean field phase diagram of the disorder-free pristine electron solid to liquid transition has been calculated in earlier works Hwang and Das Sarma (2001); Vu and Das Sarma (2020). In 2D systems, the solid-to-liquid density-tuned quantum transition occurs at , where is the usual dimensionless average electron separation measured in the units of effective Bohr radius with large implying strong interaction. For , the melting temperature of the Wigner solid is , and increases with increasing , eventually at large enough , at a given , the system enters the classical regime where . As a demonstration, for GaAs, the highest melting temperature for the Wigner solid was determined to be mK for Hwang and Das Sarma (2001) by interpolating between the classical Gann et al. (1979) and the quantum Tanatar and Ceperley (1989); Drummond and Needs (2009) theories. It is therefore extremely puzzling that there are many experimental claims of the observation of 2D quantum Wigner crystallization in GaAs based on transport measurements in 2D electron (or hole) gases confined in semiconductor layers, typically carried out around , where the theoretically predicted is much smaller than the experimental base temperature of 20 mK in the dilution fridge Sha ; Goldman et al. (1990); Yoon et al. (1999). scales approximately as , where are the effective mass and the background dielectric constant, so the maximum Wigner crystal melting temperature can reach mK for ZnO, mK for AlAs quantum well and as high as K for MoSe2 monolayers. In these new platforms, the critical also corresponds to a higher value of electron density, making them better candidates to host Wigner crystal. In fact, the Wigner crystal has been claimed to be observed in these systems Hossain et al. (2020); Smoleński et al. (2021); Falson et al. (2022); Hossain et al. (2022). However, our goal is not disproving the Wigner crystal claim in all experiments simply because the melting temperature is higher than the theoretically predicted value, but instead pointing out a real possibility that if the impurity density is comparable to the carrier density, the disorder-induced insulator can exhibit the same localized-delocalized transition as the thermal melting of the Wigner crystal with increasing temperature.
In the current work, we propose and validate by exact small system numerical calculations that the correct interpretation of these GaAs-based Wigner crystal experimental observations lies in including disorder effects in the theory. In particular, disorder in some sense enhances the effective melting temperature of the localized solid insulating phase compared with the extremely low melting temperature of the pristine system. Since the disorder in the high quality semiconductor layers arises invariably from random charged impurities which also interact with the electrons via the same long range Coulomb coupling as the electron-electron mutual interaction itself is, it is imperative to include both electron-impurity and electron-electron interactions on an equal footing. In fact, the value of 40 () in 2D GaAs electron layers corresponds to a 2D carrier density of , which is likely to be comparable to or smaller than the random charged impurity density even in the highest quality semiconductor structures Das Sarma et al. (2015); Watson et al. (2011), thus reinforcing the necessity of treating both electron-electron and electron-impurity interactions on an equal nonperturbative footing.
Model and theory - In order to calculate the transport properties of an interacting electron system nonperturbatively in the presence of quenched charged impurities, we set the impurity potential is thus deterministic instead of the usual random disorder model. We perform simulations on both the 1D and 2D geometries. Since our interest is the thermal melting of the electron solid phase, the 1D calculation should provide a good qualitative description for what happens also in 2D because the pristine Wigner solid to quantum liquid density-temperature phase diagrams are essentially identical qualitatively in 1D and 2D as can be seen by comparing Fig. 8 in Ref. Vu and Das Sarma (2020) for the 1D phase diagram with Fig. 4 in Ref. Hwang and Das Sarma (2001) for the 2D phase diagram. Most of this paper presents 1D results but in fact, our 1D and 2D calculations produce very similar features. The small system size of our simulation makes the localized-delocalized transition necessarily a crossover, so what we address is not so much the absolute quantitative phase diagram, but how increasing disorder affects the transport properties at finite temperatures, particularly whether localization persists to higher temperatures in the solid phase with increasing disorder.
Our model is minimal: A finite 1D chain (or 2D square) of lattice sites with interacting spinless fermions with a hopping energy , where is the lattice constant and with periodic boundary conditions. The use of spinless fermions is only for computational convenience, and affects no aspect of the key issues we address as we are not interested in the difficult energetic question of whether the solid phase is ferromagnetic or not (which necessitates a calculation of very small exchange energies to better than precision) Vu and Das Sarma (2020). The 1D interacting Hamiltonian (see the Supplemental Materials Sup for the 2D Hamiltonian) is given by
| (1) |
with the interaction being the long-range Coulomb coupling
| (2) |
and the impurity-induced potential being
| (3) |
with is the short-range regularization and is the position of the impurity (note that the impurity potential is long-ranged consistent with the known disorder in semiconductor materials arising from quenched charged impurities Das Sarma et al. (2015); Watson et al. (2011)). The sine function ensures the periodic boundary condition. We diagonalize the Hamiltonian exactly and obtain the occupancies at finite temperature through the usual canonical thermal distribution with being the partition function. Using the exact , we calculate the key operational quantity defining transport, namely, the inverse participation ratio, IPR, defined by:
| (4) |
It is well-known that a localized insulating (extended metallic) system has IPR = 1 (0) in the thermodynamic limit, and the IPR is used extensively in studying electronic transport properties both for interacting and for noninteracting systems. There is, however, a serious problem in finite systems, where the IPR is always finite and simply because even localized states can never have strictly zero conductance in finite systems. Typically small (large) IPR values are associated with metallic (insulating) states, and we make the arbitrary distinction that IPR denotes the insulating solid (metallic liquid) phase. This is the quantum melting analog of the extensively used Lindemann criterion in classical statistical mechanics where melting is arbitrarily defined by the thermal mean square fluctuations of the solid phase around individual equilibrium sites being larger than some predefined amount in units of inter-particle separation. We emphasize that due to the crossover characteristic, the critical IPR-value (e.g. 0.4) does not have unique value. However, we show in the Supplemental Materials that this value is reasonable across multiple system sizes; moreover, redefining the IPR criteria can change the quantitative value of the melting temperature but does not alter the picture of Wigner-Anderson competition Sup . One cautionary note in order to avoid any confusion is that the hopping kinetic energy in our lattice model is equivalent to the Fermi energy or density in the standard continuum electron gas model (as applies to the semiconductor-based experimental systems), so we should loosely think of the lattice spacing in our lattice model as qualitatively equivalent to in the electron gas model and the variation of as the tuning the carrier density in experiments. All the parameters in our model are dimensionless with the only relevant physical scales being the effective Bohr radius and the effective electron mass. The dimensionless is physically the impurity charge relative to the carrier charge.
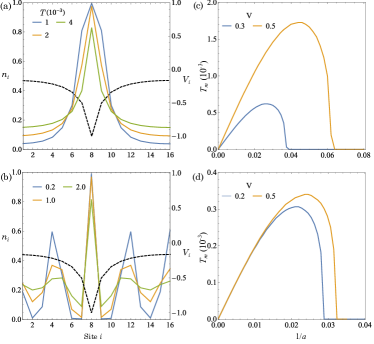
Results and discussion - We first study the system with a single impurity. In Fig. 1(a), we compute the density distribution at finite temperature of the non-interacting 1D lattice. Without the interaction, the localized phase is a disorder-induced Anderson insulator as can be seen from the bunching of electron density around the impurity potential minimum. In the presence of interaction [Fig. 1(b)], the localized phase at low temperature becomes a Wigner crystal with equally spaced density peaks. For both Anderson insulator and Wigner crystal, increasing the temperature weakens the density modulation, resulting in a crossover to the conducting/liquid phase. As mentioned above, by choosing an arbitrary critical IPR, we can identify the melting temperature separating the solid/insulating with the liquid/conducting phases. For the Wigner crystal, is nonmonotonic, vanishing for large and zero kinetic energy and manifesting a maxima close to the vanishing of at large kinetic energy. These general features also exist in the Anderson insulator because the impurity potential has the same long-range dependence, making the two phase diagrams (Anderson insulator and Wigner crystal) impossible to distinguish qualitatively. The distinction, however, becomes apparent when we tune the impurity strength as the phase boundary of the Anderson insulator significantly widens with increasing while that of the Wigner crystal only changes moderately mostly near the quantum critical [see Fig. 1(c,d)].
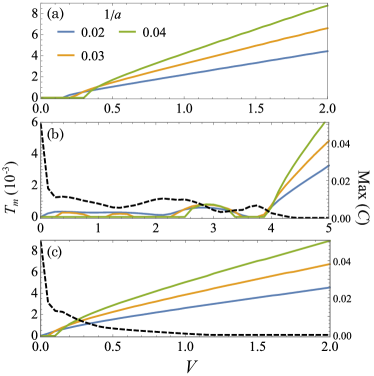
Inspired by the preliminary results, we focus on the variation of the melting temperature with respect to the impurity strength, which is the main result of our paper. Figure 2(a) shows the non-interacting (Anderson insulator) growing linearly with except for a very small initial range. In the linear regime, the melting temperature also progressively increases with the density, signaling the classical behavior. These feature are easy to understand if we assume the melting happens when with the electron-impurity energy . Remarkably, in the presence of the inter-electron interaction, the similar function displays a Wigner-to-Anderson ‘transition’ at where increases monotonically with , indicating that the insulating phase is stabilized by increasing disorder in contrast to the behavior for where the system is essentially a Wigner solid with small as found in Hwang and Das Sarma (2001); Vu and Das Sarma (2020). Rather amazingly, this Wigner-to-Anderson transition in Fig. 2b looks essentially like a sharp transition at a critical almost independent of carrier density . We also compute the density-density correlation
| (5) |
which can only take positive values in the strongly interacting Wigner crystal phase Vu and Das Sarma (2020). The maximum value at the melting temperature shown in Fig. 2b displays a visible drop at , indicating that the localized phase is indeed Wigner (Anderson) for .
We note that in our simulation, by changing the length scale while keeping the number of electrons and impurities fixed, we are effectively tuning the carrier and impurity density proportionally. In reality, only the electron density can be dynamically tuned through the applied gate voltage. As a result, when the electron liquid is diluted experimentally to obtain the quantum Wigner crystal, its density might be comparable to (or even less than) that the impurity density. We can increase the relative by adding more impurities to the lattice. In Fig. 2c, we compute the melting temperature in the case of two impurities with equal strength placed at . Even though the relative impurity density only increases two fold, the critical characterized by the sharp drop in the density correlation decreases 8-fold to from . This shows that if the impurity density is comparable to the carrier density, the localized phase is most likely an Anderson insulator. We also repeat the computation in the case where impurities are present at all the sites but with randomized strength and the critical is also significantly reduced. We believe that Figs. 2(b, c) provide the explanation for why the low-density 2D electron systems generically manifest strongly insulating solid-like behavior at temperatures far above the putative melting temperature of the pristine Wigner crystal. It is simply because the realistic solid phase is essentially an Anderson insulator with a large because of the invariable presence of quenched random charged impurities in the environment.
We have also calculated density patterns and the density correlations in the various finite-temperature phases ensuring that indeed the three phases, metallic liquid (), Wigner solid and Anderson insulator, manifest the expected behavior well-known for these phases: metallic liquid exhibiting uniform density throughout, Wigner solid phase showing the periodic density modulation, and Anderson insulator exhibiting a density localized at impurities. We also compute the electrical conductance in the Supplemental Materials Sup , confirming its consistency with the IPR characterization presented in the paper.
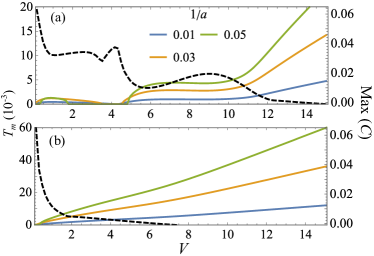
Relation to 2D systems - We believe the conclusions drawn from our 1D simulations (Figs. 1 and 2) are qualitatively applicable to 2D systems as long as the electron band has quadratic dispersion and the electron-electron as well as impurity-electron interactions are long-range. Specifically, the thermal energy , the Coulomb energy and the kinetic energy . The reason is that the melting of Wigner crystal or Anderson insulator is essentially due to the different scaling behaviors of the terms in the Hamiltonian, regardless of the dimensionality. Moreover, for , both 1D and 2D systems manifest Anderson localization without a critical disorder strength. To verify this argument, we change the 16-site 1D chain into a square with 2D hoppings and interactions and repeat the same IPR characterization (see Sup for details). The melting temperature in the case one and two impurities are shown in Figs. 3(a) and (b) respectively. Similar to the 1D case, there exists a critical below (above) where the localized phase is a Wigner crystal (Anderson insulator). This critical impurity strength again (as in 1D) is significantly suppressed when the relative impurity density increases.
Conclusion - Using the exact diagonalization technique, we study the thermal melting of a disordered interacting Wigner solid, finding that increasing disorder causes a sharp crossover from the Wigner solid to the Anderson insulator with a concomitant increase in the melting temperature. A direct qualitative implication of our theory is that the experimentally observed low-density insulating phase is most likely an Anderson insulator. Pushing the carrier density far below the critical density for the pristine electron liquid to Wigner solid phase does not favor the Wigner crystalization but in fact makes disorder effect even stronger since the impurity density in a given sample is fixed, and lowering the carrier density invariably enhances the effective disorder. The typical maximum melting temperature of the pristine Wigner solid phase is extremely low ( mK for GaAs, K for TMD), but disorder enhances this melting temperature substantially creating a crossover Anderson-Wigner glassy phase with high melting temperature as shown in the current work.
The fact that disorder must always dominate the low-density phase is easily seen from a simple scaling argument involving the energetics of kinetic energy, Coulomb interaction, and Coulomb disorder, which scale respectively as , , and as a function of the 2D carrier density . Thus, while it is indeed true that with no disorder, eventually the Coulomb interaction dominates the kinetic energy at low enough , leading to Wigner crystallization at low density in the pristine system, the behavior of the disordered interacting system is fundamentally different from the pristine system since Coulomb disorder becomes by far the most dominant effect (going as ) at low enough density. This means, no matter what, the system is asymptotically always an Anderson insulator at low enough density as long as there is any disorder! Our exact results explicitly verify this qualitative dominance of Anderson over Wigner at low densities. We note that the same remains true, although in a quantitatively weaker manner, for strongly screened Coulomb disorder or even strict short-range disorder since the energy scale of such a short-range disorder is (i.e. independent of density), which would eventually dominate the kinetic energy () and the Coulomb interaction energy () at low enough density. Thus the eventual dominance of Anderson over Wigner is guaranteed in all electronic materials studied in the laboratory, and therefore, an insulating Anderson localized phase is always the ultimate low-density phase of all metals. An equivalent physical way of saying the same thing is that a given sample has a fixed impurity density , and for low enough carrier density , disorder must always eventually win over interaction.
Acknowledgements.
Acknowledgment - This work is supported by the Laboratory for Physical Sciences.References
- Wigner (1934) E. Wigner, Phys. Rev. 46, 1002 (1934).
- Grimes and Adams (1979) C. C. Grimes and G. Adams, Phys. Rev. Lett. 42, 795 (1979).
- Marty et al. (1980) D. Marty, J. Poitrenaud, and F. Williams, J. physique Lett 41, 311 (1980).
- Hwang and Das Sarma (2001) E. H. Hwang and S. Das Sarma, Phys. Rev. B 64, 165409 (2001).
- Vu and Das Sarma (2020) D. Vu and S. Das Sarma, Phys. Rev. B 101, 125113 (2020).
- Gann et al. (1979) R. C. Gann, S. Chakravarty, and G. V. Chester, Phys. Rev. B 20, 326 (1979).
- Tanatar and Ceperley (1989) B. Tanatar and D. M. Ceperley, Phys. Rev. B 39, 5005 (1989).
- Drummond and Needs (2009) N. D. Drummond and R. J. Needs, Phys. Rev. Lett. 102, 126402 (2009).
- (9) Mansour Shayegan, private communication.
- Goldman et al. (1990) V. J. Goldman, M. Santos, M. Shayegan, and J. E. Cunningham, Phys. Rev. Lett. 65, 2189 (1990).
- Yoon et al. (1999) J. Yoon, C. C. Li, D. Shahar, D. C. Tsui, and M. Shayegan, Phys. Rev. Lett. 82, 1744 (1999).
- Hossain et al. (2020) M. S. Hossain, M. Ma, K. V. Rosales, Y. Chung, L. Pfeiffer, K. West, K. Baldwin, and M. Shayegan, PNAS 117, 32244 (2020).
- Smoleński et al. (2021) T. Smoleński, P. E. Dolgirev, C. Kuhlenkamp, A. Popert, Y. Shimazaki, P. Back, X. Lu, M. Kroner, K. Watanabe, T. Taniguchi, et al., Nature 595, 53 (2021).
- Falson et al. (2022) J. Falson, I. Sodemann, B. Skinner, D. Tabrea, Y. Kozuka, A. Tsukazaki, M. Kawasaki, K. von Klitzing, and J. H. Smet, Nature materials 21, 311 (2022).
- Hossain et al. (2022) M. S. Hossain, M. K. Ma, K. A. Villegas-Rosales, Y. J. Chung, L. N. Pfeiffer, K. W. West, K. W. Baldwin, and M. Shayegan, Phys. Rev. Lett. 129, 036601 (2022).
- Das Sarma et al. (2015) S. Das Sarma, E. H. Hwang, S. Kodiyalam, L. N. Pfeiffer, and K. W. West, Phys. Rev. B 91, 205304 (2015).
- Watson et al. (2011) J. D. Watson, S. Mondal, G. A. Csáthy, M. J. Manfra, E. H. Hwang, S. Das Sarma, L. N. Pfeiffer, and K. W. West, Phys. Rev. B 83, 241305(R) (2011).
- (18) See Supplemental Material for Two-dimensional lattice, Linear response electrical conductance, and IPR criterion for the melting temperature.