Real-space observation of emergent complexity of
phase evolution in micrometer-sized IrTe2 crystals
Abstract
We report complex behaviors in the phase evolution of transition-metal dichalcogenide IrTe2 thin flakes, captured with real-space observations using scanning Raman microscopy. The phase transition progresses via growth of a small number of domains, which is unlikely in statistical models that assume a macroscopic number of nucleation events. Consequently, the degree of phase evolution in the thin flakes is quite variable for the selected specimen and for a repeated measurement sequence, representing the emergence of complexity in the phase evolution. In the 20-m3-volume specimen, the complex phase evolution results in the emergent coexistence of a superconducting phase that originally requires chemical doping to become thermodynamically stable. These findings indicate that the complexity involved in phase evolution considerably affects the physical properties of a small-sized specimen.
Condensed matter physics targets many-body systems consisting of atoms/electrons/spins on the order of 103–1020. The trajectories of individual constituents in phase space generally show complex and unpredictable behaviors as a result of many-body and/or non-linear interactions. Moreover, it is also unlikely that the exact same microscopic state will be reproduced. Nevertheless, such complexity or chaotic behavior occurring at the microscopic level usually does not cause serious uncertainty about measurements of macroscopic quantities, which are proportional to ; the underlying complex trajectories are simply observed as fluctuations around the equilibrium state, giving rise to a standard deviation proportional to . Thus, uncertainty about the measured value decreases in proportion to 1/, and this scaling ensures the validity of the statistical approach for condensed matter [1].
We shall consider phase evolution of a many-body system from metastable to stable states. Because such a phase evolution generally occurs via nucleation and subsequent growth of the final-state domains, the relevant constituents describing the phase evolution are domains. For clarity, let us assume that one nucleation event result in the formation of a final-state domain of volume 13–103 m3; then, the phase transformation of a 1-mm3 system would include 106–109 nucleation events. This number is still macroscopic, and therefore, one can discuss, for instance, the time evolution of the volume fraction of the final state, (), as statistically well-averaged, reproducible behavior [2, 3, 4]. In this context, the Johnson-Mehl-Avrami-Kolmogorov (JMAK) equation [2], ( ( and are the so-called JMAK parameters), or other smooth functions have been widely used and successfully applied to isothermal phase evolutions in liquids [5, 6], alloys [7], and correlated electron systems [8, 9, 10, 11, 12, 13, 14]. Thus, irregular complex phase evolution involved at the microscopic level [15, 16, 17] does not clearly appear in the macroscopic phase evolution, such as ().
Such a statistical perspective on phase evolution, however, may become less suitable when the system size is small enough that the number of involved nucleation events is not macroscopic. For instance, real-space imaging measurements have revealed that in a colloidal droplet consisting of only 4,000 particles, a few nucleation events, followed by the growth of the nuclei, are sufficient to complete the crystallization of the entire droplet [18]. Such a small number of nucleation events obviously undermines the basis of the statistical perspective, thus implying that complex behavior can appear in a phase evolution of the whole system. The understanding of such complexity involved in the phase evolution is of increasing importance because contemporary sample fabrication techniques have enabled phase control of materials in solid-state nanodevices [19, 20, 21]. However, this understanding remains elusive thus far, particularly in electron/spin many-body systems.
To examine such variable phase evolution, we targeted the transition-metal dichalcogenide IrTe2. This material exhibits a first-order transition from the Ir-undimerized (UD) state (trigonal, m1) to the Ir-dimerized (D) state (triclinic, ) at 280–284 K [22, 23]. When Pd/Pt/Cu/Rh is doped into IrTe2, the UD state is stabilized down to the lowest temperature, thereby exhibiting a superconducting transition with 3.0 K (optimal) [24, 25, 26, 27]. By exfoliating an IrTe2 bulk crystal, a small-sized thin-flake sample can easily be prepared, and this material is therefore suitable for studying the complexity involved in phase evolution. Moreover, an IrTe2 thin flake (for instance, a sample volume of 10–20 m3) has been found to exhibit signatures of superconductivity with 3.1–3.3 K (ref. [28, 29]. See also Fig. 4(a)) even without performing chemical doping; thus, determining how the complexity of the phase evolution affects the lowest-temperature state in a small-sized specimen is also interesting. This issue will also be discussed in this Letter.
In this study, we performed real-space imaging on the entire area of IrTe2 thin plates by using scanning Raman microscopy, with particular interest in the phase evolution. Low-temperature scanning Raman microscopy was performed with a commercially available confocal Raman setup (attoRAMAN, attocube). A low-temperature-compatible objective lens (NA = 0.82, LT-APO 532-RAMAN, attocube) was placed in a cryostat and located 500 m above the sample surface, enabling low-temperature Raman imaging with a spatial resolution of 300 nm (the wavelength of the excitation laser is 532 nm). The Raman signal was collected in the backscattering configuration and detected by a charge-coupled spectrometer with a grating of 1,800 lines mm-1 (for details, see [30]). The probing depth was estimated to be 10 nm by measuring how the signal intensity for the Si substrate underneath the IrTe2 thin flakes varies with the flake thickness (Fig. S1 [30]).
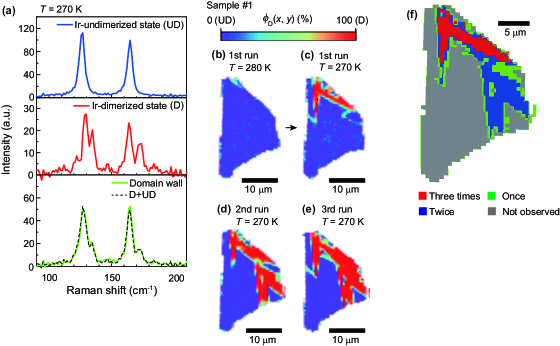
The typical Raman spectra of the UD and D phases are shown in Fig. 1(a), in the top and middle panels [31, 32], respectively. The Raman spectrum was measured at each pixel during scanning, and it almost exclusively belonged to either the UD or D phase. Near the domain walls (DWs) separating the two phases, a distinct Raman spectrum was observed, but it was successfully reproduced by superposition of the Raman spectra of the two phases [Fig. 1(a), bottom panel]. Real-space imaging of the two-phase coexistence was thus constructed [30]. For extracting the complexity of the phase evolution, we focused on whether the results were reproducible for the same sample and whether different propensities were observed for different sample sizes. In the following experiments, we chose the fully UD state at 300 K as the initial state and performed a specific measurement sequence.
We first examined the complexity involved in the nucleation process by scrutinizing the appearance of the initial D domain upon cooling from 300 K. The same measurement sequence was repeated three times for an IrTe2 thin plate (sample #1: perimeter 77 m, thickness 480 nm, and volume 160 m3), and the first D domain appeared at a temperature between 270 and 280 K every time [for instance, see Figs. 1(b),(c)]; thus, the transition-onset temperature was roughly reproducible. To gain insight into the reproducibility of the initial domain, we compared the three images obtained at 270 K in each sequence run [Figs. 1(c)–(e)]. In Fig. 1(f), we superposed Figs. 1(c)–(e) and produced a color representation of the frequency of the D domain found at a given pixel. The probability distribution of finding the initial D domain is weighted to certain areas of the specimen, indicating that nucleation sites activated at 270 K are heterogeneously imprinted on this specimen. We note that the fully UD state at 280 K appears to be homogeneous with respect to the Raman shift (Fig. S2 [30]), and thus detection of the heterogeneous nucleation sites is an issue beyond the experimental resolution.
Such a heterogeneous nucleation mechanism is expected to emphasize the variations in nucleation probabilities among different samples, particularly when the sample size is small. For instance, Fig. 1(f) implies that if sample #1 was further broken into smaller pieces, then whether the D domain appears at 270 K would depend on the piece. As inferred in this thought experiment, whether a selected piece contains a nucleation site that has sufficient nucleation probability at a considered temperature is thus increasingly unpredictable as the sample size decreases. This complexity involved in the nucleation process indicates that a deeply supercooled UD state with no D domain may be found in a small sample. By contrast, such a situation is not expected to be probable in a large sample, which is thought to invariably contain activated nucleation sites somewhere in the sample.
To verify this issue, we performed consecutive domain imaging for a thermal cycle of 300 200 300 K for sample #1 and a smaller sample #2 ( 49 m, 160 nm, and 22 m3), and the results are displayed in Fig. 2(a) and Fig. S3 [30], respectively. The temperature evolution of the D domain volume fraction [Fig. 2(b)] shows that the temperature at which the first D domain appears is appreciably lower in sample #2 than in sample #1, consistent with the above expectation and the transport measurements in the literature [33]. We also note that the D-to-UD transition temperatures observed upon heating are nearly the same as that of the bulk crystal [23, 33], implying that the thermal equilibrium phase diagrams of the two samples are affected only weakly by sample smallness at the level considered. Thus, the observed deep-supercooling phenomena in the smaller sample (#2) can be accounted for primarily by the absence of active nucleation sites, rather than by a decrease in the equilibrium transition temperature. For an even smaller sample, the D-to-UD transition temperature is appreciably lower than that of the bulk sample (Fig. S4 [30]; see also [34]), and we excluded such a small sample in the present study (for more details, see [30]).
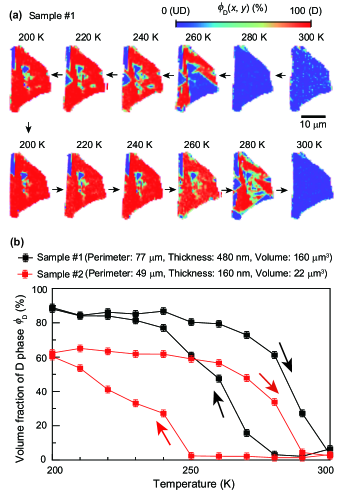
To understand the size-dependent supercooling phenomena in more detail, it may be important to consider nucleation at the perimeter. The close inspection of Fig. 2(a) and Fig. S3 [30] reveals that during the structural transition, both on heating (D to UD) and cooling (UD to D), new structural domains tend to appear near the perimeter of the flakes. This preferred nucleation at the perimeter may be explained by considering that nucleation near the free boundaries is helpful in reducing the interfacial strain energy associated with the DW area [7] and/or the bulk strain energy associated with the volume difference between the high- and low-temperature phases [35]. Thus, the complexity regarding the heterogeneous nucleation process in IrTe2 thin flakes is likely to be more sensitive to the microscopic details of the perimeter, rather than those of the bulk.
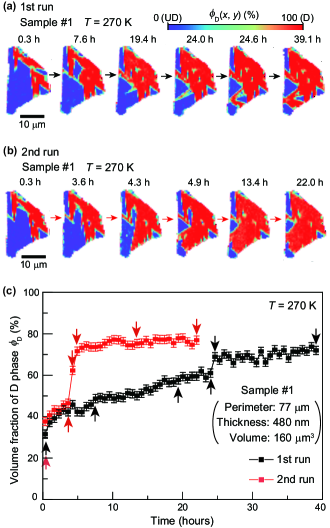
We next examined the complexity involved in the growth process of the D domain. Isothermal consecutive domain imaging was performed for sample #1 at 270 K, and the sequence was repeated two times [Figs. 3(a),(b)]. The time evolutions of the volume fractions of the D phase, (), were thus derived as shown in Fig. 3(c). Overall, in the first run, the volume fraction gradually increased with time, but it exhibited an abrupt increase when 24 hours passed after beginning the observations. Interestingly, in the second run, an abrupt increase with a larger magnitude was observed at an earlier elapsed time, even though we nominally used the same measurement procedure from 300 K. Obviously, the () profile obtained in each sequence is not reproducible, and moreover, it cannot be described by a function as smooth as the statistical model predicts. Thus, the complexity involved in the growth process is manifested in the () profile, a situation that is not expected in a sufficiently large sample. The close inspection of two successive domain images [at 24.0 h and 24.6 h in Fig. 3(a), or at 3.6 h and 4.3 h in Fig. 3(b)] suggests that the intermittent pinning and depinning of DWs underlie the observed complexity.
Finally, we discuss how the complexity involved in the phase evolution is linked to the superconductivity emerging in the nondoped small-sized IrTe2. As shown in Fig. 4(a), the nondoped IrTe2 specimens of 10–20 m3 are prone to exhibit signatures of superconductivity, whereas those of 100 m3 are not [29]. We performed domain imaging at 2 K and found that, reflecting the size-dependent transport properties, samples #1 and #2 were in different domain states. Sample #1 exhibited a fully D state [Fig. 4(b)], as expected from the phase diagram of the bulk sample; thus, the complex phase evolution does not appear to have a significant impact on the lowest-temperature state in sample #1 after all. By contrast, the smaller sample (#2) exhibited pronounced coexistence of the D and UD phases [Fig. 4(c)], implying that the complex intermittent depinning of the DWs ceased during cooling to 2 K in sample #2. The resulting quenched UD phase is thus thought to be the origin of superconductivity in the nondoped IrTe2 thin flakes of 10–20 m3. In fact, in doped bulk IrTe2, superconductivity appears when the UD phase is thermodynamically stabilized down to the lowest temperature [27], and thus it is plausible that the quenched UD phase exhibits superconductivity.
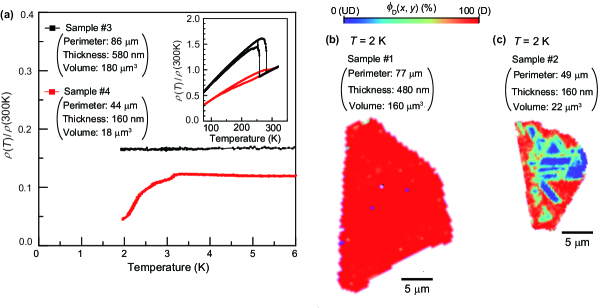
The scenario in which the complexity of the phase evolution underlies the emergent lowest-temperature state in sample #2 is further supported by the fact that the phase-coexistence pattern varies with repeated cooling from 300 K (see Fig. S5 [30]). In sample #1, by contrast, the phase transformation can invariably be completed during cooling to 2 K (Fig. S5 [30]), again indicating that the complexity of the phase evolution does not significantly affect its lowest-temperature state. This contrasting behavior implies that the DWs in the smaller sample are more prone to be pinned compared with those of the larger sample. In fact, an IrTe2 thin flake often shows a broadened and incomplete first-order phase transition (for instance, see the Fig. 4(a) inset and the literature [28, 29]), also suggesting low DW mobility. The specific underlying mechanism in IrTe2 is not clear from the present experiment, but we note that a lower DW mobility is expected for a thinner sample from a simple balance-of-force equation that takes into account pinning due to both bulk and surface inhomogeneities [36, 37]. This surface pinning size effect” is likely to play a role in rendering a small sample susceptible to the complexities of phase evolution.
We have shown that in contrast to the case for bulk samples, complex behaviors dominate the phase evolution of micrometer-sized thin-flake samples, resulting in pronounced variations for the selected specimen and the repeated measurement sequence. These results highlight the inadequacy of the statistical approach when considering a small system exhibiting a first-order phase transition. Additionally, the complex behaviors in phase evolution suggest that phenomena deviating from the properties in the corresponding bulk sample may appear, such as the emergence of superconductivity that would otherwise require chemical doping. Note that, in an even smaller sample, the dominance of the bulk free energy would eventually collapse due to increased surface contributions, potentially resulting in a new electronic state. To achieve a comprehensive understanding of phase transformations in micro- and nanoelements, consideration of both the complexity of phase evolution and surface contributions to the total free energy would thus be important.
Acknowledgements.
H.O. and F.K. thank Y. Ogimoto, H. Suwa, and K. Shibata for their valuable discussions. This work was partially supported by JSPS KAKENHI (Grant Nos. 18K13512, 20K14410, 18H01168, and 21H04442) and JST CREST (Grant No. JPMJCR1874).References
- Landau and Lifshitz [1980] L. D. Landau and E. M. Lifshitz, Statistical Physics, Part 1 (Butterworh-Heinemann, 1980).
- Avrami [1939] M. Avrami, The Journal of Chemical Physics 7, 1103 (1939).
- Lifshitz and Slyozov [1961] I. M. Lifshitz and V. V. Slyozov, Journal of Physics and Chemistry of Solids 19, 35 (1961).
- Langer and Schwartz [1980] J. Langer and K. Schwartz, Physical Review A 21, 948 (1980).
- Uhlmann [1972] D. R. Uhlmann, Journal of Non-Crystalline Solids 7, 337 (1972).
- Wuttig and Yamada [2007] M. Wuttig and N. Yamada, Nature Materials 6, 824 (2007).
- Porter, Easterling, and Sherif [2009] D. A. Porter, K. E. Easterling, and M. Y. Sherif, Phase Transformations in Metals and Alloys (CRC, Boca Raton, FL, 2008).
- Poccia et al. [2008] N. Poccia, A. Ricci, G. Campi, L. Barba, A. Vittorini-Orgeas, G. Bianconi, G. Aeppli, and A. Bianconi, Nature Materials 10, 733 (2011).
- Oike et al. [2015] H. Oike, F. Kagawa, N. Ogawa, A. Ueda, H. Mori, M. Kawasaki, and Y. Tokura, Physical Review B 91, 041101(R) (2015).
- Vaskivskyi et al. [2015] I. Vaskivskyi, J. Gospodaric, S. Brazovskii, D. Svetin, P. Sutar, E. Goreshnik, I. A. Mihailovic, T. Mertelj, and D. Mihailovic, Science Advances 1, e1500168 (2015).
- Oike et al. [2016] H. Oike, A. Kikkawa, N. Kanazawa, Y. Taguchi, M. Kawasaki, Y. Tokura, and F. Kagawa, Nature Physics 12, 62 (2016).
- Sato et al. [2017] T. Sato, K. Miyagawa, and K. Kanoda, Science 357, 1378 (2017).
- Sasaki et al. [2017] S. Sasaki, K. Hashimoto, R. Kobayashi, K. Itoh, S. Iguchi, Y. Nishio, Y. Ikemoto, T. Moriwaki, N. Yoneyama, M. Watanabe, A. Ueda, H. Mori, K. Kobayashi, R. Kumai, Y. Murakami, J. Müller, and T. Sasaki, Science 357, 1381 (2017).
- Katsufuji et al. [2020] T. Katsufuji, T. Kajita, S. Yano, Y. Katayama, and K. Ueno, Nature Communications 11, 1 (2020).
- Jesse et al. [2008] S. Jesse, B. J. Rodriguez, S. Choudhury, A. P. Baddorf, I. Vrejoiu, D. Hesse, M. Alexe, E. A. Eliseev, A. N. Morozovska, J. Zhang, L-Q. Chen, and S. V. Kalinin, Nature Materials 7, 209 (2008).
- Ricci et al. [2015] A. Ricci, N. Poccia, B. Joseph, D. Innocenti, G. Campi, A. Zozulya, F. Westermeier,, A. Schavkan, F. Coneri, A. Bianconi, H. Takeya, Y. Mizuguchi, Y. Takano, T. Mizokawa, M. Sprung, and N.L. Saini, Physical Review B 91, 020503 (2015).
- Ricci et al. [2020] A. Ricci, G. Campi, B. Joseph, N. Poccia, D. Innocenti, C. Gutt, M. Tanaka, H. Takeya, Y. Takano, T. Mizokawa, M. Sprung, and N. L. Saini, Physical Review B 101, 020508(R) (2020).
- Gasser et al. [2001] U. Gasser, E. R. Weeks, A. Schofield, P. Pusey, and D. Weitz, Science 292, 258 (2001).
- Wang et al. [2012] Q. H. Wang, K. Kalantar-Zadeh, A. Kis, J. N. Coleman, and M. S. Strano, Nature Nanotechnology 7, 699 (2012).
- Cao et al. [2018] Y. Cao, V. Fatemi, S. Fang, K. Watanabe, T. Taniguchi, E. Kaxiras, and P. Jarillo-Herrero, Nature 556, 43 (2018).
- Zhang et al. [2019] F. Zhang, H. Zhang, S. Krylyuk, C. A. Milligan, Y. Zhu, D. Y. Zemlyanov, L. A. Bendersky, B. P. Burton, A. V. Davydov, and J. Appenzeller, Nature Materials 18, 55 (2019).
- Pascut et al. [2014] G. L. Pascut, K. Haule, M. J. Gutmann, S. A. Barnett, A. Bombardi, S. Artyukhin, T. Birol, D. Vanderbilt, J. J. Yang, S.-W. Cheong, and V. Kiryukhin, Physical Review Letters 112, 086402 (2014).
- Eom et al. [2014] M. J. Eom, K. Kim, Y. J. Jo, J. J. Yang, E. S. Choi, B. I. Min, J.-H. Park, S.-W. Cheong, and J. S. Kim, Physical Review Letters 113, 266406 (2014).
- Yang et al. [2012] J. J. Yang, Y. J. Choi, Y. S. Oh, A. Hogan, Y. Horibe, K. Kim, B. I. Min, and S.-W. Cheong, Physical Review Letters 108, 116402 (2012).
- Pyon et al. [2012] S. Pyon, K. Kudo, and M. Nohara, Journal of the Physical Society of Japan 81, 053701 (2012).
- Kamitani et al. [2013] M. Kamitani, M. S. Bahramy, R. Arita, S. Seki, T. Arima, Y. Tokura, and S. Ishiwata, Physical Review B 87, 180501(R) (2013).
- Yu et al. [2018] R. Yu, S. Banerjee, H. Lei, M. Abeykoon, C. Petrovic, Z. Guguchia, and E. S. Bozin, Physical Review B 98, 134506 (2018).
- Yoshida et al. [2018] M. Yoshida, K. Kudo, M. Nohara, and Y. Iwasa, Nano letters 18, 3113 (2018).
- Oike et al. [2018a] H. Oike, M. Kamitani, Y. Tokura, and F. Kagawa, Science Advances 4, eaau3489 (2018a).
- [30] See Supplemental Material at http://link.aps.org/supplemental/10.1103/PhysRevLett.xxx.xxxxxx for a detailed description of the experimental and analytical method, and supplementary results.
- Lazarević et al. [2014] N. Lazarević, E. S. Bozin, M. Šćepanović, M. Opačić, H. Lei, C. Petrovic, and Z. V. Popović, Physical Review B 89, 224301 (2014).
- Glamazda et al. [2014] A. Glamazda, K. Choi, P. Lemmens, J. Yang, and S.-W. Cheong, New Journal of Physics 16, 093061 (2014).
- Oike et al. [2018b] H. Oike, M. Suda, M. Kamitani, A. Ueda, H. Mori, Y. Tokura, H. M. Yamamoto, and F. Kagawa, Physical Review B 97, 085102 (2018b).
- Park et al. [2020] S. Park, S. Y. Kim, H. K. Kim, M. J. Kim, T. Kim, H. Kim, G. S. Choi, C. J. Won, S. Kim, K. Kim, E. F. Talantsev, K. Watanabe, T. Taniguchi, S-W. Cheong, B. J. Kim, H. W. Yeom, J. Kim, T-H. Kim, and J. S. Kim, Nature Communications 12, 3157 (2021b).
- Bai and Li [1994] X-M. Bai and M. Li, Physical Review B 72, 052108 (2005b).
- Lebedev and Sigov [1994] N. Lebedev and A. Sigov, Integrated Ferroelectrics 4, 21 (1994).
- Tagantsev et al. [2010] A. K. Tagantsev, L. E. Cross, and J. Fousek, Domains in ferroic crystals and thin films, Vol. 13 (Springer, 2010).