Quantifying Nations’ Exposure to Traffic Observation and Selective Tampering
Abstract
Almost all popular Internet services are hosted in a select set of countries, forcing other nations to rely on international connectivity to access them. We identify nations where traffic towards a large portion of the country is serviced by a small number of Autonomous Systems, and, therefore, may be exposed to observation or selective tampering by these ASes. We introduce the Country-level Transit Influence (CTI) metric to quantify the significance of a given AS on the international transit service of a particular country. By studying the CTI values for the top ASes in each country, we find that 34 nations have transit ecosystems that render them particularly exposed, where a single AS is privy to traffic destined to over 40% of their IP addresses. In the nations where we are able to validate our findings with in-country operators, our top-five ASes are 90% accurate on average. In the countries we examine, CTI reveals two classes of networks frequently play a particularly prominent role: submarine cable operators and state-owned ASes.
1 Introduction
The goal of this study is to identify instances where a significant fraction of a country’s inbound international traffic is managed by a select few networks. Such networks are in a position to observe and tamper with a nation’s traffic, as could any third-parties who infiltrate them (e.g., using a phishing attack or a remote vulnerability exploitation). For instance, observation—of unencrypted traffic and metadata—may be performed by domestic or foreign actors with the purpose of conducting surveillance or espionage, respectively. Conversely, selective tampering—for instance, with individual network flows carrying popular-application traffic—has been reported by actors that are both domestic (e.g., government censorship) and foreign (e.g., dis-information campaigns).
Because actual traffic information is difficult to obtain at a global scale, we instead quantify the fraction of a country’s IP addresses exposed to tampering and observation by specific networks. While all IP addresses are clearly not created equal, they facilitate an apples-to-apples comparison across nations, and the ranking of networks influencing a particular country. Traffic towards any given IP address is frequently handled by so-called transit networks, i.e., those who sell connectivity to the rest of the Internet to other, customer networks for a fee; customers include consumer-serving access networks.
These transit networks are often unknown and unaccountable to end users. This opacity may allow both domestic and foreign actors to observe or tamper with traffic—capabilities we term transit influence—without facing diplomatic or political backlash from governments, activists or consumer groups. We aim to bring transparency to the public regarding oversized observation and tampering capabilities granted to specific transit networks in a large group of nations.
In order to reveal these crucial, nation-level topological features, we develop the country-level transit influence (CTI) metric. CTI quantifies the transit influence a particular network exerts on a nation’s traffic. Studying transit influence requires an analysis of the global routing ecosystem which enables networks to exchange traffic between them. We extract information from the Border Gateway Protocol (BGP), the central system by which networks exchange interconnection information. CTI is based on an analysis of a large compendia of BGP data [54, 8] and includes both topological and geographic filters designed to facilitate inference despite incomplete and biased data [48, 31, 25].
We apply CTI in countries that lack peering facilities such as Internet exchange points (IXPs) at which access networks might connect directly with networks of other nations. In these transit-dominant nations, transit networks—often a select few based in geographically distant countries [16, 28, 32, 58]—serve as the dominant form of connectivity to the global Internet. Moreover, the lack of internationally connected, domestic co-location facilities places these nations at further risk of exposure to observation and tampering because popular content is generally hosted abroad [19, 26, 51, 37, 60].
We employ a two-stage approach based on a comprehensive set of passive inference and active measurements. First, we identify transit-dominant countries. Countries that are transit dominant may be more exposed to observation and tampering by transit providers than countries where peering agreements are prevalent: the latter can receive some traffic from other countries through such peering agreements and bypass transit providers. Second, we quantify the transit influence of the networks serving each country using the CTI methodology, the central contribution of this study. We validate our findings from both stages with in-country network operators at 123 ASes in 19 countries who each confirm that our results are consistent with their understanding of their country’s networks. These discussions, and our analyses showing the metric’s stability, lend confidence to our inferences despite the considerable technical challenges in this measurement space.
In addition to releasing our code and data, our contributions include:
-
1.
A new Internet cartography metric that quantifies the transit influence a particular network exerts on a nation’s traffic: the country-level transit influence (CTI) metric, which ranges over .
-
2.
We apply CTI to infer the most influential transit networks in 75 countries that rely primarily on transit for international connectivity. These countries have, in aggregate, 1 billion Internet users (26% of the world [2]). We find that many of these countries have topologies exposing them to observation or tampering: in the median case, the most influential transit network manages traffic towards 35% of the nation’s IP addresses.
-
3.
We identify two classes of ASes that are frequently influential: those who operate submarine cables and companies owned by national governments.
Ethical disclaimer. We acknowledge several ethical implications of our work. Our mass (validation) survey of operators was classified as exempt by our IRB. Our reporting of available paths to repressive countries might trigger government intervention to remove such paths. Another potential issue is the identification of networks that would yield the most expansive observation or tampering capabilities in a country, which is potentially useful information for a malicious actor. We believe most governments and sophisticated attackers already have access to this information, and that our study may lead to mitigation of these concerning topological features; thus, the benefits significantly exceed the risk.
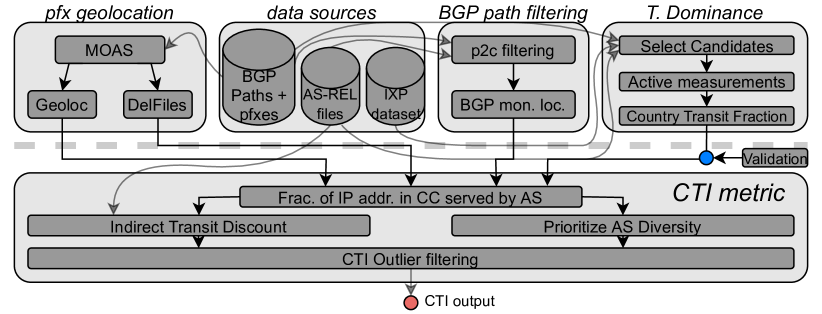
Roadmap. The remainder of this paper is organized as follows. We start in §2 with a high-level overview of our methodology before describing how we assign nationality to prefixes, ASes, and BGP vantage points (§3). We introduce the CTI metric in §4. We apply CTI in 75 countries where international connectivity is predominantly transit and describe our findings in §5. Then, we discuss in detail how we identified the transit-dominant countries (§6). We present our validation with operators and stability analyses in §7. §8 discloses some limitations of our study while §9 compares with prior work. Due to space constraints, we include further details and a flowchart summarizing our full methodology in the appendix. We release the CTI code and datasets at https://github.com/CAIDA/mapkit-cti-code.
2 Approach Overview
Conceptually, international Internet traffic crosses a nation’s border at some physical location, likely along a link connecting two routers. For our purposes, we are not interested in the physical topology, but the logical one: in which autonomous system(s) does international traffic enter a nation on its way to access networks in that country (i.e., origin ASes). Topologically, these ASes can have two different types of relationship with the first domestic AS encountered: transit (provider-to-customer or p2c) or peering (peer-to-peer or p2p). We focus on countries where international connectivity is dominated by transit (p2c) interdomain relationships as they are easier to identify from public data sources.
High-level model. We look for evidence of a country’s exposure to observation or selective tampering by specific networks. Studying this exposure requires a quantitative model of the reliance of the country’s access networks, in aggregate, on specific transit networks. The model must factor in the size of the address space originated by each AS with presence in the country. Intuitively, the greater the share of a country’s IP addresses that are served by a particular transit AS, the higher the potential exposure of the nation’s inbound traffic to observation or tampering by that AS. The model must then produce a country-level metric of exposure for each transit network serving the nation. To that end, we determine the frequency at which transit networks appear on routes towards the country’s IP addresses.
We start our model by building a graph where nodes are ASes and edges are connections between them, weighted by address space. Then, a metric of node prominence on said graph provides a quantitative assessment of how frequently a (transit) node is traversed when delivering traffic from any given node to edge (origin) nodes. The higher the value of this metric for any in a given country, the more exposed the transit ecosystem is. At one extreme (most exposed) are countries with a single transit provider (e.g., a legally-mandated monopoly) connecting every network in the country to the rest of the Internet; at the other end are countries with many transit providers, each delivering traffic to a small fraction of the nation’s IPs. Note that we do not need complete visibility of the graph (e.g., backup links) to infer potential exposure to observation or tampering, as traffic will likely flow through the links that are visible given capacity constraints on long-haul (incl. international) links [14, 67, 44, 50].
Our technical approach to build this conceptual model using real data uses as inputs a combination of two types of measurements: (i) passive, to study AS-level connectivity, and (ii) active, to study transit dominance.
AS-level connectivity. We rely on two major input sources: BGP paths and prefixes from RouteViews [8] and RIPE RIS [6], and AS relationship inferences from CAIDA. We begin with the 848,242 IPv4 prefixes listed in CAIDA’s Prefix-to-Autonomous System mappings derived from RouteViews [22], excluding the 6,861 (0.8%) prefixes with (invalid) length greater than 24, and the 9,275 (1.1%) originated by multiple ASes. We find those prefixes in the 274,520,778 IPv4 AS-level paths observed in BGP table dumps gathered by AS-Rank [1] from RIPE/RouteViews [8][6] during the first five days of March 2020. We consider the set of prefixes and the ASes that originate them on each observed path in combination with the 377,879 inferred AS-level relationships published by CAIDA [5].111In the 75 countries where we study transit influence, no path contained any of: unallocated ASes, loops, poisoned paths (where a non-clique AS is present between two clique ASes, clique being the AS-level core of the Internet inferred by [5]); additionally, all paths towards these countries are seen at least once per day across all five days.
Transit dominance. Because we are focused only on countries where transit—as opposed to peering—is the main form of trans-border connectivity, we use active measurements to identify and exclude nations with evidence of foreign peering, i.e., where an AS that originates addresses geolocated to the country establishes a peering agreement with another AS primarily based in another country222This “nationality” assignment is described in Sec. 3.. We conduct a two-week-long active measurement campaign (see Sec. 6.2) in May 2020 to determine which countries are transit dominant based on the business relationship between the “border” ASes traversed by our probe packets while entering the country (as inferred by BdrmapIT [49]).
3 Definitions of Nationality
CTI hinges on the correct nationality assignment for IP address prefixes and BGP monitors. ASes are also assigned a nationality in the transit-dominance analysis. Given the diverse set of information available, we devise distinct methods for each. (We include an analysis of CTI stability given an alternative geolocation input in §7). For our purposes, a country is one of the 193 United Nations member states, either of its two permanent non-member observer states, or Antarctica.
Address prefixes. We first geolocate each IP address in every observed BGP prefix to a country using Netacuity [12]. Then, on a country-by-country basis, we count how many addresses in each prefix are geolocated to that country. If the number is less than 256 (a /24), we round up to 256. If Netacuity does not place any of a prefix’s IP addresses in a country, we attempt to find a delegation block from the March 2020 RIR delegation files [7] that covers the entirety of the prefix. If there is one we assign all of the delegated prefix’s addresses to the indicated country. Hence, while Netacuity can place a prefix in multiple countries, at most one country will receive addresses through the RIR process, and only if it was not already associated with the prefix through Netacuity. Netacuity accounts for 95.1% of all prefix-to-country mappings, while delegation-derived geolocation accounts for the rest.
A particularly pressing concern with geolocation is the correct assignment of IP addresses belonging to large transit ASes with a presence in many countries. We compute the fraction of a country’s address space that is originated by ASes that have at least two thirds of their addresses in that country. In the vast majority of countries, the address space is dominated by ASes that are primarily domestic.
BGP monitors. As our study is focused on measuring inbound country-level connectivity, we seek to limit our analysis to paths going towards addresses in the target country from a BGP monitor located outside that country. Hence, we confirm the BGP monitor locations listed by RouteViews [59] and RIPE RIS [57] through a set of active measurements. The details of this process are included in Appendix 0.A.
Autonomous Systems. Our transit dominance analysis relies on a concept of AS nationality, which is based on IP geolocation of the AS’ originated addresses; for transit providers, we also include the IP addresses originated by direct customers. We classify each autonomous system operating in a country as being domestic, , when the AS has at least two thirds of its addresses in the country, and foreign otherwise. The vast majority (97.4%) of ASes are classified as domestic in one country, with the remaining small fraction being classified as foreign in every country. In fact, 89.8% of ASes have all of their address in a single country, and 98.6% have a strict majority of addresses in one country.
4 Transit Influence Metric
We define the transit influence using a set of BGP monitors as
| (1) |
where is monitor ’s weight (Sec. 4.1.2) among the set of monitors (Sec. 4.2.2); is true if is present on a preferred path observed by monitor to a prefix , and is not contained within itself (Sec. 4.2.1); is the number of addresses in prefix geolocated to country ; is the total number of IP addresses geolocated to country ; and is the number of AS-level hops between and prefix as viewed by monitor (Sec. 4.1.1).
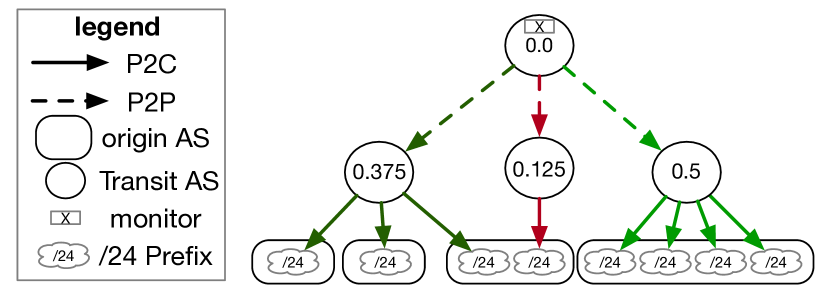
We illustrate CTI’s use in Fig. 2, with CTI values for a toy example with three transit ASes and four origin ASes, in a country with eight /24 prefixes: the transit AS on the right has the highest CTI, since it serves the most addresses (half of the country), followed by the transit AS on the left () and the AS in the center (). Note that the top AS has a CTI of 0, because it hosts the BGP monitor from which the set of routes used in this toy example are learned—hence, is always false for that AS. Should that AS not be the host of the BGP monitor (or be seen on these routes through another monitor), it would have a CTI of 0.5—transit influence over the entire country as an indirect transit provider (distance 2 from the prefixes).
Note that originating addresses directly does not grant an AS transit influence, as our focus is on identifying ASes that carry traffic to destinations outside of their network.
4.1 CTI components
We explain the rationale for the various factors in Eq. 1 in the following subsections.
4.1.1 Indirect transit discount.
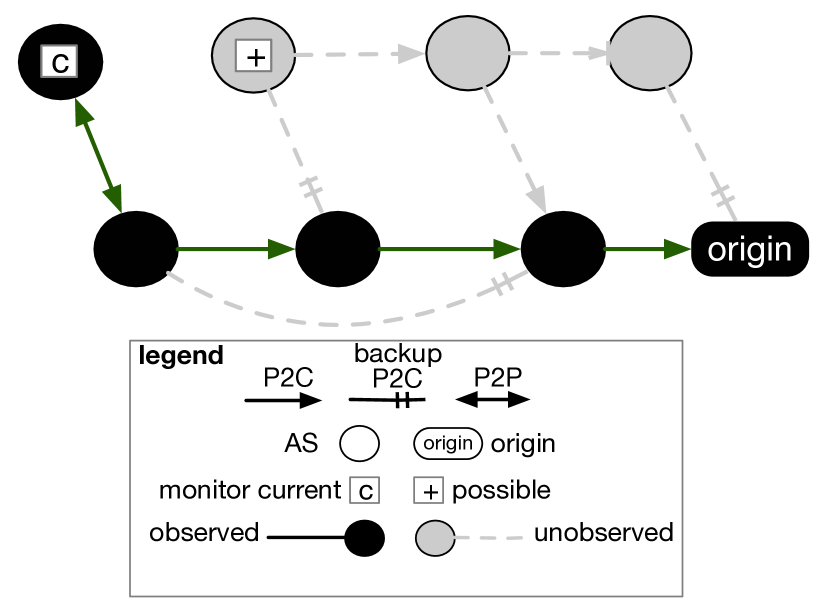
As the number of AS-level hops from the origin increases, so too does the likelihood that there exist alternative paths towards the same origin AS of which we have no visibility (e.g., backup links, less-preferred paths). Fig. 2 shows this limitation in visibility for a toy example with a single origin AS. There, given the location of BGP monitor we see the AS-level chain in black, erroneously concluding that the origin AS has a single direct transit provider and two indirect transit providers. In reality, there exists another set of both direct and indirect transit providers (the AS-level chain in light gray). We miss all these paths given that we do not have a monitor in any neighbor of a light-gray AS (such as that marked with a plus sign). In this example we miss backup links of the origin AS, as well as preferred links of the origin’s direct transit provider, and a backup link of both indirect transit providers.
As a coarse mechanism aimed at mitigating this limited visibility, we discount the influence of transit providers in proportion to the AS-level distance from the origin: we apply a discount factor as , where is the number of AS-level hops from the origin AS. In practice, that means we do not discount the measurements of direct transit providers, as there the probability of missing a backup or less-preferred link is lowest. We note that this heuristic yields a conservative estimate of the observation opportunities of an indirect transit provider over traffic flowing towards a country.
4.1.2 Prioritizing AS diversity.
ASes can host more than one BGP monitor. In fact, more than 20 ASes in RIPE RIS and RouteViews host multiple monitors; for instance, AS3257-GTT hosts five. In order to favor a topologically-diverse view (given the available observations), if more than one monitor from the same AS sees an announcement for the same prefix, we discount their observations to limit the influence of monitor ASes with multiple monitors. Formally, the weight for each monitor ’s observation of a prefix is , where is the number of BGP monitors in the AS that see an announcement of that prefix.
4.2 Filtering ASes
To correct for the limited, non-uniform coverage of the BGP monitors that collect our table dumps, we apply a number of filters to the set of paths over which we compute CTI.
4.2.1 Provider-customer AS filter.
BGP monitors by definition collect paths from the AS hosting the monitor to the origin AS. Therefore, we always exclude the AS hosting the BGP monitor from the path to avoid inflating their transit influence. Further, we employ a heuristic that attempts to consider only the portion of the path relevant to the origin prefix, and ignore the portion dictated by the monitor’s topological location.
The intuition behind our filter is that, from the perspective of the origin AS, there is a “hill” above it capped by the last observed provider-customer (p2c, i.e., transit) link, with traffic flowing from the hill’s peak down towards the origin. The transit AS in that link is the highest point in the path we want to keep, as it directs traffic towards its customer (and its customer’s customers, if applicable). After reaching that topological peak, we discard any other AS present in the path. The remaining path would then include the origin AS, its direct or indirect transit provider at the topological peak, and any other ASes appearing between the origin AS and the direct or indirect transit provider. Note that this filter excludes peers of the transit provider at the peak—appearing between the topological peak and the AS hosting the BGP monitor—since we only apply CTI in transit-dominant countries, and therefore these peers are unlikely to be central to the country’s connectivity.
Formally, for the analysis presented in this paper, we refine to be true only if the path observed at monitor has at least one inferred p2c link where the customer is either the origin of or closer to it than , i.e., we discard paths where there is no topological peak from the perspective of the origin. This heuristic discards 0.2% of the paths observed by our monitors. In the median country we discard 0.2% of paths using this filter, with 0.3% being the average case. In all countries we keep over 98.6% of paths.
This filter ensures that at least one AS (the inferred customer of the transit AS) relies on at least one other AS (the inferred transit provider) for transit from and towards the core of the Internet. As we aim to measure transit influence, these business relationships are an important source of information: merely being directly connected to an AS path that reaches the origin AS in a given country does not necessarily make an AS influential; being a direct provider of the origin, or of an AS closer to the origin, lends more confidence to our inference of influence333Refer to [33] (§2.1.5 and §4.2.4) for an extended discussion of the intuition behind the CTI model..
4.2.2 CTI outlier filtering.
Finally, we filter BGP-monitor-location noise by removing outlier estimates of transit influence—both overestimates and underestimates resulting from the AS hosting a BGP monitor being topologically too close or too far from the origin AS—to get an accurate assessment of transit influence towards that origin. We implement a filter recently proposed for another AS-topology metric (AS hegemony [31], see §9). Specifically, we compute the CTI of each transit provider using BGP monitors from each monitor-hosting independently, as , where is the set of monitors within . We determine which potentially-biased have gathered observations producing values in the bottom and top 10% of all values for that transit provider in that country and disregard all paths observed by monitors hosted in these potentially-biased . As in [31], we implement outlier filtering only where we have observations of from 10 or more , which occurs for 58.4% of transit AS-country pairs in our sample (a single AS can operate in multiple countries).
5 Country-Level Transit
In this section we present the results of applying our CTI metric to the transit ecosystem of 75 countries with little-to-no international peering. (We describe our method for selecting these countries in §6.) We provide a high-level characterization of the transit ecosystem in each country by comparing the CTI scores of the top-5 ASes ranked by CTI (Sec. 5.1), as well as a set of ASes that appear in the top 5 of many countries (at least 10). Our hypothesis is that these countries show different transit profiles as a consequence of the socioeconomic and geopolitical diversity of the sample: from high exposure to observation, where one AS is the most influential transit provider and others are very marginal, to less exposed countries with an ensemble of ASes with similar values of CTI.
Investigating the companies operating the ASes with high CTI, we find two prominent groups of organizations: submarine cable operators (Sec. 5.2) and state-owned providers (Sec. 5.3). For the former, their operation of physical infrastructure connected to the country may underpin their high transit influence. With regards to state-owned ASes, providing transit may give governments the ability to expand their footprint beyond addresses they originate, e.g., through a state-owned broadband provider. In some cases, state ownership of a transit provider may follow their investment in a submarine cable or landing station, while in others it may reflect the government’s intention to enact censorship. We limit our analysis to the discovery of the transit footprint of the state, without delving into the underlying motives.
5.1 CTI distribution across countries
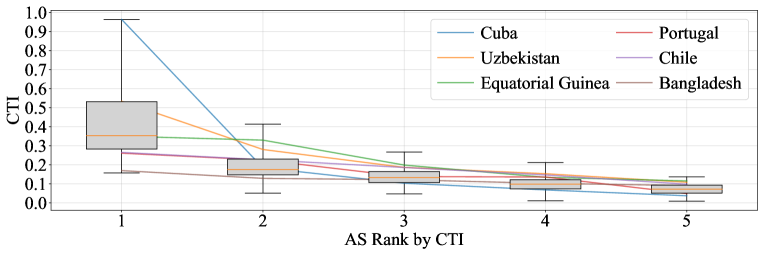
In this subsection we present an overview of the CTI distribution across countries. Countries with a top-heavy distribution of CTI values are particularly exposed to specific networks. Other nations with a more flat distribution signal an ecosystem that is less exposed to prominent transit ASes. Fig. 3 shows the distribution of CTI values for ASes ranked in the top 5 by CTI in each country. In 51 countries, the top-ranked AS has CTI 0.3, signaling high exposure to observation and tampering by that specific network.
The distribution of CTI rapidly declines across AS rank, with the median halving from the first to the second position. In 54 countries, CTI declines by over 30% from the top-ranked AS to its successor; the average and median decline across all countries are 50% and 47%. This suggests that in the vast majority of countries in our sample, a single AS is particularly prominent in terms of its capabilities to observe or tamper with traffic.
5.1.1 Individual nations.
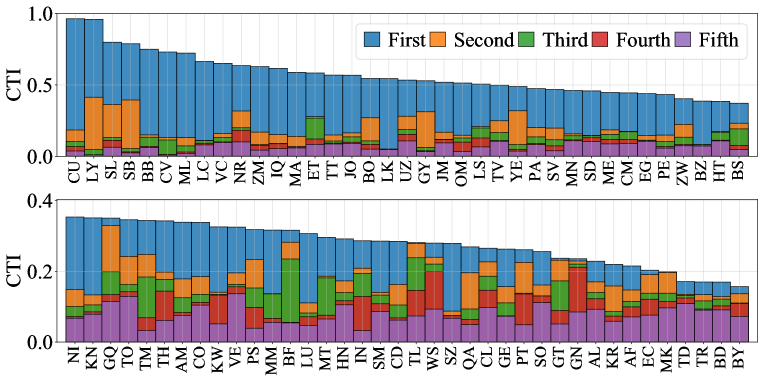
Results for the full set of countries we study444Note that multiple ASes may provide transit connectivity to the same prefixes, explaining why the sum of CTI values of top ASes may be greater than 1. are included in Fig. 4. We discuss several representative cases below.
Most exposed countries. Only four countries have a top-ranked AS with a CTI over 0.75: Cuba, Libya, Sierra Leone, and the Solomon Islands (a small island nation). Cuba appears to have the most-exposed transit ecosystem555This is consistent with previous work that focused exclusively on Cuba, finding its international connectivity to be constrained [16]., in which the top-ranked AS has CTI of 0.96. Because CTI discounts indirect transit—and the top AS monopolizes observed, direct connectivity—the CTI of Cuba’s remaining ASes declines rapidly (81% from the top-ranked AS to the second).
Countries around the median. The median of the leftmost bar in Fig. 3 consists of countries that are still considerably exposed to observation and tampering, with CTI values ranging from 0.34 to 0.44, including: Egypt, Equatorial Guinea, Belize and Thailand. In Eq. Guinea, the top-two ASes each have a CTI over 0.3; these ASes have a p2c relationship with each other. Egypt and Belize have more skewed distributions, with a 67–79% decline from the top AS to its successor.
Least exposed countries. At the other end of the spectrum in Fig. 4 are five countries where the top-ranked has CTI values under 0.2: Chad, Bangladesh, Belarus, Turkey and North Macedonia. These countries have flatter distributions, with CTI declining at most 21% (or 16% on average) between the top-two ASes. As a result, we find no evidence of these nations being particularly exposed to a single network (unlike most of their peer countries in our sample). India, the country with the most Internet users in our sample, is in the bottom third with a top-AS CTI of 0.29, declining by 27% between the top-2 ASes.
Frequently top-ranked ASes. Of the 165 ASes present in Fig. 3, 126 of them are in the top-5 for only one country, with a further 31 ASes in the top-5 of at most 10 countries. There are eight notable exceptions, however: 3356*-Lumen666Formerly Level3/CenturyLink. (top-5 in 25 countries), 1299*-Telia (24), 174*-Cogent (24), 6939-HE (18), 5511*-Orange (16), 6762*-T. Italia (14), 23520-C&W (14), and 6453*-Tata (12). Nearly all of these networks (marked with *) are in the inferred clique at the top of the global transit hierarchy [1]. C&W is only present in our analysis for countries in the Caribbean. HE has a very broad footprint, with countries in Africa (7), the Mid. East (3), W. Europe (2), Southeast Asia (2), South Pacific (2) and East/South Asia (1 each).
5.2 Submarine cable operators
Submarine cables are known to be an important part of the global Internet infrastructure [15, 29, 45] and play a role in the top-5 ASes of most countries we study. (Nicaragua, Guatemala, and Guyana are the only three nations where none of the top-5 ASes are associated with the submarine cables landing in the country.)
In this section, for each country, we find the highest-ranked AS by CTI where there is evidence of an institutional connection between the AS and an owner or operator of a submarine cable. We define an AS as a submarine cable operator if we find a direct match between the AS Name, the AS Organization [20], or a corporate parent organization (e.g., CenturyLink for Level3, the Government of Sierra Leone for Sierra Leone Cable Company) and the owners of a submarine cable operator according to TeleGeography [64] and Infrapedia [38]. This process yields submarine cable ASes in 46 countries out of 51 possible, as 17 of the 75 countries are landlocked, and 7 have no submarine cable connectivity according to the operator databases. In three additional countries (Myanmar [4], the Solomon Islands [10], and Congo DRC [43]) only TeleGeography provides an AS to submarine cable match, which we confirm with information from the cited sources (the operators themselves, the government of Australia, and a submarine cable news source). In the remaining two countries (Thailand [65] and Samoa [63]) where we were not able to find an AS to submarine cable from TeleGeography, we rely on the cited sources (from the operator and a Samoan news outlet) to find a match. Note that only operators of submarine cables who appear as an AS on the BGP path can be identified using this method.
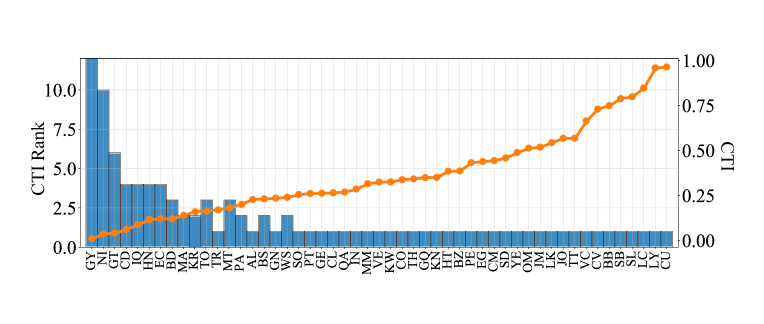
Our findings are shown in Fig. 5, with the CTI of the top cable-owning AS in each of the 51 countries shown as orange circles, and the ordinal ranking of that AS in its country’s ecosystem as blue bars. In 36 countries, a submarine cable AS is ranked at the top by CTI, with an average rank of 1.9.
Note that being the top operator by CTI means different things in different countries, as the underlying potential exposure to observation affects the CTI of the top AS. For instance, in Turkey a cable-owning AS ranks first by CTI, but has the lowest CTI among such countries. Said AS (9121-Turk Telecom) has a CTI of 0.17. By contrast, in Cuba and Libya, a submarine cable operator (11960-ETECSA and 37558-LIT) is also ranked first but with CTIs of 0.96 in both cases. As a result, Turkey is much less exposed to a single AS than Cuba and Libya.
We also find regional clusters of high transit influence for the same AS operating a submarine cable, including C&W (formerly Columbus Networks), which is among the top providers in 11 countries in Central America and the Caribbean thanks to its ownership of the ECFS, ARCOS-1 and Fibralink cables. Telecom Italia Sparkle, Telefonica and Bharti Airtel also have an important transit presence in the Mediterranean, Latin America, and South Asia respectively. We release a complete list of submarine cables linked to an AS with high CTI on the paper’s repository.
5.3 State-owned transit providers
In more than a third (26) of nations, we find that at least one of the top-5 ASes is state-owned, motivating us to further examine the total influence of a country’s government on its Internet connectivity. In particular, we adapt CTI to quantify the influence of state-owned conglomerates—as some nations have more than one state-owned AS—and apply it to the 75 countries in our sample. We use as input a list of ASes that are majority-owned by sovereign states [23]. The list was manually verified and encompasses both access and transit ASes. The dataset includes major telecommunication providers as well as its sibling networks and subsidiaries. Using this list, we find 100 state-owned ASes who operate domestically (i.e., where the state owner and the country of operation are the same) in 41 countries.
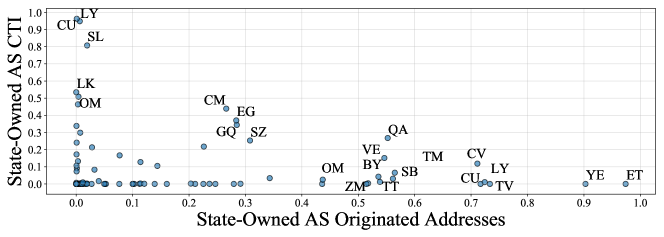
5.3.1 Influence of state-owned ASes.
Our initial exploration of the influence of state-owned ASes concerns the role each AS plays in the ecosystem of its country, as shown in Fig. 6. We find that state-owned ASes tend to provide either transit or access, usually not a combination of both. (Most points in Fig. 6 line up along an axis, rather than towards the middle.) As a consequence, meaningfully estimating the footprint of the state requires combining the two kinds of influence as well as aggregating data for AS conglomerates. (Two exceptions where a state-owned AS provides both Internet access (i.e., as an origin AS) and serves transit to other ASes are Cameroon and Egypt; in the former, Camtel has both a high CTI (0.44, ranked first) and originates 27% of the country’s addresses (second only to Orange Cameroon). Egypt’s TE has a CTI of 0.37 and originates 28% of the country’s addresses.)
We begin our combined estimation by computing CTI for not just a single AS, but a set of ASes, while not “double counting” influence over the same addresses; i.e., if two of the state’s ASes originate and provide transit to the same addresses, we add those addresses to the state’s footprint once. We call this derived metric . Intuitively, reflects the “pure-transit” footprint of the state, crediting only the addresses where state-owned ASes serve exclusively as transit providers. For instance, if AS and AS (both of which operate in country ) respectively originate and provide transit to the same /24 prefix, says that the conglomerate does not have transit influence over the /24 prefix. Formally, is calculated as
which is essentially identical to Eq. 1, except that is a set containing all of the ASes in the state-owned conglomerate of country ; is true if is true for some and is not originated by any AS in ; and , i.e., the AS-level distance from to the closest AS in the conglomerate.
Finally, we define the total footprint of the state, i.e., addresses that are either originated or for which transit is served by a state-owned AS. The state’s footprint is calculated as
where is the fraction of addresses in country originated by . The first term of the sum is the pure-transit footprint and the second term is the addresses directly originated by the state-owned conglomerate .
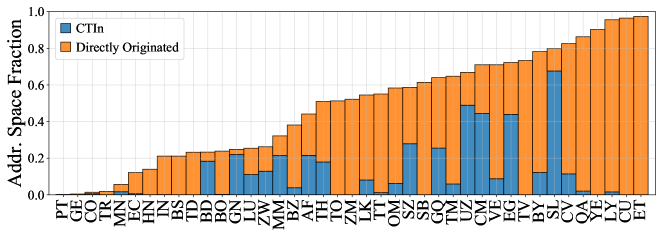
5.3.2 Findings.
Fig. 7 shows our findings for the state-owned footprint (, bar height), the originated fraction by state-owned ASes (orange bar), and pure-transit footprint of state-owned ASes (, blue bar). Our results suggest that domestic state influence exists on a spectrum where some countries, such as Ethiopia, Cuba, Libya and Yemen, rely overwhelmingly on the state for the provision of Internet access and ( between 0.90–0.97), whereas others, such as Colombia, Turkey, Mongolia and Ecuador have relatively marginal state-owned enterprises ( between 0.01–0.12).
Regarding the mode of influence that states use, in many countries in Fig. 7, most of the bar height is contributed by the orange portion, meaning that the footprint of the state comes from addresses directly originated. However, in some countries the state punches above its access network weight by deploying an influential transit provider, i.e., those where the bar height is not dominated by the origin contribution in orange.
| Country | SL | UZ | CM | EG | SZ | GQ | GN | AF | MM |
|---|---|---|---|---|---|---|---|---|---|
| 0.68 | 0.49 | 0.44 | 0.44 | 0.28 | 0.26 | 0.22 | 0.21 | 0.21 | |
| 0.80 | 0.67 | 0.71 | 0.72 | 0.59 | 0.64 | 0.25 | 0.44 | 0.32 |
5.3.3 Pure-transit footprint of state-owned ASes.
The countries where pure-transit influence () is largest (0.2 or more, or pure-transit influence over at least a fifth of the country’s addresses) are shown in Tab. 1. In these countries, all of which are in Africa and Central Asia, providing transit considerably increases the influence of the state. We note that the mere existence of these influential transit ASes does not signal willingness of the state to engage in surveillance or selective tampering, but rather that the government may have opportunities to do so. For instance, Myanmar’s state-owned Myanma Posts and Telecommunications (MPT), which is included in our analysis, appears to have been involved in the disruption of the country’s Internet service during the recent coup [36].
6 Inferring Transit Dominance
In this section, we describe how we identified the 75 countries that are the focus of the preceding section, i.e., countries where provider-customer transit (p2c) relationships are likely the dominant mode of inbound international connectivity. We start by identifying countries for which public datasets of Internet Exchange Points (IXPs) and Private Colocation facilities (Colo) show no evidence of international peering (Sec. 6.1). Based on this analysis, we conduct an active measurement campaign to confirm the absence of international peering (Sec. 6.2). This second stage based on traceroutes is necessary because peering datasets are incomplete, particularly when it comes to membership lists at IXPs in developing countries [47]. We consider the prevalence of transit links being used to reach each of our target countries from probes distributed worldwide (§ 6.3) in combination with our operator validation (§7) to select a set of transit-dominant countries.
We define international peering as a (logical) link between two ASes that: (i) operate primarily in different countries (Sec. 3), and (ii) where that link is not an inferred transit-customer link. We use this definition since we are interested in studying the AS-level routes taken towards each country. We are aware of the limitations of our measurements and analysis, particularly with regards to the location (both topologically and geographically) of our probes; we address the issue further in Sec. 8.
6.1 Constructing a candidate list
We identify countries where international peering may not be prevalent by evaluating evidence of international peering involving origin ASes present in the country. While domestic peering is very common, our hypothesis is that international peering is still not a frequent occurrence in some countries. We begin with the set of ASes that originate at least 0.05% of addresses in each country. We remove marginal ASes that originate a very small fraction of the country’s address space to reduce the scope of our active campaign, as we are limited by RIPE Atlas’s system-wide limits on concurrent measurements [55]. This set includes origin ASes that we classified as foreign to that country, but that originate BGP prefixes entirely geolocated in the country. (These ASes originate a marginal fraction of the addresses in the vast majority of countries we study; see §3). We look for these origin ASes in CAIDA’s IXP dataset (from Oct. 2019 [21]), PeeringDB Colo dataset (from Mar. 1st, 2020 [9]), and inferred AS-Relationships from BGP (Mar. 2020 [5]).
We classify an origin AS as a candidate if the following three conditions are true:
-
1.
the origin AS has no foreign peers in BGP [5];
- 2.
- 3.
The intuition for each test is as follows. If we observe at least one foreign peer on BGP (1), this origin AS already has the ability to receive some external content from that peer, bypassing transit providers. Therefore, transit providers serving that origin will have fewer capabilities to observe traffic flowing towards it. Further, if an AS is a member of an IXP/Colo in another country (2), or a member of an IXP/Colo where another member is from a different country (3), the origin AS is at least capable of establishing peering relationships with those other ASes.
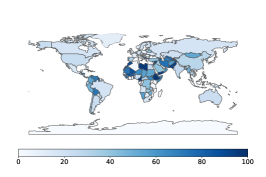
Fig. 8(a) shows the percentage of a country’s address space originated by candidate ASes. We select the top-100 countries as candidates for active measurements. This set includes only countries where at least 25% of addresses are originated by candidate ASes. Our motivation is to actively probe the set of countries where it is most likely that transit providers still play an important role on inbound international connectivity. These 100 countries are colored in Fig. 8(b).
6.2 Active measurement campaign
We ran a traceroute campaign to the 100 candidate countries for 14 days starting May 2nd, 2020. Additionally, we use all publicly available IPv4 traceroutes on RIPE Atlas during the same period—on the order of several million per hour—in order to opportunistically take advantage of other measurements towards the same ASes. We design our traceroute campaign guided by two constraints. First, we want to select a geographically and topologically diverse set of probes. Second, we have to operate within the rate limits of RIPE Atlas777Which RIPE Atlas generously relaxed for this study upon direct request., particularly regarding concurrent measurements and credit expenditure.
Within these constraints, we launch ICMP traceroutes888Using default RIPE Atlas values except number of packets (reduced to 1). from 100 active—shown as “connected” during the previous day [56]—RIPE Atlas probes (located outside any target country) towards a single destination in each AS, twice daily999We space traceroutes an hour apart in 800-target IP blocks.; probing at this frequency gives us 28 opportunities to reach the AS during the two-week period from each vantage point.
We target an IP in a single /24 block for each origin AS in each candidate country by looking for any prefix originated by that AS that is entirely geolocated or delegated within the candidate country (see Sec. 3). Our final dataset is comprised of 33,045,982 traceroutes, including those launched by other RIPE users that meet our constraints. The distribution of the number of traceroutes reaching each country has the following properties: (Min, 25th Pctl., Median, Mean, 75th Pctl., Max) = (36, 13k, 46k, 330k, 250k, 3.3m). That is, the median country received 46k traceroutes. Only three countries received fewer than a thousand traceroutes: Eritrea (667), Nauru (154), and Tuvalu (36).
We use BdrmapIT [49] to translate our traceroutes into AS-level interconnections. BdrmapIT requires a number of external datasets in its operation, which we specify as follows: inferred AS-Level customer cone [48] from Mar. 2020; AS2Org, which infers groups of ASes who belong to the same organization101010This dataset is published quarterly., from Jan. 2020; and datasets we mention in other sections—prefix-to-Autonomous System mappings (§2), PeeringDB records (§6.1), and RIR delegation records (§3). From these traceroutes and external datasets, BdrmapIT infers a set of AS-level interconnections and the IP addresses (interfaces) at which they occur. Each interface inferred by BdrmapIT has an AS “owner” assignment. We reconstruct the AS-level path observed on the traceroute using such assignments.
6.3 Country-level transit fraction
From the preceding sections we have built a set of AS-level paths taken from the traceroute source to the destination AS. We now need a quantitative analysis technique to infer the prevalence of transit links on inbound traces towards each country.
To that end, we determine how frequently a transit (p2c) link is traversed when crossing the AS-level national boundary111111As defined by our AS Nationality (§3), not actual political borders. towards an origin AS () in a candidate country. We infer the AS-level national boundary as the link between the last foreign AS observed on the AS-level path (starting from the vantage point) and the subsequent AS.
We calculate how frequently, in the inbound traceroutes we process with BdrmapIT, the AS-level national border crossing occurs on a transit link for each origin AS. We scale this fraction to take into account the size of the address space originated by each AS using the country-level transit fraction:
where is the number of traceroutes destined toward a prefix originated by that traverse a transit link between a foreign provider and a domestic customer in country ; is the total number of traceroutes where is the last observed AS; and is the fraction of country ’s address space originated by . For instance, if an AS originates 50% of the country’s origin addresses, and 50% of the traces towards it traverse a foreign transit provider AS, the contribution of that AS to the country-level transit fraction becomes 0.25. Note that and are not necessarily the same, as the border crossing may occur at the link between (direct and/or indirect) providers of .
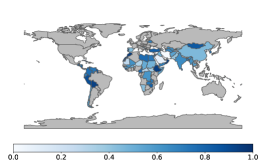
The values of for each candidate country are represented in Fig. 8(b): countries in darker shades of blue have both a large probed and responsive fraction and a large fraction of traceroutes from outside the country traversing transit providers. The closer the fraction is to 1, the more evidence we have that the country relies on transit providers for its international inbound connectivity.
6.4 Final selection
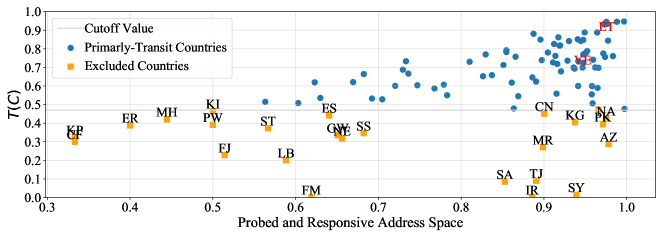
Finally, in order to identify a set of primarily-transit countries, we evaluate the values of across countries, shown in Fig. 9. At one extreme of Fig. 9 and Fig. 8(b) are countries such as Ethiopia (ET) and Yemen (YE), = 0.95 and 0.7, respectively, where all available evidence points towards transit links as the main inbound modality. At the other extreme are countries such as Syria (SY) and Iran (IR), 0.01, where we rarely observe AS-level national borders being crossed using transit links.
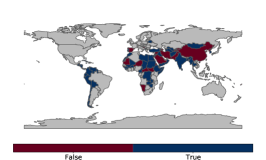
Outside the upper and lower extremes in Fig. 9, where the decision of whether to include a country in our study is obvious, the middle results (most countries) do not offer clear dividing points. We decided then to set the threshold for to classify a country as primarily-transit based on our validation with operators (§7); in particular, we use the value of for Sudan (0.48) as a lower bound, which is the lowest in any country that we were able to confirm relies on transit links for its inbound connectivity. The final countries in our CTI study are shown in a blue-white spectrum in Fig. 8(c) and as blue circles in Fig. 9, 75 of the 100 candidates. Countries in red are excluded from further analysis, as at this time we lack sufficient evidence to support that they are primarily using transit providers for inbound connectivity.
7 Stability and Validation
In this section, we discuss the findings of our stability analyses, validation with operators, and a calculation of transit influence at the organization level.
7.1 Stability
Temporal stability. We apply our CTI methodology to a set of BGP paths from Feb. 2020 and Apr. 2020 and compare the results to those presented in §5 (from Mar. 2020). Specifically, we compute the absolute value of the difference in CTI across successive months for transit ASes listed in each country. The results are shown in Tab. 2. We find that the CTI values are relatively stable across these months.
| Type | Compared Sets | 25th ptile. | Mean | Median | 75th ptile |
|---|---|---|---|---|---|
| Temporal | Feb. & Mar. 2020 | 0.00000 | 0.00190 | 0.00001 | 0.00016 |
| All ASes | Mar. & Apr. 2020 | 0.00000 | 0.00156 | 0.00001 | 0.00017 |
Stability to changes in geolocation input. In order to assess the potential fragility of our study to inaccuracies in geolocation, we also applied our CTI methodology using MaxMind [3] and computed the absolute value of the difference in CTI scores produced with each location database. The output of this analysis is (25th perc.,mean,median,75th perc.) = 0.00000, 0.00104, 0.00002, 0.00017, suggesting CTI is relatively stable across these geolocation inputs.
7.2 Operator Validation
We discussed our findings with employees or contractors of two types of organizations: commercial network operators and non-profits who conduct networking research (universities, registrars, and non-commercial network operators). Additionally, we describe the results of our discussions follwing a mass email request to ASes with prefixes geolocated in countries in our study. Discussions with all of these organizations are anonymized. Our findings are largely consistent with each operator’s view of the transit ecosystem of the countries discussed with them.
The results of our discussion of CTI findings with 6 operators in 6 countries121212We sent a set of ASes produced before updating our CTI methodology to its current form, which explains the “unconfirmed” column; the “top” ASes were defined as the country’s top 12, unless any of those ASes had a marginal CTI score. are shown in Tab. 3. Our CTI operator discussions consist of a confirmation of the AS set we identified as being most influential in their countries. Overall, operators confirm that the vast majority of ASes we identify are among the most influential in their nations. We also summarize our discussions with: (i) operators regarding our inferences of transit-dominant countries, (ii) ASes with prefixes geolocated to these countries. Regarding (i) 10 operators in 9 countries131313CO, ET, CD, LS, SZ, ZW, VE, SD and CM. confirmed that their nations are primarily transit141414 Sample, anonymized operator response: “Sudan is characterized by the traditional IP transit model. There is a domestic IXP, which serves five ISPs and [redacted AS Name]’s DNS nodes, but there are no foreign network operators present here. Furthermore, until recently, only two ISPs held gateway licenses (i.e., were licensed to provide external connectivity to Sudan).”.
Regarding (ii) we sent a mass email request to the WHOIS abuse address registered by ASes that had prefixes geolocated in 10 countries151515We only contacted ASes who had % of their addresses in the country. Since this survey took place in 2021, we use the addresses geolocated in Jan. of that year. (with IRB approval): BO, CO, VE, CM, BD, GT, CL, HN, SV and ZW161616Selected as a mix of large & small (by #ASes) EN- and ES-speaking countries.. We received 111 responses in 9 of these countries (all but ZW). Of these, 107 confirmed they operate primarily in the country that we geolocated their prefixes to171717In 3 cases, they stated that they operate in multiple countries.. Additionally, 108 were willing to discuss which type of business relationship dominated their inbound international traffic: 83 stated that transit relationships are the primary modality.
| AS-Country Pairs | #Confirmed | #Rejected | #Unconfirmed | Total #ASes |
|---|---|---|---|---|
| Top 5 ASes | 27 (90%) | 1 (3%) | 2 (7%) | 30 |
| All Top ASes | 45 (79%) | 7 (12%) | 5 (9%) | 57 |
7.3 Organization-Level Transit Influence
In some instances, multiple ASes may be operated by the same organization. We identified 323 instances where multiple ASes belonging the same organization (as of Jul. 2020 [20]) have in a given country. We compute an upper bound of the organization’s transit influence (in each country) by summing the CTI of component ASes. We find that 270 org-country pairs—an organization operating in a country—have marginal influence, with the CTI sum under 0.05 (218 were under 0.01).
For the remaining 53 organization-country pairs, we compute the contribution to the CTI sum of the highest-ranked AS in each organization. We separate these into three groups: (i) In 36 org-country pairs, the top AS contributes at least 90% of the CTI sum (98% on average). In these 36 cases, then, a single AS is responsible for the vast majority of the organization’s transit influence. (ii) In 7 org-country pairs, the contribution to the CTI sum of the additional ASes—other than the top AS—in the organization is between 0.01–0.04 (between 11-29% of the CTI sum), or 0.02 on average. Therefore, the change in CTI as a result of their inclusion is relatively marginal.
(iii) In the remaining 10 org-country pairs, only 4 have a CTI sum greater than 0.1. For these, we compute the of the organization to determine the contribution of the top AS in each organization (rather than a lower bound). In all 4 cases, the top AS contributes 61% or more of the organization’s (country-org, perc. of ): VE-Lumen (87% of 0.16), SZ-Orange (61% of 0.14), WS-Lumen (73% of 0.30), and TV-Internap (62% of 0.11). Three of these countries are either a microstate (SZ) or a small island nation (WS and TV). The last instance, in Venezuela, is likely a consequence of the merger of two large companies: AS3356 (Level 3) and AS3549 (Global Crossing) [41].
8 Limitations
At a high level, CTI assumes all ASes and IP addresses are equivalent, which is certainly not the case. At the AS level, it is possible that one, dominant AS provides stronger security than a multitude of smaller ASes with tighter budgets. From the perspective of an attacker, though, a single AS having high CTI creates an opportunity; in the case of sophisticated attackers such as nation-states, the possibility of infiltration of any network cannot be discarded, but compromising many ASes simultaneously—in order to observe traffic towards countries where no AS has high CTI—may be more challenging. As such, ASes with very high CTI still present a concerningly large observation footprint, regardless of their level of security against infiltration181818Recall that CTI studies exposure to inbound traffic observation or selective tampering, which is unaffected by potentially asymmetric AS paths..
Similarly, IP addresses can represent vastly different entities. Both access and transit ASes may deploy carrier-grade network access translation (CGNAT) [53]. Since our model treats all routed IPs equally, it does not currently take into account the number of hosts multiplexing a single IP address. We leave this to future work, but note that an additional weight may be added to CTI: one that scales up the number of IP addresses in a given prefix by the number of hosts—or the number of “eyeballs”—connected to those IPs, on aggregate. Even within a given network, however, individual hosts are unlikely to be equally important as some (e.g., those belonging to governmental organizations or power-grid operators) may have more sensitive traffic. Conversely, some networks might not even actually use all their IP addresses—although the latter issue is likely less of a concern in the countries we have studied as their allocation of IPv4 addresses tends to be constrained [24].
In addition to this fundamental conceptual limitation, there are a variety of technical details that could have out-sized impact on our conclusions:
Incomplete BGP data. We acknowledge that the BGP paths we observe and use to compute CTI are incomplete given the location of BGP monitors. Given the serious implications for countries that appear highly exposed to external observation and selective tampering by an AS, we argue that it is important to study such exposure with available data. Further, we note that there are two important factors aiding the credibility of our CTI findings: (i) our validation with network operators, who have confirmed that the set of transit ASes identified in their countries is largely consistent with their own understanding of the country’s routing ecosystem. (ii) There is greater visibility over p2c links in the AS-level topology [48, 25], which enables our analysis as we are studying exposure to observation or selective tampering by transit ASes, in particular.
Despite these mitigating factors, we recognize that BGP incompleteness may impact the accuracy of CTI findings. We leave to future work an analysis of CTI’s sensitivity to changes in the BGP input (which would further mitigate concerns with BGP incompleteness), e.g., the addition or removal of BGP monitors, or the addition or removal of ASes who feed into each monitor. Finally, we note that CTI incorporates an outlier filter (§4.2.2 and §9.1) which has been shown as robust to changes in BGP input monitors [31].
Traffic. We use a country’s geolocated IP(v4) addresses as a proxy for the nation’s traffic, as this is a limited resource that is necessary to connect any device to the Internet. IP addresses are often used as a proxy for traffic, e.g., in [61], and previous work has found strong correlations between number of IP addresses observed in BGP and traffic volume for ASes that provide either access or transit service [47]. An AS that serves a larger number of IP addresses would consequently have more capabilities for traffic observation, either of a larger share of potential devices, or of traffic that is more sensitive in nature.
Additionally, we do not study direct peering with cloud/content providers, who are responsible for large volumes of user-destined traffic. In addition to p2p links with access or transit networks, these content providers may have in-network caches in the countries we study. These caches may be placed in the access network itself, in the influential transit providers we have identified, or elsewhere [17]. Content providers are large and complex distributed systems, employing sophisticated load balancing [27], routing, and DNS [62] techniques. Given these complexities, we leave to future work an evaluation of the impact on CTI of direct peering with cloud/content providers, and in-network cache placements.
Imperfect geolocation. A potential source of inaccuracy is IP geolocation, as assigning prefixes to a geographic area is challenging and the commercial providers who sell such information use proprietary methods. We have mitigated these concerns by calculating CTI using two commercial providers (§3), and find that the metric remains stable. We have also limited our analysis to the country level, where geolocation is more accurate than at finer granularities [18, 52, 35]. Further, while determining the location of prefixes originated by large transit providers with a global presence is problematic because of its dynamic nature and wide geographic spread, most networks are much smaller and will have limited geographic presence beyond their primary country of operation [69] (where most or all of their addresses will be located).
IPv6. Finally, we note that although our model has so far only been applied to IPv4 addresses—a reasonable scope given that IPv6 deployment is far from wide in many developing regions, including Africa [13, 46]—the code libraries and software tools we have used are compatible with IPv6, enabling future research in this area.
Inferring Primarily-Transit Countries. Any active campaign launched using publicly available infrastructure will be limited in its effectiveness to reveal peering links by the location of vantage points (VPs) from which the traceroutes are launched. Our campaign is no exception: our VPs are located in a small subset of the world’s ASes, and primarily in Europe and North America. However, we argue that our measurements form a sufficient basis to infer that, in the countries we have identified, foreign peering is rare, since: (i) we discussed our findings with operators in 12% of these countries, all of whom have confirmed that their nation relies primarily on transit providers to receive traffic from other countries since foreign peering there is rare to nonexistent; (ii) while our measurements are launched primarily from the U.S. and Europe, these regions do serve as important content sources and transit hubs (incl. for intracontinental traffic) for countries in Latin America, the Caribbean and Africa [16, 32, 40, 34, 30], where most of the nations we have identified are located.
9 Related Work
Several previous studies have focused on country-level routing, both for the identification of topological bottlenecks [58, 42] and to evaluate the impact of specific countries’ ASes on routes towards other countries [39]. All of these studies have used delegation data to map an entire AS to a country; these inferences are prone to inaccuracies when compared with more accurate and granular data such as IP-level geolocation, as important transit ASes may span multiple or many countries, or operate in a country different from their registration.
Previous work focused on the topologies of specific countries (Germany [66] and China [68]) and relied on country-specific methods and data sets that do not generalize to automatic inference of AS influence in any given country. Fanou et al. [28] studied the interdomain connectivity of intracontinental paths in Africa, using a large traceroute campaign (rather than BGP paths).
CAIDA’s AS Rank [48] is another topological metric developed to characterize the customer footprint of an AS on the global routing system. It does not try to capture the capabilities for observation of a transit AS for traffic flowing towards a country; we developed the CTI metric to try to do so.
9.1 National Chokepoint Potential and Hegemony
In this subsection, we describe differences between CTI and two closely related metrics, National Chokepoint Potential (NCP) [42] and Hegemony [31].
NCP. Leyba et al. [42] identified topological bottlenecks, a framework that would also help in quantifying exposure to observation (as CTI aims to address), but with some methodological differences, including: they identify transnational links towards each country using delegation records, and they define bottleneck ASes as those serving the most paths (rather than IP addresses). Further, both CTI and Leyba et al. [42] have as a goal the identification of international inbound—and, in their case, also outbound—chokepoints (i.e., topological bottlenecks) in each country, based on actual (CTI) or simulated (NCP) BGP paths towards each origin AS. However, their work does not try to capture the fraction of the country’s addresses served by a transit provider, but rather the fraction of paths that a border AS (i.e., an AS which is registered to the same country as the origin, but which has a neighbor that is registered to another country) may be able to intercept. Our work is more narrowly focused on the specific case of a transit provider serving traffic towards a transit-dominant country, taking into account the address space of the direct or indirect customers. Conceptually, weighting by paths enhances the influence—or potential, in Leyba et al.’s terminology—of ASes frequently serving a broad share of the country’s networks, whereas weighting by IPs yields higher influence to ASes frequently serving a large fraction of the country’s end hosts.
Hegemony. Our country-level transit influence metric is perhaps most similar to Hegemony [31]. Both metrics aim to identify the transit ASes that are most prevalent on paths towards origin ASes, weighted by the IP address space they serve. Hegemony can be applied either to the global AS-level graph, or to a “Local graph: … made only from AS paths with the same origin AS” [31]. The latter application is closest to CTI, as this analysis is limited to paths reaching a single origin AS; indeed, we use some of Hegemony local’s filtering techniques in our analysis (Sec. 4.2.2). The applicability of (local-graph) Hegemony to the problem of revealing which transit ASes have observation capabilities over traffic flowing towards a specific country—the issue addressed by CTI—is limited, as Hegemony is a metric of centrality of transit ASes on a specific origin AS (not a country).
We build a country-level alternative metric based on Hegemony [31] and compare CTI to it. The reason for the comparison is to determine if CTI is too aggressive in its filters, discarding too much input data. For that purpose, we build a benchmark using Hegemony local, a metric of centrality of any AS (including both transit providers and peers) on paths towards a single origin. Hegemony consists mostly of a single filter on input BGP data, making it an appropriate benchmark. This benchmark was not trivial to build, as Hegemony local produces a bilateral metric of influence between a transit AS and an origin AS on the global topology. While Hegemony is concerned with extracting the most accurate estimate of centrality on an existing graph, and not with estimating country-level inbound route diversity as CTI, it is possible to build a metric that serves a similar purpose as CTI, which we call country-level Hegemony () as
where is the Hegemony score of on during the same period191919As Hegemony is published in 15-min intervals [11], we take the 5-day average score. in March 2020 when we applied CTI, (all the other terms have been previously introduced in Eq. 6.3).
We computed the absolute value of the difference between CTI and CLH for each AS-coutry pair. The output of this analysis is (25th perc.,mean,median,75th perc.) = 0.00000, 0.00104, 0.00002, 0.00017, suggesting that both metrics tend to agree about the country-level influence of marginal ASes (the vast majority of AS-country pairs). Therefore, we find no evidence that the heuristics of CTI introduce unnecessary noise to our analysis because, on aggregate, a country-level alternative based on Hegemony—which excludes considerably fewer BGP monitors than CTI does—tends to agree with CTI’s assessment. The metrics do diverge on their assessment of ASes that CTI has identified as influential (CTI0.1), with an avg. difference between the metrics in those cases of 0.07.
10 Conclusions and Future Work
In this work we tackled the issue of quantifying the exposure of a country’s traffic to observation or tampering by specific ASes. The Country-Level Transit Influence (CTI) metric we developed aims to overcome several challenges with making such inferences using BGP data. We apply this metric in a set of—potentially at-risk—countries where transit provider-customer relationships are still the dominant inbound modality for international traffic; we identified these nations using both passive and active measurements. We applied CTI in these 75 countries and found that the median nation has 35% of their IP addresses served by a single transit AS.
In the future, we would like to develop measurement and analysis techniques that can be applied to study the exposure of countries that are not primarily served by transit providers, but rather by a dense mesh of bilateral and multilateral peering agreements, including those involving cloud providers and CDNs.
Acknowledgements
We thank our shepherd Amreesh Phokeer and the anonymous reviewers for their insightful comments, and Amogh Dhamdhere and kc claffy for providing generous feedback. We are grateful to the network operators who enabled our validation efforts. This work was partly funded by the National Science Foundation (NSF), Grant No. CNS 1705024. Author Gamero-Garrido was supported in part by the Microsoft Research Dissertation Grant (2019) and Northeastern University’s Future Faculty Fellowship (2021).
References
- [1] As rank : About. https://asrank.caida.org/about. (Accessed in May 2021).
- [2] Internet users - the world factbook. https://www.cia.gov/the-world-factbook/field/internet-users/country-comparison. (Accessed in May 2021).
- [3] Maxmind geolocation data. https://www.maxmind.com/en/geoip2-services-and-databases.
- [4] MPT, China Unicom Plan International Cable to Boost Internet Connectivity. https://www.submarinenetworks.com/news/mpt-china-unicom-plan-international-cable-to-boost-internet-connectivity, 2013.
- [5] CAIDA AS-Relationships. http://data.caida.org/datasets/as-relationships/, 2019.
- [6] RIPE Routing Information Service (RIS). https://www.ripe.net/analyse/internet-measurements/routing-information-service-ris, 2019.
- [7] RIR Delegation Files. https://ftp.ripe.net/pub/stats/ripencc/, 2019.
- [8] RouteViews. http://www.routeviews.org/routeviews/, 2019.
- [9] CAIDA’s PeeringDB dumps. data.caida.org/datasets/peeringdb/, 2020.
- [10] Coral Sea Cable System. www.coralseacablesystem.com.au/about/, 2020.
- [11] Hegemony API. https://ihr.iijlab.net/ihr/api/hegemony/, 2020.
- [12] Netacuity. http://info.digitalelement.com/, 2020.
- [13] E. Agbaraji, F. Opara, and M. Aririguzo. Ipv6 deployment status, the situation in africa and way out. IJAET, 2(1):315, 2012.
- [14] A. Akella, S. Seshan, and A. Shaikh. An empirical evaluation of wide-area internet bottlenecks. In IMC, pages 101–114, 2003.
- [15] Z. S. Bischof, R. Fontugne, and F. E. Bustamante. Untangling the world-wide mesh of undersea cables. In HotNets ’18, page 78–84, NY, USA, 2018. ACM.
- [16] Z. S. Bischof, J. P. Rula, and F. E. Bustamante. In and out of cuba: Characterizing cuba’s connectivity. In IMC ’15, pages 487–493, New York, NY, USA, 2015. ACM.
- [17] T. Böttger, F. Cuadrado, G. Tyson, I. Castro, and S. Uhlig. Open connect everywhere: A glimpse at the internet ecosystem through the lens of the netflix cdn. SIGCOMM Comput. Commun. Rev., 48(1):28–34, Apr. 2018.
- [18] Bradley Huffaker and Marina Fomenkov and kc claffy. Geocompare: a comparison of public and commercial geolocation databases. CAIDA Tech Report, 2011.
- [19] X. Cai, M. Rey, C. xuecai, J. Heidemann, C. johnh, and W. W. Niksun. A holistic framework for bridging physical threats to user qoe usc / isi technical report. 2013.
- [20] CAIDA. AS2Org. https://www.caida.org/research/topology/as2org/, 2020.
- [21] CAIDA. CAIDA IXP Dataset. https://www.caida.org/data/ixps/, 2020.
- [22] CAIDA. Routeviews Prefix-to-AS mappings (pfx2as) for IPv4 and IPv6. http://data.caida.org/datasets/routing/routeviews-prefix2as/, 2020.
- [23] E. Carisimo, A. Gamero-Garrido, A. C. Snoeren, and A. Dainotti. Identifying ases of state-owned internet operators. In IMC ’21, NY, USA, 2021. ACM.
- [24] Dainotti, A. and Benson, K. and King, A. and claffy, k. and Glatz, E. and Dimitropoulos, X. and Richter, P. and Finamore, A. and Snoeren, A. Lost in Space: Improving Inference of IPv4 Address Space Utilization, Oct 2014.
- [25] A. Dhamdhere and C. Dovrolis. Ten Years in the Evoultion of the Internet Ecosystem. In ACM Internet Measurement Conference (IMC), 2008.
- [26] A. Edmundson, R. Ensafi, N. Feamster, and J. Rexford. Nation-state hegemony in internet routing. In COMPASS ’18, NY, USA, 2018. ACM.
- [27] X. Fan, E. Katz-Bassett, and J. Heidemann. Assessing affinity between users and cdn sites. In TMA, pages 95–110, Cham, 2015. Springer.
- [28] R. Fanou, P. Francois, and E. Aben. On The Diversity of Interdomain Routing in Africa. In PAM, 2015.
- [29] R. Fanou, B. Huffaker, R. Mok, and k. claffy. Unintended consequences: Effects of submarine cable deployment on Internet routing. In PAM, Mar 2020.
- [30] R. Fanou, F. Valera, P. Francois, and A. Dhamdhere. Reshaping the african internet: From scattered islands to a connected continent. Comput. Commun., 113:25 – 42, 2017.
- [31] Fontugne, Romain and Shah, Anant and Aben, Emile. The (thin) Bridges of AS Connectivity: Measuring Dependency using AS Hegemony. In PAM, 2018.
- [32] H. Galperin. Connectivity in latin america and the caribbean: The role of internet exchange points. 2013.
- [33] A. Gamero-Garrido. Transit Influence of Autonomous Systems: Country-Specific Exposure of Internet Traffic. PhD thesis, UC San Diego, 2021.
- [34] G. Garcia. Why miami is latin america’s center of interconnection - interconnections - the equinix blog. https://blog.equinix.com/blog/2018/05/01/why-miami-is-latin-americas-center-of-interconnection/, May 2018.
- [35] Gharaibeh, Manaf and Shah, Anant and Huffaker, Bradley and Zhang, Han and Ensafi, Roya and Papadopoulos, Christos. A look at router geolocation in public and commercial databases. In IMC, 2017.
- [36] C. Giles. Myanmar coup: How the military disrupted the internet - bbc news. https://www.bbc.com/news/world-asia-55889565. (Accessed on 02/05/2021).
- [37] A. Gupta, M. Calder, N. Feamster, M. Chetty, E. Calandro, and E. Katz-Bassett. Peering at the internet’s frontier: A first look at isp interconnectivity in africa. In M. Faloutsos and A. Kuzmanovic, editors, PAM, 2014.
- [38] Infrapedia. Infrapedia. https://www.infrapedia.com/app, 2020.
- [39] J. Karlin, S. Forrest, and J. Rexford. Nation-State Routing: Censorship, Wiretapping, and BGP. In CoRR, 2009. http://arxiv.org/abs/cs/0608082, 2009.
- [40] D. Kiedanski and E. Grampín. Understanding latin america ipv6 connectivity: A preliminary exploration. In SCCC, pages 1–6, 2017.
- [41] Level 3 Completes Acquisition of Global Crossing. https://www.lightreading.com/ethernet-ip/ethernet-services/level-3-completes-acquisition-of-global-crossing/d/d-id/690402?, 2011.
- [42] K. G. Leyba, B. Edwards, C. Freeman, J. R. Crandall, and S. Forrest. Borders and Gateways: Measuring and Analyzing National AS Chokepoints. In COMPASS, 2019.
- [43] Liquid Telecom. Network. https://www.liquidtelecom.com/about-us/our_network, 2020.
- [44] J. Liu, W. Peng, Y. Yang, and Z. Huang. A delay-based analysis of multiple bottleneck links of end-to-end paths in the internet. In Z. Sun and Z. Deng, editors, CIAC ’13, pages 93–103. Springer, 2013.
- [45] S. Liu, Z. S. Bischof, I. Madan, P. K. Chan, and F. E. Bustamante. Out of sight, not out of mind: A user-view on the criticality of the submarine cable network. In IMC ’20, pages 194–200, NY, USA, 2020. ACM.
- [46] I. Livadariu, A. Elmokashfi, and A. Dhamdhere. Measuring ipv6 adoption in africa. In e-Infrastructure and e-Services for Developing Countries, Cham, 2018.
- [47] A. Lodhi, N. Larson, A. Dhamdhere, C. Dovrolis, and k. claffy. Using PeeringDB to Understand the Peering Ecosystem. In ACM CCR, 2014.
- [48] M. Luckie, B. Huffaker, A. Dhamdhere, V. Giotsas, and K. Claffy. AS relationships, customer cones, and validation. In ACM IMC, 2013.
- [49] A. Marder, M. Luckie, A. Dhamdhere, B. Huffaker, J. Smith, and k. claffy. Pushing the Boundaries with bdrmapIT: Mapping Router Ownership at Internet Scale. In Internet Measurement Conference (IMC), pages 56–69, Nov 2018.
- [50] A. Mauldin. Is your planned submarine cable doomed? https://blog.telegeography.com/is-your-planned-submarine-cable-doomed, 2019.
- [51] B. Mbaye, A. Gueye, D. Banse, and A. Diop. Africa’s online access: What data is getting accessed and where it is hosted? In Innovations and Interdisciplinary Solutions for Underserved Areas, pages 50–61, Cham, 2019. Springer.
- [52] I. Poese, S. Uhlig, M. A. Kaafar, B. Donnet, and B. Gueye. Ip geolocation databases: Unreliable? SIGCOMM CCR, 41(2):53–56, Apr. 2011.
- [53] P. Richter, F. Wohlfart, N. Vallina-Rodriguez, M. Allman, R. Bush, A. Feldmann, C. Kreibich, N. Weaver, and V. Paxson. A multi-perspective analysis of carrier-grade nat deployment. In IMC ’16, pages 215—229, NY, USA, 2016. ACM.
- [54] RIPE NCC. Probes. https://atlas.ripe.net/probes/, 2020.
- [55] RIPE NCC. RIPE Atlas - User-Defined Measurements. https://atlas.ripe.net/docs/udm/, 2020.
- [56] RIPE NCC. RIPE Atlas Probe Archive. https://ftp.ripe.net/ripe/atlas/probes/archive/, 2020.
- [57] RIPE NCC. RIS - RIPE Network Coordination Center. http://www.ris.ripe.net/peerlist/all.shtml, 2020.
- [58] Roberts, Hal and Larochelle, David and Faris, Rob and Palfrey, John. Mapping Local Internet Control. Tech Report, Berkman Center, Harvard University, 2011.
- [59] RouteViews. Collectors - RouteViews. http://www.routeviews.org/routeviews/index.php/collectors/, 2020.
- [60] A. Shah, R. Fontugne, and C. Papadopoulos. Towards characterizing international routing detours. In AINTEC ’16, page 17–24, New York, NY, USA, 2016. ACM.
- [61] F. Soldo and A. Metwally. Traffic anomaly detection based on the ip size distribution. In 2012 Proceedings IEEE INFOCOM, pages 2005–2013, 2012.
- [62] A.-J. Su, D. R. Choffnes, A. Kuzmanovic, and F. E. Bustamante. Drafting behind akamai (travelocity-based detouring). In ACM CCR, NY, USA, 2006. ACM.
- [63] Talanei. ASH Cable buys bandwidth from Tui Samoa. https://www.talanei.com/2018/05/10/ash-cable-buys-bandwidth-from-tui-samoa/, 2020.
- [64] TeleGeography. Submarine Cable Map. www.submarinecablemap.com, 2020.
- [65] TOT Public Company Limited. TOT: INTERNATIONAL SUBMARINE CABLE. https://www.boi.go.th/upload/content/tot_5d254fe992f21.pdf, 2020.
- [66] Wahlisch, Matthias and Schmidt, Thomas and de Brun, Markus and Haberlen, Thomas. Exposing a Nation-Centric View on the German Internet - A Change in Perspective on AS-level. In PAM, 2012.
- [67] A. Zeitoun, Chen-Nee Chuah, S. Bhattacharyya, and C. Diot. An as-level study of internet path delay characteristics. In IEEE Global Telecommunications Conference, 2004. GLOBECOM ’04., volume 3, pages 1480–1484 Vol.3, 2004.
- [68] S. Zhou, G. Zhang, and G. Zhang. Chinese Internet AS-Level Topology. IET Communications, 2(1), Apr. 2007.
- [69] R. Zhuo, B. Huffaker, k. claffy, and S. Greenstein. The impact of the general data protection regulation on internet interconnection. Telecomm Policy, 45 (2), 2021.
Appendix 0.A BGP Monitor Location and CTI Process Diagram
0.A.1 BGP Monitor Location
We begin with the 685 monitors in RIPE and RouteViews. We discard (91) monitors aggregated at multi-hop collectors and monitors that are not full-feed, so we are left with 350 monitors in 209 ASes. We determine the location of each full-feed BGP monitor as follows. First, we find the locations of RouteViews and RIPE RIS BGP collectors. We build a first set of locations by finding RIPE Atlas probes co-located at Internet Exchange Points (IXPs), by searching the list of peers for the IXP name, and assign that probe to the country where the (single-location) IXP is present, e.g., BGP RRC01 – LINX / LONAP, London, United Kingdom. We confirm the BGP monitor location by running ping measurements from RIPE Atlas probes hosted at the IXP to the BGP monitor’s IP address, and conclude that the BGP monitor is in the same city as the IXP if the RTT is lower than 5 ms. For the remaining BGP monitors we look for available RIPE Atlas probes in the ASes that peer with the same BGP collector, and similarly run ping measurements towards both the BGP monitor’s IP address and a RIPE Atlas probe located in the same city as the one listed for the monitor. We conclude that the BGP monitor and RIPE Atlas probe are in the same city if both sets of RTTs are under 5 ms.
We exclude 118 monitors at this stage because there is no available RIPE Atlas probe hosted at the IXP (in the city where the monitor is listed) nor at any of the other peers of the collector aggregating announcements from the BGP monitor. We discard remote peers from our set, those that have ping RTTs higher than 30 ms from the RIPE Atlas probe in the BGP monitor’s listed city. For monitors with an RTT between 5–30 ms, we infer them to be at the listed location if we get confirmation using DNS records—i.e., we find a geographical hint such as a three-letter city or airport code, or the full name of the city, using a reverse lookup with the BGP monitor’s IP address—or a matching country of the BGP monitor’s peer_asn record in the RIPE RIS or RouteViews collector list [59, 57]. Our final set has 214 monitors in 145 ASes and 19 countries. We quantify the aggregate impact of all of our filters, including the exclusion of certain BGP monitors per country, in §9.1, given an alternative metric built using previous research [31].
0.A.2 CTI Process Diagram
We show a process diagram of our methodology in Fig. 10. There, our transit-dominance country selection is shown in the top right corner, while the remaining blocks on the top row refer to CTI inputs and preprocessing steps. Finally, the bottom row shows the core components of the CTI metric.