Photometric Objects Around Cosmic Webs (PAC) Delineated in a Spectroscopic survey. II. Morphology, Color and Size Dependences of the Stellar-halo Mass Relation for Massive Galaxies
Abstract
In this paper, we report a robust measurement of the morphology, color and galaxy size dependences of the stellar-halo mass relation (SHMR) at the high mass end () at redshift 111Throughout the paper, we use for redshift, for the z-band magnitude.. Applying our method, Photometric objects Around Cosmic webs (PAC), developed in a previous work to CMASS and HSC-SSP observations, we measure the excess surface density () of satellites around massive central galaxies with different morphologies indicated by Sérsic index . We find that more compact (larger ) central galaxies are surrounded by more satellites. With the abundance matching method, we estimate halo mass for the central galaxies, and find that halo mass is increased monotonically with , solid evidence for a morphology dependence of SHMR. Specifically, our results show that the most compact galaxies () have the halo mass around 5.5 times larger than the disk galaxies (). Similarly, using the effective radius and the rest-frame color, we find that red (large) galaxies reside in halos that are in average () times more massive than those hosting blue (small) galaxies.
1 Introduction
The stellar-halo mass relation (SHMR) is one of the most fundamental relations in galaxy-halo connection (see Wechsler & Tinker (2018) for a review), in which larger dark matter halos host more massive galaxies with a relatively tight scatter. SHMR has been measured with different data and methods in the past decade (Zheng et al., 2007; Guo et al., 2010; Wang & Jing, 2010; Yang et al., 2012; Moster et al., 2013; Behroozi et al., 2019), and it reflects the sophisticated regulation of complex physical processes in galaxy formation such as gas accretion and feedback processes at different mass scales.
The SHMR is a relation between the halo mass and galactic stellar mass, which is assumed to be independent of other properties of halos or galaxies in early studies. However, recent studies (e.g., Cooper et al. (2010); Zentner et al. (2014); Zu et al. (2021a, b)) have paid more attention on whether galaxies with different properties have different SHMRs, which is also related to so-called galaxy assembly bias that causes the scatter in the SHMR. Till now, there is no consensus about the dependence on other galaxy properties. For example, some studies found that red central galaxies reside in more massive halos than blue ones (Cooper et al., 2010; Wang et al., 2013; Zentner et al., 2014; Rodríguez-Puebla et al., 2015; Hearin et al., 2015; Mandelbaum et al., 2016), while others found an opposite relation that blue galaxies have more massive host halos (Tinker et al., 2013; Moster et al., 2018; Guo et al., 2019). Using HI rotation curves, Posti et al. (2019) showed that local massive spiral galaxies are hosted by smaller dark matter halos, implying a morphology dependence of SHMR. Moreover, this dependence does not show up in some of current cosmological hydrodynamical simulations (Marasco et al., 2020), while it does exist in some others (e.g., Cui et al. (2021)). The galaxy size dependence of SHMR has also been investigated in some studies (Charlton et al., 2017; Desmond et al., 2017; Somerville et al., 2018) but a clear answer to this question does not exist yet. In summary, it is still under hot debate both in observations and in theories if there exist secondary parameters for the SHMR other than the stellar mass.
In this paper, using the method named Photometric objects Around Cosmic webs (PAC) developed in the first paper of this series (Xu et al., 2021), we measure the dependences of SHMR on morphology, galaxy size and color for massive galaxies, and report robust detections of both dependences, which shows unambiguously that large, red or more compact galaxies are located in more massive halos.
We adopt the cosmology with , and through out the paper.
2 Data and method
In Xu et al. (2021, hearafter Paper I), we developed a method for estimating the projected density distribution of photometric objects around spectroscopic objects in a spectroscopic survey, where is the mean number density of the photometric objects and is the projected cross-correlation function (PCCF). This quantity describes the distribution of Photometric sources with certain physical properties (e.g. luminosity, mass, color etc) Around Cosmic webs (PAC) traced by the spectroscopic objects. Since the halo mass is highly correlated with the satellite distribution (Wang et al., 2021), PAC is very powerful for studying SHMR. For details of the method, we refer the readers to Paper I.
As in Paper I, we use the HSC-SSP PDR2 wide field photometric catalog (Aihara et al., 2019) as the photometric sample. To obtain more accurate physical properties, we choose sources in the footprints observed with all five bands () to ensure that there are enough bands for SED. Sources around bright objects are masked using {grizy}_mask_pdr2_bright_objectcenter flag provided by the HSC collaboration (Coupon et al., 2018). And we use the {grizy}_extendedness_value flag to exclude stars in the sample. Finally, there are around galaxies in our photometric sample. We can also construct a random point catalog () with the same selection criteria from the HSC database for PAC analysis. The effective area calculated from the random point number is .
We use the CMASS sample in the Baryon Oscillation Spectroscopic Survey (BOSS; Ahn et al. (2012); Bolton et al. (2012)) that consists of massive galaxies with as spectroscopic sample (population 1). We first select galaxies in the redshift range of , and then cross match it with the HSC photometric sample we constructed above and The DESI Legacy Imaging Surveys DR9 catalog (Dey et al., 2019). After that, we get the magnitudes in seven bands for each CMASS galaxy in the footprint of HSC. Then we calculate the physical properties (e.g. stellar mass and rest-frame colors) for these galaxies using the spectral energy distribution (SED) fitting code CIGALE (Boquien et al., 2019). The details of SED have been discribed in Paper I. As noticed by previous studies (Maraston et al., 2013; Leauthaud et al., 2016; Guo et al., 2018), the CMASS sample is complete to stellar mass . Therefore, we adopt a stellar mass cut at in this study. Moreover, we only consider central galaxies in the spectroscopic sample, so we select galaxies which do not have more massive neighbors within the projected distance of . Finally, there are massive () central galaxies left in the spectroscopic sample.
To study the morphology and size of galaxies, we fit the HSC band images with the Sérsic profile (Sérsic, 1963) for all the galaxies in our spectroscopic sample. The radial luminosity distribution of a galaxy is described by the Sérsic form:
| (1) |
where satisfies:
| (2) |
is the intensity at the half-light radius , and , called the Sérsic index, describes the compactness of a luminosity profile. and are respectively the Gamma function and lower incomplete Gamma function. Generally speaking, disk galaxies have exponential profiles with , and ellipticals follow the de Vaucouleurs profiles with . The 2D image fitting is performed using galfit (Peng et al., 2002) with the point spread function (PSF) taken into account. Other sources falling in the fitting regions are detected and masked out using sextractor (Bertin & Arnouts, 1996). Since an ongoing merger with companions may lead to a meaningless fitting result with a low , we visually inspect the images of galaxies with and abandon those with apparent major mergers.
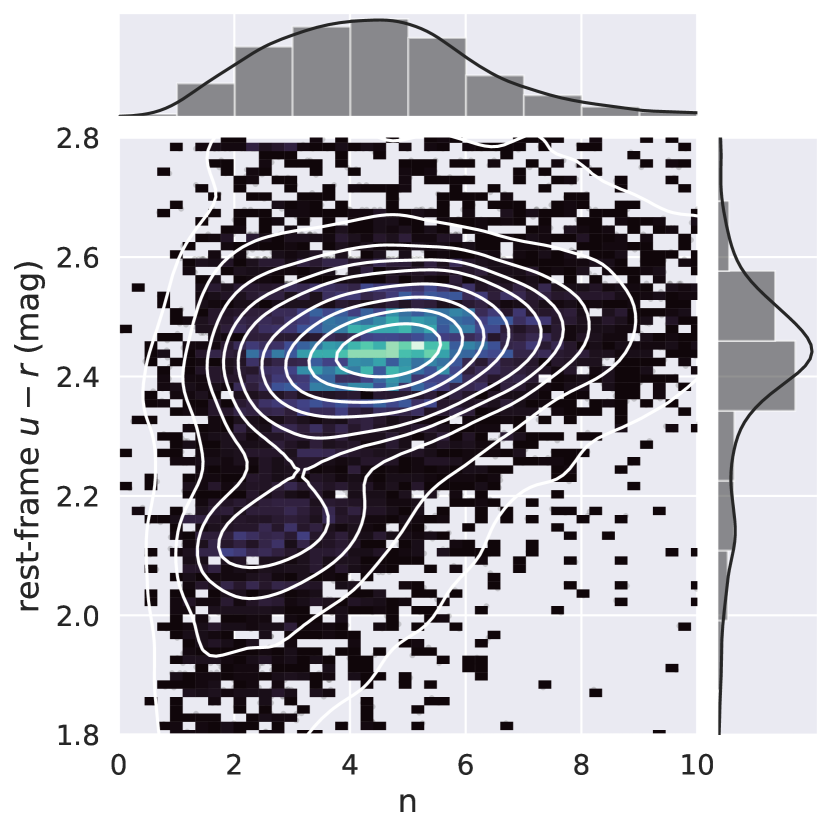
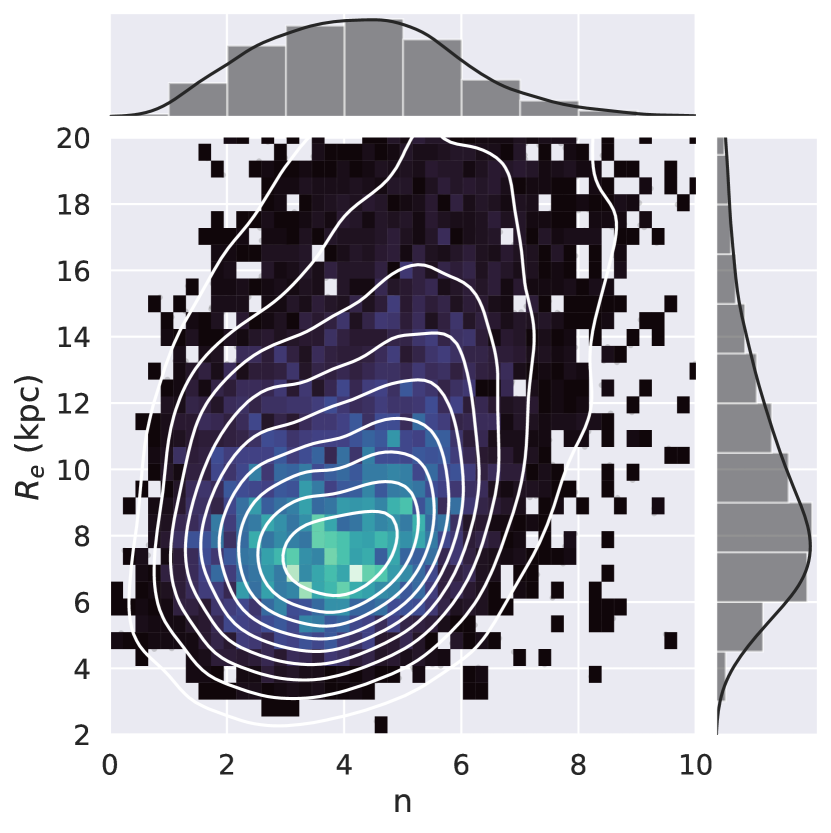
In the left panel of Figure 1, we show the rest-frame color vs. morphology diagram of the CMASS sample. Colors of galaxies is distributed bimodally and weakly correlated with . We adopt as the color cut for blue and red galaxies with the average Sérsic index and respectively. The right panel of Figure 1 shows the galaxy size vs. morphology diagram, in which the galaxy size slightly increases with increasing . We use the median galaxy size as the dividing line for large and small size galaxies.
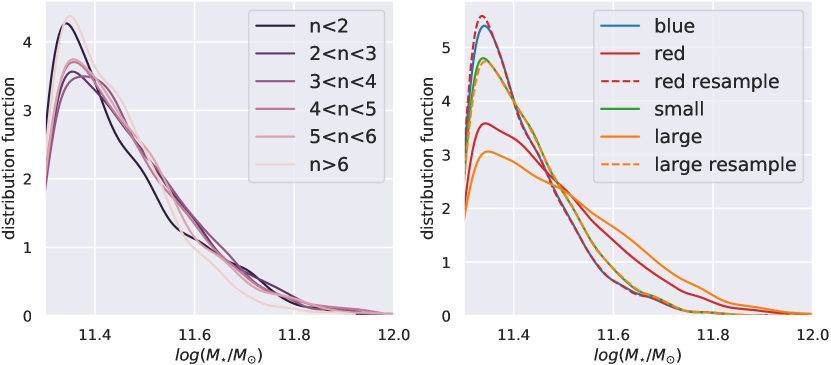
In Figure 2, we show the stellar mass distributions for galaxies with different morphologies (left), colors and sizes (right). The mass distribution is nearly the same for galaxies with different morphologies. Therefore, the halo mass difference for galaxies with different morphologies, as we will show in the next section, is independent of the stellar mass. However, large and/or red galaxies tend to be more massive than small and/or blue ones. To eliminate the stellar mass dependence, we construct a controlled sample of large and red galaxies that has the same stellar mass distribution as the small and blue one (dashed lines), and will use it in the following analysis.
3 Results
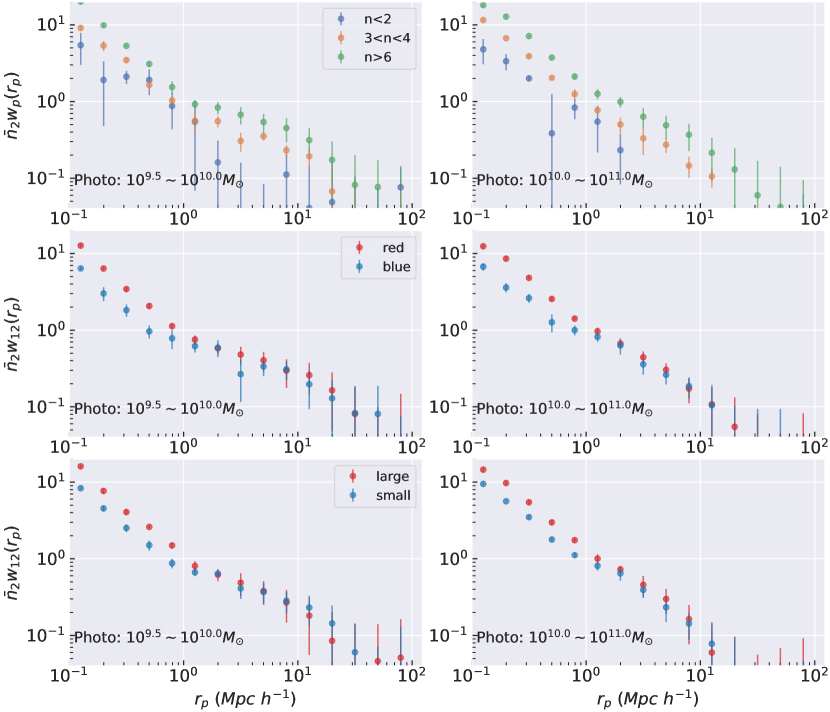
Following Paper I, we calculate between the photometric sample in 2 mass bins and the spectroscopic sample within the stellar mass range that contains most of the CMASS galaxies. In addition, to study the morphology, color and size dependences, we divide the spectroscopic sample into 6 sub-samples according to , 2 sub-samples according to color or . Errors are estimated using jackknife resampling by further dividing each spectroscopic sub-samples into 50 sub-samples. Completeness of the photometric sample is considered using the z-band completeness limit defined in Paper I (See their Figure 1).
The measurements are shown in Figure 3. Each panel shows the results for the same mass bin but with different morphologies, colors or sizes. To better illustrate the results, we only show the measurements for three morphology bins while the conclusion hold for all six morphology bins. The measurements are overall robust within . For galaxies with different morphologies, increases with , indicating that galaxies with more compact structure have more satellites. Since the halo mass of central galaxies is highly correlated with their satellite distribution, it implies that compact galaxies reside in more massive dark matter halos. Similarly, red (large) galaxies have higher than their blue (small) counterparts, and are expected to have larger host halos.
To quantify the halo mass difference between galaxies with different morphologies, colors and sizes, we use abundance matching (AM, Wang & Jing (2010); Moster et al. (2013); Behroozi et al. (2019)) to estimate the halo mass of galaxies. As in Paper I, we use the CDM CosmicGrowth Simulation (Jing & Suto, 2002; Jing, 2019) with cosmological parameters , and . The box size is with dark matter particles and softening length . The SHMR can be described by a formula of double power-law form:
| (3) |
where is defined as the viral mass of the halo at the time when the galaxy was last the central dominant object. We use the fitting formula in Bryan & Norman (1998) to find . The scatter in at a given is described with a Gaussian function of the width . We populate galaxies to halos using results from Paper I with , , , and .
With the assumption that the halo mass is completely determined by the satellite distribution (Han et al., 2016; Wang et al., 2021) and with the mock galaxy catalog constructed above, the mean halo mass of central galaxies with specific properties can be estimated through matching the observed excess surface density () to halos with certain halo mass in simulation. To compare observation with simulation, we define:
| (4) |
where is the total number of points over which is compared. We use the Markov chain Monte Carlo (MCMC) sampler emcee (Foreman-Mackey et al., 2013) to perform a maximum likelihood analysis.
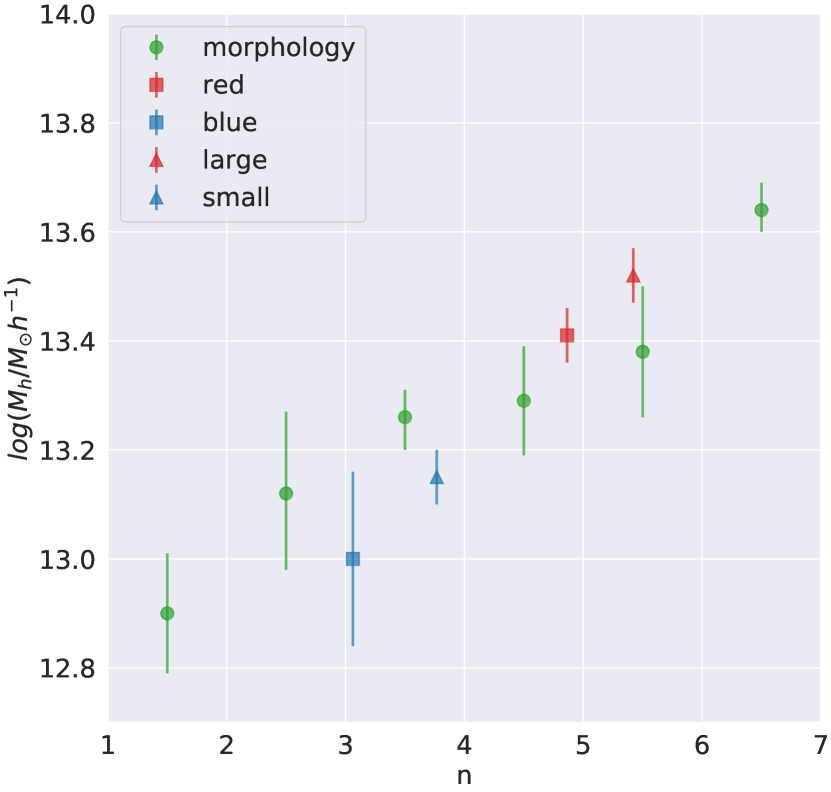
Halo mass estimated from AM for the spectroscopic sample for different morphologies and colors is shown in Figure 4. For morphology (green dots) dependence, halo mass increases monotonically with Sérsic index , and the most compact galaxies () have the halo mass around times larger than the disk galaxies (). For color (squares), red galaxies reside in halos times more massive than those hosting blue galaxies. And for galaxy size. large galaxies reside in halos times more massive than those hosting small galaxies.
4 conclusion and Discussion
In this paper, we report the morphology, color and size dependences of the SHMR for massive () central galaxies. Using CMASS and HSC-SSP samples and with PAC developed in Paper I, we calculate the excess surface density of satellites and neighbours for the massive central galaxies with different morphologies (), colors () and sizes (). We find that, at the same stellar mass, galaxies with more compact morphology, red color and/or large size are surrounded by more satellites. Using AM, we estimate the halo mass for central galaxies with different morphologies, colors and sizes. The results show that more compact, red and/or large central galaxies reside in more massive halos. Specifically, the most compact galaxies () have the halo mass times larger than the disk ones (), red galaxies reside in halos times more massive than the blue counterparts, and galaxies with large size have the halo mass times larger than galaxies with small size.
The physical origin of the morphology or color dependence of SHMR is still not well understood. One possible picture is that, for the same halo mass, compact galaxies assemble and transform their morphology earlier and then their star formation is quenched by mechanisms such as active galactic nucleus (AGN) feedback. After the quenching, their halos stills keep growing under the hierarchical formation framework. And for more disky galaxies, the star formation is quenched later or even continues, resulting in a larger stellar mass at a fixed halo mass. Our results also show that the morphology and color dependences are in some way degenerate, and it seems the morphology dependence is more fundamental at least for the massive galaxies.
The size dependence of SHMR may be explained by the minor merger scenario (Naab et al., 2009; Hopkins et al., 2010) that the rate of minor mergers is higher in more massive halos and minor mergers result in size increase. If minor mergers are more frequent in more massive halos, this may introduce a halo mass-size correlation at fixed stellar mass.
In future, with larger photometric and spectroscopic samples, we plan to check whether the morphology, color and size dependences of SHMR hold for lower mass central galaxies. We also plan to verify the estimated halo mass from AM using weak lensing measurements.
References
- Ahn et al. (2012) Ahn, C. P., Alexandroff, R., Allende Prieto, C., et al. 2012, ApJS, 203, 21, doi: 10.1088/0067-0049/203/2/21
- Aihara et al. (2019) Aihara, H., AlSayyad, Y., Ando, M., et al. 2019, PASJ, 71, 114, doi: 10.1093/pasj/psz103
- Behroozi et al. (2019) Behroozi, P., Wechsler, R. H., Hearin, A. P., & Conroy, C. 2019, MNRAS, 488, 3143, doi: 10.1093/mnras/stz1182
- Bertin & Arnouts (1996) Bertin, E., & Arnouts, S. 1996, A&AS, 117, 393, doi: 10.1051/aas:1996164
- Bolton et al. (2012) Bolton, A. S., Schlegel, D. J., Aubourg, É., et al. 2012, AJ, 144, 144, doi: 10.1088/0004-6256/144/5/144
- Boquien et al. (2019) Boquien, M., Burgarella, D., Roehlly, Y., et al. 2019, A&A, 622, A103, doi: 10.1051/0004-6361/201834156
- Bryan & Norman (1998) Bryan, G. L., & Norman, M. L. 1998, ApJ, 495, 80, doi: 10.1086/305262
- Charlton et al. (2017) Charlton, P. J. L., Hudson, M. J., Balogh, M. L., & Khatri, S. 2017, MNRAS, 472, 2367, doi: 10.1093/mnras/stx2068
- Cooper et al. (2010) Cooper, M. C., Gallazzi, A., Newman, J. A., & Yan, R. 2010, MNRAS, 402, 1942, doi: 10.1111/j.1365-2966.2009.16020.x
- Coupon et al. (2018) Coupon, J., Czakon, N., Bosch, J., et al. 2018, PASJ, 70, S7, doi: 10.1093/pasj/psx047
- Cui et al. (2021) Cui, W., Davé, R., Peacock, J. A., Anglés-Alcázar, D., & Yang, X. 2021, Nature Astronomy, doi: 10.1038/s41550-021-01404-1
- Desmond et al. (2017) Desmond, H., Mao, Y.-Y., Wechsler, R. H., Crain, R. A., & Schaye, J. 2017, MNRAS, 471, L11, doi: 10.1093/mnrasl/slx093
- Dey et al. (2019) Dey, A., Schlegel, D. J., Lang, D., et al. 2019, AJ, 157, 168, doi: 10.3847/1538-3881/ab089d
- Foreman-Mackey et al. (2013) Foreman-Mackey, D., Hogg, D. W., Lang, D., & Goodman, J. 2013, PASP, 125, 306, doi: 10.1086/670067
- Guo et al. (2018) Guo, H., Yang, X., & Lu, Y. 2018, ApJ, 858, 30, doi: 10.3847/1538-4357/aabc56
- Guo et al. (2019) Guo, H., Yang, X., Raichoor, A., et al. 2019, ApJ, 871, 147, doi: 10.3847/1538-4357/aaf9ad
- Guo et al. (2010) Guo, Q., White, S., Li, C., & Boylan-Kolchin, M. 2010, MNRAS, 404, 1111, doi: 10.1111/j.1365-2966.2010.16341.x
- Han et al. (2016) Han, J., Cole, S., Frenk, C. S., & Jing, Y. 2016, MNRAS, 457, 1208, doi: 10.1093/mnras/stv2900
- Hearin et al. (2015) Hearin, A. P., Watson, D. F., & van den Bosch, F. C. 2015, MNRAS, 452, 1958, doi: 10.1093/mnras/stv1358
- Hopkins et al. (2010) Hopkins, P. F., Bundy, K., Hernquist, L., Wuyts, S., & Cox, T. J. 2010, MNRAS, 401, 1099, doi: 10.1111/j.1365-2966.2009.15699.x
- Jing (2019) Jing, Y. 2019, Science China Physics, Mechanics, and Astronomy, 62, 19511, doi: 10.1007/s11433-018-9286-x
- Jing & Suto (2002) Jing, Y. P., & Suto, Y. 2002, ApJ, 574, 538, doi: 10.1086/341065
- Leauthaud et al. (2016) Leauthaud, A., Bundy, K., Saito, S., et al. 2016, MNRAS, 457, 4021, doi: 10.1093/mnras/stw117
- Mandelbaum et al. (2016) Mandelbaum, R., Wang, W., Zu, Y., et al. 2016, MNRAS, 457, 3200, doi: 10.1093/mnras/stw188
- Marasco et al. (2020) Marasco, A., Posti, L., Oman, K., et al. 2020, A&A, 640, A70, doi: 10.1051/0004-6361/202038326
- Maraston et al. (2013) Maraston, C., Pforr, J., Henriques, B. M., et al. 2013, MNRAS, 435, 2764, doi: 10.1093/mnras/stt1424
- Moster et al. (2013) Moster, B. P., Naab, T., & White, S. D. M. 2013, MNRAS, 428, 3121, doi: 10.1093/mnras/sts261
- Moster et al. (2018) —. 2018, MNRAS, 477, 1822, doi: 10.1093/mnras/sty655
- Naab et al. (2009) Naab, T., Johansson, P. H., & Ostriker, J. P. 2009, ApJ, 699, L178, doi: 10.1088/0004-637X/699/2/L178
- Peng et al. (2002) Peng, C. Y., Ho, L. C., Impey, C. D., & Rix, H.-W. 2002, AJ, 124, 266, doi: 10.1086/340952
- Posti et al. (2019) Posti, L., Fraternali, F., & Marasco, A. 2019, A&A, 626, A56, doi: 10.1051/0004-6361/201935553
- Rodríguez-Puebla et al. (2015) Rodríguez-Puebla, A., Avila-Reese, V., Yang, X., et al. 2015, ApJ, 799, 130, doi: 10.1088/0004-637X/799/2/130
- Sérsic (1963) Sérsic, J. L. 1963, Boletin de la Asociacion Argentina de Astronomia La Plata Argentina, 6, 41
- Somerville et al. (2018) Somerville, R. S., Behroozi, P., Pandya, V., et al. 2018, MNRAS, 473, 2714, doi: 10.1093/mnras/stx2040
- Tinker et al. (2013) Tinker, J. L., Leauthaud, A., Bundy, K., et al. 2013, ApJ, 778, 93, doi: 10.1088/0004-637X/778/2/93
- Wang & Jing (2010) Wang, L., & Jing, Y. P. 2010, MNRAS, 402, 1796, doi: 10.1111/j.1365-2966.2009.16007.x
- Wang et al. (2013) Wang, L., Weinmann, S. M., De Lucia, G., & Yang, X. 2013, MNRAS, 433, 515, doi: 10.1093/mnras/stt743
- Wang et al. (2021) Wang, W., Li, X., Shi, J., et al. 2021, arXiv e-prints, arXiv:2104.05355. https://arxiv.org/abs/2104.05355
- Wechsler & Tinker (2018) Wechsler, R. H., & Tinker, J. L. 2018, ARA&A, 56, 435, doi: 10.1146/annurev-astro-081817-051756
- Xu et al. (2021) Xu, K., Zheng, Y., & Jing, Y. 2021, arXiv e-prints, arXiv:2109.11738. https://arxiv.org/abs/2109.11738
- Yang et al. (2012) Yang, X., Mo, H. J., van den Bosch, F. C., Zhang, Y., & Han, J. 2012, ApJ, 752, 41, doi: 10.1088/0004-637X/752/1/41
- Zentner et al. (2014) Zentner, A. R., Hearin, A. P., & van den Bosch, F. C. 2014, MNRAS, 443, 3044, doi: 10.1093/mnras/stu1383
- Zheng et al. (2007) Zheng, Z., Coil, A. L., & Zehavi, I. 2007, ApJ, 667, 760, doi: 10.1086/521074
- Zu et al. (2021a) Zu, Y., Shan, H., Zhang, J., et al. 2021a, MNRAS, 505, 5117, doi: 10.1093/mnras/stab1712
- Zu et al. (2021b) Zu, Y., Song, Y., Shao, Z., et al. 2021b, arXiv e-prints, arXiv:2108.06790. https://arxiv.org/abs/2108.06790