1]organization=DataStax Inc.
Fallout: Distributed Systems Testing as a Service
Abstract
All modern distributed systems list performance and scalability as their core strengths. Given that optimal performance requires carefully selecting configuration options, and typical cluster sizes can range anywhere from 2 to 300 nodes, it is rare for any two clusters to be exactly the same. Validating the behavior and performance of distributed systems in this large configuration space is challenging without automation that stretches across the software stack. In this paper we present Fallout, an open-source distributed systems testing service that automatically provisions and configures distributed systems and clients, supports running a variety of workloads and benchmarks, and generates performance reports based on collected metrics for visual analysis. We have been running the Fallout service internally at DataStax for over 5 years and have recently open sourced it to support our work with Apache Cassandra, Pulsar, and other open source projects. We describe the architecture of Fallout along with the evolution of its design and the lessons we learned operating this service in a dynamic environment where teams work on different products and favor different benchmarking tools.
keywords:
Distributed Systems \sepDatabases \sepPerformance \sepApache Cassandra, Pulsar1 Introduction
Building databases and distributed systems with high performance requires thorough testing and benchmarking. The earlier that performance testing can be done in the development process, the cheaper issues are to fix [3].
Software teams are now expected to use techniques such as CI/CD [13] to deliver frequent releases to users. For many types of products, including distributed systems and databases, users also expect the systems to be resilient, never lose data, and always achieve high performance. Strong automated testing tools are required to reduce development time and deliver stable products.
Automating the testing of complex distributed systems requires tightly controlling every aspect of the software: from operating system configurations to application-level tuning. Fallout evolved into a full-stack orchestration system, enabling us to test and tweak all aspects of the distributed system under test. Fallout is a service that deploys hardware resources, configures the operating system and distributed application, runs a workload or benchmark on the cluster and gathers the results for analysis. Through a rich YAML-based configuration, every aspect of the system and application can be detailed and parameterized.
We use Fallout to run a mixture of manual and automated testing and Fallout executes around 200 tests every day. These tests have been used to verify the performance of new features and optimizations, uncover functional and performance regressions before they have shipped to customers, and reproduce issues that were discovered in the field. Recently, we have added support for chaos testing too. Automated testing is driven by Jenkins which is the CI tool of choice for the majority of our teams. The rest of this paper is organized as follows. In Section 2 we discuss our rationale for building Fallout along with the existing tools at the time. In Section 3 we present a high-level overview of the Fallout design and dive down into the details in Section 4. Section 5 illustrates how Fallout test run results are displayed for users. Lessons learned, related work, and conclusions are covered in Section 6, 7, and 8.
2 Background
Five years ago, we had a server-based performance testing and comparison tool named cstar_perf that could bootstrap Apache Cassandra onto an already provisioned cluster, run a workload against it, and plot the performance results on a web page. The workload was composed via a web UI and used cassandra-stress [2] to generate load on the cluster. cstar_perf gave us some flexibility in that the Cassandra installation could be configured in a number of ways but it also came with many limitations. The size of the cluster was fixed and could not be changed. The workload consisted of a number of linear steps, each of which could invoke one of a small number of tools. This gave us neither the modularity we needed to support diverse teams with different preferences for benchmarks, tools, and workloads, nor the parallelism required to run multiple tests at once.
Fallout was conceptualized to address these limitations. There was a clear need to create a system that could seamlessly stitch together a plethora of tools and systems built by internal teams so they could be made to work together while remaining tool agnostic. It was also desired to provide the ability to support any testing environment, be it public or private cloud. Since Fallout needed to test distributed systems, it needed to support scenarios involving multiple server/client clusters and a myriad topology configurations as well as tools that disrupt normal operation such as throttling the network bandwidth and deleting cluster data. While cstar_perf gave us the ability to analyze performance for a single test run we also wanted the ability to generate better insights into results by gathering artifacts from those clusters. To encourage adoption from a diverse set of stakeholders, Fallout was required to be intuitive, simple, and self-documenting. The target user group ranged from seasoned database engineers to non-developers. Hence, Fallout needed to use a declarative language that was simple for non-developers to write tests in. The artifacts involved in Fallout were required to be persisted and versioned for future reference. All of the test configurations, results, and artifacts were to be stored in a single place so that everything could be trivially shared within our organization.
In summary, Fallout addresses the following engineering challenges:
-
•
Build a testing service that provides a single interface for multiple teams to run test and benchmarking tools
-
•
Use simple test configuration files to deploy tests into distributed systems that accurately reflect real-world configurations
-
•
Extract and preserve test run artifacts for later analysis
-
•
Ease of use for both developers and non-developers
The initial version of Fallout used Jepsen [16] as the workload execution tool. This was largely a pragmatic choice since Jepsen was well-known in the original Fallout team and using it avoided the need to reinvent the wheel by creating a brand new tool. Fallout extended Jepsen’s correctness testing features by creating operation logs during test runs and allowing pass/fail checks to be run on test completion. Over time, Fallout has evolved into a more performance-focussed service but still retains a couple of the original Jepsen concepts such as Checkers and operation logs.
3 Architecture
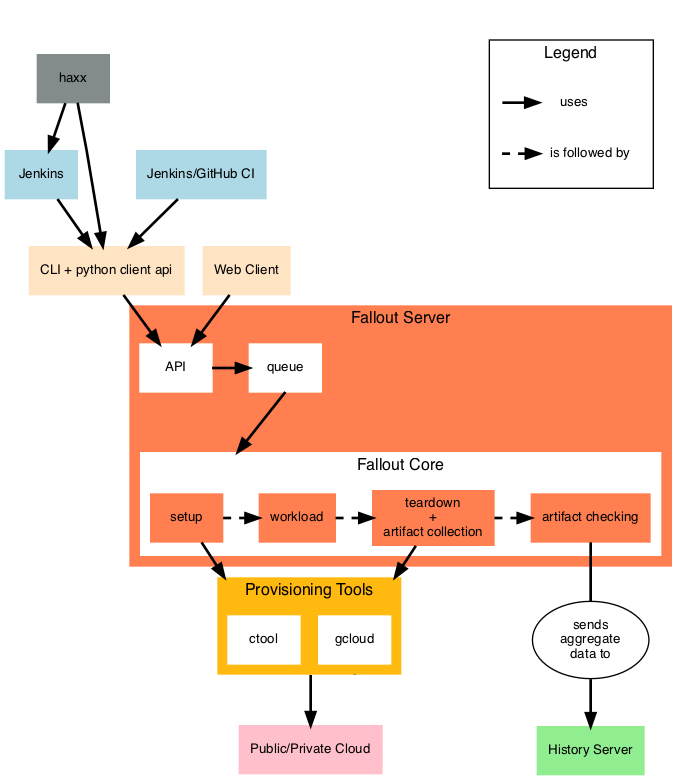
Fallout runs as a single service and exposes a REST API which is accessible via a Python client API and command-line application, and a web UI which users can access using a web browser. Fallout supports multiple concurrent users while enabling each user to store and execute tests independently. Read-only access of test configurations is granted for other user’s test configurations which is especially handy when multiple engineers are working on the same test since they can clone the test configuration and collaborate. The Python client API and command-line application are used by Continuous Integration tools to submit tests to Fallout’s job queue. Once a job reaches the front of the queue and hardware resources become available, Fallout deploys and configures the test’s infrastructure (setup), runs the workload, then collects test artifacts and tears down the infrastructure once the test is complete. Results are published to a central server for analysis. Fallout maintains logs of all the operations involved in each step of a test. An overview of Fallout’s architecture is given in Figure 1.
3.1 Cluster Deployment
Test jobs are submitted to Fallout which internally schedules them based on the available hardware resources in the infrastructure. To provision the cluster in DataStax’s data center (private and public), Fallout relies on a proprietary infrastructure tool, ctool. The open-source version of Fallout includes support for using Google Kubernetes Engine (GKE) to manage clusters. ctool is cloud provider agnostic and abstracts the provisioning and deployment steps of Fallout tests so that users only need to specify high-level requirements such as cloud provider, instance type and region in a YAML test config file. Fallout handles provisioning machines with GKE using the gcloud tool [8] and includes logic for configuring resources that might be required for the test. For example, Fallout will automatically add persistent storage to the Kubernetes cluster so that test run artifacts can be downloaded from the cluster once the test completes. Users can also specify custom manifests in their test config files which configure cluster resources. Fallout monitors all logs from the cluster and can display them in real time via the Fallout web UI. Once the test completes and the cluster is torn down, those logs are permanently stored on the Fallout server for offline analysis.
Running performance tests against clusters requires applying workloads and benchmarks. Fallout also handles provisioning and configuring client nodes that generate these workloads. Metrics and statistics are gathered for all the client and server nodes via a dedicated observer instance that is configured for the test run in exactly the same way as both client and server: via the test config. In each test, the observer instance operates for the duration of the test run and allows Fallout users to monitor metrics from the client and server in real time. Watching the live observer node is frequently important when re-running a configuration that is known to exhibit performance issues and the observer can be used to detect when a cluster has entered a bad state of performance. At the end of the test, the observer metrics are archived and saved locally to the Fallout server and available on the test run web page. This enables analysis after the test execution has completed. Lastly, Fallout tears down the infrastructure after the test completes thereby returning the allocated resources to the cloud.
3.2 Application Installation, Configuration, and Execution
The specific method used to install applications such as Apache Cassandra and Pulsar varies between releases and engineers are often unaware of the differences. Fallout automatically handles installation and system configuration no matter which version is specified for the test. Installation involves extracting tarballs on each node and updating the cassandra.yaml config file to use the additional larger disks from the deployment phase – Fallout also needs to handle configuration of each individual node to work in the cluster. For instance, Apache Cassandra requires the IP addresses of seed nodes in a cluster to be known and listed in every node’s config file.
Benchmarking tools including profilers and metrics collection agents are installed on the client nodes by Fallout. Fallout supports a wide variety of tools though only a few of them are currently available in the open source version. We plan on contributing more in the future. Each benchmark can be configured using the same YAML interface and individual options contained in the config will be specific to each benchmark. As Fallout has gained popularity, more and more benchmarks have been added since it is common for different teams to favor different benchmarks. For example, YCSB is a popular open source benchmark often used to compare relative performance of NoSQL database management systems. The DataStax Stargate team use YCSB to benchmark Stargate’s Document API performance for every release.
Fallout was designed to accommodate this heterogeneity while still providing the same interface to users. This has an added benefit – because the complexity of supporting multiple benchmarks is primarily hidden inside of Fallout, external services that use Fallout can automatically work with any benchmark, reducing the effort required to support new teams and new tools.
3.3 Artifact Collection and Analysis
To aid with post-run analysis, Fallout saves a range of logs and other artifacts locally on the central server so that they can be inspected after the test run has finished. This is the most common situation for analyzing metrics and other benchmark data collected as part of a manual test run. For automated test analysis, Fallout will push the archived metrics to a central Grafana server where other tools run further analysis on them, including Hunter, our statistical significance detection tool that uses change point detection [7]. Fallout uses artifact checkers to inspect the logs for specific error or warning messages and allows the test run to be marked as failed if any are present. Other artifact checkers are used to post-process files. For example, the hdrtool artifact checker merges HDR files [12] retrieved from multiple clients and produces aggregated metrics.
Even when a performance regression is automatically detected by Hunter, engineers might need to look at the metrics that were collected during the test run to understand the cause of the performance issue. When a user needs to check the observer metrics they can simply download the archived artifact from Fallout, extract it to their machine and use a docker image containing Grafana to display the metrics.
3.4 Integration with CI
Automated testing with Fallout is primarily driven via Jenkins. Jenkins uses the Fallout API to launch test runs whenever a pull request from GitHub is successfully built. We have configured Jenkins so that it links directly to the Fallout test run for a given job (GitHub pull request). Being able to navigate from the Jenkins job to the Fallout test run acts as a breadcrumb trail and simplifies post-test run analysis.
We also run nightly and weekly performance tests that are scheduled outside of the GitHub PR-merge workflow but still rely on Jenkins to call the Fallout REST APIs. Haxx is a git repository that acts as a central location for storing Fallout test configs since Fallout itself does not provide any kind of version control other than A) storing a read-only copy of the YAML file from previous test runs and B) the most recent version. Haxx also provides templating for Fallout YAML files where common configuration snippets, such as optimal Apache Cassandra configuration options, can be stored in template files and reused across test configs. This allows us to significantly cut down on the boiler plate code required to support a large number of tests where only the machine size, version of Apache Cassandra, or benchmark config is different. Better still, templates allow users to take advantage of known-good performance options which ensures that they do not waste their time analyzing performance issues that were the results of poorly configured tests.
4 Implementation
Since Fallout was originally created as a wrapper around Clojure, Fallout had to be written in another JVM language to make development easier and Java was selected as the target language. Despite Fallout development primarily being the responsibility of a very small team, Fallout has benefited from a large number of contributors and since Java is widely used inside of DataStax the choice of programming language is no doubt a contributing factor.
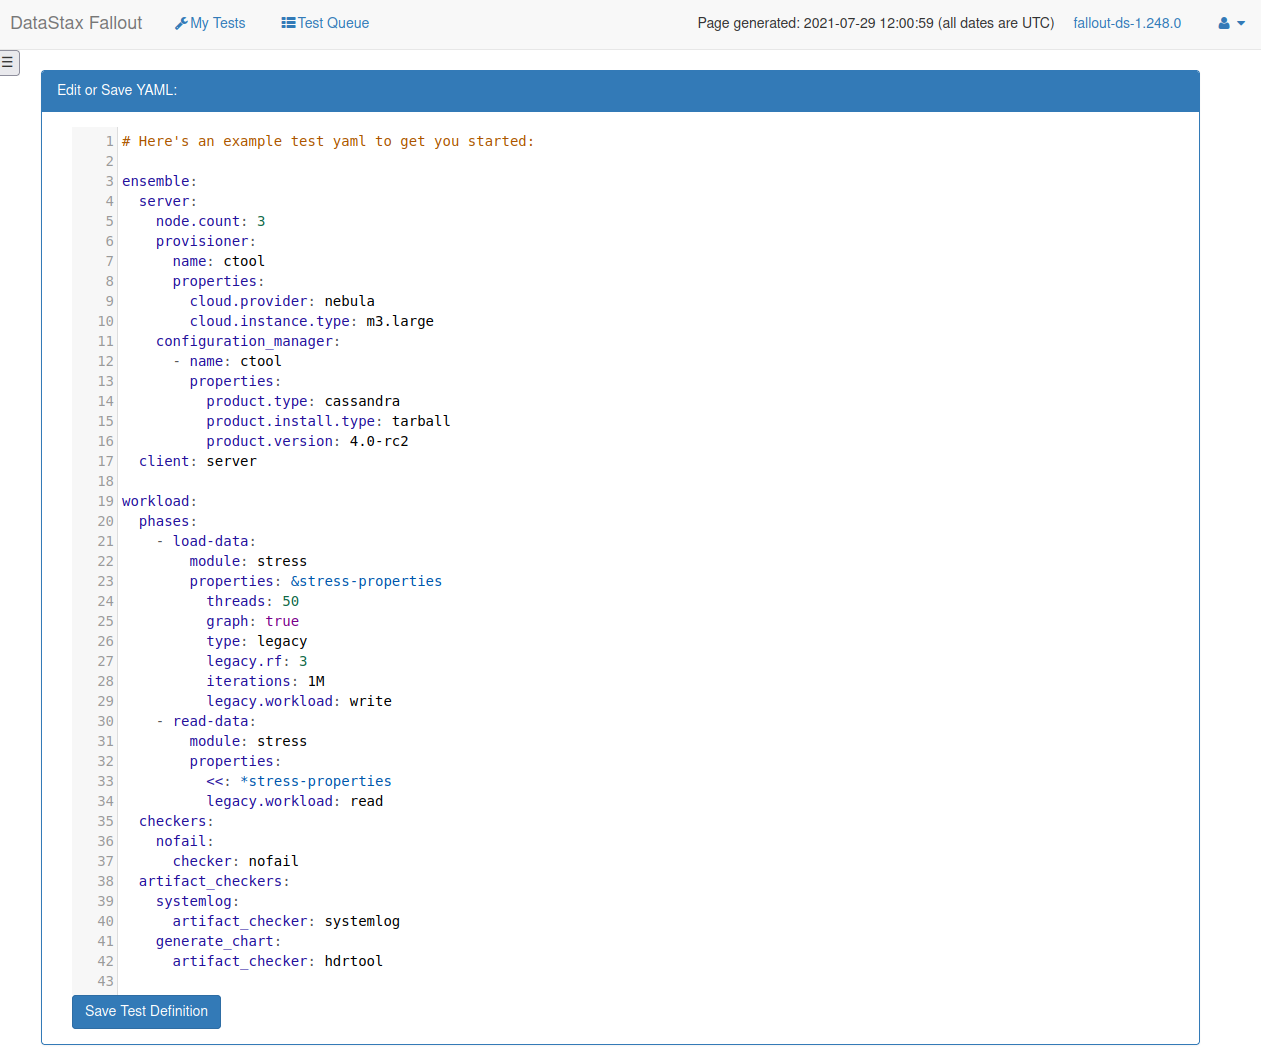
A similar desire to make the configuration interface as welcoming for users as possible led to the decision to use YAML for the configuration files. YAML syntax is easy to learn for new users and YAML syntax highlighting is readily available in IDEs and editors. Fallout’s web UI provides a built-in YAML editor with syntax checker for creating and modifying test configurations.
4.1 Test Configuration Files
Fallout test runs are driven by a single YAML configuration file that has a number of required entries. Tests describe machines and services running on those machines. A node is a resource with services running on it. An example of a node is a single Apache Cassandra node within a multi-node cluster. NodeGroups are collections of nodes. An example of a NodeGroup is an Apache Cassandra cluster. An ensemble is a set of NodeGroups with a specified role and test run configuration files expose this concept to the user. The list of ensemble roles is:
-
•
Server: A distributed server or cluster such as Apache Cassandra
-
•
Client: A benchmark or workload
-
•
Observer: A monitoring server such as graphite
-
•
Controller: An external controller such as Jepsen
Figure 2 shows an example of a Fallout test configuration file.
Workloads are built from one or more phases which are the basic unit of concurrency in Fallout. Each phase can run one or more modules and specifying more than one module executes them in parallel. Phases are always run sequentially and a phase will not start executing until the previous phase completes.
4.2 Test Provisioning Lifecycle
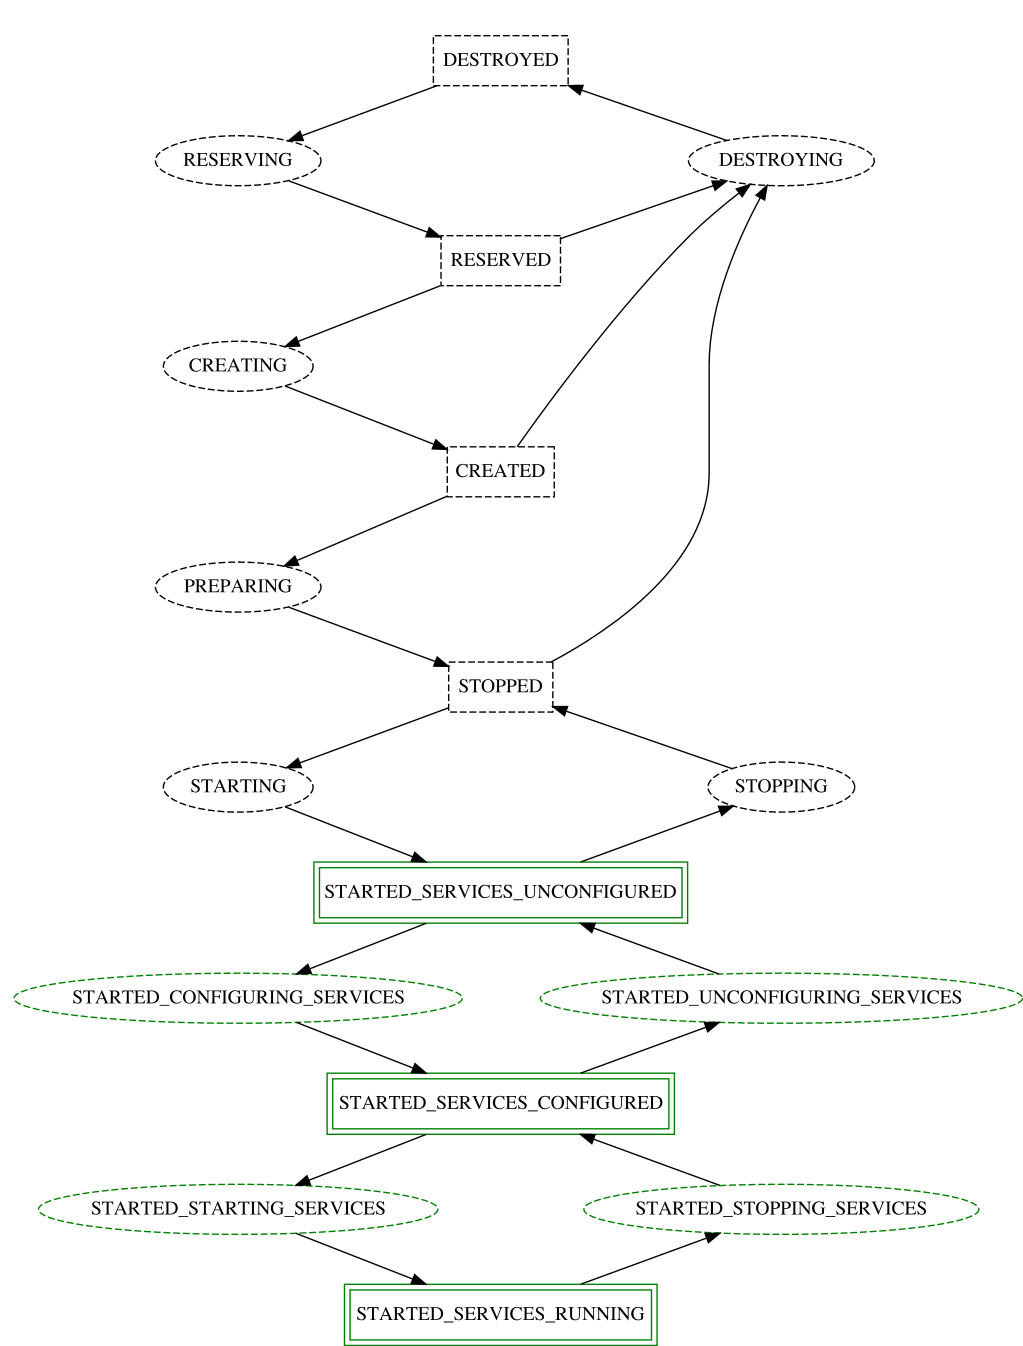
Each NodeGroup in a test transitions through a number of states when the test executes. There are three types of states: Unknown, Transitional, and Runlevel. Transitional states are entered when a NodeGroup moves from one state to another. Runlevel states represent steady states where a NodeGroup is not currently transitioning and are modelled on the UNIX runlevel concept – NodeGroups progress to higher levels where each level has more capabilities than the previous one. State transitions perform provisioning and configuration actions on the NodeGroup and the current state of a NodeGroup is used by Fallout to guarantee only legal transitions between states can occur. Using the state machine, it is impossible for Fallout to configure a NodeGroup before it is provisioned. If any errors are encountered during a transition, for example if Fallout fails to install the distributed application, the NodeGroup will enter the FAILED state and the entire test run will fail.
A transition diagram is presented in Figure 3. The oval states on the left and right represent Transitional states, and the rectangular states in the center represent runlevel states.
4.3 Modules, Providers, and Configuration Managers
Adding support for a new benchmark or tool to Fallout requires adding 3 new components to the Fallout code base: a module, a provider, and a configuration manager. Providers allow access to a service or tool via an API and these are invoked by the Fallout test harness to run commands on the node. For example, the NoSqlBenchPodProvider is responsible for executing the nosqlbench [18] benchmark on a Kubernetes pod. Providers can also have dependencies on other Providers which makes it possible to express that a benchmark should only be available when running on a Kubernetes cluster, for example. Fallout supports Chaos Mesh [6], a tool for running chaos experiments on a cluster, however since it is only available on Kubernetes Fallout will refuse to deploy it into any environment that does not meet the Kubernetes Provider dependency.
Configuration Managers are responsible for configuring and unconfiguring software running on nodes as well as starting and stopping services. Additionally, Configuration Managers register Providers with nodes, making the associated services available to Modules in a test workload.
Finally, Modules are the user-facing component of benchmarks. Modules define the supported keywords and parameters that can be passed to the benchmark via YAML configuration files. Since this provides a layer of indirection between the test config and the benchmark itself, it is common for only a subset of the parameters supported by the benchmark to be supported in Fallout, though if users want maximum flexibility there is usually an args parameter that passes through parameters without any kind of filtering.
While Fallout supports a number of different benchmarks, one lesson we have learned is that users need some kind of back-stop module that allows them to manually run benchmarks for which no support currently exists. A bash module is provided to fill the gap where users need to run a simple script or download a benchmark to a node and run it manually. Extended use of the bash module is frowned upon because we have seen it lead to difficult to understand shell scripts that are copied between test configs.
4.4 Checkers and Artifact Checkers
Once a test has completed, Fallout needs a way to validate that the system under test behaved correctly for the duration of the test. Checkers are the component in Fallout responsible for ensuring that no errors occurred during the test that might invalidate the results. This is important for performance tests even though the checkers do not perform any kind of performance analysis themselves – any performance results from tests that fail basic checks are likely to be invalid because the test was not run under real-world conditions. NoFailChecker is an example of a very basic checker that simply checks that none of the Fallout operations that ran during a test failed. The history of operations is passed to checkers as an argument so that they can run arbitrary checks against it. There is no limit to the number of checkers that can be included in a Fallout test and a test will only pass if all checkers pass.
A related concept is the artifact checker which performs the same kind of validation process on artifacts that are collected after the test run completes. A frequently used artifact checker for Apache Cassandra tests is SystemLogChecker which checks Cassandra’s system.log for the presence of user-specified patterns such as log messages containing “ERROR” or “WARN”.
4.5 Test Queue
When Fallout was first launched, test runs were executed as soon as they were submitted. As Fallout grew in popularity, contention for VMs on our internal infrastructure resulted in tests failing. A simple queueing mechanism was added to fix this that checked for VM availability before attempting to submit a claim for resources. It has been tweaked over time to become more robust and fair. For example, it now favors users with fewer running test runs to prevent anyone monopolizing the system. With this in place, Fallout now handles over 200 test runs a day. Figure 4 shows the mean number of daily test runs per month. Table 1 shows additional yearly statistics for this time period.
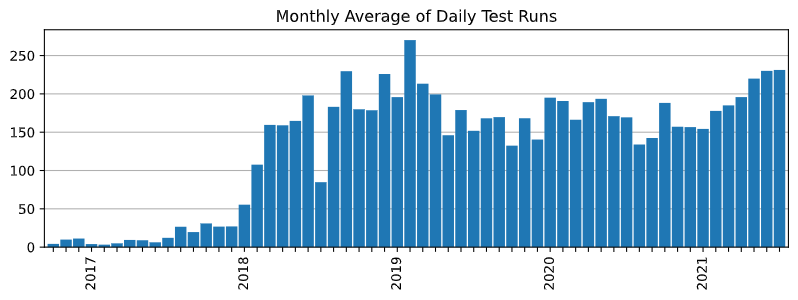
| Year | Total | Mean | Min | Max |
| 2016 | 759 | 8 | 0 | 44 |
| 2017 | 5512 | 15 | 0 | 101 |
| 2018 | 58625 | 160 | 0 | 562 |
| 2019 | 64633 | 177 | 0 | 361 |
| 2020 | 62616 | 171 | 0 | 421 |
| 2021 | 39945 | 197 | 34 | 349 |
4.6 REST API
The Fallout command-line client is built using a Python library for accessing the Fallout REST API. Making this API available instead of only providing access to Fallout via the web UI has helped many other services leverage Fallout’s test running capabilities and has no doubt led to Fallout’s rise in popularity at DataStax. Recently, we have used Fallout’s API and Python library to drive Fallout tests using pytest [19] for a new project.
5 Results
Once one or more benchmarks have been run on a cluster, we use multiple tools to display benchmark and OS metrics. Fallout includes a built-in way to display client-side benchmark metrics as part of the web UI but we usually collect many more metrics for runs such as Apache Cassandra and OS metrics. We use a central Grafana server, known as the history server, to display all of the historical metrics that are accumulated during test runs.
5.1 Performance Reports
Fallout can generate performance reports which visualizes the metrics gathered from a single test run. Performance reports are built on top of HdrHistogram datasets [12]. The HdrHistogram format is a de facto standard for histogram data and implementations are available for many benchmarking tools. A feature that we use heavily is the ability to merge HdrHistogram data across multiple clients which makes it possible to split load across nodes, collect individual HDR files, and combine them to summarize the total load on the cluster. Finally, HDR files capture both throughput and latency in a single file format. Figure 5 shows an example of a performance report.
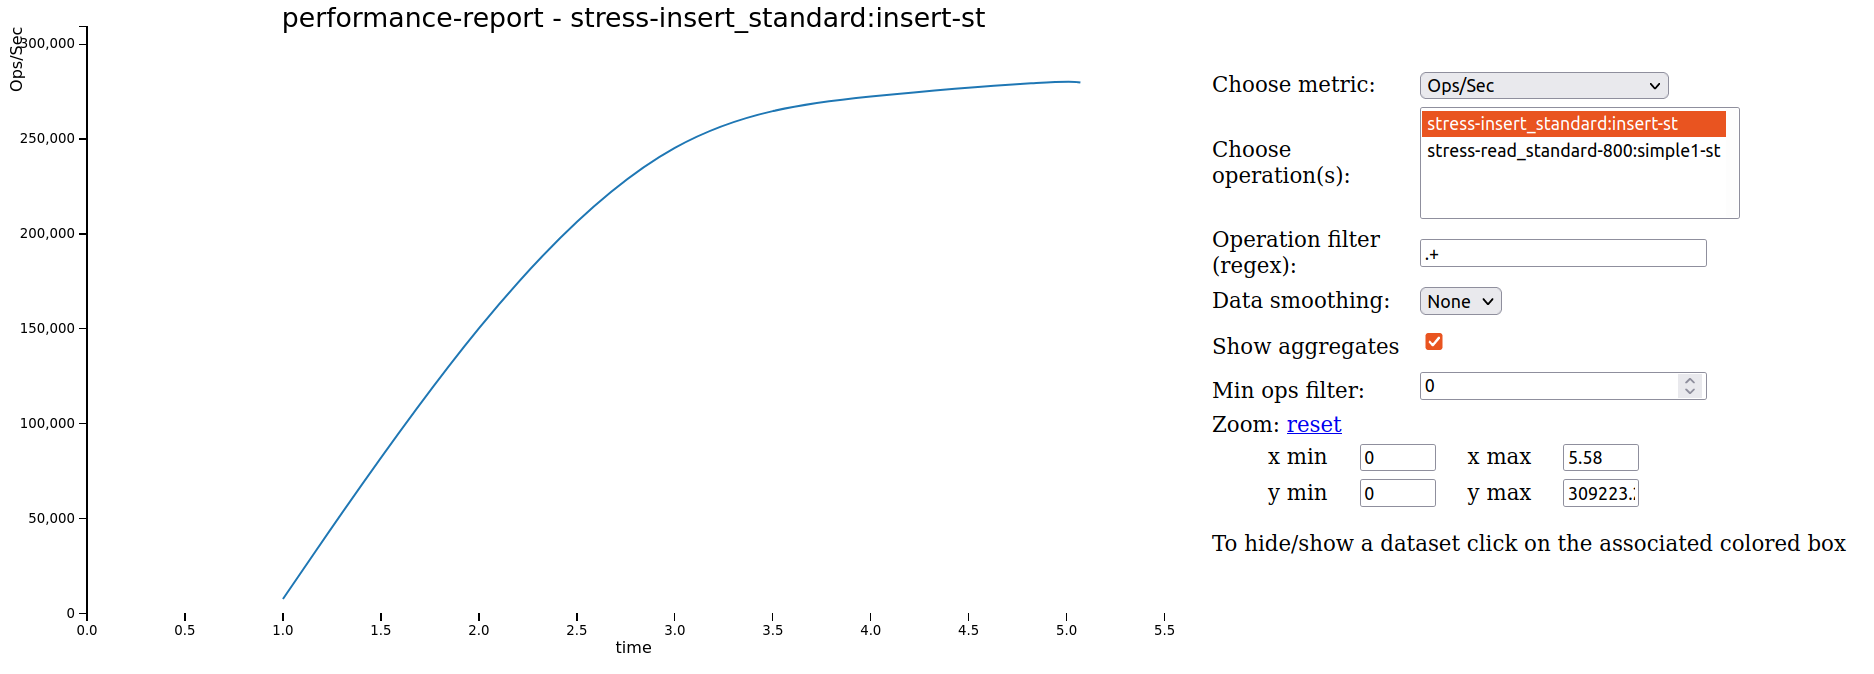
Metrics are displayed using time series data which is invaluable for database workloads where the workload does not have a consistent behavior, e.g. where it changes as memory-resident data structures fill up and are flushed to disk. Being able to see metrics for the entire test run duration makes it easier for users to spot situations where the test hits an unexpected state. The metric data used to create graphs can be altered by selecting an item from the drop-down menu on the right of the page and in this example in Figure 5 each phase of the test run records a separate set of metrics. Digesting time-series metrics into a single number is impossible to do manually, so we also provide summary metrics that list throughput, mean, median, and percentiles for the test run though these metrics are missing from Figure 5 above due to lack of space.
Performance reports are globally readable for all logged in Fallout users and we have used this feature to share test runs across teams that were collaborating on investigating performance issues – having a single location to refer to for a test run’s performance helped everyone to agree what work needed to be done next.
Individual performance reports can be grouped together into one report which allows users to look for differences in performance between test runs. Figure 6 shows an example of a grouped performance report.
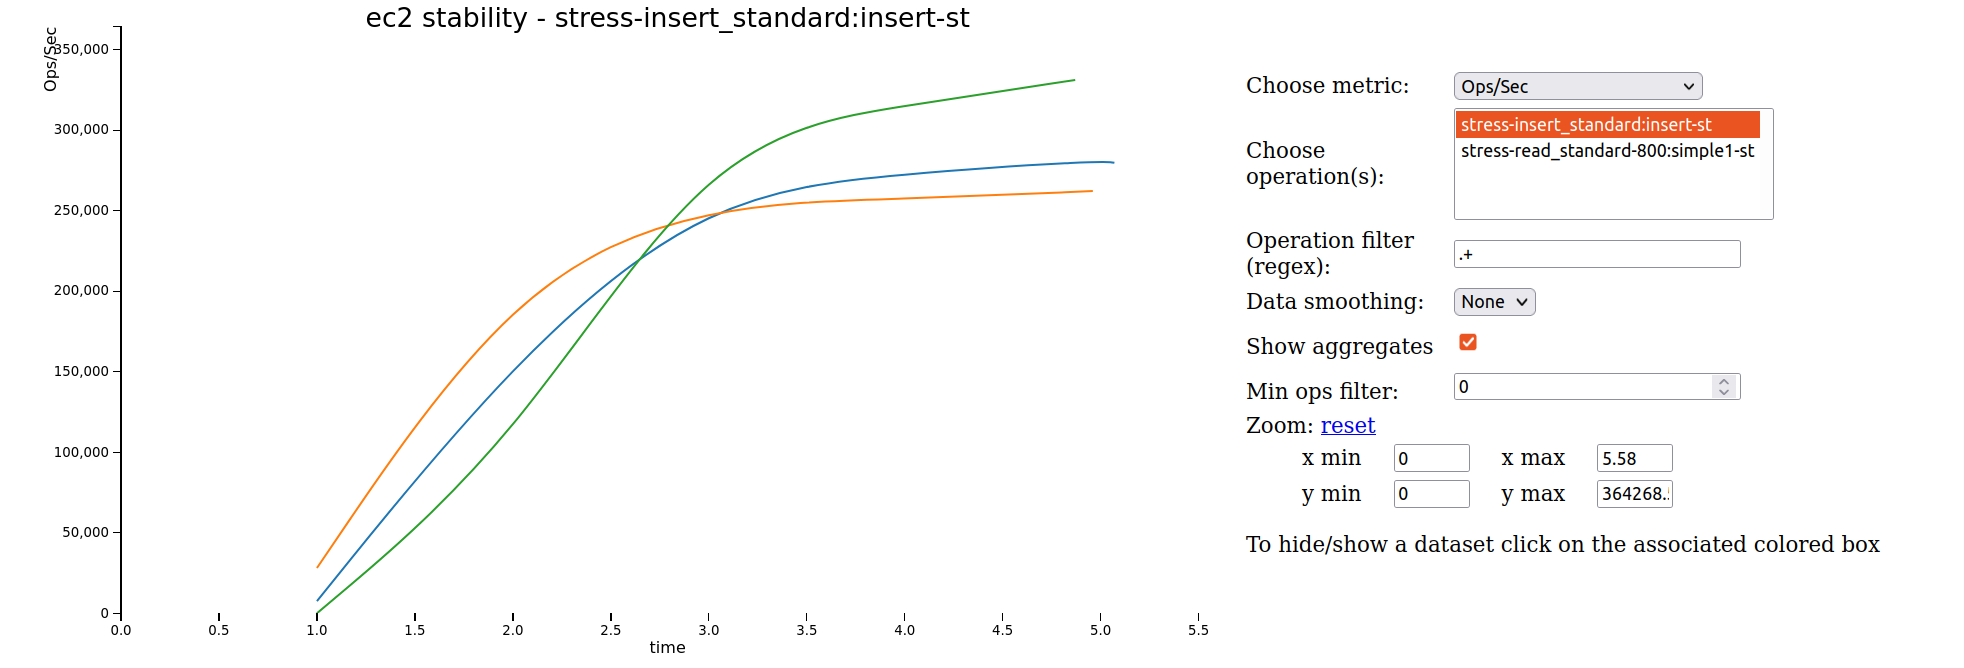
Graphed metrics for each run are displayed in the group report using different colors and details of the runs are included below the chart in a key which is not included in Figure 6 again due to lack of space. The group performance reports are particularly useful for comparing different versions of Apache Cassandra or different configuration options on either the server or client side. When performance reports started appearing in Jira tickets to illustrate performance improvements and regressions, we knew that this feature had become successful as a way of quickly visualizing the performance of benchmarks. Over time, these links to performance reports have become even more useful as engineers have been able to refer back to previous benchmarking with ready-to-run tests they can reuse to troubleshoot new issues.
5.2 History Server
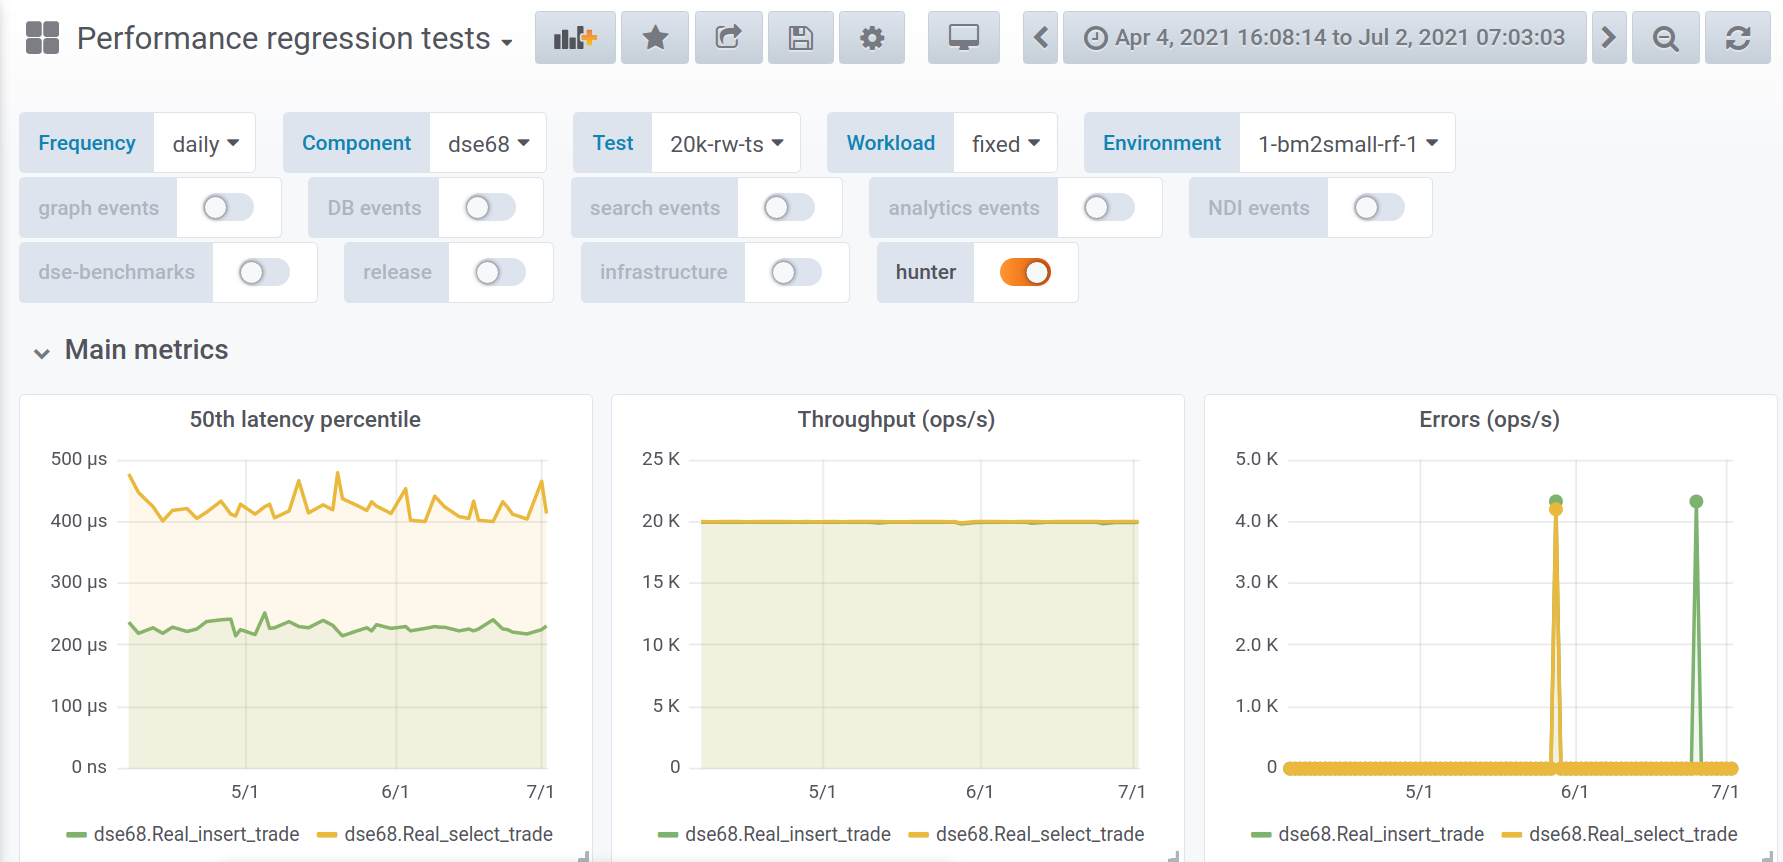
Though performance reports offer a helpful way to look at the performance of a small number of test runs for comparison, the fact that all of the metrics from a test run are presented in a time-series chart makes it unsuitable for analyzing historical trends. When we need to understand how the performance of our automated tests have changed over the past few days or weeks we use a central Grafana server we call the history server. This server aggregates OS and application metrics from both clients and servers for historical analysis and is one of the ways that release engineers assess the quality of DataStax products. Aggregated metrics are very coarse grained to reduce disk space usage and calculate simple summary statistics – each metric is reduced to a single data point per run regardless of the duration of the test run.
Given that the history server is a central component of quality engineering for releases, it may be surprising that the hardware resources used to run it are extremely modest. The original version of the history server ran on a virtual machine with 1 CPU, 4GB of RAM and a 20GB hard disk drive. The current configuration uses 2 CPUs, 4GB of RAM and an 80GB hard disk drive. We believe that the reason the history server has survived for many years without any kind of downtime and without exhausting its small disk space is due to the aggressive graphite retention policy we apply to all metrics. The default metric namespace, temporary, has a retention policy of 1h:15d which works well for one-off investigations because metrics can be updated once per hour and are automatically deleted after 15 days. We use a separate namespace, performance_regressions, to retain metrics for much longer but with a reduced frequency: daily metrics are recorded at most once a day, weekly metrics are recorded once a week, and both are retained for 10 years. Graphite’s design requires that disk space for all configured metrics be allocated up front and storage for a single metric is 12 bytes, so we can calculate that storing one metric in performance_regressions every day for a full year only consumes 4.3KB of disk space.
Figure 7 shows one of the Grafana dashboards from the history server which includes panels for throughput, error count, and percentile metrics.
6 Lessons Learned
Fallout has evolved over many years of development and we have found that while some of our initial design choices were correct and have stood the test of time, others were wrong and needed reassessing. And some problems we never even anticipated.
6.1 Configuration Files Should Be Short and Expressive
The more lines a test configuration file has the greater the chance of introducing a bug. One of the goals for Fallout has been to provide enough support in the test and benchmark modules that common use cases only need small test run configuration files which reduces the probability that a user will make a mistake. This is still an on-going effort as it takes time for common usages to emerge when support for new modules is added but the end result is happier users with greater confidence in Fallout. This goal has served us well in creating a useful configuration language that is easy to understand.
6.2 Templating for Configuration Files Encourages Reuse
As Fallout amassed more users and the number of test run configurations increased, we noticed that many users began copying and pasting YAML across config files. A common situation where this happens is when users need to run the same test across multiple versions of an app, e.g. running the same benchmark against Apache Cassandra 3.11 and 4.0 to compare performance. We added support in Fallout’s YAML parser for mustache [17] templates which allow users to use templates in their YAML files and provide specific values either on the Fallout test run web page or as parameters via the REST API.
Even with mustache templating, we found that users wanted to separate out common chunks of YAML into different, smaller files and include them in multiple configuration files. Additionally, users wanted to be able to store these files in a version control system. Fallout does not support either of these features so the haxx project was created which uses Jinja [15] templating to allow composition of test fragments and to provide version control via a git repository.
6.3 Tests Need Access to External Files
A feature that we failed to anticipate early on was that tests, benchmarks, and tools would need the ability to access external files, e.g. configuration files. We initially worked around this limitation by either extending the test module to fetch the external file from a GitHub gist or by generating the test config file at runtime based on the keys and values in the Fallout YAML config. This approach did not scale as we added new modules and it is now possible to use a unified method to access external files with the <<file:filename>> syntax regardless of the module used in the test run config.
6.4 Long-running Tests Benefit From Semantic Checks and Idempotency
It is very straightforward to check YAML files for syntactic errors and there are numerous Java libraries available to do that, such as SnakeYaml [21] which is the library that Fallout uses. However, syntactic errors are only one source of problems afflicting users. Since most of the YAML values in a test config are consumed by tools other than Fallout, it is challenging to validate that the semantics of those values behave as expected. We have encountered situations where a single mistyped character in a NoSQL table name caused all subsequent test phases to fail and was only triggered after the test had been running for an hour.
Additionally, re-running Fallout tests sometimes requires the infrastructure to be torn down and brought back up if Fallout cannot determine the runlevel of the cluster. Other deployment tools, such as Terraform [4] solve this problem with idempotency which allows the same deployment steps to be applied repeatedly without causing any changes to the underlying machine if the corresponding configuration for those steps has not changed. Fallout does make an attempt to detect the current cluster runlevel and skip unnecessary configuration steps but the detection is imperfect. This detection is used in Fallout’s cluster-reuse mechanism, which is triggered by naming a cluster and requesting that it be left in a specific runlevel at the end of a test run; subsequent test runs with the same test definition will find the named cluster, detect its runlevel, and continue from there. This makes it possible to iterate on test creation a little bit faster, and—in some specialized cases – skip slow data loading steps for big-data tests. However, in our experience most users do not encounter situations where they need to use these features.
7 Related Work
Automated testing, which includes running benchmarks, is a vital part of ensuring quality for software projects [22]. Integrating benchmarking into a continuous deployment pipeline is discussed in [9] which focuses on using performance metrics with thresholds to decide whether changes should be allowed into production. Since we use Fallout to test software that will ultimately be deployed to a variety of environments, ranging from the cloud to on-premise, there is no built-in functionality for gating deployments based on performance change thresholds. Instead, statistically significant changes are detected using change point detection and a developer is required to make the deployment decision. Automating deployments with Fallout is one of our future goals.
MockFog 2.0 [11] enables fog applications experiments by emulating fog infrastructure in the cloud and has a very similar design to Fallout. Both MockFog and Fallout provision infrastructure, configure and deploy applications, run tests and benchmarks, and even use states (Action states and NodeGroup states, respectively) to define legal transitions for the internal state machine. However, MockFog uses Docker to manage applications whereas Fallout supports both native and Kubernetes-based applications which more closely aligns with typical deployments of Apache Cassandra and Apache Pulsar. MockFog also uses Ansible to configure infrastructure which provides the idempotent state updates that are partly missing from Fallout’s implementation.
Adelphi [1] is an open-source QA tool that runs on top of Kubernetes and allows users to run data integrity and performance tests against Apache Cassandra. It is packaged as a helm chart and includes a limited number of benchmarks and testing tools so that users can compare two clusters against one another. Adelphi takes care of executing the tests but does not provide facilities to create and terminate the underlying Kubernetes clusters or present the benchmark and test results for analysis.
MongoDB’s Distributed Systems Infrastructure (DSI) [14] was developed at approximately the same time as Fallout though the two projects were not known to each other. DSI shares many things in common with Fallout including components to provision virtual machines, configure database servers and benchmarks, collect results for automated and visual inspection, and finally teardown the infrastructure when the test completes. Both Fallout and DSI use YAML configuration files to control test runs. However, Fallout differs from DSI in a number of ways. Fallout is written in Java and DSI is written in Python. While DSI primarily targets Amazon EC2, Fallout can currently launch tests on Google Cloud Platform, Amazon EC2, Microsoft Azure, as well as our internal OpenStack-based private cloud. Because ctool already existed when Fallout was created, Fallout has a very modular architecture and relies on other tools and components to do certain tasks whereas most of the corresponding functionality for DSI is built into the service. Lastly, as far as the authors are aware, DSI does not expose an API for other tools to call.
Work on reducing the cost of testing very large distributed systems by running many virtual machines on top of fewer physical servers is discussed in [10]. This work targets network services with thousands of nodes which are much larger than typical Apache Cassandra or Pulsar clusters.
RocksDB includes tools for running benchmarks and analyzing the results but no project exists to handle the setting up and tearing down of hardware to run the benchmarks [5]. Likewise, SAP has published work that shows how they integrate performance testing into their CI process [20] but no details are included on the way that tests are deployed on their testing infrastructure.
8 Conclusion
Fallout is a distributed systems testing service capable of automatically provisioning clients and servers, installing, configuring and executing distributed apps and workloads, and centrally collecting results for later analysis. We use Fallout internally at DataStax and it drives the entire performance and testing ecosystem for both our Apache Cassandra and Apache Pulsar products. Fallout started life with a very specific purpose and has evolved after years of engineering effort to be the backbone of performance and quality for us and it provides our engineering teams with fully-automated end-to-end testing for distributed systems. Fallout’s REST API has been essential for new teams to leverage Fallout’s distributed testing and has encouraged the birth of numerous tools and services that complement Fallout. Our Fallout server executes around 200 tests every day, and on busy days runs closer to 400 tests.
Since each of our engineering teams have their own preferences for the kinds of benchmarks, cluster configurations, and cloud infrastructure, all of these components are configurable in Fallout which has been designed with modularity in mind. We have extended this modularity to allow tests and benchmarks to load external files and added templating so that users can reuse test config fragments without copying and pasting.
We have released Fallout as an open-source project with the hope that the open-source community can benefit from our investment and the lessons we have learned running Fallout in production for over 5 years.
9 Acknowledgements
We would like to thank the anonymous reviewers for their valuable feedback and suggestions. Fallout was created by Jake Luciani, Joel Knighton, and Philip Thompson and we are thankful for their decision to create a new tool to solve the complex problem that is distributed systems testing. The history server was created by Pierre Laporte and it is stability is illustrated by the fact that it has been the component that has required the fewest updates in the whole Fallout ecosystem. Christopher Lambert was largely responsible for integrating ctool support to Fallout and James Trevino continues to maintain and improve Fallout. Ulises Cerviño Beresi created haxx. Shaunak Das contributed numerous test modules. Many more people have contributed to Fallout and related testing services and we are grateful for all of their efforts.
The open-source version of Fallout owes a great deal of gratitude to Jake Luciani and Jonathan Ellis for championing the project internally at DataStax.
References
- [1] Adelphi, . Automation tool for testing cassandra oss. URL: https://github.com/datastax/adelphi. accessed: 2021-08-05.
- [2] Apache Cassandra, . Cassandra stress. URL: https://cassandra.apache.org/doc/latest/cassandra/tools/cassandra_stress.html. accessed: 2021-08-05.
- Boehm [1976] Boehm, B., 1976. Software engineering. IEEE Transactions on Computers C-25, 1226–1241.
- Brikman [2019] Brikman, Y., 2019. Terraform: Up & Running: Writing Infrastructure as Code. O’Reilly Media.
- Cao et al. [2020] Cao, Z., Dong, S., Vemuri, S., Du, D.H., 2020. Characterizing, modeling, and benchmarking rocksdb key-value workloads at facebook. 18th USENIX Conference on File and Storage Technologies (FAST 20) , 209–223.
- [6] Chaos Mesh, . A powerful chaos engineering platform for kubernetes. URL: https://chaos-mesh.org/. accessed: 2021-10-07.
- Daly et al. [2020] Daly, D., Brown, W., Ingo, H., O’Leary, J., Bradford., D., 2020. The use of change point detection to identify software performance regressions in a continuous integration system. In Proceedings of the 2020 ACM/SPEC International Conference on Performance Engineering(ICPE ’20) doi:10.1145/3358960.3375791.
- [8] Google Cloud SDK documentation, . gcloud tool overview. URL: https://cloud.google.com/sdk/gcloud. accessed: 2021-10-07.
- Grambow et al. [2019] Grambow, M., Lehmann, F., Bermbach, D., 2019. Continuous benchmarking: Using system benchmarking in build pipelines, in: 2019 IEEE International Conference on Cloud Engineering (IC2E), pp. 241–246. doi:10.1109/IC2E.2019.00039.
- Gupta et al. [2011] Gupta, D., Vishwanath, K.V., McNett, M., Vahdat, A., Yocum, K., Snoeren, A., Voelker, G.M., 2011. Diecast: Testing distributed systems with an accurate scale model. ACM Transactions on Computer Systems (TOCS), 29(2) , 1–48.
- Hasenburg et al. [2021] Hasenburg, J., Grambow, M., Bermbach, D., 2021. Mockfog 2.0: Automated execution of fog application experiments in the cloud. IEEE Transactions on Cloud Computing , 1–1doi:10.1109/tcc.2021.3074988.
- [12] HdrHistogram, . High dynamic range histogram. URL: http://hdrhistogram.org/. accessed: 2021-08-05.
- Humble and Farley [2010] Humble, J., Farley, D., 2010. Continuous Delivery: Reliable Software Releases through Build, Test, and Deployment Automation. Addison-Wesley.
- Ingo and Daly [2020] Ingo, H., Daly, D., 2020. Automated system performance testing at mongodb. In Workshop on Testing Database Systems (DBTest’20) doi:10.1145/3395032.3395323.
- [15] Jinja, . Template engine for python. URL: https://palletsprojects.com/p/jinja/. accessed: 2021-08-04.
- [16] Kingsbury, K., . Distributed systems safety research, jepsen. URL: https://jepsen.io/. accessed: 2021-07-29.
- [17] Mustache, . Logic-less templates. URL: https://mustache.github.io/. accessed: 2021-07-28.
- [18] NoSQLBench, . The open source nosql benchmarking suite. URL: https://github.com/nosqlbench/nosqlbench. accessed: 2021-08-05.
- [19] pytest, . pytest: helps you write better programs. URL: https://docs.pytest.org/en/6.2.x/. accessed: 2021-10-07.
- Rehmann et al. [2016] Rehmann, K.T., Seo, C., Hwang, D., Truong, B.T., Böhm, A., Lee, D.H., 2016. Performance monitoring in sap hana’s continuous integration process. ACM SIGMETRICS Performance Evaluation Review. 43 , 43–52doi:10.1145/2897356.2897362.
- [21] snakeyaml, . Yaml 1.1 parser and emitter for java. URL: https://bitbucket.org/asomov/snakeyaml/src/master/. accessed: 2021-08-05.
- Waller et al. [2015] Waller, J., Ehmke, N.C., Hasselbring, W., 2015. Including performance benchmarks into continuous integration to enable devops 40, 1–4. doi:10.1145/2735399.2735416.