Milky Way-Like Gas Excitation in an Ultrabright Submillimeter Galaxy at
Abstract
Based on observations with the IRAM 30 m and Yebes 40 m telescopes, we report evidence of the detection of Milky Way-like, low-excitation molecular gas, up to the transition CO(), in a distant, dusty star-forming galaxy at . WISE J122651.0+214958.8 (alias SDSSJ1226, the Cosmic Seahorse), is strongly lensed by a foreground galaxy cluster at with a source magnification of . This galaxy was selected by cross-correlating near-to-mid infrared colours within the full-sky AllWISE survey, originally aiming to discover rare analogs of the archetypical strongly lensed submillimeter galaxy SMM J2135-0102, the Cosmic Eyelash. We derive an apparent (i.e. not corrected for lensing magnification) rest-frame 8-1000 m infrared luminosity of L☉ and apparent star-formation rate M☉ yr-1. SDSSJ1226 is ultra-bright at mJy and shows similarly bright low- CO line intensities as SMM J2135-0102, however, with exceptionally small CO() intensity. We consider different scenarios to reconcile our observations with typical findings of high- starbursts, and speculate about the presence of a previously unseen star-formation mechanism in cosmic noon submillimeter galaxies. In conclusion, the remarkable low line luminosity ratio is best explained by an extended, main-sequence star-formation mode – representing a missing link between starbursts to low-luminosity systems during the epoch of peak star-formation history.
1 Introduction
To get insight into the formation and evolution of massive galaxies at the peak epoch of star formation and black hole activity it is indispensable to study dusty starbursts, so-called submillimeter galaxies (SMGs; see for a review Casey et al., 2014). These dusty star-forming galaxies at a median redshift of (Chapman et al., 2005) are rich in molecular gas (Tacconi et al., 2008), the fuel for star formation. The brightest of these systems are either intrinsically luminous with extreme star-formation rates in excess of several hundred to thousand solar masses per year and/or galaxies that are strongly gravitational lensed by chance alignments with foreground galaxies or galaxy clusters (Negrello et al., 2010). The boosted apparent (sub)millimeter flux of this rare population of low number density deg-2 and otherwise optically faint or even undetected sources (Dannerbauer et al., 2002), is efficiently identified in wide Herschel or Planck space missions, and South Pole Telescope surveys (see e.g. Negrello et al., 2010; Vieira et al., 2013; Cañameras et al., 2015).
A remarkable example of a strongly lensed SMG is the serendipitously discovered ultra-bright SMM J2135-0102 at , the so-called ”Cosmic Eyelash” (Swinbank et al., 2011). Resolved observations of cold gas tracers such as molecular carbon monoxide (CO) were subsequently utilised in lensed galaxies to test theories of star-formation and the conditions of the cold interstellar medium at early cosmic epochs. The assumption that all SMGs are simply scaled-up versions of local Universe ULIRGs – mostly gas rich major mergers (Papadopoulos et al., 2012) that form stars in compact, nuclear disks – is increasingly challenged as high-redshift molecular clouds in star-forming galaxies are observed to inherit their properties from extended, fragmented gas disks, forming massive clumps at a scale of pc (see e.g. Daddi et al., 2015; Dessauges-Zavadsky et al., 2019). Yet, Ivison et al. (2020) reported that the disk of the Cosmic Eyelash is probably smoothly distributed, at least down 80 pc-scale, reinforcing circumstantial evidence for the heterogeneous population of SMGs, differentiated by their modes of star-formation.
In this regards, gravitational lensing promises the detection of low-luminosity systems. Compared to classical SMGs, these systems are forming stars within extended gas disks at an order of magnitude lower efficiency (Tacconi et al., 2010). Characterised by low CO excitation profiles (CO SLEDs), as reported by Dannerbauer et al. (2009) in a sample of colour-selected galaxies (Daddi et al., 2015) and in resolved studies of CO gas in the lensed disk galaxy Cosmic Snake at (Dessauges-Zavadsky et al., 2019), less efficient, slow-mode star-formation should be present in low-luminosity, normal galaxies. However, the number of CO detections of these main-sequence galaxies at high-redshift is still relatively small (Valentino et al., 2020) and strong evidence for true Milky Way-like cold gas excitation up to high CO-transitions is still lacking or at least inconclusive for this galaxy population.
In this Letter, we present the unusually low, unambiguous Milky Way-like CO excitation profile of SDSSJ1226, an ultra-bright submm galaxy at , strongly lensed by a galaxy cluster at . In section 2, we present the sample and in section 3 the observations. Results are shown in section 4 and we conclude this manuscript with the discussion (section 5). A more complete analysis of the subsample of Herschel-detected, NIR/MIR SMG candidates (including this source) will be presented in Sulzenauer et al. (in prep.). In this work we focus on the CO SLED of SDSSJ1226. We adopt a flat CDM cosmology using parameters from Planck Collaboration et al. (2016) with km s-1 Mpc-1, , and .
2 Sample selection
In order to search for bright SMGs with similar SED characteristics as the archetypical bright, strongly lensed SMG SMM J2135-0102, the Cosmic Eyelash, Iglesias-Groth et al. (2017) developed a NIR/MIR colour selection technique to cross-match MIR sources over the full-sky by correlating AllWISE666http://wise2.ipac.caltech.edu/docs/release/allwise/ catalog (Wright et al., 2010) (NIR to MIR colours) from the Wide-field Infrared Survey Explorer. Galaxies that verify the NIR/MIR colour criterion from Iglesias-Groth et al. (2017)
(in AB-magitudes) are pre-selected as ”Cosmic Eyelash analog” candidates at . Subsequent source matching with additional NIR, FIR, and submillimeter data has proven to efficiently select bright SMGs: Díaz-Sánchez et al. (2017) identified the extremely bright SMG WISE J132934.13+234327.3, the so-called Cosmic Eyebrow, by cross-matching between NIR/MIR selected candidates, Planck777http://pla.esac.esa.int/pla/home full-sky point source catalog, and JCMT/SCUBA-2888http://www.cadc-ccda.hia-iha.nrc-cnrc.gc.ca/en/ data. Spectroscopic follow-up observations with the IRAM 30 m telescope and IRAM NOEMA detected the brightest CO() emission ever for SMGs (Dannerbauer et al., 2019). As part of the same sample, the strongly lensed source GAL-CLUS-022058s was followed up with APEX/nFLASH230 spectroscopy confirming extremely bright CO() emission (Díaz-Sánchez et al., 2021).
This method was further modified by correlating Herschel/SPIRE999http://archives.esac.esa.int/hsa/whsa/ sources with NIR/MIR candidates, that do not necessarily match all five colour criteria, but are in close distance to 28 strong lensing clusters from the Sloan Giant Arcs Survey (Oguri et al., 2012). Due to the availability of archival HST optical data for all of the clusters, the giant arcs were further matched with bright, co-spatial AllWISE candidates within 2. We have found eight candidates, with , two of them have high apparent infrared luminosities L⊙ and flux mJy whereas AllWISE J122651.04+214958.8 is the brightest of the sample with FIR flux mJy. Although, it does neither fulfil the NIR-color criteria from Iglesias-Groth et al. (2017) nor the one from Díaz-Sánchez et al. (2017), which are based on the Cosmic Eyelash SED, the Herschel FIR flux does agree very well with the behavior of SMG SEDs. This can be explained by large galaxy-to-galaxy variation in the optical-NIR domain due to the combination of dust geometry, star-formation history, and extinction (see e.g. da Cunha et al., 2015). The main discrepancy between the formal NIR/MIR colour demarcations and the colour indices found for galaxy SDSSJ1226 are shallower indices instead of and whereas is only detected as an upper limit implying that the true index might be even more distant from the demarcation index . Furthermore, , although within the criterion definition, is especially low compared to the reported sample values of Iglesias-Groth et al. (2017). Nevertheless, SDSSJ1226 is consistently brighter than the Cosmic Eyelash by a factor of 2 in all WISE bands, but shows lower flux towards far-infrared wavelengths; see Table 1 for additional photometric catalog data from VizieR at CDS101010http://vizier.u-strasbg.fr/viz-bin/VizieR.
| Wavelength [m] | Flux Densitya [mJy] | AB-Mag.a,d [mag] | Beam Size [″] | Observatory/Instrument |
|---|---|---|---|---|
| 0.577 | 0.00070.0001 | 24.30.15 | 0.1 | HST/ACS F606W |
| 0.797 | 0.00220.0002 | 23.00.1 | 0.1 | HST/ACS F814W |
| 1.248 | 0.0200.002 | 20.60.11 | 1.2 | UKIDSS |
| 1.635 | 0.0340.003 | 20.10.1 | 1.2 | UKIDSS |
| 2.201 | 0.130.03 | 18.60.26 | 1.2 | UKIDSS |
| 3.4 | 0.4960.019b | 17.20.04 | 6.1 | WISE W1 |
| 4.6 | 0.6530.025b | 16.90.04 | 6.4 | WISE W2 |
| 11.6 | 0.5250.13b | 17.10.27 | 6.5 | WISE W3 |
| 22.1 | 3.8b,c | 14.9c | 12.0 | WISE W4 |
| 160 | 8731 | 11.50.4 | 11.6 | Herschel/PACS |
| 250 | 1729 | 10.80.06 | 18.5 | Herschel/SPIRE |
| 350 | 17013 | 10.80.08 | 25.3 | Herschel/SPIRE |
| 500 | 11512 | 11.20.1 | 36.9 | Herschel/SPIRE |
Note. — aUncorrected for source magnification. bFlux densities are calculated using the prescription from Wright et al. (2010). cUpper limit. dAB-magnitudes are calculated using and uncertainties are from a linear approximation.
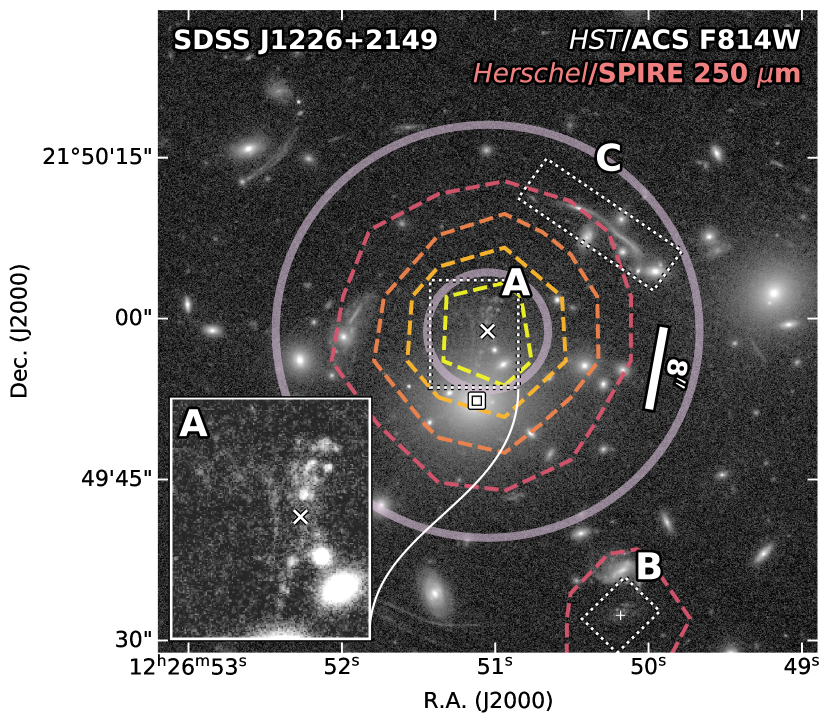
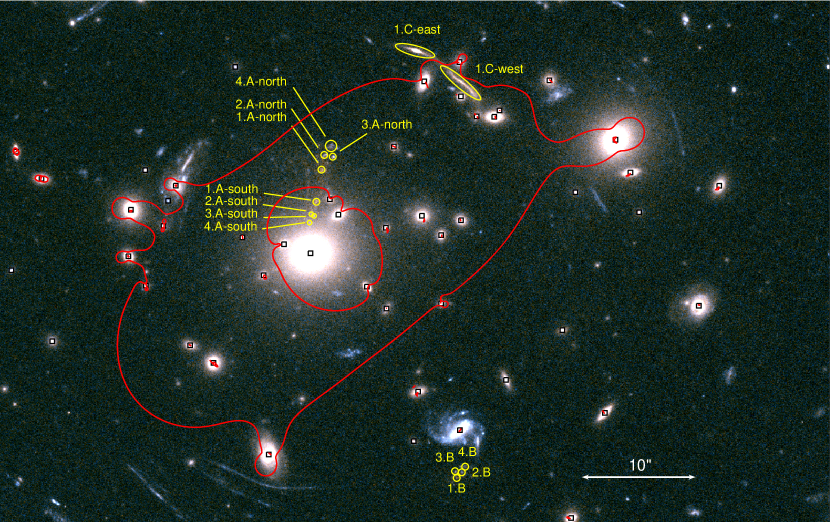
On the basis of its position, colour, and brightness, we confidently identify the supposed optical counterpart of the Herschel/SPIRE source in sufficiently resolved HST/ACS images111111http://archive.stsci.edu/. The corresponding giant radial arc is located north to the brightest cluster galaxy (BCG) in the galaxy cluster SDSS J1226+2149 at redshift (Bayliss et al., 2011). Therefore, we postulate that the strongly lensed galaxy at coordinates and (J2000) is the source of bright NIR–FIR emission. No optical/NIR spectroscopic redshift of this source are published in the literature. Fig. 1 shows the HST/ACS background image at the position of the bright Herschel/SPIRE source. Due to its extraordinary brightness and distinctive morphology, we take the liberty to designate this lensed galaxy as the Cosmic Seahorse.
3 Observations and Data Reduction
3.1 Observations
3.1.1 IRAM 30 m telescope
We observed the source with the IRAM 30m telescope heterodyne millimeter receiver EMIR (Carter et al., 2012) by employing the spectroscopic blind line search technique. Starting with the photometric redshift estimate of , the CO() or CO() emission line is expected to lie within the 3 mm atmospheric window, accessible by the EMIR E0 frontend ( GHz). After detecting a strong line at GHz and assuming the redshifted CO() transition, we switched the frontend to E1 ( GHz). A second signal was successfully identified in the 2 mm atmospheric window at GHz, the CO() line. Based on this improved redshift estimate, CO(5-4) emission was then observed with E2 ( GHz) at 221.3 GHz. The observations were conducted in position switching mode. We utilised the FTS200 spectrograph as the backend at a frequency resolution of 200 kHz. The first week of observations (project; 086-18, PI: H. Dannerbauer) was regularly scheduled in visitor mode. Between May and November of 2018, the project entered the observing pool. Over six days of observations, a total of 11.0 hours effective on-source integration time was acquired for the presented multi- CO line measurements. Overall, weather conditions were acceptable with median optical depth of . Notably, however, receiver interference caused baseline ripples in the spectra that needed to be carefully removed.
3.1.2 Yebes 40 m telescope
Our observations of the redshifted CO() line (44.3 GHz) were performed with the new Nanocosmos Q-band receiver, operating between 31.3-50.6 GHz (Tercero et al., 2021), installed at the Yebes 40 m telescope (project; 20B013, PI: H. Dannerbauer). This front-end consists of two high electron mobility transistor (HEMT) cold amplifiers that cover horizontal and vertical polarisation. The signal is obtained using fast Fourier transform spectrometers, covering eight sub-bands of 2.5 GHz bandwidth and continuous 38 kHz resolution. Over twelve days of observations between October and November 2020, we collected scans of our source with effective on-source time of 37.2 hours with better than average optical depth of . We report the most distant detection of molecular gas at with the Yebes 40 m telescopes (see e.g. Tercero et al., 2020).
3.2 Data reduction
For on-site data reduction, the software GILDAS121212https://www.iram.fr/IRAMFR/GILDAS with package CLASS was used (Pety, 2005). To identify spectral lines at the anticipated noise threshold of mK, the spectra are binned to 500 km s-1 and typical observing time per setting were four hours in total. Significant line signals are masked for manual baseline removal with a polynomial function of order within observed-frame frequency window of GHz centred on the signal. After gathering all observations from the pool, individual scans were dropped in order to maximise the signal-to-noise content per spectral bin. For this reason, we developed a simple CLASS script rmse_selection_function that is publicly available on GitHub131313https://github.com/NiSZR/rmse_selection_function. Up to a specific, non-parametric rms threshold, it filters all scans within the 4 GHz sideband structure of the EMIR FTS200 data by their ranked baseline noise contribution. Adjusting to the background noise level, the frequency channels are rebinned between 13 and 33 km s-1 (rest-frame) corresponding to 99.7 % confidence level of the line intensity per bin at the position of the spectral line. To convert the corrected main beam brightness temperature to flux density, we fitted a parabola to the values from Velilla Prieto et al. (2017) with sensitivities of approximately 7.56 Jy K-1, 6.31 Jy K-1, and 6.00 Jy K-1 in the 1 mm, 2 mm, and 3 mm atmospheric windows. Yebes 40 m telescope 44.3 GHz observations are converted using the factor 4.82 Jy K-1. The total uncertainty of the flux calibration is assumed to be less than 10 %. Final data visualisation and flux calculation is performed in Python with modules numpy (Virtanen et al., 2019) and astropy (Astropy Collaboration et al., 2013).

4 Results
4.1 CO SLED
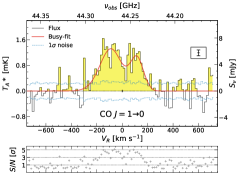
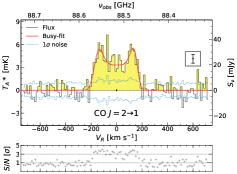
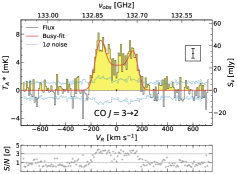
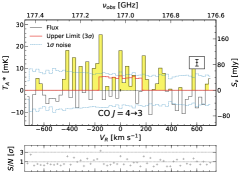
Fig. 2 shows the flux densities for the detected CO spectra of SDSSJ1226 and Fig. 3 gives a comparison between the apparent CO line intensities with error bars at a 3 confidence level. We were able to blindly identify four bright emission lines with intensity Jy km s-1 for corresponding rotational molecular transitions CO()141414This is the most distant line detection with the Yebes 40 m telescope., CO(), CO(), and CO(). The binned km s-1 CO-features are detected at the level of mJy, corresponding to signal-to-noise ratios as high as in the case of CO(). The transition CO() is undetected and thus treated as an 3 upper limit estimate151515Close to the edge of the 2 mm window, foreground noise dominates the line signal as this region is heavily contaminated by the atmospheric H2O feature, leading to a non-detection for CO() at 177.014 GHz.. We measure a line-averaged redshift of .
The CO line profiles match among the transition levels, resembling symmetric double horns with consistent linewidths km s-1 (median). This value is on the lower end, however compatible with the FWHM of Bothwell et al. (2013) SMG’s median at km s-1 (MAD).
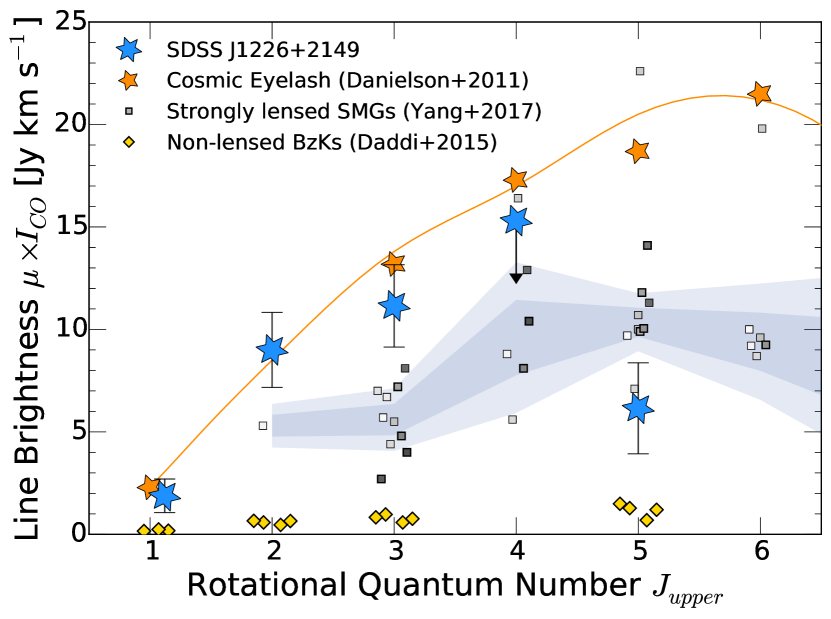
Strikingly, the line intensities for are comparable to that of the Cosmic Eyelash at a magnification of (lensed by a galaxy cluster at ; Swinbank et al., 2010; Danielson et al., 2011) while substantial brighter than the strongly lensed Herschel-selected SMGs (in principle, galaxy-galaxy lensing) from the H-ATLAS catalog compiled by Yang et al. (2017). Based exclusively on low- lines, SDSSJ1226 is one of the brightest known SMG on the sky. Only Planck-selected SMGs host consistently brighter ISMs (see e.g. Harrington et al., 2021).
As a result of high source magnification, SDSSJ1226 exhibits ultra-bright low- CO intensities. However, the trend is reversed for CO() where we observe reduced brightness, below the average of the H-ATLAS comparison sample. Via careful line luminosity ratio measurements, employing the relationship by Solomon & Vanden Bout (2005)
in K km s-1 pc2 with in GHz and in Mpc. To put the intrinsic brightness into context, the line luminosities , after correction for magnification, are , , , and K km s-1 pc for SDSSJ1226, SMM J2135-0102, H-ATLAS SMG mean, and BzK normal galaxies’ mean. More exceptionally, we obtain , the lowest value yet reported during the first four billion years of cosmic time () (Dannerbauer et al., 2009; Daddi et al., 2015; Valentino et al., 2020), indicating that individual ISM properties do not necessarily follow a common, universal evolution with redshift (see e.g. Popping et al., 2014; Boogaard et al., 2020) but can depend strongly on galaxy-wide properties such as e.g. molecular gas fraction. The sub-thermal excitation of typically bright transitions (Bothwell et al., 2013; Carilli & Walter, 2013) indicates that the molecular medium of SDSSJ1226 is less dense and/or hot than typically observed for infrared-luminous, systems (Papadopoulos et al., 2012).
4.2 Additional properties
4.2.1 Strong gravitational lensing analysis
Since SDSSJ1226 is strongly lensed by a galaxy cluster, the physical interpretation of this galaxy is highly dependent on the magnification factor . We employed the public software Lenstool161616https://projets.lam.fr/projects/lenstool/wiki (Kneib et al., 1993; Jullo et al., 2007) to derive the lensing model by utilising the dual pseudo-isothermal elliptical mass distribution (PIEMD) (Limousin et al., 2005) for each foreground dark matter halo component. Positions and magnitudes of foreground cluster members were extracted with SExtractor (Bertin & Arnouts, 1996) from HST/ACS two-channel maps. We matched visually similar features among the arclets, by colour and morphology. In Fig. 5, the identified image families are shown. The lensing model predicts a mean magnification in the field observed in the mm-regime of SDSSJ1226-A, in both the northern and southern families combined, of . It is successful in predicting the approximate locations, 0.2 arcsec rms, of possible counter-images of which three were initially identified (SDSSJ1226-A-north, -A-south, and -B). Tab. 2 provides coordinates and individual magnification factors of the strongly lensed components within the galaxy. For the central halo, an elliptical mass distribution is predicted. Furthermore, the primary deflector parameter values for SDSSJ1226+2149 are ellipticity , position angle , core radius kpc, cut radius kpc and normalisation km s-1. The line-of-sight velocity dispersion of the cluster km s-1 is derived from twelve cluster members’ spectroscopic redshifts provided in Bayliss et al. (2011). In order to estimate the size of the cluster, we calculate the radius Mpc, which approximates the virial radius, and find the virial mass of the cluster to be M☉ by employing the relation from (Munari et al., 2013). This cluster mass is in concordance with the mass obtained from our lensing model M☉. For the fixed redshift of , the critical curves are shown in Fig. 5.
4.2.2 Active galactic nuclei diagnostic
As we decided to expand the NIR/MIR colour criteria to allow a broader diversity of galaxy properties, the possibility of an AGN contribution needs to be excluded since alternatively it could explain the high observed-frame MIR and FIR emission by processes other than star-formation activity. Following the scheme proposed by Secrest et al. (2015) for AllWISE sources, we find observed-frame mag and mag. According to the model tracks relative to the demarcation region of Mateos et al. (2012) these values best match with a aging stellar population at redshift , and securely exclude AGN-fractions above 0.2.
4.2.3 Panchromatic SED-modelling
We used the MAGPHYS171717http://www.iap.fr/magphys/index.html code (da Cunha et al., 2008, 2015) to compute synthetic spectral energy distributions (SEDs), from which we obtained an apparent rest-frame 8-1000 m infrared luminosity L☉. With the apparent infrared luminosity from the best fitting SED model (reduced ) we computed the star-formation rate by assuming Salpeter IMF and the conversion factor from Kennicutt (1998). Accordingly, the apparent star-formation rate of SDSSJ1226 is M☉ yr-1, yielding a magnification corrected star-formation rate of M☉ yr-1. MAGPHYS finds a comparatively lower star-formation rate M☉ yr-1 (accounting for Chabrier-to-Salpeter IMF conversion of ), stellar mass M☉, and mass-weighted age Gyr at an average -band attenuation of mag. Although, the stellar mass appears to be enhanced by a factor of 10 while the stellar populations are (2-3) older, the posterior values are in broad agreement with the average properties of ALESS SMGs on the star-forming main-sequence (da Cunha et al., 2015; Schreiber et al., 2015).
5 Discussion
The discovery of this submm-ultrabright source demonstrates the capabilities of our selection method (Díaz-Sánchez et al., 2017; Dannerbauer et al., 2019) to identify the brigtest SMGs on the sky. The Cosmic Seahorse (SDSSJ1226) is a previously unknown FIR-bright galaxy at spectroscopic redshift being strongly lensed by a galaxy cluster at with magnification factor . The galaxy’s image is split up into three magnified images – A-south, A-north with a total extent of , and image B. Since counter-image B is less affected by shear, it might, in future studies, serve as a standard to constrain a potential flux bias caused by differential magnification.
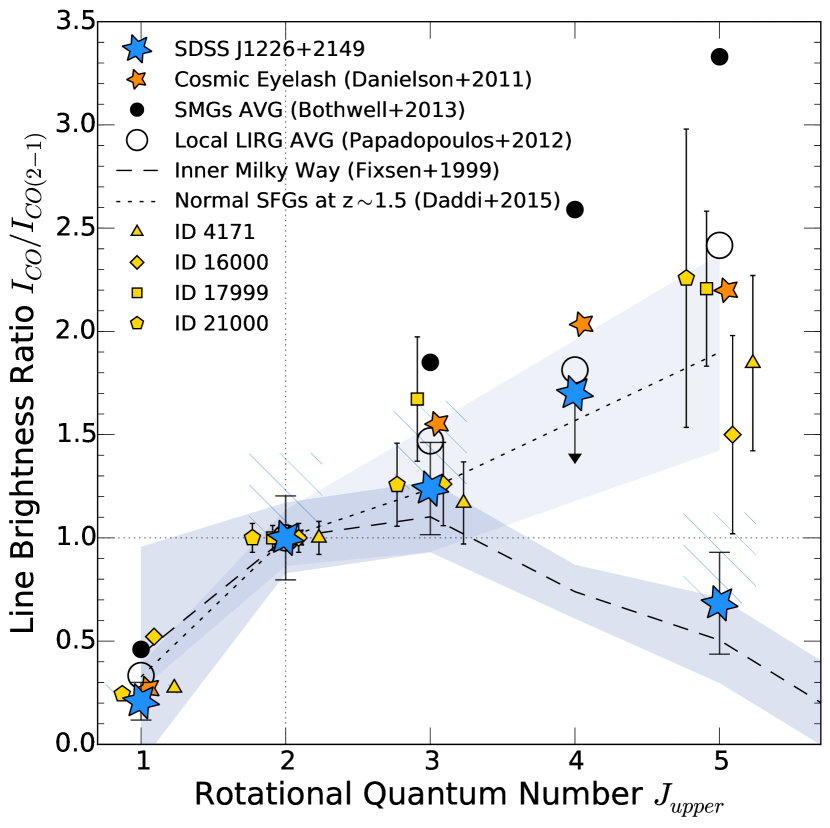
Strong lensing directly affects the obtained IRAM 30 m and Yebes 40 m telescope measurements of the CO lines that are much brighter, without magnification correction, than typically observed for Herschel-selected SMGs but comparable in brightness to the CO line flux of the Cosmic Eyelash. However, the CO() flux and thus warmer/dense gas contribution is significantly below that of the Cosmic Eyelash (Danielson et al., 2011) and even below the excitation of normal star-forming galaxies at similar redshift (Daddi et al., 2015). To relax our assumption on the shape of the CO SLED, line intensities in Fig. 4 are normalised to that is also tracing more diffuse, cirrus-like, and cool gas. Hence, the normalised brightness at high- is used as a proxy diagnostic for the dense and/or warm gas involved in star-formation (Weiß et al., 2007). Typically, 870 m-selected SMGs (see e.g. Bothwell et al., 2013) show SLEDs with a broad excitation plateau at . Similar CO SLEDs are also observed for main sequence star-forming galaxies (Daddi et al., 2015; Valentino et al., 2020), although at lower median excitation. Noted by Popping et al. (2014), the line ratio CO() over CO() does scale especially strong with with star-formation activity and molecular gas surface density at all redshifts. Thus a low line luminosity ratio is commonly interpreted as to broadly trace cold gas conditions (see e.g. Valentino et al., 2020) that are ultimately governed by energy and momentum injection from star-formation activity, consequently driving the CO excitation.
Accordingly, CO SLEDs of distant galaxies such as SMGs or normal star-forming galaxies are found to be well explained by a two-component model of the ISM, a cool and warm phase, with intensity contributions depending on the physical properties of the cool gas (Bothwell et al., 2013; Daddi et al., 2015). Purely Milky-Way like CO excitation, with very little contribution from dense and warm gas, has never been reported in an early Universe or cosmic noon galaxy before. Although some high-redshift normal SFGs show significantly similar excitation (Dannerbauer et al., 2009; Daddi et al., 2015). Even in consideration of high amounts of low surface-brightness gas – that might lead to an underestimation of line width and thus could cause issues with background subtraction – the CO excitation of in SDSSJ1226 is by confidence level below the median of normal SFGs (Daddi et al., 2015). At face value, a CO SLED with predominantly resembles single-component excitation that might originate from physical conditions possibly not dissimilar to those observed in the 4 kpc molecular region of the inner Galaxy (see Fig. 4; Fixsen et al., 1999). We acknowledge the existence of comparably low -ratios in at least one of the Valentino et al. (2020) reported non-lensed main-sequence galaxies i.e. in ID 35349 at . But since none of these sources fulfill both criteria of having (1) sufficient number of high-fidelity, low- CO flux measurements to confirm true Milky Way-like CO-SLEDs at high significance level and (2) can be strictly defined as bona fide cosmic noon galaxies at , we claim that these sources do not challenge our interpretation of the Cosmic Seahorse.
To explain the unusual CO SLED, we consider three possible scenarios. First, measurement errors originating from either calibration, pointing, and/or line width underestimation, might be responsible for the low excitation. However, only an unfortunate combination of these observational effects together could produce the magnitude of the effect in the data.
Second, a short-lived phenomenon – like a tidal bridge, commonly seen in LIRGs – might indeed produce similarly low excitation mainly due to a local decrease of high-density gas fraction (Zhu et al., 2003; Weiß et al., 2007). Together with a possible magnification bias, this spatially confined component might then be preferentially amplified. We deem this scenario as less likely, since our lensing map does not predict strong differential magnification beyond .
Third, a previously unseen mechanism of early Universe star-formation, acting on high mass, low systems, might be present. The last scenario is the most attractive, as the number counts of SMGs are intrinsically steep (see e.g. Negrello et al., 2010) and although IR-luminous systems, ULIRGs and HyLIRGs, dominate star-formation activity beyond (Le Floc’h et al., 2005) still a large fraction of cosmic star-formation rate density occurs in L☉ systems (Rodighiero et al., 2011). From a theoretical perspective, a correlation between CO excitation and star-formation surface density is expected. According to Narayanan & Krumholz (2014) model predictions181818https://sites.google.com/a/ucsc.edu/krumholz/codes/co-sled, with relatively mild star-formation surface density M☉ yr-1 kpc-2 measured within the area of the main optical arc, we find the line luminosity ratio . The model CO SLED is in concordance with low-excitation gas and broadly with the observed value at reduced for the overall SLED.
Following this line of evidence, we conclude that the Cosmic Seahorse might most likely intrinsically belong to an under-explored population of dusty, low systems with high gas masses – in disguise of classical ULIRGs – that form stars in extended, clumpy discs at low efficiency. We have no strong argument to support a major merger scenario, like broad line widths, but can also not refute it. Additional measurements at high- CO transitions, resolved interferometry of the continuum, and better constrains on the source magnification are indispensable to further eliminate one of the proposed hypotheses.
Given the remarkable low line ratio, and disregarding magnification bias, we postulate that the Cosmic Seahorse (SDSSJ1226) hosts Milky Way-like cold gas conditions – similar to that seen in the inner Galactic region – but in the distant Universe. Contrary to the more typical high-excitation regime of cold gas in SMGs, this novel source with overall star-forming main-sequence characteristics shows unique interstellar medium properties for a strongly lensed, ultra-bright galaxy at mJy. Providing further circumstantial evidence to this hypothesis, we find that the locus of intrinsic stellar mass over star-formation rate, including all discussed uncertainties (see Sec. 4.2), falls within of that of main-sequence galaxies (Schreiber et al., 2015) at the same cosmic epoch.
Moreover, in virtue of its bright CO emission lines, SDSSJ1226 could also serve as a new reference source for extended, low efficiency star-formation at high-redshift. Follow-up observations should be able to spatially resolve the main giant arc – in analogy to resolved studies of SMM J2135-0102 (Swinbank et al., 2011; Ivison et al., 2020) – into individual giant molecular clouds, further enabling insight into a massive galaxy at a truly complementary track to local ULIRG-like galaxy evolution. At declination , both ALMA and IRAM NOEMA interferometers would be capable of expanding line observations beyond CO() at high spatial resolution to ultimately verify the unusual CO excitation profile among the Cosmic Seahorse’ molecular clouds. The discovery of low gas excitation in an otherwise typical dusty star-forming galaxy emphasizes the inferred diversity of yet unexplored pathways in early galaxy assembly.
References
- (1)
- Astropy Collaboration et al. (2013) Astropy Collaboration, Robitaille, T. P., Tollerud, E. J., et al. 2013, A&A, 558, A33
- Bakx et al. (2020) Bakx, T. J. L. C., Dannerbauer, H., Frayer, D., et al. 2020, MNRAS, 496, 2372
- Bayliss et al. (2011) Bayliss, M. B., Hennawi, J. F., Gladders, M. D., et al. 2011, ApJS, 193, 8
- Bertin & Arnouts (1996) Bertin, E. & Arnouts, S. 1996, A&AS, 117, 393
- Bolatto et al. (2013) Bolatto, A. D., Wolfire, M., & Leroy, A. K. 2013, ARA&A, 51, 207
- Bothwell et al. (2013) Bothwell, M. S., Smail, I., Chapman, S. C., et al. 2013, MNRAS, 429, 3047
- Cañameras et al. (2015) Cañameras, R., Nesvadba, N. P. H., Guery, D., et al. 2015, A&A, 581, A105
- Carilli & Walter (2013) Carilli, C. L. & Walter, F. 2013, ARA&A, 51, 105
- Chapman et al. (2005) Chapman, S. C., Blain, A. W., Smail, I., et al. 2005, ApJ, 622, 772
- Carter et al. (2012) Carter, M., Lazareff, B., Maier, D., et al. 2012, A&A, 538, A89.
- Casey et al. (2014) Casey, C. M., Narayanan, D., & Cooray, A. 2014, Phys. Rep., 541, 45
- da Cunha et al. (2008) da Cunha, E., Charlot, S., & Elbaz, D. 2008, MNRAS, 388, 1595
- da Cunha et al. (2015) da Cunha, E., Walter, F., Smail, I. R., et al. 2015, ApJ, 806, 110
- Daddi et al. (2015) Daddi, E., Dannerbauer, H., Liu, D., et al. 2015, A&A, 577, A46
- Danielson et al. (2011) Danielson, A. L. R., Swinbank, A. M., Smail, I., et al. 2011, MNRAS, 410, 1687
- Dannerbauer et al. (2002) Dannerbauer, H., Lehnert, M. D., Lutz, D., et al. 2002, ApJ, 573, 473. doi:10.1086/340762
- Dannerbauer et al. (2009) Dannerbauer, H., Daddi, E., Riechers, D. A., et al. 2009, ApJ, 698, L178
- Dannerbauer et al. (2019) Dannerbauer, H., Harrington, K., Díaz-Sánchez, A., et al. 2019, AJ, 158, 34
- Boogaard et al. (2020) Boogaard, L. A., van der Werf, P., Weiss, A., et al. 2020, ApJ, 902, 109
- Dessauges-Zavadsky et al. (2019) Dessauges-Zavadsky, M., Richard, J., Combes, F., et al. 2019, Nature Astronomy, 3, 1115
- Díaz-Sánchez et al. (2017) Díaz-Sánchez, A., Iglesias-Groth, S., Rebolo, R., et al. 2017, ApJ, 843, L22
- Díaz-Sánchez et al. (2021) Díaz-Sánchez, A., Dannerbauer, H., Sulzenauer, N., et al. 2021, arXiv e-prints, p. arXiv:2106.14281
- Fixsen et al. (1999) Fixsen, D. J., Bennett, C. L., & Mather, J. C. 1999, ApJ, 526, 207
- Harrington et al. (2021) Harrington, K. C., Weiss, A., Yun, M. S., et al. 2021, ApJ, 908, 95.
- Iglesias-Groth et al. (2017) Iglesias-Groth, S., Díaz-Sánchez, A., Rebolo, R., et al. 2017, MNRAS, 467, 330
- Ivison et al. (2020) Ivison, R. J., Richard, J., Biggs, A. D., et al. 2020, MNRAS, 495, L1
- Jullo et al. (2007) Jullo, E., Kneib, J.-P., Limousin, M., et al. 2007, New Journal of Physics, 9, 447
- Kennicutt (1998) Kennicutt, R. C. 1998, ApJ, 498, 541
- Kneib et al. (1993) Kneib, J.-P., Mellier, Y., Fort, B., et al. 1993, A&A, 273, 367
- Larson (1981) Larson, R. B. 1981, MNRAS, 194, 809
- Le Floc’h et al. (2005) Le Floc’h, E., Papovich, C., Dole, H., et al. 2005, ApJ, 632, 169
- Limousin et al. (2005) Limousin, M., Kneib, J.-P., & Natarajan, P. 2005, MNRAS, 356, 309
- Mateos et al. (2012) Mateos, S., Alonso-Herrero, A., Carrera, F. J., et al. 2012, MNRAS, 426, 3271
- Munari et al. (2013) Munari, E., Biviano, A., Borgani, S., et al. 2013, MNRAS, 430, 2638. doi:10.1093/mnras/stt049
- Narayanan & Krumholz (2014) Narayanan, D. & Krumholz, M. R. 2014, MNRAS, 442, 1411
- Negrello et al. (2010) Negrello, M., Hopwood, R., De Zotti, G., et al. 2010, Science, 330, 800
- Oguri et al. (2012) Oguri, M., Bayliss, M. B., Dahle, H., et al. 2012, MNRAS, 420, 3213
- Papadopoulos et al. (2012) Papadopoulos, P. P., van der Werf, P. P., Xilouris, E. M., et al. 2012, MNRAS, 426, 2601
- Pety (2005) Pety, J. 2005, SF2A-2005: Semaine de l’Astrophysique Francaise, 721
- Planck Collaboration et al. (2016) Planck Collaboration, Ade, P. A. R., Aghanim, N., et al. 2016, A&A, 594, A13
- Popping et al. (2014) Popping, G., Pérez-Beaupuits, J. P., Spaans, M., et al. 2014, MNRAS, 444, 1301
- Rodighiero et al. (2011) Rodighiero, G., Daddi, E., Baronchelli, I., et al. 2011, ApJ, 739, L40
- Schreiber et al. (2015) Schreiber, C., Pannella, M., Elbaz, D., et al. 2015, A&A, 575, A74.
- Secrest et al. (2015) Secrest, N. J., Dudik, R. P., Dorland, B. N., et al. 2015, ApJS, 221, 12
- Solomon & Vanden Bout (2005) Solomon, P. M. & Vanden Bout, P. A. 2005, ARA&A, 43, 677
- Swinbank et al. (2010) Swinbank, A. M., Smail, I., Longmore, S., et al. 2010, Nature, 464, 733
- Swinbank et al. (2011) Swinbank, A. M., Papadopoulos, P. P., Cox, P., et al. 2011, ApJ, 742, 11
- Tacconi et al. (2008) Tacconi, L. J., Genzel, R., Smail, I., et al. 2008, ApJ, 680, 246
- Tacconi et al. (2010) Tacconi, L. J., Genzel, R., Neri, R., et al. 2010, Nature, 463, 781.
- Tercero et al. (2020) Tercero, B., Cernicharo, J., Cuadrado, S., et al. 2020, A&A, 636, L7
- Tercero et al. (2021) Tercero, F., López-Pérez, J. A., Gallego, J. D., et al. 2021, A&A, 645, A37.
- Valentino et al. (2020) Valentino, F., Daddi, E., Puglisi, A., et al. 2020, arXiv e-prints, arXiv:2006.12521
- Vieira et al. (2013) Vieira, J. D., Marrone, D. P., Chapman, S. C., et al. 2013, Nature, 495, 344
- Velilla Prieto et al. (2017) Velilla Prieto, L., Sánchez Contreras, C., Cernicharo, J., et al. 2017, A&A, 597, A25
- Virtanen et al. (2019) Virtanen, P., Gommers, R., Burovski, E., et al. 2019, Zenodo
- Weiß et al. (2007) Weiss, A., Downes, D., Walter, F., et al. 2007, From Z-Machines to ALMA: (Sub)Millimeter Spectroscopy of Galaxies, 375, 25
- Wright et al. (2010) Wright, E. L., Eisenhardt, P. R. M., Mainzer, A. K., et al. 2010, AJ, 140, 1868
- Yang et al. (2017) Yang, C., Omont, A., Beelen, A., et al. 2017, A&A, 608, A144
- Yang et al. (2019) Yang, C., Gavazzi, R., Beelen, A., et al. 2019, A&A, 624, A138
- Zhu et al. (2003) Zhu, M., Seaquist, E. R., & Kuno, N. 2003, ApJ, 588, 243
Appendix A Lensing map
| ID a | R.A. [] | Dec. [] | b |
|---|---|---|---|
| 1.A-north | 186.71274 | 21.83322 | 8.11.1 |
| 1.A-south | 186.71290 | 21.83244 | 4.40.8 |
| 1.B | 186.70915 | 21.82564 | 2.20.3 |
| 2.A-north | 186.71267 | 21.83357 | 7.30.7 |
| 2.A-south | 186.71302 | 21.83212 | 1.90.4 |
| 2.B | 186.70902 | 21.82578 | 2.30.3 |
| 3.A-north | 186.71244 | 21.83355 | 6.00.6 |
| 3.A-south | 186.71296 | 21.83210 | 1.70.4 |
| 3.B | 186.70919 | 21.82579 | 2.30.3 |
| 4.A-north | 186.71251 | 21.83381 | 7.20.6 |
| 4.A-south | 186.71306 | 21.83192 | 1.20.3 |
| 4.B | 186.70894 | 21.82592 | 2.30.3 |
| 1.C-east | 186.71021 | 21.83615 | 123 |
| 1.C-west | 186.70894 | 21.83530 | 175 |
Note. — aAll entries start formally with ’SDSSJ1226-’. The digit refers to the ID of the family of images coming from the same region within the source galaxy. The letter and positional argument indicates the ID of the image seen in the image plane. bMagnification factor.