Tailed Radio Galaxies from the TIFR GMRT Sky Survey
Abstract
We present a list of candidate tailed radio galaxies using the TIFR GMRT Sky Survey Alternative Data Release 1 (TGSS ADR1) at 150 MHz. We have visually examined 5336 image fields and found 268 candidates for the tailed galaxy. Tailed radio galaxies are classified as Wide Angle Tailed (WAT) galaxies and Narrow-Angle Tailed (NAT) galaxies, based on the angle between the two jets of the galaxy. We found a sample of tailed radio galaxies which includes 189 ‘WAT’ and 79 ‘NAT’ type sources. These newly identified tailed sources are significant inclusion to the list of known tailed radio galaxies. The source morphology, luminosity feature of the different candidate galaxies and their optical identifications are presented in the paper. Other radio properties and general features of the sources are also discussed.
keywords:
galaxies: active – galaxies: formation – galaxies: jets – galaxies: kinematics and dynamics– radio continuum: galaxies1 Introduction
Tailed radio galaxies are the galaxies having a pair of radio “tails” extended far from the optical galaxy. The radio “tail” is nothing but bending of both of the radio jets in the same direction. Tailed sources are classified depending on the angle between the radio tails with the core of the galaxy. The narrow-angle tail (NAT) radio sources are featured by tails bent in a narrow ‘V’ or ‘L’ shape where the angle between two tails is less than 90 degree. The jet bending in the case of Wide-angle tail (WAT) radio sources is such that the WATs exhibit wide ‘C’ type morphologies and the angle between the two components is greater than degree but less than degree. These ‘WAT’ and ‘NAT’ morphologies were first defined in Owen & Rudnick (1976). The structures of NAT sources may be affected by the projection effect. The luminosity of the WAT sources come in between the classical double and the NAT sources (O’Donoghue et al., 1993).
Tailed sources are generally found in the dynamical, active and X-ray intense region of the galaxy rich clusters (Burns, 1981; O’Dea & Owen, 1985). It is considered that the ram pressure associated with the dynamical interaction of the host galaxy with the dense intercluster medium (ICM; assumed to be at rest) causes the radio jets to bend in the reverse direction of motion, away from the cluster centre (Begelman, Rees & Blandford, 1979; Vallee, Bridle & Wilson, 1981; Baan & McKee, 1985). The degree of bending depends on the velocity of the host galaxies. The NAT sources are found towards the edge of the associated cluster whether the WAT sources are generally found close to the gravitational centre of the clusters (Quintana & Lawrie, 1982). The ram pressure explanation of jet bending does not hold for the WAT sources as they move very slowly than the NATs (Burns & Balonek, 1982). The WAT morphology is believed to cause by strong intercluster wind (Burns et al., 1986), in some literature it is attributed to the electromagnetic interaction of the non-neutral jet with the ICM magnetic field (Eilek et al., 1984). Tailed radio sources can be used to trace clusters and high redshift systems (Blanton et al., 2000, 2001; Smolcic et al., 2007); to investigate inner cluster environment (Douglas et al., 2011; Wing & Blanton, 2011; Blanton et al., 2001); to study cluster magnetic field (Feretti et al., 1999); to study the interaction of the jet with intercluster medium and to study the evolution of galaxies and galactic dynamics (Pinkney et al., 1992).
O’Dea & Owen (1985) have identified 57 tailed sources in the directions of different galaxy clusters using the A and B configurations of the VLA at cm. This sample of 57 sources includes NATs, WATs and sources with complex morphologies. O’Donghue, Owen & Eilek (1990) identified 11 WATs in cm using VLA in A and C configuration. Detail study of big WAT 1919+479 is presented in Piffaretti et al. (1998). Six other WATs are found in the ATLAS field in 1.4 GHz using ATCA (Mao et al., 2010). NGC 1265 is a well studied NAT source (Xu, O’Dea & Biretta, 1999). Around 1600 sources are identified as possible ‘tailed’ candidates using a pattern recognition algorithm (Proctor, 2016) using the NRAO VLA Sky Survey (NVSS; Condon et al. (1990)) at 1.4 GHz.
In this paper, we present tailed radio sources of which sources are located in the northern sky. We have classified 189 sources as ‘WAT’ type and 79 sources as ‘NAT’ type based on the angle made by the two bent lobes. Most of these sources are observed before and catalogued in different radio surveys, mostly in the NVSS survey and in the Sydney University Molonglo Sky Survey (SUMSS; Mauch et al. (2003)) at 843 MHz, but not reported as tailed sources. We found that only about half of the sources are associated with a known cluster. The optical galaxy hosting the radio sources are located in the redshift range of to and the total flux at 150 MHz ranges from 0.1 Jy to as large as 20.1 Jy.
We arrange the paper in the following ways: In section 2, we present the method of the identification of sources. In the next section (section 3), we describe different radio properties of the sources. In section 4, we discuss the general features and overall properties of sources. We summarize the study in the final section. We assumed the flat cosmology with , , and (Aghanim et al., 2018).
2 Data, analysis and candidate list
The tailed sources are found from the manual inspection of a large number of high-resolution images generated by the TIFR GMRT Sky Survey Alternative Data Release 1 (TGSS ADR1; Intema et al. (2017)). The continuum survey at 150 MHz using the Giant Metrewave Radio Telescope (GMRT; Swarup (1991)) covers a declination range from to + degrees. The purpose of the survey was to provide a high resolution and high sensitivity map of the 150 MHz sky. Earlier, four tailed galaxies were serendipitously discovered with GMRT at 610 and 327 MHz (Giacintucci & Venturi, 2009). Detection of a WAT (J0037+18) with interacting host galaxy as optical counterpart (Patra et al., 2019) is reported in same frequency bands using GMRT.
We have made use of the TGSS ADR1 consisting of images of a total of 5536 fields with a typical noise of 5 mJy at 150 MHz. The observation corresponding to this data release was executed between 2010 and early 2012 and covers about 90 per cent of the whole sky. The survey covers 1 steradian of the southern sky, the maximum accessible southern sky from the observatory location. In search of head tailed radio galaxies, we closely examine each of these 5536 image fields using AIPS. We found 20 sources that are within 20 kpc of the position of the centre of known galaxy clusters and we exclude them from our list as they may be radio relics of the cluster. After finding a possible tailed candidate, we note the position of the radio centre, measure the RMS noise of the subfield and flux density of the source. We extract the image of the individual candidate source to measure the bending angle between the lobes.
For optical identification of the sources, we search SDSS (Gunn et al., 2006; Alam et al., 2015) and 2MASS (Skrutskie et al., 2006) catalogues and identified optical/IR sources near the core of the corresponding radio sources. In case of the absence of a prominent radio core, we look for optical/IR sources near the intersection of two individual jet axis. We found the optical counterparts of 233 sources. Since optical counterparts are more compact than the corresponding radio galaxies, we used the position of optical/IR counterparts as the position of these sources. For the rest of the 35 sources where an optical counterpart is not available, a radio-morphology based position is used.
Different information about the objects reported in this paper is given in table 1. In the first two columns, the catalogue number and identification names are given. Columns (3) and (4) contain the J2000 coordinate of the optical galaxy identified with the radio source. When the optical counterpart is not found, the approximate position using the morphology of the radio source is provided. Column (5) is the reference catalogues of the optical/IR/UV galaxy hosting the radio source. In columns (6) and (7), the total flux density in Jy at MHz () and MHz () obtained from TGSS and NVSS survey are provided. Columns (8) and (9) contain the spectral index and redshift of the sources respectively. In column (10), we provide the luminosity in 150 MHz. Column (11) contains the name of earlier radio surveys where the source is presented without identification of them as tailed radio galaxy.
3 Results
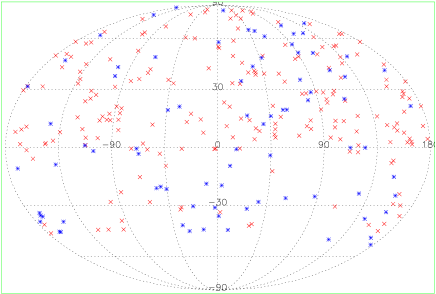
We report the discovery of 189 WAT and 79 NAT sources from the TGSS ADR1 at 150 MHz. We remove sources reported in Proctor (2016) and other catalogues from our list. We present the spatial distribution of the newly identified WAT and NAT sources in Figure 1. As expected, the sources show random distribution. Many of these newly identified sources are catalogued as two separate sources in the NVSS catalogue (Condon et al., 1990). The number of sources is higher in the northern region compared to the southern region because the survey is limited up to a declination of –55 degree and the local RMS in the southern hemisphere is higher compared to that of the northern hemisphere due to high declination effects.
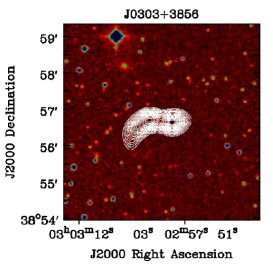
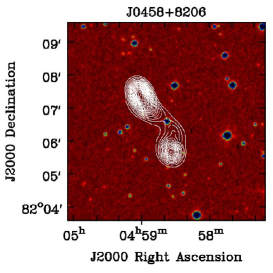
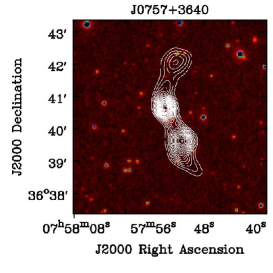
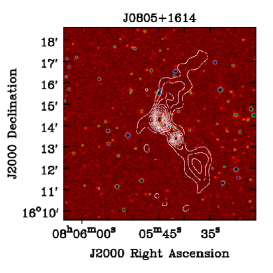
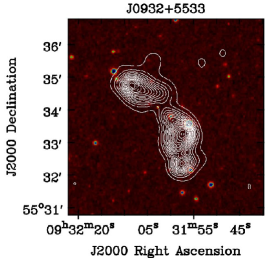
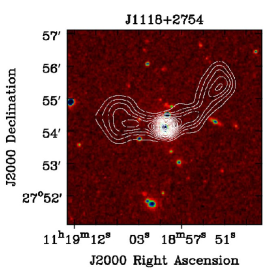
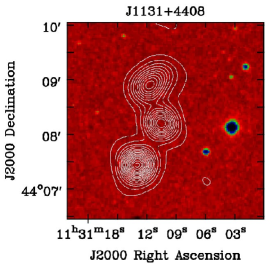
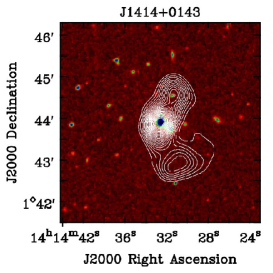
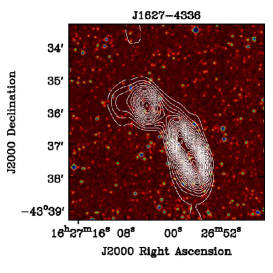
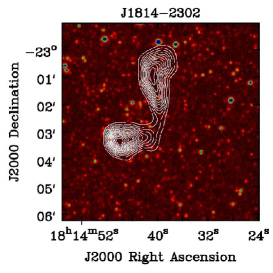
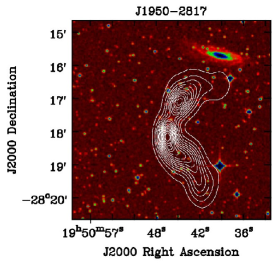
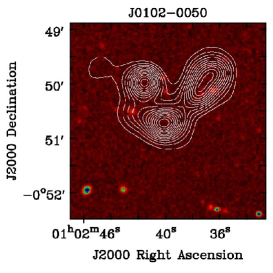
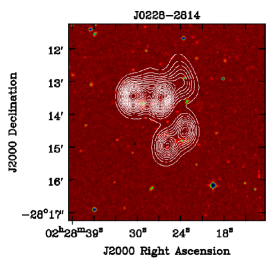
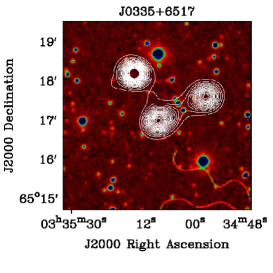
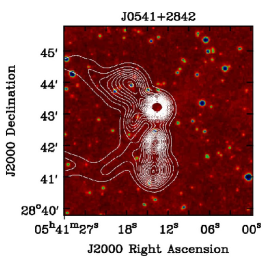
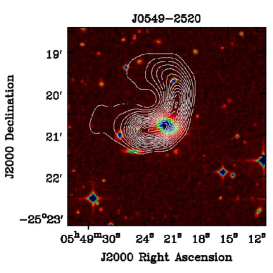
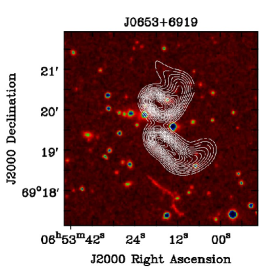
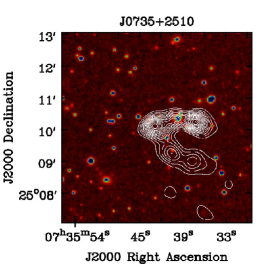
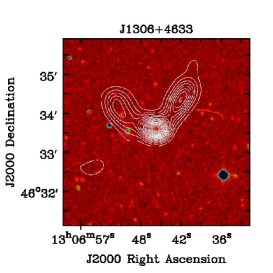
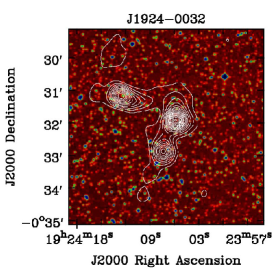
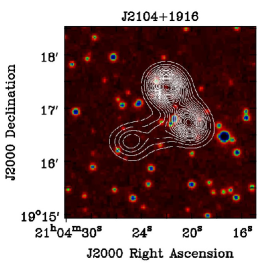
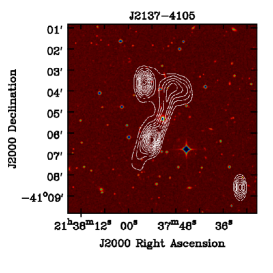
We present high-sensitivity 150 MHz GMRT images of 12 selected WAT and NAT radio galaxies (Figure 2 and 3) identified from the TGSS as examples of WAT and NAT sources discovered under the present project. DSS optical images are overlayed with corresponding TGSS images. In all figures, contour levels are in a geometric progression of and the level multiplication factor is three times the RMS noise of the respective image fields.
3.1 Cluster Association
In the Universe, galaxy clusters are the greatest gravitationally bound structures. Galaxy clusters give an ideal tool for cosmologists to understand the composition and evolution of the structures of the Universe. They provide strong proof for the appearance of large amounts of dark matter. They are created around dark matter concentrations when two cosmic objects (sheets and filaments) are intersected. Understanding galaxy clusters is very helpful for tracing the large-scale structure of the Universe.
We associate our tailed radio galaxy sample with cluster catalogues from the literature that cover the TGSS field. These clusters have been detected using various methods including optical, IR, X-ray and SZ observations. The cluster catalogues used are listed in Table 5. Using only the 125 WATs and NATs candidate sources with redshifts, we performed a three-dimensional cross-match with the known clusters across the field using a search radius of 2 Mpc.
We found associated known clusters or groups for 103 tailed radio galaxies from our WATs and NATs sample (out of 268 total). The details of associated clusters for WATs and NATs presented in the current paper are listed in table 3 and table 4. In columns (1) and (2), the catalogue number and cluster identification name are given. In columns (3) and (4) the name of the catalogue where the cluster is named and the redshift of the galaxy cluster is given. Column (5) and (6) contains the comoving distance () in Mpc and angular separation (in ars) between the centre of associated cluster and galaxy centre. Column (7) indicates the linear distance of the host galaxy from the galaxy cluster centre. In column (8), the BCG r band magnitude is shown. In column (9) and (10), cluster radius () and cluster richness () is shown. In column (11), the number of member galaxy candidates () within is shown and in column (12), the mass of the cluster within () is presented. The cluster density is presented in column (13). We also found that for 65 head tailed sources in our sample, the distances between two sources is less than 500 kpc. Search for a new cluster of galaxies is encouraged near these WATs and NATs when no associated cluster is identified.
3.2 Bending angle
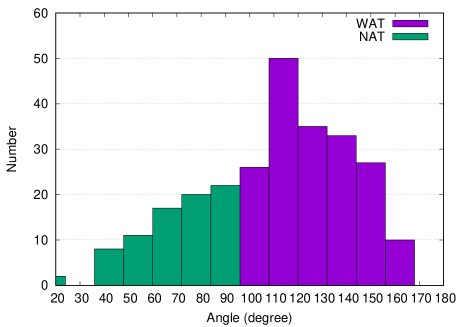
We measured the bending angle of sources using the angle between two individual jet axis connecting the core. We classified all tailed sources in our sample into two groups – ‘wide-angle tailed’ galaxy or ‘narrow-angle tailed’ depending on the bending angle of these sources. For some sources, the bending angle could not be measured because of the complex structure of these sources.
Figure 2 presents the histogram showing the distribution of bending angles of sources presented in the current paper for both NAT and WAT type sources. Most of the NAT sources made an angle greater than . WAT sources produced a wide variety of angles between the two components with a peak near 110–120.
3.3 Luminosity feature
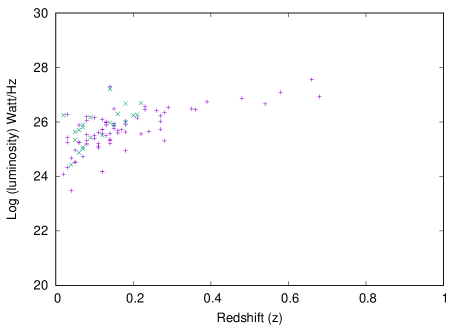
We have calculated the radio luminosities () of sources using the redshift information of either the optical counterpart or the associated cluster using the standard formula (Donoso et al., 2009)
| (1) |
where is the redshift parameter, is the spectral index (), is luminosity distance of the source (Mpc), is the flux density (Jy) at MHz frequency.
Figure 3 shows the redshift vs luminosity plot of the tailed sources for which either spectroscopic or photometric redshift is available. In our sample, the highest redshift for the NAT and WAT sources are and respectively.
The source radio luminosities at 150 MHz are in the order of W Hz-1, which is similar to a typical radio galaxy. The average value of [W Hz-1] for WATs is 25.62 (1 standard deviation, median) and that of NATs is 25.82 (1 standard deviation, median).
J0856+4829 is the least luminous WAT in our sample with W Hz-1 () and J0549–2520 is the least luminous NAT in our sample with W Hz-1 (). J0225+4031 is the most luminous WAT in our sample with W Hz-1 () and J1314+6220 is the most luminous NAT in our sample with W Hz-1 ().
3.4 Spectral index
The two-point spectral index of newly discovered radio galaxies between 150 and 1400 MHz is calculated assuming , where is the spectral index and is the radiative flux density at a given frequency . These spectral indices have been determined by integrating fluxes over the same aperture at both frequencies. In Table 1 and Table 2, spectral index () is mentioned. For 179 WATs and 66 NATs, the spectral index measurements are available. The remaining 10 WATs and 13 NATs were not detectable in NVSS maps since their declination is less than the NVSS coverage. Out of 179 WATs with spectral index information, 13 (7 per cent) show flat spectrum (). Out of 66 NATs with spectral index information, 8 (12 per cent) are showing flat spectrum (). Most of the WATs and NATs show a steep radio spectrum () which is a common property of lobe dominated radio galaxies.
The uncertainty of spectral index measurements due to flux density uncertainty (Mahony et al., 2016) is
| (2) |
where and refers to NVSS and TGSS frequencies and flux densities respectively. The flux density accuracy in TGSS ADR1 and NVSS is per cent (Intema et al., 2017) and per cent (Condon et al., 1990). Using equation 2, the spectral index uncertainty is =0.05.
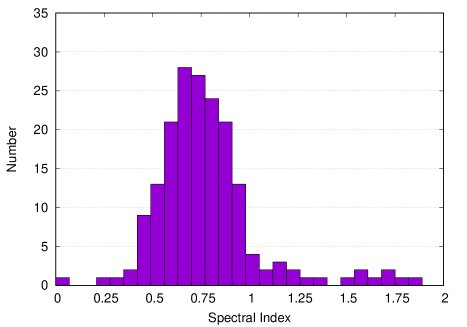
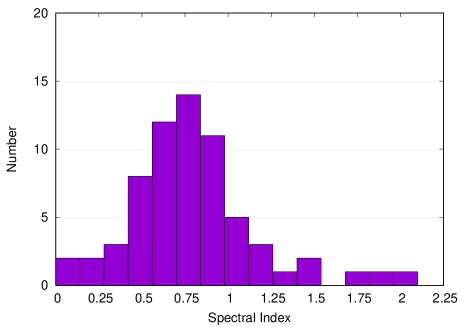
Histogram with spectral index distribution for WATs (left) and NATs (right), presented in the current article, is shown in Figure 4. The distribution shows slightly different peaks for WATs and NATs. The histogram peaks near for WATs and near for NATs. For WAT, the total span of is from to and for NATs, the total span of is from to . Among WATs, J0752+0814 has the highest spectral index (with =1.86) and J0041+2104 has the lowest spectral index (with =0.02). For NATs, J0704+6318 has the highest spectral index (with =2.04) and J2144+2107 has the lowest spectral index (with =0.38).
4 Discussion
4.1 Characteristic of WATs and NATs
The tailed radio galaxies are normally representatives of Fanaroff & Riley (1974) class I sources, but in terms of luminosities, one can place them close to the FR II transition (Miley et al., 1972; Bliton et al., 1988). However, on a scale of arcseconds, these tailed galaxies normally have U-shaped symmetry constructed by a pair of bent jets which originate from the nucleus and meet with the more elongated tails after adequate bending (Owen, Burns and Rudnick, 1979; O’Dea & Owen, 1986). So far, most of the tailed galaxies have been discovered entirely in clusters, with the majority of them being rich clusters (Mao et al., 2009). At least a few factors influence the bending of tailed radio galaxies. (1) Most of the tailed radio galaxy search activities focus on galaxies in clusters (O’Dea & Owen, 1985) and the bending of radio tails is due to the motion of the host galaxy through the inter-cluster medium. (2) The hypotheses that host galaxy orbits are either radial, circular, or isotropic (Jones & Owen, 1979) are tested using the initial ejection angle of the jet with respect to the motion of the galaxy and the jet flow velocity (Baan & McKee, 1985). (3) The differences in the ejection of jets with respect to the direction of motion of the host galaxy in the inter-cluster medium and environments, as well as projection effects, are responsible for the asymmetries found in the radio jets in some tailed radio galaxies (Sebastian et al., 2017). (4) The probability of detection of tailed radio sources decreases in the clusters with less number of galaxies (Stocke, 1977; Adams, Jensen & Stocke, 1980). (5) The precessing radio jets may be responsible for various types of bending.
Due to projection effects, the distinction between WATs and NATs is somewhat arbitrary. Many of the WAT sources look like NAT sources simply due to projection effects. Transonic or supersonic relative motions drive jets of tailed radio galaxies. Even with high-resolution (arcsec scale) radio observations, a few NAT sources have been discovered to have a remarkable narrow extended structure, with the two radio tails not being resolved (e.g IC 310; Feretti et al. (1988)).
WATs display bending of two jets less than NATs and the bending model of dynamical ram pressure can not completely explain the bending of WATs morphology (Burns, 1981; Burns et al., 1982; Eilek et al., 1984). WAT sources appear to be associated with large size D or cD galaxies approaching rest at cluster centres (e.g., 3C 465) and therefore should not have the necessary velocity to produce the ram pressure required for the observed bends in their radio jets. So, an alternative fundamental mechanism is required to interpret the noticed bending of jets of WATs. An electromagnetic force that results from the interaction of a jet carrying a net electrical current with the magnetic field of the inter-cluster medium may be responsible for the bending of jets in WATs (Eilek et al., 1984). An ordered magnetic field is required to generate the symmetric shape of WATs. Collisions with dense clouds in the ICM, on the other hand, may also deflect jets. In some WATs, this method may be responsible (Burns et al., 1986) but it is difficult to reproduce the large-scale symmetric structure of WATs by only this method.
4.2 Cluster mass and tailed radio galaxies
The bending of jets is affected by the mass of the parent cluster affects in two ways. Firstly, the cluster mass is correlated with the density of the inter-cluster medium for which heavier clusters experience the denser inter-cluster medium. Secondly, the mass of the cluster is correlated with the velocity dispersion of galaxies which results in faster movement of galaxies in high mass clusters (Mguda et al., 2015). According to a simulation by Mguda et al. (2015), there are no tailed radio galaxies in clusters with masses less than and only a few in clusters with masses less than . Another simulation suggests the presence of over 50000 clusters in the mass range and over 4000 clusters with masses larger than which give proper favourable conditions for radio jet bending (Gottlöber et al., 2006). The majority of tailed radio galaxies are seen in clusters with the mass range and . Clusters above are expected to host at least one-tailed galaxy at some point during their lifetime (Mguda et al., 2015). In tables 3 and 4, we summarise different properties of galaxy clusters corresponding to WAT and NATs galaxies detected in the current paper.
The mass and radius are two important properties of a cluster. The widely used parameters of a cluster are , the radius within which the mean density of a cluster is 200 times of the critical density of the Universe (), and , the cluster mass within . We calculate the cluster optical mass and (in unit of ) from cluster richness which is closely correlated as (Wen at al., 2012)
| (3) |
The relation between cluster optical mass (, in unit of ) and richness () (Wen et al., 2015) is
| (4) |
We find host galaxy clusters for 103 tailed sources using 23 known cluster catalogues summary of which is shown in Table LABEL:tab:WAT-NAT-cat. The maximum cluster is from the WHL cluster catalogue which provides optical richness and optical mass (, ). The range of optical mass () of galaxy cluster lies in between . Four of these clusters come from X-ray cluster catalogues. We calculate the corresponding optical mass of these MCXC galaxy cluster catalogue. We find that the majority (166 of 269 total) of tailed radio galaxies in our sample have no association with known clusters or groups. The detected WAT and NAT sources should be used to search for nearby clusters. There are 10 clusters found in relatively low-mass clusters (of the order of ).
5 Summary
We have presented 268 new tailed galaxy candidates from the visual inspection of the 150 MHz TGSS survey out of which are WAT type and are NAT type sources. We found sources from the northern sky and 74 sources from the southern sky. Because of the low radio frequency used in the survey, a significant number of steep-spectrum sources are seen.
The summary of the paper is as follows :
We report a sample of 268 tailed radio galaxies. This makes it the largest sample of tailed radio galaxies discovered to date. Out of 268 new tailed galaxies, 189 are WAT type galaxies and 79 are NAT type galaxies.
The optical/IR counterpart of sources are found and redshift is available for sources. About 43 per cent (82/189) WATs and 31 per cent (25/79) NATs are identified by redshift.
The total integrated flux density of sources in our sample at 150 MHz ranges from 0.1 Jy to as large as 20.1 Jy.
In our sample of tailed radio galaxies, two tailed galaxies (WAT-J0932+5533 and NAT-J2038–2011) are hosted by quasars.
The high-resolution deep radio observations of TGSS-ADR images has enabled us to find tailed radio galaxies with less luminosity at 150 MHz. J0856+4829 is the least luminous WAT in our sample with W Hz-1 () and J0549–2520 is the least luminous NAT in our sample with W Hz-1 (). J0225+4031 is the most luminous WAT in our sample with W Hz-1 () and J1314+6220 is the most luminous NAT in our sample with W Hz-1 ().
The spectral index peaks near for both WATs and NATs. For WAT, the total span of is from to and for NATs, the total span of is from to .
The measured span of optical mass of host galaxy clusters for is and for is .
The range of calculated density of galaxy clusters is from 54.76 (Mpc-3) to 2.14 (Mpc-3)
Acknowledgements
We thank the whole TGSS team and the staff of the GMRT behind this survey. GMRT is run by the National Centre for Radio Astrophysics of the Tata Institute of Fundamental Research. This research has made use of the “Aladin sky atlas” developed at CDS, Strasbourg Observatory, France and the NASA/IPAC Extragalactic Database (NED) operated by the Jet Propulsion Laboratory, California Institute of Technology. This publication makes use of data products from the Two Micron All Sky Survey, which is a joint project of the University of Massachusetts and the Infrared Processing and Analysis Center/California Institute of Technology, funded by the National Aeronautics and Space Administration and the National Science Foundation.
Data Availability Statement
The data that support the plots within this paper and other findings of this study are available from the corresponding author upon reasonable request. The TGSS ADR 1 images are available at http://tgssadr.strw.leidenuniv.nl/doku.php.
References
- Abell (1958) Abell G. O., 1958, ApJS, 3, 211
- Abell et al. (1989) Abell G. O., Corwin H. G. Jr., Olowin R. P., 1989, ApJS, 70, 1
- Adams, Jensen & Stocke (1980) Adams M., Jensen E., and Stocke J. 1980, A.J., 85,1010
- Aghanim et al. (2018) Aghanim et al., 2020, A&A, 641, 67
- Alam et al. (2015) Alam S. et al., 2015, ApJS, 219, 12
- Baan & McKee (1985) Baan W. A., McKee M. R., 1985, A&A, 143, 136
- Baan & McKee (1985) Baan W. A. and McKee M. R. 1985, A&A, 143, 136
- Bliton et al. (1988) Bliton M., Rizza E., Burns J. O., Owen F. N., & Ledlow, M. J. 1998, MNRAS, 301, 609
- Begelman, Rees & Blandford (1979) Begelman M. C., Rees M. J., Blandford R. D., 1979, Nature, 279, 770
- Becker et al. (1995) Becker R. H., White R. L., Helfand D. J., 1995, ApJ, 450, 559
- Bennett et al. (1986) Bennett C. L., Lawrence C. R., Burke B. F., Hewitt J. N., Mahoney J., 1986,ApJS, 61, 1
- Blanton et al. (2000) Blanton E. L., Gregg M. D., Helfand D. J., Becker R. H., White R. L., 2000, ApJ, 531, 118
- Blanton et al. (2001) Blanton E. L., Gregg M. D., Helfand D. J., Becker R. H., Leighly K. M.,2001, AJ, 121, 2915
- Blanton et al. (2001) Blanton E. L., Gregg M. D., Helfand D. J., Becker R. H., White R. L., 2003, AJ, 125, 1635
- Bleem et al. (2015) Bleem L. E. et al., 2015, ApJs, 216, 27
- Bolton et al. (1964) Bolton J., Gardner F., Mackey M., 1964, Australian J. Phys., 17, 340
- Bolton, Clarke & Ekers (1965) Bolton J. G., Clarke M. E., Ekers R. D., 1965, Aus. J. Phy., 18, 627
- Burns (1981) Burns J. O., 1981, MNRAS, 195, 523
- Burns & Balonek (1982) Burns J. O., Balonek T. J., 1982, ApJ, 263, 546
- Burns et al. (1982) Burns J. O., Eilek J. A., & Owen F. N. 1982, in IAU Symp. 97, Extragalactic Radio Sources, ed. D. Heeschen & C. Wade (Dordrecht: Reidel), 45
- Burns et al. (1986) Burns J. O., O’Dea C. P., Gregory S. A., Balonek T. J., 1986, ApJ, 307, 73
- Caswell & Crowther (1969) Caswell J. L., Crowther J. H., 1969, MNRAS, 145, 181
- Chincarini et al. (1976) Chincarini G., Rood H. J., 1976, Publications of the Astronomical Society of the Pacific (PASA), 88, 388
- Chon, Bohringer & Nowak (2013) Chon G., Bohringer H., Nowak N., 2013, MNRAS, 429, 3272
- Cohen et al. (2007) Cohen A. S., Lane W. M., Cotton W. D., Kassim N. E., Lazio T. J. W., Perley R. A., Condon J. J., Erickson W. C., 2007, AJ, 134, 1245
- Colla et al. (1970) Colla G. et al., 1970, A&AS, 1, 281
- Colla et al. (1972) Colla G. et al., 1972, A&AS, 7, 1
- Colla et al. (1973) Colla G. et al., 1973, A&AS, 11, 291
- Condon et al. (1990) Condon J. J., Cotton W. D., Greisen E. W., Yin Q. F., Perley R. A., Taylor G. B., Broderick J. J., 1998, AJ, 115, 1693
- Cowie & McKee (1975) Cowie L. L. & McKee C. F., 1975, A&A, 43, 337
- Dalton et al. (1997) Dalton G. B., Maddox S. J., Sutherland W. J., Efstathiou G., 1997, MNRAS, 289, 263
- Donoso et al. (2009) Donoso E., Best P. N., Kauffmann G., 2009, MNRAS, 392, 617
- Douglas et al. (2011) Douglass E. M., Blanton E. L., Clarke T. E., Randall S. W., Wing J. D., 2011, ApJ, 743, 193
- Ebeling et al. (2002) Ebeling Harald., Mullis Christopher R., Tully R. Brent., 2002, ApJ, 580, 74
- Eilek et al. (1984) Eilek J. A., Burns J. O., O’Dea C. P., & Owen, F. N., 1984, ApJ, 278, 37
- Eke et al. (2004) Eke et al., 2004, MNRAS, 348, 866
- Feretti et al. (1988) Feretti L., Giovannini G., Klein U., et al., 1998, A &A, 331, 475
- Fanaroff & Riley (1974) Fanaroff B. L., Riley J. M., 1974, MNRAS, 167, 31
- Ficarra et al. (1985) Ficarra A., Grueff G., Tomassetti G., 1985, A&A, 59, 255
- Feretti et al. (1999) Feretti L., Dallacasa D., Govoni F., Giovannini G., Taylor G. B., Klein U., 1999, A&A, 344, 472
- Gunn et al. (2006) Gunn J, E. et al., 2006, AJ, 131, 2332
- Gal et al. (2009) Gal R. R., Lopes P. A. A., de Carvalho R. R., Kohl-Moreira J. L., Capelato H. V., Djorgovski S. G., 2009, AJ, 137, 298
- Giacintucci & Venturi (2009) Giacintucci S., Venturi A, 2009, A&A, 505, 5561
- Goto et al. (2002) Goto Tomotsugu. et al., 2002, AJ, 123 1807
- Gottlöber et al. (2006) Gottlöber S., Yepes G., Khalatyan A., Sevilla R., Turchaninov V., 2006, in Manoz C., Yepes G., eds, The Dark Side of the Universe Vol. 878 of American Institute of Physics Conference Series, Dark and baryonic matter in the MareNostrum Universe. pp 3
- Gower et al. (1967) Gower J. F. R., Scott P. F., Wills D., 1967, MNRAS, 71, 49
- Gregory & Condon (1991) Gregory P. C., Condon J. J., 1991, ApJS, 75, 1011
- Griffith et al. (1994) Griffith M. R., Wright A. E., Burke B. F., Ekers R. D., 1994, ApJS, 90, 179
- Hales et al. (1988) Hales S. E. G., Baldwin J. E., Warner P. J., 1988, MNRAS, 234, 919
- Hales et al. (1990) Hales S. E. G., Masson C. R., Warner P. J., Baldwin J. E., 1990, MNRAS, 246, 256
- Hales et al. (1991) Hales S. E. G., Mayer C. J., Warner P. J., Baldwin J. E., 1991, MNRAS, 251, 46
- Hales et al. (1993a) Hales S. E. G., Baldwin J. E., Warner P. J., 1993a, MNRAS, 263, 25
- Hales et al. (1993b) Hales S. E. G., Masson C. R., Warner P. J., Baldwin J. E., Green D. A., 1993b, MNRAS, 262, 1057
- Hao et al. (2010) Hao Jiangang. et al., 2010, ApJS, 191, 254
- Healey et al. (2007) Healey Stephen E., et al., 2007, ApJS, 171, 61
- Intema et al. (2017) Intema H. T., Jagannathan P., Mooley K. P., Frail D. A., 2017, A&A, 598
- Jones & Owen (1979) Jones T. W., & Owen F. N. 1979, ApJ, 234, 818
- Koester et al. (2007) Koester B. P. et al., 2007, ApJ, 660, 239
- Khatri et al. (2016) Khatri Rishi., 2016, A&A, 592, 48
- Kollgaard et al. (1994) Kollgaard R. I., Brinkmann W., Chester M. M., Feigelson E. D., Hertz P., Reich P., Wielebinski R., 1994, ApJS, 93, 145
- Large et al. (1981) Large M. I., Mills B. Y., Little A. G., Crawford D. F., Sutton J. M., 1981, MNRAS, 194, 693L
- Lopes et al. (2004) Lopes P. A. A., de Carvalho R. R., Gal R. R., Djorgovski S. G., Odewahn S. C., Mahabal A. A., Brunner R. J., 2004, AJ, 128, 1017
- Lumsden et al. (1992) Lumsden S. L., Nichol R. C., Collins C. A., Guzzo L., 1992, MNRAS, 258, 1
- Mguda et al. (2015) Mguda Z., Faltenbacher A., van der Heyden K., Gottlöber S., Cress C., Vaisanen P., Yepes G., 2015, MNRAS, 446, 3310
- Mahony et al. (2016) Mahony, E. K., Morganti, R., Prandoni, I., et al. 2016b, MNRAS, 463, 2997
- Mao et al. (2010) Mao M. Y., Sharp R., Saikia D. J., Norris R. P., Hollitt M. J., Middelberg E., Lovell J. E. J., 2010, MNRAS, 406, 2578
- Mao et al. (2009) Mao M. Y., Johnston-Hollitt M., Stevens J. B., &Wotherspoon S. J., 2009, MNRAS, 392, 1070
- Mauch et al. (2003) Mauch T., Murphy T., Buttery H. J., Curran J., Hunstead R. W., Piestrzynski B., Robertson J. G., Sadler E. M., 2003, MNRAS, 342, 1117
- McGlynn et al. (2004) McGlynn T. A. et al., 2004, ApJ, 616, 1284
- McGilchrist et al. (1990) McGilchrist M. M., Baldwin J. E., Riley J. M., Titterington D. J., Waldram E. M., Warner P. J., 1990, MNRAS, 246, 110
- Miller et al. (2005) Miller Christopher J. et al., 2005, AJ, 130, 968
- Miley et al. (1972) Miley G. K., Perola G. C., van der Kruit P. C., van der Laan H., 1972, Nature, 237, 269
- Mauch & Sadler (2007) Mauch T., Sadler E. M., 2007, MNRAS, 375, 931
- O’Dea & Owen (1985) O’Dea C.P., Owen F.N., 1985, AJ, 90, 927
- O’Dea & Owen (1986) O’Dea C.P., Owen F.N., 1986, AJ, 300, 841
- O’Donghue, Owen & Eilek (1990) O’Donghue A. A., Owen F., Eilek J.A., 1990, ApJS, 72, 75
- O’Donoghue et al. (1993) O’Donoghue A. A., Eilek J. A., Owen F. N., 1993, ApJ, 408, 428
- Owen & Rudnick (1976) Owen F. N., Rudnick L, 1976, ApJL, 205, L1
- Owen, Burns and Rudnick (1979) Owen F., Burns J., and Rudnick L., 1979, Ap. J. (Letters), 226, LI 19
- Patra et al. (2019) Patra D., Pal S., Konar C., Chakrabarti S. K., 2019, Astrophysics and Space Science, 72, 45
- Piffaretti et al. (2011) Piffaretti R., Arnaud M., Pratt G. W., Pointecouteau E., Melin J. B., 2011, A&A, 534, 109
- Piffaretti et al. (1998) Pinkney J., Burns J. O., Rhee G., Hill J. M., 1998, AJ, 108, 2031
- Pinkney et al. (1992) Pinkney J., Burns J. O., Rhee G., Hill J. M., 1992, BAAS, 24, 193
- Pilkington & Scott (1965) Pilkington J. D. H., Scott J. F., 1965, MNRAS, 69, 183
- Proctor (2016) Proctor D. D., 2016, ApJS, 224, 18
- Quintana & Lawrie (1982) Quintana H., Lawrie D. G., 1982, AJ, 87, 1
- Randall et al. (2012) Randall K. E., Hopkins A. M., Norris R. P., Zinn P. -C., Middelberg E., Mao M. Y., Sharp R. G., 2012, MNRAS, 421, 1644R
- Rozo et al. (2015) Rozo E., Rykoff E. S., Becker M., Reddick R. M., Wechsler R. H., 2015, MNRAS, 453, 38
- Sakelliou & Merrifield (2000) Sakelliou I., Merrifield M. R. 2000, MNRAS, 311, 649
- Sebastian et al. (2017) Sebastian B. , Lal, D. V., Rao. A., 2017, AJ, 154, 169
- Skrutskie et al. (2006) Skrutskie M. F. et al., 2006, AJ, 131, 1163
- Smith et al. (2012) Smith Anthony G., Hopkins Andrew M., Hunstead Richard W., Pimbblet Kevin A., 2012, MNRAS, 422, 25
- Smolcic et al. (2007) Smolcic V. et al. 2007, ApJS, 172, 295
- Stocke (1977) Stocke J. 1977, Ph.D. dissertation, University of Arizona, unpublished
- Swarup (1991) Swarup G. et al., 1991, Current Science, 60, 95.
- Vallee, Bridle & Wilson (1981) Vallee J. P., Bridle A. H., Wilson A. S., 1981, Astrophys. J., 250, 66
- van Velzen et al. (2015) Van Velzen S., Falcke H., Körding E., 2015, MNRAS, 446, 2985
- Vessey & Green (1998) Vessey S. J., Green D. A., 1998, MNRAS, 294, 607
- Waldram et al. (1996) Waldram E. M., Yates J. A., Riley J. M., Warner P. J., 1996, MNRAS, 282, 779
- Wen at al. (2012) Wen Z. L., Han J. L., Liu F. S., 2012, ApJS, 199, 34
- Wen et al. (2015) Wen Z. L., Han J. L., 2015, ApJ, 807, 178
- White et al. (1999) White R.A., Bliton M., Bhavsar S.P., Bornmann P., Burns J.O., Ledlow M.J., Loken C., 1999, AJ, 118, 2014
- Wing & Blanton (2011) Wing J. D., Blanton E. I., 2011, AJ, 141, 88
- Xu, O’Dea & Biretta (1999) Xu C., O’dea C. P., Biretta J. A., 1999, AJ, 117, 2026
- Yoon et al. (2008) Yoon Joo H., Schawinski Kevin., Sheen Yun-Kyeong., Ree Chang H., Yi Sukyoung K., 2008, ApJS, 176, 414 XXX
- Zwicky et al. (1961) Zwicky F., Herzog E., Wild P., Karpowicz M., Kowal C. T., 1961, Pasadena: California Institute of Technology (CIT)