Bi kagome sublattice distortions by quenching and flux pinning in superconducting RbBi2
Abstract
The properties of RbBi2, a 4.15 K superconductor, were investigated using magnetic field, pressure and neutron diffraction. Under hydrostatic pressure, an almost 50 % reduction of Tc is observed, linked to a low Debye temperature estimated at 165 K. The resistivity and magnetic susceptibility were measured on quenched and slow-cooled polycrystalline samples. The resistivity follows a low temperature power-law dependence in both types of samples, while the diamagnetic susceptibility, , is dependent on the sample cooling history. Slow-cooled samples have a while quenched samples have due to grain size differences. Evidence of the effects of the cooling rate is also discerned from the local structure, obtained by neutron diffraction and the pair density function analysis. Slow-cooled samples have structurally symmetric Bi hexagons, in contrast to quenched samples in which disorder is manifested in periodic distortions of the Bi hexagonal rings of the kagome sublattice. Disorder may lead to flux pinning that reduces vortex mobility, but Tc remains unaffected by the cooling rate.
I Introduction
Superconductivity, a state characterized by zero electrical resistance, has been observed in many classes of materials, from simple metals, amorphous and granular systems to complex ladder structures London (1954); Bardeen et al. (1957); Waldram (1996); Tinkham (2004); De Gennes (2018); Ginzburg and Landau (2009); Collver and Hammond (1973); Deutscher et al. (1974); Takahashi et al. (2008); Dagotto et al. (1992); Dagotto and Rice (1996); Dagotto (1999), and has been the subject of intense debate for over a century. Bismuth (Bi) based superconductors attracted a lot of attention in the last decade or so in part because of the possible interplay of topology and superconductivity. Bi exhibits strong spin-orbit (SO) coupling linked to topologically nontrivial band structures in its compounds. In topological materials, the quantum state is entangled to an extent where its emergent quasiparticles exhibit exotic behaviors that are unique, and cannot be reproduced in conventional solids. These exotic properties are topologically protected as they are robust against symmetry-preserving perturbations. Several binary Bi compounds are currently under investigation for topological superconductivity. Some of the known bismuth-alkali and alkaline-earth metal intermetallic compounds studied for superconductivity are LiBi, NaBi, KBi2 Reynolds and Lane (1950); Sun et al. (2016), CsBi2 Roberts (1976), Ca11Bi10-x Sturza et al. (2014), CaBi2 Merlo and Fornasini (1994); Dong and Fan (2015), CaBi3, SrBi3 Matthias and Hulm (1952), BaBi3 Matthias and Hulm (1952) and Ba2Bi3 Iyo et al. (2014). Among these, KBi2 and CaBi2 are reported to show type-I superconductivity. While the topological nature of their superconductivity has not yet been confirmed, it is important to explore their materials properties. In this work, we report on the transport, magnetization and structural properties of RbBi2 alkali bismuth superconductor.
Although discovered decades ago, little is known of the properties of RbBi2, which is isostructural to KBi2 Sun et al. (2016) with a superconducting transition temperature, Tc, of 4.15 K. The resistivity is linear at high temperatures but follows a power law temperature dependence Chan et al. (2014); McKenzie et al. (1998) upon cooling below 25 K. Under pressure, strong suppression of Tc is observed that is not typical of metals. By varying the sample cooling rate, we examined the diamagnetic susceptibility response which shows perfect diamagnetism in samples with slow cooling rates. Quenching leads to a . Larger grain size is expected with slow cooling rates, that increases the magnetic susceptibility because grain boundaries are reduced. The effects of quenching can also be seen in the atomic structure. Local distortions are observed in the Bi kagome rings of fast-cooled samples where the Bi-Bi bond lengths are no longer equivalent. By comparison, kagome rings of slow cooled samples are symmetric. Other systems can be found in the literature where varying the cooling rate can affect their superconducting and structural properties. For instance, the effects of annealing were previously studied in the FeTe1-xSex Louca et al. (2011) superconductor. In this system, the suppression of Tc was linked to changes in the chalcogen ion’s z - parameter although the diamagnetic response remained the same. In the current system, although Tc does not change, the diamagnetic response does.
II Materials and Methods
The RbBi2 ingots were prepared by solid state reaction, by mixing Rubidium pieces (Alfa Aesar, 99.5%) and Bismuth powder (Alfa Aesar, 99.99%) in a 1:2 molar ratio in an Argon filled glovebox. The quartz ampule with the combined mixture was vacuum sealed without exposure to air. The samples were heated at 700°C for 24 hours. Two batches of samples were synthesized, one that was slowly cooled down (furnace-cooled) to room temperature and the other quenched from 700°C in liquid N2 to room temperature. The samples are denoted as AG (as-grown) and Q (quenched), respectively. The air sensitive samples were stored in a glovebox to avoid decomposition. The PPMS resistivity puck and samples for susceptibility measurements were prepared inside the glovebox and carefully transferred to the sealed chamber without exposure to air. Samples for the neutron diffraction measurements were loaded in the Vanadium can inside a glovebox sealed with He exchange gas. Electrical transport and magnetization measurements were performed as a function of magnetic field. High pressure resistivity measurements were also carried out at pressures ranging from 0 to 12 kbar. The time-of-flight (TOF) neutron diffraction experiment was carried out at the Nanoscale Ordered Materials Diffractometer (NOMAD) at the Spallation Neutron Source (SNS) of Oak Ridge National Laboratory (ORNL). The data were analyzed using the Rietveld refinement that yields the basic structural parameters for the periodic structure Toby (2001) and the pair distribution function (PDF) analysis technique that provides information on the local arrangement of atoms without the assumption of periodicity. The PDF analysis was performed on the same neutron diffraction data used for the Rietveld refinement. NOMAD is a diffractometer with a large bandwidth of momentum transfers, , and provides the total structure function . The was Fourier transformed into real-space as shown in Eqn. 1 to obtain the Warren (1990); Peterson et al. (2000). The instrument background and empty sample can were subtracted from the and the data were normalized by vanadium. A maximum of 40 Å-1 was used. The corresponds to the probability of finding a particular pair of atoms with an inter-atomic distance Egami and Billinge (2003).
| (1) |
The Debye temperature, , was extracted from fitting the width of the PDF peaks assuming a correlated Debye model Athauda et al. (2015); Beni and Platzman (1976); Jeong et al. (2003). Using eqn. 2, the full width half maximum (FWHM), , is extracted from the first PDF peak in RbBi2 corresponding to the Bi-Bi nearest neighbour correlation. Here the Debye wavevector is given by where is the number density of the crystal; the Debye cutoff frequency , where is the Boltzmann constant; and where x is a dimensionless integration variable.
| (2) |
III Results and Discussion
III.1 Structural analysis
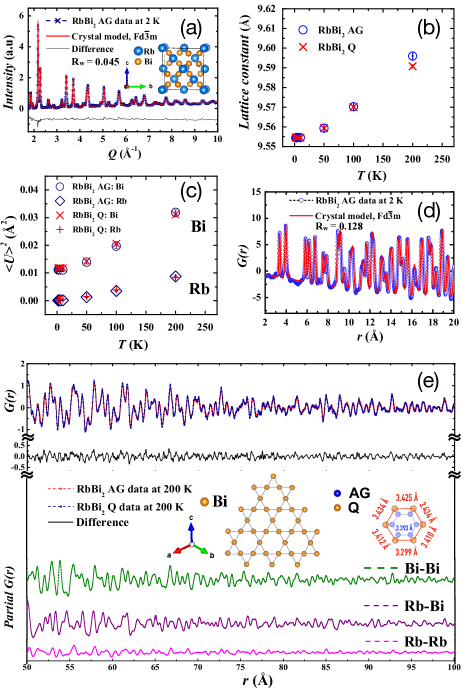
ABi2 is isostructural to the cubic MgCu2 Laves phase, with space group symmetry. The crystal structure is shown in the inset of Fig. 1(a) where each unit cell consists of 8 Rb atoms and 16 Bi atoms. Four Bi atoms form a tetrahedron and the tetrahedra connect with each other by vertex-sharing to form a three-dimensional network. Meanwhile, the Rb atoms are arranged in a diamond sublattice which is intertwined with the network of Bi tetrahedra. The Bi sublattice forms a hyperkagome structure shown in the inset of Fig. 1(e). In Fig. 1(a) the for the AG sample obtained from the diffraction data collected at 2 K is plotted as a function of Q. The is compared to a model calculated based on the symmetry. The fitting yields an Rw = 0.045. Similarly, the diffraction pattern collected for the Q-sample yields an equally good fitting with the same symmetry. Within the resolution of the NOMAD instrument, almost no differences can be discerned in the Bragg structure between the AG and Q samples. In Figs. 1(b) and 1(c), the lattice constants ( = 9.586Å) and thermal factors obtained from the Rietveld refinement are plotted as a function of temperature for both the AG and Q samples. The lattice constant increases with increasing temperature, as expected. Note that while both samples show the same temperature dependence in their lattice constants and thermal factors, the displacement for Bi is significantly larger than the one for Rb, signifying larger thermal fluctuations at the Bi sites.
Shown in Fig. 1(d) is the corresponding to the local atomic structure for the AG sample at 2 K. It is obtained by Fourier transforming the of Fig. 1(a). Also shown in this figure is a comparison with a model calculated from the atomic coordinates and unit cell dimensions of the periodic cubic cell with the symmetry. It can clearly be seen that up to 20 Å, the cubic model fits the local atomic structure quite well and the agreement between the model and experiment is excellent. In this range, no differences can be detected between the atomic structures of the AG and Q samples either. However, when extending the beyond 20 Å, small differences become discernible between Q and AG, indicating that the structural changes manifested with quenching are becoming apparent above 20 Å. Furthermore, the differences become more apparent at elevated temperatures.
Fig. 1(e) is a plot of the ’s corresponding to the local atomic structures for Q and AG samples at 200 K in the 50 - 100 Å range. The difference curve is shown below the data. Although the two samples are quite similar on average, small differences are detected in the ’s up to 100 Å. A similar difference curve is observed from 20 to 50 Å. What is the origin of these differences between the two samples? Shown in Fig. 1(e) are the calculated partial functions obtained from the model used to fit the AG data at 200 K. The most significant contribution in the arises from Bi correlations. While the Rb-Rb correlations are significantly reduced above 50 Å, the Bi correlations are much stronger and contribute the most to the G(r) function. Thus the differences in the local structure observed between the AG and Q samples are primarily from the Bi kagome lattice. Shown in the inset of Fig. 1(e) is a comparison of the Bi hexagon obtained from the real-space refinement of the AG and Q data at 200 K. We find that in the AG sample, the hexagon is symmetric with equal bond lengths (blue inner hexagon), while in the Q sample, the Bi hexagon is not symmetric and all bond lengths are slightly different (red outer hexagon). This is shown in the figure although not drawn to scale. Thus the quenching process results in a periodic distortion of the Bi-sublattice.
III.2 Transport Characterization
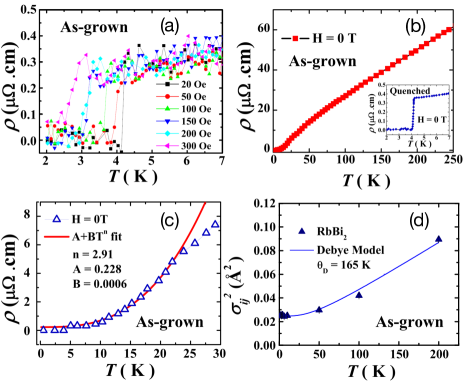
The results from the transport measurements under magnetic field and temperature on the AG RbBi2 samples are summarized in Fig. 2. Shown in Fig. 2(a) is the electrical resistivity as a function of temperature under an applied magnetic field for the AG RbBi2 confirming the superconducting nature of the ground state. The superconducting transition is sharp with the transition width 0.41 K at a of 4.12 K. The superconducting transition shifts to lower temperatures in the presence of larger applied magnetic fields below the critical field. Shown in Fig. 2(b) is the resistivity as a function of temperature in the absence of applied field. At zero field, RbBi2 exhibits very good metallic conductivity even at room temperature. The resistivity follows a linear temperature dependence until about 25 K, below which the temperature dependence becomes nearly cubic as it approaches the superconducting transition. The linear-in-temperature dependence of the resistivity upon warming is dominated by electron-phonon scattering which yields . At low temperatures, the resistivity follows a power law temperature dependence. The power law fitting on resistivity data below 25 K is shown in Fig. 2(c) with . Similar behavior has been seen in metals such as Pb in which electron-phonon scattering dominates above ( 7.2 K) Eiling and Schilling (1981). The same transport measurements were carried out for the Q RbBi2 with the same results.
III.3 Magnetization Characterization
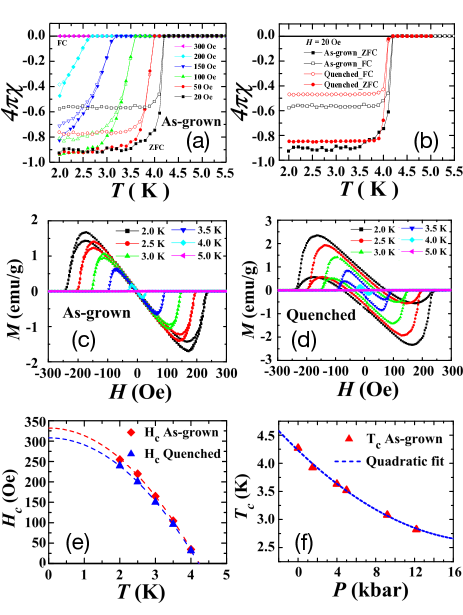
The results from the magnetic characterization are summarized in Fig. 3 for the AG and Q samples of RbBi2. The low temperature DC magnetic susceptibility measurements exhibit diamagnetic signals with sharp transitions appearing at = 4.15 K ( = 0.30 K) seen in both zero field cooled (ZFC) and field cooled (FC) curves (Fig. 3(a)). The superconducting transition temperature at 20 Oe is in agreement with that obtained from the transport measurement, confirming the superconducting ground state of RbBi2 below . In the AG sample, 95 % shielding fraction is observed and a Meissner fraction of 60 % is determined upon FC for fields that are well below (Fig. 3(b)). In the Q sample, the shielding fraction is 85 % and the Meissner fraction is 45 %. This reflects the presence of more pinning centers that trap magnetic flux lines and are not fully expelled when the sample becomes superconducting. With increasing the magnetic field, the superconducting transition gradually shifts to lower temperatures and the transition width becomes wider. The magnetization () as a function of applied magnetic field, , was measured at various temperatures and was used to estimate the value of the critical field . While the superconducting behavior and transition temperature remain the same in both the AG and Q samples of RbBi2, AG RbBi2 shows a full superconducting volume fraction with a sharp hysteresis in M(H) (Fig. 3(a),(c)) as opposed to Q RbBi2 which shows a partial volume fraction and a wide hysteresis(Fig. 3(b),(d)).
The magnetic characterization results identify RbBi2 to be a type-I superconductor with critical field = 332 Oe as shown in Fig. 4(e). The critical field for the Q sample was determined to be = 308 Oe. For comparison, superconductivity in KBi2 single crystals was recently studied and reported to be a Type-I Bardeen–Cooper–Schrieffer (BCS) superconductor in the dirty limit based on the behavior of magnetization isotherms and the low value of the Ginzburg-Landau (GL) parameter Sun et al. (2016). Lastly, shown in Fig. 3(f) is the pressure dependence of the superconducting transition temperature. falls off quadratically with hydrostatic pressure. By 12 kBar, drops by nearly 50 %. Typically, in metals the percentage change in in a similar pressure range is small (examples include In and Pb) Seiden (1969). Exceptions include Zn and Cd where a nearly 50 drop in has been reported Seiden (1969). Pressure affects the lattice parameter, Debye temperature and phonon frequencies and where is the electron-phonon coupling constant Seiden (1969). The large response to pressure is consistent with the low Debye temperature (165 K) which renders the lattice very soft. The Debye temperature was determined from the width of the first PDF peak using a correlated Debye model, shown in Fig. 2(d). The electron-phonon coupling constant, , was estimated to be 0.734 using McMillan’s theory. A non-linear pressure dependence of may be due to a change of the Fermi surface topology, from a closed to an open surface. Such a transition causes a change of the density of states as well as the superconducting gap Makarov and Bar’yakhtar (1965); Lifshitz (1960). Although does not change between the AG and Q samples, the superconducting volume fraction and M(H) curves show differences between the two. Slow cooling rates (AG) provide for a full shielding fraction with perfect diamagnetism which is the ideal limit. Fast cooling rates (Q) provide for a reduced shielding fraction. The kagome lattice distortions described above may be linked to the different diamagnetic susceptibility behaviors observed between the two samples.
IV Conclusion
RbBi2 is a type-I superconductor with peculiar characteristics. Two RbBi2 samples were studied, AG and Q, to investigate the effects of structural distortions, electrical resistivity and pressure dependence on . The critical temperature is 4.15 K. The magnetic and transport properties characterized under field indicate that RbBi2 is an extremely good metal above . The diamagnetic susceptibility for the Q sample does not reach -1 while it does for the AG that may be due to the quenched disorder that breaks the symmetry of the Bi hexagon, creating flux pinning centers and possibly due to differences in grain boundaries. The Q sample has a much broader magnetic hysteresis loop which can be interpreted in terms of the presence of an increase in pinning centers. The neutron diffraction experiments were carried out on Q and AG samples at temperatures above and below the superconducting transition. In the AG sample, the Bi hexagon is undistorted, while in the Q sample, small Bi displacements lead to a distorted Bi hexagon ring. In this, the Bi-Bi bond lengths are not equivalent and distortions of the Bi-rings are spread out in real space. This may be linked to flux pinning and thus one of the reasons for reduced diamagnetism observed in the Q sample.
V Acknowledgements
This work has been supported by the Department of Energy (DOE), Grant number DE-FG02-01ER45927. A portion of this research used resources at the Spallation Neutron Source, a DOE Office of Science User Facility operated by Oak Ridge National Laboratory. Work at Los Alamos National Laboratory was performed under the auspices of the U.S. Department of Energy, Office of Basic Energy Sciences, Division of Materials Science and Engineering.
References
- London (1954) F. London, Superfluids (Wiley, 1954).
- Bardeen et al. (1957) J. Bardeen, L. N. Cooper, and J. R. Schrieffer, Physical Review 108, 1175 (1957).
- Waldram (1996) J. R. Waldram, Superconductivity of metals and cuprates (CRC Press, 1996).
- Tinkham (2004) M. Tinkham, Introduction to superconductivity (Courier Corporation, 2004).
- De Gennes (2018) P.-G. De Gennes, Superconductivity of metals and alloys (CRC Press, 2018).
- Ginzburg and Landau (2009) V. L. Ginzburg and L. D. Landau, in On Superconductivity and Superfluidity (Springer, 2009) pp. 113–137.
- Collver and Hammond (1973) M. Collver and R. Hammond, Physical Review Letters 30, 92 (1973).
- Deutscher et al. (1974) G. Deutscher, Y. Imry, and L. Gunther, Physical Review B 10, 4598 (1974).
- Takahashi et al. (2008) H. Takahashi, K. Igawa, K. Arii, Y. Kamihara, M. Hirano, and H. Hosono, Nature 453, 376 (2008).
- Dagotto et al. (1992) E. Dagotto, J. Riera, and D. Scalapino, Physical Review B 45, 5744 (1992).
- Dagotto and Rice (1996) E. Dagotto and T. Rice, Science 271, 618 (1996).
- Dagotto (1999) E. Dagotto, Reports on Progress in Physics 62, 1525 (1999).
- Reynolds and Lane (1950) J. M. Reynolds and C. Lane, Physical Review 79, 405 (1950).
- Sun et al. (2016) S. Sun, K. Liu, and H. Lei, Journal of Physics: Condensed Matter 28, 085701 (2016).
- Roberts (1976) B. W. Roberts, Journal of Physical and Chemical Reference Data 5, 581 (1976).
- Sturza et al. (2014) M. Sturza, F. Han, C. D. Malliakas, D. Y. Chung, H. Claus, and M. G. Kanatzidis, Physical Review B 89, 054512 (2014).
- Merlo and Fornasini (1994) F. Merlo and M. Fornasini, Materials research bulletin 29, 149 (1994).
- Dong and Fan (2015) X. Dong and C. Fan, Scientific Reports 5, 9326 (2015).
- Matthias and Hulm (1952) B. Matthias and J. Hulm, Physical Review 87, 799 (1952).
- Iyo et al. (2014) A. Iyo, Y. Yanagi, S. Ishida, K. Oka, Y. Yoshida, K. Kihou, C. Lee, H. Kito, N. Takeshita, I. Hase, et al., Superconductor Science and Technology 27, 072001 (2014).
- Chan et al. (2014) M. Chan, M. Veit, C. Dorow, Y. Ge, Y. Li, W. Tabis, Y. Tang, X. Zhao, N. Barišić, and M. Greven, Physical review letters 113, 177005 (2014).
- McKenzie et al. (1998) R. H. McKenzie, J. Qualls, S. Han, and J. Brooks, Physical Review B 57, 11854 (1998).
- Louca et al. (2011) D. Louca, J. Yan, A. Llobet, and R. Arita, Physical Review B 84, 054522 (2011).
- Toby (2001) B. H. Toby, Journal of applied crystallography 34, 210 (2001).
- Warren (1990) B. E. Warren, X-ray Diffraction (Courier Corporation, 1990).
- Peterson et al. (2000) P. Peterson, M. Gutmann, T. Proffen, and S. Billinge, Journal of Applied Crystallography 33, 1192 (2000).
- Egami and Billinge (2003) T. Egami and S. J. Billinge, Underneath the Bragg peaks: structural analysis of complex materials (Elsevier, 2003).
- Athauda et al. (2015) A. Athauda, J. Yang, B. Li, Y. Mizuguchi, S. Lee, and D. Louca, Journal of Superconductivity and Novel Magnetism 28, 1255 (2015).
- Beni and Platzman (1976) G. Beni and P. Platzman, Physical Review B 14, 1514 (1976).
- Jeong et al. (2003) I.-K. Jeong, R. Heffner, M. Graf, and S. Billinge, Physical Review B 67, 104301 (2003).
- Eiling and Schilling (1981) A. Eiling and J. Schilling, Journal of Physics F: Metal Physics 11, 623 (1981).
- Seiden (1969) P. Seiden, Physical Review 179, 458 (1969).
- Makarov and Bar’yakhtar (1965) V. Makarov and V. Bar’yakhtar, Sov. Phys. JETP 21, 1151 (1965).
- Lifshitz (1960) I. Lifshitz, Zh. Eksp. Teor. Fiz. 38, 1569 (1960).