Zero-CPU Collection with Direct Telemetry Access
Abstract.
Programmable switches are driving a massive increase in fine-grained measurements. This puts significant pressure on telemetry collectors that have to process reports from many switches. Past research acknowledged this problem by either improving collectors’ stack performance or by limiting the amount of data sent from switches. In this paper, we take a different and radical approach: switches are responsible for directly inserting queryable telemetry data into the collectors’ memory, bypassing their CPU, and thereby improving their collection scalability. We propose to use a method we call direct telemetry access, where switches jointly write telemetry reports directly into the same collector’s memory region, without coordination. Our solution, DART, is probabilistic, trading memory redundancy and query success probability for CPU resources at collectors. We prototype DART using commodity hardware such as P4 switches and RDMA NICs and show that we get high query success rates with a reasonable memory overhead. For example, we can collect INT path tracing information on a fat tree topology without a collector’s CPU involvement while achieving 99.9% query success probability and using just 300 bytes per flow.
1. Introduction
Network telemetry is an integral function in modern data centers (Ben Basat et al., 2020; Huang et al., 2020; Intel, [n. d.]c; Khandelwal et al., 2019; Kim et al., 2015; Van Tu et al., 2017; Yu, 2019; Zhou et al., 2020a, b). This is fostered by the rise of programmable switches (BROADCOM, [n. d.]; Intel, [n. d.]b; NVIDIA, [n. d.]) that allows monitoring of network traffic in real time at high granularities. Such granular telemetry is essential both for advanced network operations (Li et al., 2019; Alizadeh et al., 2014; Heller et al., 2010) and troubleshooting (Guo et al., 2015; Intel, [n. d.]c; Tammana et al., 2018).
Telemetry systems are built around centralized collection of network-wide reports (Arista, [n. d.]; Cisco, [n. d.]; Huawei, [n. d.]; Intel, [n. d.]c; Networks, [n. d.]). However, the growing telemetry volume poses a new challenge: it is increasingly hard to build collectors that can process reports (i.e., telemetry data) from many switches (Khandelwal et al., 2019; Van Tu et al., 2018). For example, production datacenter networks can comprise hundreds of thousands of switches (Guo et al., 2015), each generating up to millions of reports per second (Zhou et al., 2020b), requiring thousands of CPU cores just for real-time data collection (§2). Existing research boosts collectors’ scalability by improving their network stacks (Khandelwal et al., 2019; Van Tu et al., 2018) or by preprocessing (Li et al., 2020) and filtering data at the switches (Intel, [n. d.]a; Kučera et al., 2020; Vestin et al., 2019; Zhou et al., 2020b). Our insight, however, is that the main bottleneck of collectors is their inability to quickly insert incoming reports in queryable data structures (§2).
To overcome this issue, we propose a method we call direct telemetry access where switches write their reports directly into a collector’s memory. Our solution, DART (Distributed Aggregation of Rich Telemetry), allows switches to jointly insert queryable telemetry data without any involvement of the collector’s CPU or inter-switch communication. DART uses RDMA (Remote Direct Memory Access) (Infiniband Trade Association, 2015), a technology available on many network cards (Intel, [n. d.]d; Technologies, [n. d.]; Xilinx, [n. d.]) that can perform hundreds of millions of memory writes per second (Technologies, [n. d.]), which is significantly faster than what even the most high-performing CPU-based telemetry collectors achieve (Khandelwal et al., 2019). Generating RDMA instructions directly from switches is possible (Kim et al., 2020), but it also raises several challenges when used for telemetry collection: (1) how to directly write in the collector memory in such a way that the data is then easily queryable? (2) how to optimize data organization inside the collector in the presence of hundreds of thousands concurrent telemetry reporters? (3) how to make the system robust to telemetry report losses while keeping limited statefulness at switches? To address these challenges, we designed a solution where switches decide the location in collectors’ memory to write the reports. This is achieved using global hash functions that create a stateless mapping between the information to be reported (i.e., telemetry keys and data), and the memory addresses at collectors. Such a mapping allows collectors to determine where the information relevant to a query is stored as the same address mapping can be used to retrieve data. However, different switches might write to the same memory location, thus potentially deleting useful telemetry data. To overcome this, DART switches write the same report to multiple memory addresses. This trades the amount of memory needed and the query success rate for CPU resources at collectors (which are limited by the slowdown of Moore’s law (Esmaeilzadeh et al., 2011; Hardavellas, 2012)). These combined techniques manage to deliver both coordination-free collection, and collision robustness.
We discuss DART’s design (§3), provide a theoretical analysis (§4), and confirm the efficiency with simulations (§5) where we use INT path tracing carried on a 5-hop fat-tree topology as an example. Here, DART requires as little as 300 bytes per flow to achieve a 99.9% success probability. We show that DART is efficiently implementable in commodity P4 switches (§6), and discuss future directions (§7).
Our main contributions are:
-
•
We make the case for adopting a solution that does not use CPU at collectors to handle incoming telemetry data (§2).
-
•
We propose a method called direct telemetry access that allows switches to jointly insert queryable telemetry data into collectors’ memory (§3).
-
•
We set the basis for direct telemetry access theory demonstrating how it is possible to have provable query success rate given collector’s memory availability (§4).
-
•
We demonstrate the feasibility of our approach using state-of-the-art programmable switches (§6).
2. Motivation
Collectors play an important role in network telemetry systems: they receive telemetry reports and store the information in internal data structures to answer network-wide queries. One key challenge is to ensure that this process is scalable as a datacenter network can comprise hundreds of thousands of switches (Guo et al., 2015), some potentially handling up to millions of traffic flows (Roy et al., 2015). For example, a non-sampled INT telemetry system requires the collection of telemetry data from every single packet, which would result in an excessive amount of reports. Because of this, event detection is typically implemented at switches in an effort to send reports to a collector only when things change (Intel, [n. d.]a). This helps in reducing the rate of switch-to-collector communication down to a few million telemetry reports per second per switch (Zhou et al., 2020b). Still, telemetry collection costs are high, and the main reason we identified is that the collectors’ CPU is the main bottleneck.
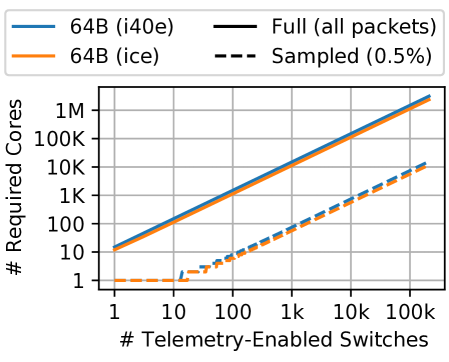
CPU-based packet I/O is too slow. Figure 1(a) shows the number of CPU cores required by a collector when using the DPDK PMD (Poll Mode Driver), a state-of-the-art kernel bypass approach, to just receive telemetry report packets at 64 and 128 bytes including the headers111We assume that reports are not batched together into fewer packets for reduced I/O overhead. However, this would not remove the cost of processing the reports and inserting them into storage, which is the most costly step. Even normal-sized data centers, comprising 10K switches, would require a collection cluster containing thousands of CPU cores dedicated to simple packet I/O. However, further processing is then essential to ensure telemetry data insertion into queryable storage.
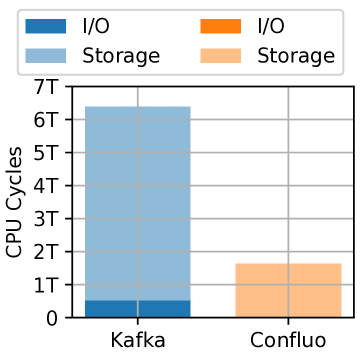
CPU-based telemetry storage is slower. Figure 1(b) shows the number of CPU cycles required for packet I/O and insertion of telemetry reports into storage. We used two state-of-the-art solutions to store the contents of telemetry reports: Apache Kafka (Garg, 2013) with socket-based packet I/O, and Confluo (Khandelwal et al., 2019) with DPDK-based packet I/O. We uniformly generate two different report types that are 64 and 128 bytes222A 64 or 128 bytes report would consist of 36 bytes and 100 bytes of report data (without 28 bytes of header). For instance, a 64 bytes packet could answer one INT query, storing 32-bits per hop across 9 hops in the network.. Socket-based packet I/O is inefficient, requiring 504 billion CPU cycles for processing 100 million reports, with 11.5x as many additional cycles required by Kafka. CPU overhead from packet I/O is significantly reduced by the DPDK PMD, which requires only 14 billion CPU cycles for the same number of reports (i.e. as much work as sockets). However, as visualized in Figure 1(a), this is still very expensive at large scales. The actual insertion of the telemetry data into queryable storage through Confluo requires an astounding 114x as many CPU cycles as the costly packet I/O.
Direct telemetry access to the rescue. To eliminate the processing bottleneck at collectors, we designed a solution where switches are responsible for directly inserting queryable telemetry data into logically centralized memory. We show how this can be achieved using commodity hardware such as P4 programmable switches and RDMA NICs. Current RDMA-capable network cards are capable of processing more than 200 million messages per second (Technologies, [n. d.]), which is significantly faster than CPU-based telemetry collectors (Khandelwal et al., 2019). Our solution is not restricted to the RDMA protocol, and we discuss in Section 7 how smartNICs can be leveraged to build a new protocol tailored to direct telemetry access for significant optimizations.
3. Design
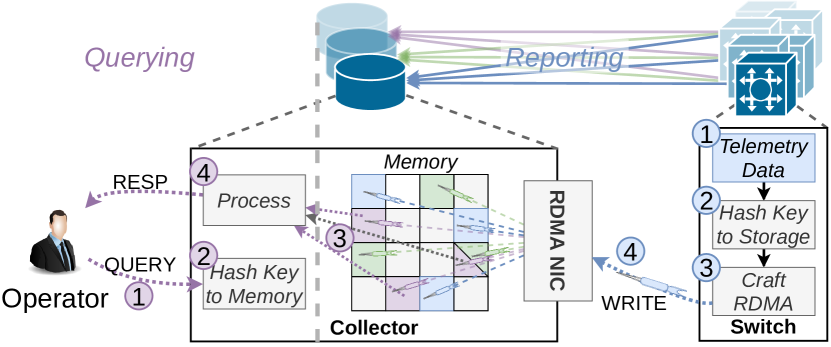
In DART, switches insert telemetry data directly into the collectors’ memory at a specific address using RDMA calls. In Figure 2, we show the architectural overview of DART, constituting two main components: telemetry reporting (§3.1), shown on the right side of the figure, and querying (§3.2), shown on the left side. The former is the process of pushing the network state and measurements from switches directly into collectors’ memory, organized as a key-value store. The latter refers to the operator’s ability to run key-based queries against the stored telemetry data. Both of these functions are delivered without requiring any coordination or communication between individual switches or end-hosts, further reducing the overall telemetry overhead and complexity.
DART assumes the telemetry data is readily available at switches, and thus it does not place any specific restriction on the underlying measurement framework, as shown in Table 1. Because of this, the key-value store semantics may depend on the specific telemetry techniques used at switches. For example, for INT (Group, [n. d.]), each switch writes its telemetry data into packets and only the last hop pushes the information to the collector. Here, the key will be the ¡Flow 5-tuple¿. In contrast, when DART is used with INT working in postcard mode, where each switch reports data, the key will be the concatenation of ¡Flow 5-tuple¿ and the ¡switchID¿.
3.1. Reporting
One might be tempted to design collision-free key-to-address mappings using on-switch memory, combined with dedicated per-switch regions in the centralized telemetry storage. We believe this approach is unfeasible due to the switches’ limited memory, unable to store the high number of new telemetry keys constantly appearing across the entire network, as old keys become irrelevant. Indeed, there is no support for dynamic memory allocations, which has led the community to adopt probabilistic data structures to approximate per-key statefulness in switches (Basat et al., 2020a, b; Liu et al., 2016). Second, keeping dedicated per-switch regions in the collector’s memory leads to inefficiencies due to uneven switch telemetry data generation rates. Further, operators need to know which switch wrote the telemetry data for it to be efficiently queryable.
DART uses global hash functions to create a stateless mapping between telemetry keys and memory addresses at one or more logically centralized collectors where the data should be written. The same mapping can be calculated by the operator for retrieving the results of a query. However, using stateless mapping raises an important issue – different keys can hash into the same memory address, resulting in overwritten telemetry data due to these collisions. To address this challenge, DART uses independent hash functions to map each key into different storage locations, where duplicate entries of the corresponding telemetry data are stored.
|
Key(s) | Data | |||||
|
|
|
|||||
|
|
|
|||||
|
QueryID | Query answer | |||||
|
various | Analysis output | |||||
| Flow anomalies (Zhou et al., 2020b) |
|
Time, event-specific | |||||
| Network failures (Guo et al., 2015) | Failure ID, location | Time, debug info |
Telemetry reports are sent from switches as one-sided RDMA-WRITE packets towards one of the collectors, with the chosen memory address in the RDMA header. Through hashing, switches determine the collector and memory location for copies of the telemetry report. Switches craft RDMA-based reports based on loaded lookup-table entries that map the selected collector to essential RDMA information. An RDMA-capable network card at the collector parses the RDMA report and writes the payload directly to memory, making it available for operator queries.
RDMA does not support writing a payload into several memory addresses at once, instead requiring several packets containing one memory instruction each. Currently, DART-enabled switches rely multiple redundant telemetry reports generated to fill all the slots allocated to a key. However, further research into SmartNIC-enabled RDMA extensions could remove this requirement (§7).
At the collector, to reduce the memory occupied, instead of storing the key, DART makes use of a small checksum of the key to simplify detection of overwritten data. While querying, values from the locations that do not match the attached checksum can be discarded. The impact of checksum collisions is discussed in sections 4 and 5.3.
Distributing the copies of per-key telemetry data across physical collectors could improve the system resiliency, at the cost of potentially reduced querying speed. In DART’s current design we ensure that data duplicates for any one key are held at a single collector, thereby enabling operator queries to be executed locally on the collector CPU without requiring inter-collector communications for data transfer.
3.2. Querying
Queries are performed in four main steps, as seen in the left side of Figure 2. First, an operator requests the results for a telemetry query, which it forwards to the relevant collector. DART hashes the query key to retrieve the collector ID, and then uses a lookup table to convert the collector ID into the collector which holds the telemetry data. DART then hashes the key into memory addresses at the collector which holds the relevant telemetry data and extracts this data. Finally, DART uses the key-checksum to discard the invalid telemetry data and returns the result of the query to the operator.
4. Theoretical Analysis
Because we treat the RDMA memory as a large key-value hash table where only checksums of keys are stored and values may be overwritten over time, we must consider the possibility that when we make a query, we are unable to return an answer, or we may return an incorrect answer. We call the case where we have no answer to return an empty return, and the case where we return an incorrect answer a return error. The probability of an empty return or a return error depends on the parameters of the system, and on the method we choose to determine the return value. Below we present some of the possible tradeoffs and some mathematical analysis; we leave further results and discussions for the full paper.
Let us first consider a simple example. When a write occurs for a key-value pair, in the hash table copies of the -bit key checksum and the value are stored at random locations. We assume the checksum is uniformly distributed for any given key throughout our analysis. When a read occurs, let us suppose we return a value if there is only a single value amongst the memory locations matching that checksum. (The value could occur multiple times, of course.)
An empty return can occur, for example, if when we search the locations for a key, none of them have the right checksum. That is, all copies of the key have been overwritten, and none of the locations currently hold another key with the same checksum. To analyze this case, let us consider the following scenario. Suppose that we have memory cells total, and that there are updates of distinct keys between when our query key was last written, and when we are making a query for its values. We can use the Poisson approximation for the binomial (as is standard in these types of analyses and accurate for even reasonably large , , ; see, for example, (Broder and Mitzenmacher, 2004; Mitzenmacher and Upfal, 2017)). Using such approximations, the probability that any one of the locations is overwritten is given by , and that all of them are overwritten is . The probability that all of them are overwritten and the key checksum is not found is approximated by
We would also get an empty return if the cells contained two or more distinct values with the same correct checksum.
This probability is lower bounded by
and upper bounded by
The first summation is the probability at least one of the original locations is not overwritten, but at least one overwritten location gets the same checksum. (We pessimistically assume it obtains a different value.) The second expression adds a term for when all original values are overwritten and two or more obtain the same checksum. Note that we need to give bounds as values in overwritten locations may or may not be the same.
We could have a return error if all copies of the original key are overwritten and one or more of those cells are overwritten with the same checksum and same (incorrect) value. This probability is lower bounded by
which is the probability that all of the original locations are overwritten and a single overwriting key obtains the checksum, and upper bounded by
the probability that the original locations are overwritten and at least one overwriting key obtains the checksum.
There are many ways to modify the configuration or return method to lower the empty returns and/or return errors, at the cost of more computation and/or more memory. The most natural is to simply use a larger checksum; we suggest 32 bits should be appropriate for many situations. However, we note that at “Internet scale” rare events will occur, even matching of 32-bit checksums, and so this should be considered when utilizing DART information. One can also use a “plurality vote” if more than one value appears for the queried checksum; additionally one can require that a checksum/value pair occur at least twice among the values before being returned. (Note that, for example, requiring consensus of two values can be decided on a per query basis without changing anything else; one can decide for specific queries whether to trade off empty returns and return errors this way.) Additional ideas from coding theory (Goodrich and Mitzenmacher, 2011; Lipton, 1994), including using different checksums for each location or XORing each value with a pseudorandom value, could also be applied. As a default, we suggest a 32-bit checksum and a “plurality vote.” We describe related results in our evaluation (§5).
5. Preliminary Evaluation
RDMA is well known to deliver high throughput memory operations, and this section focus on evaluating the DART algorithm and data structure.We show through in-depth simulations that DART is effective with little redundancy of (§5.1) and has a high query success rate of 99.9% at the collector (§5.2) with high accuracy (§5.3).
5.1. Effectiveness of DART Redundancy

The probabilistic nature of DART cannot guarantee queryability on a given reported key. We show in Figure 3 how the query success rate depends on the load factor (i.e., the total number of telemetry keys over available memory addresses), and the number of memory addresses that each key can write to. There is a clear efficiency improvement by having keys write to memory addresses when the storage load factor is in reasonable intervals. We also note how simulations adhere to the aforementioned theory in Section 4 regarding the impact of multiple addresses per key, and the background color in Figure 3 indicate which number of addresses per key () delivered the highest key queryability in each interval.
The RDMA standard requires multiple packets with a single write instruction each, with SmartNICs showing promise to circumvent this limitation (§7) by batching them together. Thus, a practical RDMA-based DART implementation might benefit from a reduction in , balancing network overheads against the marginal queryability improvements gained from the increased data redundancy. appears to be a generally good compromise, showing great queryability improvements over . We conclude that dynamically adjusting as the load fluctuates could improve queryability and efficiency, and leave finding a good mechanism as future work.
5.2. Data Queryability
The hash-based address selection in DART results in address collisions between keys, as they compete over limited allocated memory at various sizes of the DART data storage, resulting in old data being aged out of memory.
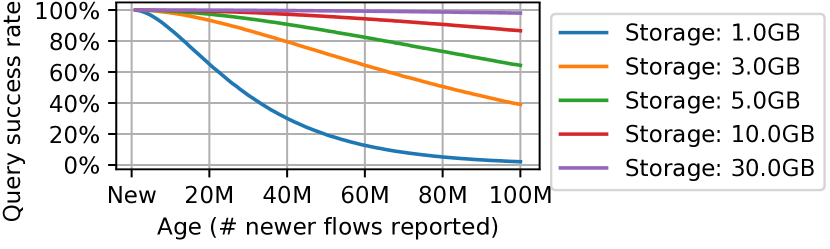
Figure 4 shows the queryability of reported INT path tracing data at various storage sizes and report ages. As expected, allocating enough collector memory is essential for ensuring a high data queryability, with smaller storage sizes resulting in a faster aging-out of data. For example, when 100 million flows share just 3GB (i.e., 30B storage per flow path), we see how the average queryability is across all 100 million flows; with a steep decline to for the oldest reports, which almost exactly matches the theoretically predicted from Section 4. However raising the storage capacity to 30GB significantly increases the average data queryability to across all 100 million flows; equivalent experiments with redundancy further improves the data queryability to . We also note how the number of tracked flow paths at a given probability increases linearly alongside the amount of allocated storage memory.
5.2.1. Practical Considerations
The ability to run queries on historical data, for example to troubleshoot a previous outage, is important. Writing directly to memory is essential for allowing line-rate report ingestion, but fails to scale to the sizes that would be needed for storing historical network-wide measurements. A solution can be to utilize DRAM for temporary epoch-based storage of telemetry data, combined with periodical transfer of data into a larger (and much slower) persistent storage where historical queries can be answered. We leave the design details as future work.
5.3. Query Answer Correctness
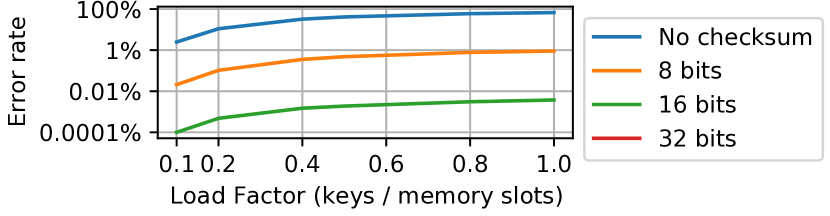
There is a theoretical risk of DART returning incorrect query results, as discussed in section 4. Figure 5 shows results after extensive tests, where multiple simulations of 100M keys have been performed at various storage sizes in an attempt to recreate the theoretically predicted incorrectness. These results clearly show the impact from having key-based checksums included in the DART data structure, with increased lengths greatly reducing the risk of errors. Our simulations with 32-bit key-checksums fail to reproduce return-error cases, due to their very low probability.
6. Prototype Implementation
We implemented the switch component of DART in around 1K lines of P4_16 (Bosshart et al., 2014), compiled through P4 Studio (Intel, [n. d.]e) for the Tofino ASIC (Intel, [n. d.]b), together with 150 lines of Python to handle the switch control plane. The implementation is oblivious to the specific monitoring technology. When telemetry data has to be reported, an I2E mirror is triggered, injecting a truncated packet clone into the egress pipeline. The packet carries the raw telemetry data together with the corresponding key, and is used as the base for crafting a DART report.
The Tofino-native random number generator calculates to determine which of the per-key storage locations to use during report generation. Then, the CRC extern maps (, key) into the corresponding collector ID and memory address. The global collector lookup table is a match-action table, and maps the collector ID to specific server information required for crafting RoCEv2 (Association, [n. d.]) headers. The RoCEv2 invariant-CRC (iCRC) checksum is generated by the native CRC extern. A register array is used to store per-collector RoCEv2 Packet Sequence Number (PSN) counters. Our prototype requires about 20 bytes of on-switch SRAM per-collector for storing metadata, allowing support for tens of thousands of collectors without impacting the pipeline complexity.
7. Discussion
Using standard RDMA calls. We explored the benefits of using just RDMA write calls. However, the RDMA protocol supports additional operations: Fetch & Add, and Compare & Swap. The former increments a value at a specified address by a given amount. The latter compares a value at a specified address with a given value: if they are equal, another specified value will be stored at the address. Both operations can enable more complex telemetry data structures, possibly improving on query richness and memory efficiency. For example, Fetch & Add can be used to implement flow-counters directly in collectors’ memory (saving resources at switches) or to perform network-wide aggregation of sketches. Compare & Swap can be used to create more complex storage methods. For example, for hashes and an initially empty table, we can use an RDMA write with one hash and Compare & Swap with another (writing to a second slot only if it is empty), which simulations show can potentially improve queryability.
Building new direct telemetry access protocols. An RDMA call is ultimately a DMA operation from the server’s NIC to its main memory. Programmable NICs can enable new RDMA primitives (Amaro et al., 2020; Sidler et al., 2020), even requiring multiple DMA calls per-packet (Amaro et al., 2020). Similarly, this can open new opportunities to rethink how direct telemetry access is implemented. For example, it would be possible to design a new primitive for inserting the same data into multiple memory addresses. This would significantly reduce the network overheads of our current system which is restricted by RDMA and thus allows only a single memory write per packet. Moreover, it could be possible to design a new key-value store that is more resilient to collisions, with the NIC preemptively managing overwrites in some manner.
8. Related Works
Telemetry. Traditional techniques have looked into periodically collecting telemetry data (Guo et al., 2015; Hare, 2011; Handigol et al., 2014). Even though these techniques generate coarse-grained data, they can be significant given the large scale of today’s networks. The rise in programmable switches has enabled fine-grained telemetry techniques that generate a lot more data (Tammana et al., 2018; Group, [n. d.]; Ben Basat et al., 2020; Zhou et al., 2020b; Zhu et al., 2015; Gupta et al., 2018). Irrespective of the techniques, collection is identified to be the main bottleneck in network-wide telemetry, and previous works focus on either optimizing the collector stack performance (Khandelwal et al., 2019; Van Tu et al., 2018), or reducing the load through offloaded pre-processing (Li et al., 2020) and in-network filtering (Intel, [n. d.]a; Kučera et al., 2020; Vestin et al., 2019; Zhou et al., 2020b). To our knowledge, all current collection solutions are CPU-based and thus have the same fundamental performance bottleneck. An alternative approach is letting end-hosts assist in network-wide telemetry (Tammana et al., 2018; Huang et al., 2020), which unfortunately requires significant investments and infrastructure changes.
Switch-generated RDMA calls
Recent work has shown that programmable switches can perform RDMA calls (Kim et al., 2020), and that programmable network cards are capable of expanding upon RDMA with new and customized primitives (Amaro et al., 2020).
Especially FPGA network cards show great promise for high-speed custom RDMA (Sidler et al., 2020; Mansour
et al., 2019).
Acknowledgments. We thank the anonymous reviewers. This work is sponsored in part by the UK EPSRC project EP/T007206/1 and NSF grants CNS-2107078, CCF-2101140, CCF-1563710, and DMS-2023528.
References
- (1)
- Alizadeh et al. (2014) Mohammad Alizadeh, Tom Edsall, Sarang Dharmapurikar, Ramanan Vaidyanathan, Kevin Chu, Andy Fingerhut, Vinh The Lam, Francis Matus, Rong Pan, Navindra Yadav, et al. 2014. CONGA: Distributed congestion-aware load balancing for datacenters. In Proceedings of the 2014 ACM conference on SIGCOMM. 503–514.
- Amaro et al. (2020) Emmanuel Amaro, Zhihong Luo, Amy Ousterhout, Arvind Krishnamurthy, Aurojit Panda, Sylvia Ratnasamy, and Scott Shenker. 2020. Remote Memory Calls. In Proceedings of the 19th ACM Workshop on Hot Topics in Networks. 38–44.
- Arista ([n. d.]) Arista. [n. d.]. Telemetry and Analytics. https://www.arista.com/en/solutions/telemetry-analytics. ([n. d.]). Accessed: 2021-06-24.
- Association ([n. d.]) Infiniband Trade Association. [n. d.]. RoCEv2. https://cw.infinibandta.org/document/dl/7781. ([n. d.]). Accessed: 2021-05-12.
- Basat et al. (2020b) Ran Ben Basat, Xiaoqi Chen, Gil Einziger, Shir Landau Feibish, Danny Raz, and Minlan Yu. 2020b. Routing Oblivious Measurement Analytics. In 2020 IFIP Networking Conference (Networking). IEEE, 449–457.
- Basat et al. (2020a) Ran Ben Basat, Xiaoqi Chen, Gil Einziger, and Ori Rottenstreich. 2020a. Designing heavy-hitter detection algorithms for programmable switches. IEEE/ACM Transactions on Networking 28, 3 (2020), 1172–1185.
- Ben Basat et al. (2020) Ran Ben Basat, Sivaramakrishnan Ramanathan, Yuliang Li, Gianni Antichi, Minian Yu, and Michael Mitzenmacher. 2020. PINT: probabilistic in-band network telemetry. In Proceedings of the Annual conference of the ACM Special Interest Group on Data Communication on the applications, technologies, architectures, and protocols for computer communication. 662–680.
- Bosshart et al. (2014) Pat Bosshart, Dan Daly, Glen Gibb, Martin Izzard, Nick McKeown, Jennifer Rexford, Cole Schlesinger, Dan Talayco, Amin Vahdat, George Varghese, et al. 2014. P4: Programming protocol-independent packet processors. ACM SIGCOMM Computer Communication Review 44, 3 (2014), 87–95.
- BROADCOM ([n. d.]) BROADCOM. [n. d.]. Trident Programmable Switch. https://www.broadcom.com/products/ethernet-connectivity/switching/strataxgs/bcm56870-series. ([n. d.]).
- Broder and Mitzenmacher (2004) Andrei Broder and Michael Mitzenmacher. 2004. Network applications of bloom filters: A survey. Internet mathematics 1, 4 (2004), 485–509.
- Cisco ([n. d.]) Cisco. [n. d.]. Explore Model-Driven Telemetry. https://blogs.cisco.com/developer/model-driven-telemetry-sandbox. ([n. d.]). Accessed: 2021-06-24.
- Esmaeilzadeh et al. (2011) Hadi Esmaeilzadeh, Emily Blem, Renee St. Amant, Karthikeyan Sankaralingam, and Doug Burger. 2011. Dark silicon and the end of multicore scaling. In International Symposium on Computer Architecture (ISCA). ACM.
- Garg (2013) Nishant Garg. 2013. Apache kafka. Packt Publishing Ltd.
- Goodrich and Mitzenmacher (2011) Michael T Goodrich and Michael Mitzenmacher. 2011. Invertible bloom lookup tables. In 2011 49th Annual Allerton Conference on Communication, Control, and Computing (Allerton). IEEE, 792–799.
- Group ([n. d.]) The P4.org Applications Working Group. [n. d.]. Telemetry Report Format Specification. https://github.com/p4lang/p4-applications/blob/master/docs/telemetry_report_latest.pdf. ([n. d.]). Accessed: 2021-06-23.
- Guo et al. (2015) Chuanxiong Guo, Lihua Yuan, Dong Xiang, Yingnong Dang, Ray Huang, Dave Maltz, Zhaoyi Liu, Vin Wang, Bin Pang, Hua Chen, et al. 2015. Pingmesh: A large-scale system for data center network latency measurement and analysis. In Proceedings of the 2015 ACM Conference on Special Interest Group on Data Communication. 139–152.
- Gupta et al. (2018) Arpit Gupta, Rob Harrison, Marco Canini, Nick Feamster, Jennifer Rexford, and Walter Willinger. 2018. Sonata: Query-driven streaming network telemetry. In Proceedings of the 2018 conference of the ACM special interest group on data communication. 357–371.
- Handigol et al. (2014) Nikhil Handigol, Brandon Heller, Vimalkumar Jeyakumar, David Mazières, and Nick McKeown. 2014. I Know What Your Packet Did Last Hop: Using Packet Histories to Troubleshoot Networks. In Networked Systems Design and Implementation (NSDI). USENIX Association.
- Hardavellas (2012) Nikos Hardavellas. 2012. The rise and fall of dark silicon. In ;login:, Volume: 37. USENIX.
- Hare (2011) Chris Hare. 2011. Simple Network Management Protocol (SNMP). (2011).
- Heller et al. (2010) Brandon Heller, Srinivasan Seetharaman, Priya Mahadevan, Yiannis Yiakoumis, Puneet Sharma, Sujata Banerjee, and Nick McKeown. 2010. Elastictree: Saving energy in data center networks.. In Nsdi, Vol. 10. 249–264.
- Huang et al. (2020) Qun Huang, Haifeng Sun, Patrick PC Lee, Wei Bai, Feng Zhu, and Yungang Bao. 2020. Omnimon: Re-architecting network telemetry with resource efficiency and full accuracy. In Proceedings of the Annual conference of the ACM Special Interest Group on Data Communication on the applications, technologies, architectures, and protocols for computer communication. 404–421.
- Huawei ([n. d.]) Huawei. [n. d.]. Overview of Telemetry. https://support.huawei.com/enterprise/en/doc/EDOC1000173015/165fa2c8/overview-of-telemetry. ([n. d.]). Accessed: 2021-06-24.
- Infiniband Trade Association (2015) Infiniband Trade Association. 2015. InfiniBandTM Architecture Specification. (2015). Volume 1 Release 1.3.
- Intel ([n. d.]a) Intel. [n. d.]a. In-band Network Telemetry Detects Network Performance Issues. https://builders.intel.com/docs/networkbuilders/in-band-network-telemetry-detects-network-performance-issues.pdf. ([n. d.]). Accessed: 2021-06-04.
- Intel ([n. d.]b) Intel. [n. d.]b. Intel Tofino Series Programmable Ethernet Switch ASIC. https://www.intel.com/content/www/us/en/products/network-io/programmable-ethernet-switch/tofino-series/tofino.html. ([n. d.]). Accessed: 2021-05-12.
- Intel ([n. d.]c) Intel. [n. d.]c. Intel® Deep Insight Network Analytics Software. https://www.intel.com/content/www/us/en/products/network-io/programmable-ethernet-switch/network-analytics/deep-insight.html. ([n. d.]). Accessed: 2021-06-10.
- Intel ([n. d.]d) Intel. [n. d.]d. Intel® Ethernet Network Adapter E810-CQDA1/CQDA2. https://www.intel.com/content/www/us/en/products/docs/network-io/ethernet/network-adapters/ethernet-800-series-network-adapters/e810-cqda1-cqda2-100gbe-brief.html. ([n. d.]). Accessed: 2021-06-11.
- Intel ([n. d.]e) Intel. [n. d.]e. Intel® P4 Studio. https://www.intel.com/content/www/us/en/products/network-io/programmable-ethernet-switch/p4-suite/p4-studio.html. ([n. d.]). Accessed: 2021-06-08.
- Jeyakumar et al. (2014) Vimalkumar Jeyakumar, Mohammad Alizadeh, Yilong Geng, Changhoon Kim, and David Mazières. 2014. Millions of little minions: Using packets for low latency network programming and visibility. ACM SIGCOMM Computer Communication Review 44, 4 (2014), 3–14.
- Khandelwal et al. (2019) Anurag Khandelwal, Rachit Agarwal, and Ion Stoica. 2019. Confluo: Distributed monitoring and diagnosis stack for high-speed networks. In 16th USENIX Symposium on Networked Systems Design and Implementation (NSDI 19). 421–436.
- Kim et al. (2015) Changhoon Kim, Anirudh Sivaraman, Naga Katta, Antonin Bas, Advait Dixit, and Lawrence J Wobker. 2015. In-band network telemetry via programmable dataplanes. In ACM SIGCOMM.
- Kim et al. (2020) Daehyeok Kim, Zaoxing Liu, Yibo Zhu, Changhoon Kim, Jeongkeun Lee, Vyas Sekar, and Srinivasan Seshan. 2020. Tea: Enabling state-intensive network functions on programmable switches. In Proceedings of the Annual conference of the ACM Special Interest Group on Data Communication on the applications, technologies, architectures, and protocols for computer communication. 90–106.
- Kučera et al. (2020) Jan Kučera, Diana Andreea Popescu, Han Wang, Andrew Moore, Jan Kořenek, and Gianni Antichi. 2020. Enabling event-triggered data plane monitoring. In Proceedings of the Symposium on SDN Research. 14–26.
- Li et al. (2020) Yiran Li, Kevin Gao, Xin Jin, and Wei Xu. 2020. Concerto: cooperative network-wide telemetry with controllable error rate. In Proceedings of the 11th ACM SIGOPS Asia-Pacific Workshop on Systems. 114–121.
- Li et al. (2019) Yuliang Li, Rui Miao, Hongqiang Harry Liu, Yan Zhuang, Fei Feng, Lingbo Tang, Zheng Cao, Ming Zhang, Frank Kelly, Mohammad Alizadeh, et al. 2019. HPCC: high precision congestion control. In Proceedings of the ACM Special Interest Group on Data Communication. 44–58.
- Lipton (1994) Richard J Lipton. 1994. A new approach to information theory. In Annual Symposium on Theoretical Aspects of Computer Science. Springer, 699–708.
- Liu et al. (2016) Zaoxing Liu, Antonis Manousis, Gregory Vorsanger, Vyas Sekar, and Vladimir Braverman. 2016. One sketch to rule them all: Rethinking network flow monitoring with univmon. In Proceedings of the 2016 ACM SIGCOMM Conference. 101–114.
- Mansour et al. (2019) Wassim Mansour, Nicolas Janvier, and Pablo Fajardo. 2019. FPGA implementation of RDMA-based data acquisition system over 100-Gb ethernet. IEEE Transactions on Nuclear Science 66, 7 (2019), 1138–1143.
- Mitzenmacher and Upfal (2017) Michael Mitzenmacher and Eli Upfal. 2017. Probability and computing: Randomization and probabilistic techniques in algorithms and data analysis. Cambridge university press.
- Networks ([n. d.]) Juniper Networks. [n. d.]. Overview of the Junos Telemetry Interface. https://www.juniper.net/documentation/us/en/software/junos/interfaces-telemetry/topics/concept/junos-telemetry-interface-oveview.html. ([n. d.]). Accessed: 2021-06-24.
- NVIDIA ([n. d.]) NVIDIA. [n. d.]. NVIDIA Mellanox Spectrum Switch. https://www.mellanox.com/files/doc-2020/pb-spectrum-switch.pdf. ([n. d.]).
- Rasley et al. (2014) Jeff Rasley, Brent Stephens, Colin Dixon, Eric Rozner, Wes Felter, Kanak Agarwal, John Carter, and Rodrigo Fonseca. 2014. Planck: Millisecond-scale monitoring and control for commodity networks. ACM SIGCOMM Computer Communication Review 44, 4 (2014), 407–418.
- Roy et al. (2015) Arjun Roy, Hongyi Zeng, Jasmeet Bagga, George Porter, and Alex C Snoeren. 2015. Inside the social network’s (datacenter) network. In Proceedings of the 2015 ACM Conference on Special Interest Group on Data Communication. 123–137.
- Sidler et al. (2020) David Sidler, Zeke Wang, Monica Chiosa, Amit Kulkarni, and Gustavo Alonso. 2020. StRoM: smart remote memory. In Proceedings of the Fifteenth European Conference on Computer Systems. 1–16.
- Tammana et al. (2018) Praveen Tammana, Rachit Agarwal, and Myungjin Lee. 2018. Distributed network monitoring and debugging with switchpointer. In 15th USENIX Symposium on Networked Systems Design and Implementation (NSDI 18). 453–456.
- team ([n. d.]) Intel DPDK Validation team. [n. d.]. DPDK Intel NIC Performance Report Release 20.11. https://fast.dpdk.org/doc/perf/DPDK_20_11_Intel_NIC_performance_report.pdf. ([n. d.]). Accessed: 2021-05-07.
- Technologies ([n. d.]) Mellanox Technologies. [n. d.]. ConnectX®-6 VPI Card. https://www.mellanox.com/files/doc-2020/pb-connectx-6-vpi-card.pdf. ([n. d.]). Accessed: 2021-05-12.
- Van Tu et al. (2017) Nguyen Van Tu, Jonghwan Hyun, and James Won-Ki Hong. 2017. Towards onos-based sdn monitoring using in-band network telemetry. In 2017 19th Asia-Pacific Network Operations and Management Symposium (APNOMS). IEEE, 76–81.
- Van Tu et al. (2018) Nguyen Van Tu, Jonghwan Hyun, Ga Yeon Kim, Jae-Hyoung Yoo, and James Won-Ki Hong. 2018. Intcollector: A high-performance collector for in-band network telemetry. In 2018 14th International Conference on Network and Service Management (CNSM). IEEE, 10–18.
- Vestin et al. (2019) Jonathan Vestin, Andreas Kassler, Deval Bhamare, Karl-Johan Grinnemo, Jan-Olof Andersson, and Gergely Pongracz. 2019. Programmable event detection for in-band network telemetry. In 2019 IEEE 8th international conference on cloud networking (CloudNet). IEEE, 1–6.
- Xilinx ([n. d.]) Xilinx. [n. d.]. Xilinx Embedded RDMA Enabled NIC. https://www.xilinx.com/support/documentation/ip_documentation/ernic/v3_0/pg332-ernic.pdf. ([n. d.]). Accessed: 2021-06-11.
- Yu et al. (2019) Da Yu, Yibo Zhu, Behnaz Arzani, Rodrigo Fonseca, Tianrong Zhang, Karl Deng, and Lihua Yuan. 2019. dShark: A general, easy to program and scalable framework for analyzing in-network packet traces. In 16th USENIX Symposium on Networked Systems Design and Implementation (NSDI 19). 207–220.
- Yu (2019) Minlan Yu. 2019. Network telemetry: towards a top-down approach. ACM SIGCOMM Computer Communication Review 49, 1 (2019), 11–17.
- Zhou et al. (2020a) Yu Zhou, Jun Bi, Tong Yang, Kai Gao, Jiamin Cao, Dai Zhang, Yangyang Wang, and Cheng Zhang. 2020a. Hypersight: Towards scalable, high-coverage, and dynamic network monitoring queries. IEEE Journal on Selected Areas in Communications 38, 6 (2020), 1147–1160.
- Zhou et al. (2020b) Yu Zhou, Chen Sun, Hongqiang Harry Liu, Rui Miao, Shi Bai, Bo Li, Zhilong Zheng, Lingjun Zhu, Zhen Shen, Yongqing Xi, et al. 2020b. Flow event telemetry on programmable data plane. In Proceedings of the Annual conference of the ACM Special Interest Group on Data Communication on the applications, technologies, architectures, and protocols for computer communication. 76–89.
- Zhu et al. (2015) Yibo Zhu, Nanxi Kang, Jiaxin Cao, Albert Greenberg, Guohan Lu, Ratul Mahajan, Dave Maltz, Lihua Yuan, Ming Zhang, Ben Y Zhao, et al. 2015. Packet-level telemetry in large datacenter networks. In Proceedings of the 2015 ACM Conference on Special Interest Group on Data Communication. 479–491.