A title with some math:
Characterization of the scintillation time response of liquid argon detectors for dark matter search
Abstract
The scintillation time response of liquid argon has a key role in the discrimination of electronic backgrounds in dark matter search experiments. However, its extraordinary rejection power can be affected by various detector effects such as the delayed light emission of TetraPhenyl Butadiene, the most commonly used wavelength shifter, and the electric drift field applied in Time Projection Chambers. In this work, we characterized the TetraPhenyl Butadiene delayed response and the dependence of the pulse shape discrimination on the electric field, exploiting the data acquired with the ARIS, a small-scale single-phase liquid argon detector exposed to monochromatic neutron and gamma sources at the ALTO facility of IJC Lab in Orsay.
1 Introduction
Recent results from DarkSide-50 [1, 2, 3] and DEAP-3600 [4, 5] have demonstrated the large potential of liquid argon (LAr) technology in the direct search of Weakly Interacting Massive Particles (WIMPs), the leading dark matter candidate. LAr is characterized by an extraordinary scintillation pulse shape discrimination (PSD), able to suppress the electronic recoil background. Such a rejection power originates from the dependence of LAr scintillation pulse on the nature of the recoil, electronic (ER) or nuclear (NR), with distinctive probabilities in populating singlet and triplet excited states. These are characterized by de-excitation times which differ by more than two orders of magnitude, namely 6 ns and 1600 ns, respectively. DEAP-3600 [5] probed such a rejection power by a factor larger than 3107 in the 44–89 keVer energy range by operating the detector with atmospheric argon, highly contaminated in cosmogenic 39Ar, a -decay isotope with a specific activity at the level of 1 Bq/kg.
In 2015, the DarkSide Collaboration [6] demonstrated that 39Ar contamination can be reduced by a factor 1400, by extracting argon from deep underground, naturally shielded against cosmic rays. Although underground argon allows for the relaxation of requirements on the PSD power, the ambition of the next generations of LAr detectors [7] is to run with exposures equivalent to 100-1000 ton year in a background-free mode. This imposes a PSD rejection power larger than 109, ideally achievable in LAr thanks to the large difference (about a factor 3) between the NR and ER probability to populate singlet or triplet states. However, light detection in LAr detectors can be delayed by the wavelength shifter, which absorbs 128 nm scintillation photons and re-emits visible photons, detectable by photosensors. Several works [8, 9, 10, 11] observed time delayed components attributed to TetraPhenyl Butadiene (1,1,4,4-tetraphenyl-1,3-butadiene, C28H22, abbreviated TPB) [12], a popular wavelength shifter with an extremely high conversion efficiency [11], and used by DarkSide-50 and DEAP-3600,
Another effect, potentially impacting the LAr PSD, is the scintillation dependence on the electric field, reported by the SCENE Collaboration [13], and recently also observed with a dual-phase Time Projection Chamber (TPC) at CERN [14]. The latter analysis attributes such a dependence to the LAr slow scintillation component, which decreases as the drift field increases.
2 Experimental setup and data selection
The ARIS detector has an active mass of 0.5 kg of LAr, housed in a 7.6 cm diameter, 7 cm height PTFE cylinder, equipped with one 3-inch Hamamtsu R11065 photomultiplier tube (PMT) at the bottom and seven 1-inch Hamamtsu R8520 PMTs at the top. All the inner surfaces of the chamber are coated with evaporated TPB. The PTFE sleeve supports a set of copper rings connected by resistors in series to maintain a uniform electric field throughout the active argon volume. The light yield measured at field off is equal to 6.350.05 pe/keV, obtained with and electronic recoil calibration sources. A complete description of the chamber design and its performance can be found in Ref. [15].
The LICORNE source [16] exploits the inverse 7Li(p, n)7Be reaction, which guarantees a quasi-monoenergetic (1.5 MeV), pulsed neutron beam with high collimation. In addition, 478 keV s from 7Li* de-excitation are emitted in coincidence with the beam pulse, characterized by a period of 400 ns and a width of 2 ns.
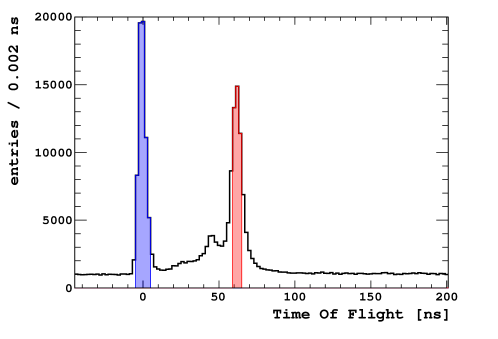
Data have been acquired varying the electric drift fields from up to V/cm. ERs, induced by 478 keV s, and NRs, induced by neutrons, are efficiently separated by looking at the time-of-flight (ToF), the difference in time between the LAr signal and the beam pulse. Their ToFs differ by 60 ns, as shown in figure 1, corresponding to the 1 m distance between the chamber and the source. The resolution of the ToF is measured at 1.8 ns, dominated by the beam pulse width (1.5 ns) and by the determination of the start time of the LAr scintillation pulse, digitized at 250 MHz.
ARIS is surrounded by eight NE213 liquid scintillator detectors from the EDEN array [17], which tag scattered neutrons and gammas, in order to kinematically constrain the recoil energy in the chamber, as described in Ref. [15]. However, in this work, we have analyzed dedicated runs acquired with the beam-chamber coincidence only, which guarantees high statistical samples of NRs (ERs), with continuous spectra up to 150 keVnr (50 keVer), without affecting the characterization of the time response, expressed as a function of the number of photoelectrons (S1). High statistics ER samples from the calibration source are also included in this study.
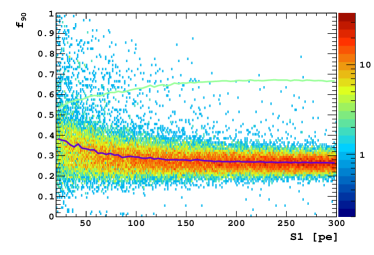
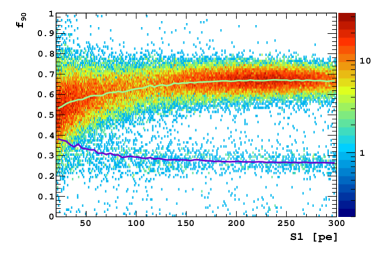
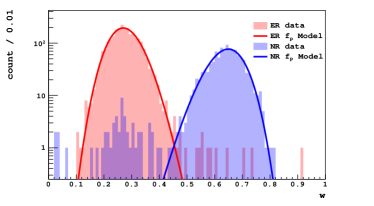
NRs and ERs are selected by requiring ToF between the beam and the TPC in the [59, 65] ns and [-5,5] ns ranges, respectively, as shown in figure 1. The purity of NR sample is estimated at 97%, with a small contamination from random coincidences, while NR contamination in ER samples is negligible. Such purity can be appreciated by looking at , the pulse shape estimator defined as the fraction of light observed in the first 90 ns, distributed around 0.3 (0.7) for ERs (NRs), as shown in Figure 2.
3 Characterization of the TPB time response
Although the TPB re-emission is mostly prompt (10 ns), a residual delayed component can affect the LAr PSD by lengthening photon collection times and reducing the time resolution. The dominant TPB fluorescent component was measured by E. Segreto [11] to be 491 ns (301% probability) by directly irradiating a TPB in vacuum with and particles at room temperature. Such a delay is comparable to the size of the prompt window used to calculate the fraction of collected light, , the standard PSD estimator. As an example, DarkSide-50 uses a 90 ns window [1] while DEAP-3600 a 60 ns one [5], defined to fully contain photon from the singlet de-excitation. The difference between the two prompt values used by the experiments depends on the detector size and hence on the propagation length in the LAr volume. Furthermore, E. Segreto [11] reported two additional TPB delayed components at 30910 ns and 3550500 ns with probabilities 2 %, and 8 %, respectively.
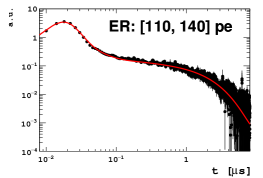
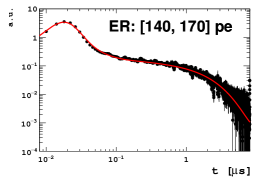
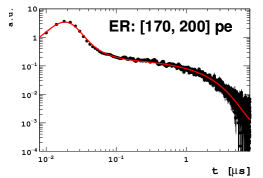
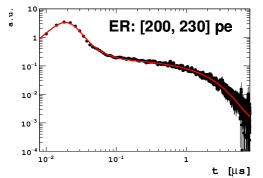
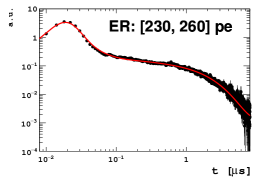
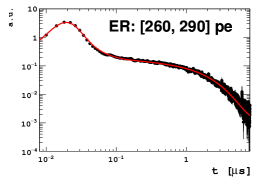
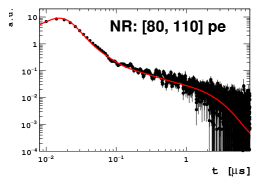
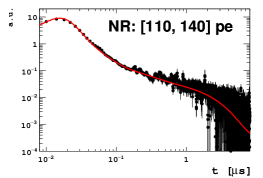
In this work, we characterize the TPB time response by directly fitting ARIS waveforms acquired in LAr by the bottom 3-inches PMT, which collects 60% of the light. Top PMTs are excluded to avoid any possible distortion from averaging the waveforms of channels with different gains. The analysis strategy is based on the simultaneous fit of multiple ER and NR waveforms acquired in different energy regimes (from 80 to 290 pe in bins of 30 pe). This approach allows the breaking of the degeneracy between argon scintillation and TPB parameters, since the latter do not depend on the particle nature and energy. TPB, argon scintillation, and detector parameters are therefore constrained in simultaneous fits among different samples. Conversely, the singlet-to-triplet ratio depends on the particle nature and energy, and it is included in the model as an independent parameter for each waveform. The same procedure is repeated for 7 different electric fields (from 0 to 500 V/cm) to probe a possible dependence of the slow argon decay component on the applied electric field, as suggested in [14].
Waveforms are averaged after subtracting the baseline over approximately 103 events for each energy region and field, corresponding to a minimum statistics of 105 photoelectrons (pe). The error associated to each bin is defined with respect to the photon statistics. To remove spurious events from environmental background, soft cuts are applied on the PSD parameter, requiring 0.5 and 0.4, both with S180 pe, for ERs and NRs, respectively. The inefficiency associated to these cuts is estimated to be negligible, as can be appreciated from the Figure 2.
3.1 The waveform model
Waveforms are analytically modeled as the convolution of three components, namely the argon scintillation time profile, the TPB re-emission, and the detector response, which accounts for the photon propagation and the PMT jitter.
The argon scintillation time profile is described by
| (3.1) |
where () is the singlet (triplet) decay times, and (1-) the probability of populating the singlet (triplet) state.
To simplify the formalism, the TPB re-emission is here modelled with only two delayed components with and (={1, 2}) the decay time and intensity, respectively,
| (3.2) |
and where
| (3.3) |
represents the fast re-emission component, assumed instantaneous with respect to the detector time resolution. If necessary, the model can easily be extended to more than two components.
The photon propagation and the detector response are jointly described with a normal distribution, , where the resolution , is time-independent.
The convolution of the three components
| (3.4) |
is computed analytically by exploiting the associative property.
The term representing the time response with instantaneous TPB emission is obtained by convolving the scintillation time response for each excited state with ,
where
| (3.6) |
and = {s, t} is referred to the singlet and triplet states.
In the presence of a delayed TPB emission, the response function is derived by convolving for each scintillation term eq. 3.1 with the TPB response
where ={1,2} represents the two delayed TPB components.
The overall response function, described by eq. 3.4, is the sum of different contributions from eq. 3.1 and 3.1
| (3.8) | |||||
where is the set of parameters including and , the probabilities to populate singlet and triplet states, so that +=1.
The waveform model requires three additional parameters in order to fit the ARIS data: the pulse amplitude (), the offset corresponding to the pulse start time (), and noise and effects related to the baseline subtraction modeled with a constant (). The final model derived from eq. 3.8 is expressed by
| (3.9) |
3.2 Analysis and results
| TPB | |||||
| # | [ns] | [%] | [ns] | [%] | [ns] |
| 0 | - | - | - | - | |
| 1 | - | - | |||
| 2 |
Each dataset is defined for a given electric field and consists of 14 waveforms, as already mentioned each averaged over about 103 events, corresponding to 7 energy ranges for each NR/ER sample. The free parameters associated to each waveform are , , , and . Scintillation times, as well as TPB and detector parameters, are constrained among all waveforms that make up a dataset. The total number of free parameters is 59 in addition to those associated to the TPB delayed emission. As the scope of this analysis is to probe and characterize the TPB fluorescence, the fit procedure was repeated assuming zero, one, and two TPB components.
At first, we tested a systematic effect potentially arising from the degeneracy between the scintillation fast component, , and the detector timing resolution, (best fit yields 9 and 5 ns for and , respectively). Since we noticed a non-negligible anti-correlation between the two parameters, the fitting procedure was repeated fixing to values in the 5,12 ns range. No significant variation of the best fit parameters of interest, i.e., , , and TPB parameters, was observed.
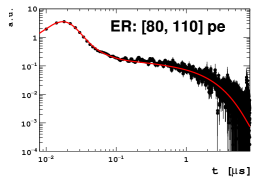
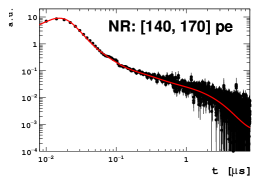
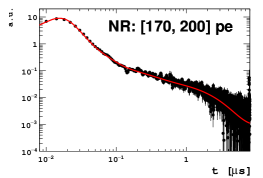
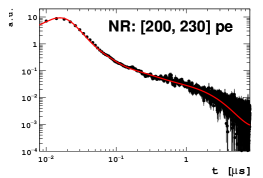
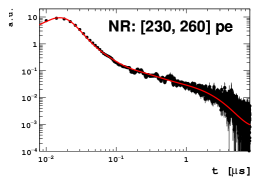
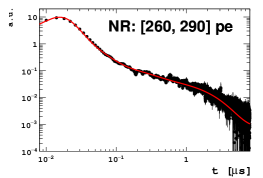
An example of fit with eq. 3.9 of the 14 waveforms acquired at 500 V/cm is shown in Figure 3, assuming a single TPB delayed component. The results of the fits for the three TPB configurations are quoted in Table 1. The associated errors are defined as the RMS of the mean values from the fits at different fields.
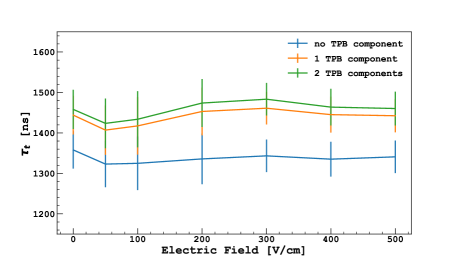
As a first test, we looked at the dependence of the slow scintillation component on the electric field suggested in ref. [14], where a 3 m3 LAr TPC observed, using cosmic ray events, a 10% reduction of by varying the electric field from 0 to 600 V/cm. In contrast, this analysis did not highlight any significant deviation from a constant in any of the three TPB configurations, as shown in Figure 4.
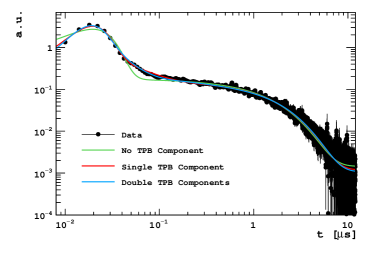
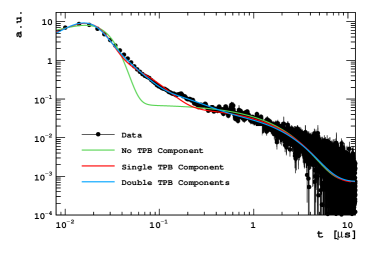
In Figure 5 we show two examples of averaged waveforms taken at 500 V/cm, fitted assuming none, one, and two TPB components. It can be noted that the NR spectrum cannot be modelled without at least one TPB component. This was confirmed by a null-hypothesis test, where the null-hypothesis corresponds to no TPB components (or =0), with respect to the one-component model (or 0). The null-hypothesis was rejected in 98.5% of the fitted waveforms with exceeding the 99% C.L. equivalent threshold. The same testing procedure to verify whether the data preferred two versus one TPB components (here assumed as the null-hypothesis) did not produce any conclusive result, as the rejected the null-hypothesis with 99% C.L. equivalent threshold for only 54.2% of the fitted waveforms. From this analysis, we conclude that the model with one TPB fluorescent component, with 835 ns decay time and 14.70.6% probability, is sufficient to reproduce ARIS data. This result is of the same order of magnitude as the dominant component measured in ref. [11] (491 ns and 301%) although not compatible within the uncertainties. It is worth noting, however, that Segreto’s measurement was done in vacuum at room temperature, very different from the one presented in this paper performed in LAr. In addition, the acquisition gate used with ARIS, 7 s, is not sufficiently long to detect the long TPB decay component (3.5 s with 8% amplitude) reported in ref. [11].
4 Dependence of the liquid argon time response on the electric field
The uncertainty of the the singlet-to-triple ratio, measured with the waveform fit described in the previous section, is too large, because of the large number of free parameters, to infer its dependence on the electric field. To overcome this problem, we implemented an effective description of the PSD estimator () distribution, which allows to minimize the number of parameters and more accurately extract the dependence on the electric field. describes the ratio of two correlated normal random variables. In the PSD context, they correspond to the number of prompt photelectrons, , and to S1, so that
| (4.1) |
where is the number of photoelectrons detected in the late component. In experiments like DarkSide-50 and DEAP-3600, the distribution of , is built by selecting a narrow S1 range.
The here-proposed model considers an infinitely small interval in the neighborhood of S1=S10, so that
| (4.2) |
The observable is then the ratio between a random variable, , constrained by , and S10, and its variance is
| (4.3) |
where and are the prompt and late component resolutions, and is the covariance term.
The main assumption at the basis of this model is that any physical effect playing a role in the definition of and can be modelled with Poisson and Binomial statistics. The number of photoelectrons emitted by the LAr scintillation can be, in fact, well approximated by a Poisson distribution, as shown in reference [18]. In addition, any effect related to photon emission, propagation, and detection is associated to a given probability to contribute to either the prompt or late component, and thus can be regarded in this context, as a Bernoulli process. Their composition gives origin to a Binomial distribution. Additionally, the correlated noise (e.g. afterpulses) contributes binomially to prompt/late signals.
Both Poisson and Binomial distributions can be approximated, at sufficiently large photon statistics, by Gaussian distributions, whose standard deviation is proportional to the square root of the number of photoelectrons. As their convolution is still Gaussian with the same dependence on the number of photoelectrons, we introduce the following definition of prompt and late resolutions,
| (4.4) |
for and constant.
Following our assumption, is also Gaussian distributed as
| (4.5) |
where is the most probable value of , and is the standard deviation,
| (4.6) |
derived from eqs. 4.3, 4.4, and taking into account the full anti-correlation from eq. 4.2 between and .
Eq. 4.5, successfully tested on Monte Carlo samples, was used to fit ARIS data with defined with a 90 ns prompt window and distributions selected with 5-pe S1 bins for each electric field. NR events are selected using the beam-TPC time coincidence, as described in Section 2. In order to maximize the ER event statistics, we analyzed calibration data acquired with a 133Ba source. Examples of fit for ERs and NRs are shown in Figure 6.

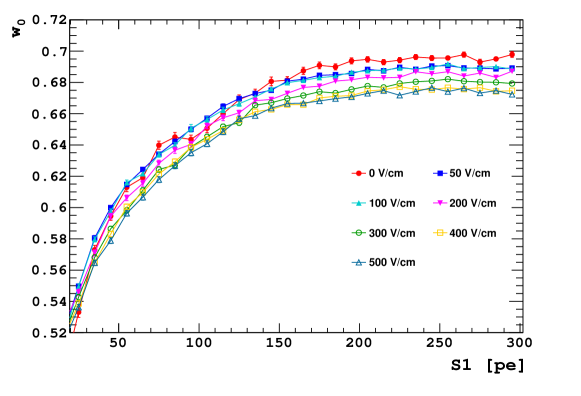

The dependence of on S1 and on the drift field for ERs and NRs are shown in Figure 7. The NR dependence on the electric field confirms what was already observed by the SCENE [13] experiment, i.e. decreases as the field strength increases. In addition to this, we observe for the first time the dependence of ER on the field, which behaves opposite to NRs, i.e. increases as the field strength decreases. Since we did not observed any dependence of the scintillation triplet de-excitation time on the electric field, as discussed in the previous section, we assume that the electric field may act on the singlet-to-triplet ratio. However, we cannot provide any explanation to support this observation, especially given the opposite dependence of ER and NR on the electric field. We therefore report this result, confident that it will stimulate interest in the atomic and nuclear physics communities to better understand the mechanisms underlying the interaction between LAr scintillation and the electric field.
5 Conclusions
In this work, we have characterized, with the ARIS setup, two effects that impact the time response of LAr TPCs, critical for future dark matter search experiments: the fluorescence of TPB, one of the most widely used wavelength shifters, and the effect of the electric field on the LAr scintillation singlet-to-triplet ratio. The first result confirms what has already been observed in the literature [11], namely the presence of at least one TPB decay component of the order of a few tens of nanoseconds. The second measurement confirms the dependence of the LAr time response to NRs on the electric field, already observed by SCENE [13]. We additionally showed with ARIS data the dependence of the response to ERs, never observed before, with a trend opposite to NRs. We finally exclude, from the multi-waveform fit, that the electric field affects the LAr triplet de-excitation time.
Acknowledgments
This report is based upon work supported by the UnivEarthS LabEx program (Grants No. ANR-10-LABX-0023 and No. ANR-18-IDEX-0001) and by the National Science Foundation (Grants No. PHY-1314501, No. PHY-1314483, No. PHY-1314507, and No. PHY-1455351) and the France-Berkeley Fund (2016-0053).
References
- [1] DarkSide collaboration, DarkSide-50 532-day Dark Matter Search with Low-Radioactivity Argon, Phys. Rev. D 98 (2018) 102006 [1802.07198].
- [2] DarkSide collaboration, Low-Mass Dark Matter Search with the DarkSide-50 Experiment, Phys. Rev. Lett. 121 (2018) 081307 [1802.06994].
- [3] DarkSide collaboration, Constraints on Sub-GeV Dark-Matter Electron Scattering from the DarkSide-50 Experiment, Phys. Rev. Lett. 121 (2018) 111303 [1802.06998].
- [4] DEAP-3600 collaboration, First results from the DEAP-3600 dark matter search with argon at SNOLAB, Phys. Rev. Lett. 121 (2018) 071801 [1707.08042].
- [5] DEAP collaboration, Search for dark matter with a 231-day exposure of liquid argon using DEAP-3600 at SNOLAB, Phys. Rev. D 100 (2019) 022004 [1902.04048].
- [6] DarkSide collaboration, Results From the First Use of Low Radioactivity Argon in a Dark Matter Search, Phys. Rev. D93 (2016) 081101 [1510.00702].
- [7] C. E. Aalseth et al., DarkSide-20k: A 20 tonne two-phase LAr TPC for direct dark matter detection at LNGS, Eur. Phys. J. Plus 133 (2018) 131 [1707.08145].
- [8] V. Chepel and H. Araujo, Liquid noble gas detectors for low energy particle physics, JINST 8 (2013) R04001 [1207.2292].
- [9] W. H. Lippincott, K. J. Coakley, D. Gastler, A. Hime, E. Kearns, D. N. McKinsey et al., Scintillation time dependence and pulse shape discrimination in liquid argon, Phys. Rev. C 78 (2008) 035801.
- [10] A. Hitachi, T. Takahashi, N. Funayama, K. Masuda, J. Kikuchi and T. Doke, Effect of ionization density on the time dependence of luminescence from liquid argon and xenon, Phys. Rev. B 27 (1983) 5279.
- [11] E. Segreto, Evidence of delayed light emission of TetraPhenyl Butadiene excited by liquid Argon scintillation light, Phys. Rev. C91 (2015) 035503 [1411.4524].
- [12] M. Kuzniak and A. M. Szelc, Wavelength shifters for applications in liquid argon detectors, Instruments 5 (2021) .
- [13] H. Cao, T. Alexander, A. Aprahamian, R. Avetisyan, H. Back, A. Cocco et al., Measurement of scintillation and ionization yield and scintillation pulse shape from nuclear recoils in liquid argon, Physical Review D 91 (2015) .
- [14] B. Aimard et al., Study of scintillation light collection, production and propagation in a 4 tonne dual-phase LArTPC, JINST 16 (2021) P03007 [2010.08370].
- [15] P. Agnes et al., Measurement of the liquid argon energy response to nuclear and electronic recoils, Phys. Rev. D97 (2018) 112005 [1801.06653].
- [16] M. Lebois, J. N. Wilson, P. Halipré, B. Leniau, I. Matea, A. Oberstedt et al., Development of a kinematically focused neutron source with the p(7Li,n)7Be inverse reaction, Nucl. Instrum. Meth. A 735 (2014) 145.
- [17] M. Cavallaro, S. Tropea, C. Agodi, M. Assié, F. Azaiez, C. Boiano et al., Pulse-shape discrimination in ne213 liquid scintillator detectors, Nuclear Instruments and Methods in Physics Research Section A: Accelerators, Spectrometers, Detectors and Associated Equipment 700 (2013) 65.
- [18] DarkSide collaboration, Simulation of argon response and light detection in the DarkSide-50 dual phase TPC, JINST 12 (2017) P10015 [1707.05630].