Free Energy Landscape and Isomerization Rates of Clusters at Finite Temperature
Abstract
In metallic nanoparticles, the cluster geometric structures control the particle’s electronic band structure, polarizability, and catalytic properties. Analyzing the structural properties is a complex problem; the structure of an assembled cluster changes from moment to moment due to thermal fluctuations. Conventional structural analyses based on spectroscopy or diffraction cannot determine the instantaneous structure exactly and can merely provide an averaged structure. Molecular simulations offer an opportunity to examine the assembly and evolution of metallic clusters, as the preferred assemblies and conformations can easily be visualized and explored. Here, we utilize the adaptive biasing force algorithm applied to first principles molecular dynamics to demonstrate exploration of a relatively simple system which permits comprehensive study of the small metal cluster in both neutral and charged configurations. Our simulation work offers a quantitative understanding of these clusters’ dynamic structure, which is significant for single-site catalytic reactions on metal clusters and provides a starting point for a detailed quantitative understanding of more complex pure metal and alloy clusters’ dynamic properties.
Introduction
In the assembly of nanoscopic and mesoscopic materials, clusters are important precursors where elemental units begin to aggregate. Li et al. (2013); Bianchi et al. (2015); Meng et al. (2010); Huang et al. (2020) The properties of initial aggregates that are formed control pathways available for subsequent assembly, He et al. (2020); Wang et al. (2017); Chen et al. (2011) and therefore the ultimate structure of the assembled materials. In the case of metallic nanoparticles, cluster geometry can impact the particle’s electronic band structure, polarizability, and catalytic activity, Zhai et al. (2005, 2008); Liu et al. (2018); Austin et al. (2015); Blaško et al. (2017); Chen et al. (2008); Lushchikova et al. (2019); Blaško et al. (2017) enabling many applications in gas sensing, pollution reduction, biology, nanotechnology, and catalysis. Häkkinen et al. (2003); Mills et al. (2003); Daniel and Astruc (2004); Yoon et al. (2005); Pyykkö (2008); Häkkinen (2008); Freund et al. (2011); Beret et al. (2014); Liu et al. (2017); Lang et al. (2017) Metal clusters’ geometric packing properties, Zhai et al. (2005) are very different from those of analogous clusters of isotropically attractive spheres. Huang et al. (2020); Meng et al. (2010) This arises from the directional interactions imparted by electron orbitals, which are predominantly anisotropic in nature. For example, a four-particle colloidal cluster’s stable structure is tetrahedral Meng et al. (2010) while the equivalent stable structures of metals have different structures governed by electron-sharing geometries; Imaoka et al. (2019); Bonačić-Kouteckỳ et al. (2002); Böyükata and Belchior (2008) tends to adopt either a two-dimensional rhombus () or a Y-shaped (Y) geometry. Bonačić-Kouteckỳ et al. (2002) As the number of atoms in a metal cluster increases, the structures become more intricate and have more isomers. Goldsmith et al. (2019)
Potential isomers of metal clusters may be identified by minimizing the energy in a DFT calculation without thermal fluctuations. Though these conformations can be long-lived, at finite temperature a typical metallic cluster is dynamic Liu et al. (2016) and exhibits rapid transitions between different structural isomers. Imaoka et al. (2019); Wang et al. (2015); Xing et al. (2006); Bulusu et al. (2006); Kryachko and Remacle (2007); Olson and Gordon (2007) Experimental work on small clusters with spatiotemporal microscopic resolution by Imaoka et al, Imaoka et al. (2019) has revealed that the metallic cluster, , randomly walks through several isomers and that the isomerizaton reactions follow simple first-order kinetics. Computational studies have utilized classical molecular dynamics simulation Arslan and Güven (1998); Böyükata and Belchior (2008) and first-principles molecular dynamics simulation Goldsmith et al. (2019); Garzón et al. (1997); Liu et al. (2000); Zhang et al. (2019); Bravo-Pérez et al. (1999) to study the free energy profiles of neutral gas phase noble metal clusters and highlight the impact of temperature on the cluster stability. Most studies to date have focused on stable structures, and ignored kinetic concerns which are known to be vital for practical applications. Lee et al. (2021) Recent simulation work by Wang et al, Wang et al. (2015) has, for example, demonstrated that rearranges dynamically to form single-atom catalytic active sites. Such behavior is essential to the function of nanoparticle-based heterogenous catalysts. Understanding the kinetic behavior of clusters is thus key in determining the function of catalysts and engineering new materials.
When acting as catalysts, metallic clusters frequently exchange electrons with a substrate or ligand during intermediate stages of a reaction. Camellone and Fabris (2009) Therefore, the charge of the cluster is often dynamically altering during a catalytic process, and changes in different steps. Camellone and Fabris (2009) Computational studies at 0 K using DFT calculations which have been compared to infrared spectroscopy on experiments show that a charged cluster has a different ground state geometry than a neutral cluster. Zhai et al. (2008); Lushchikova et al. (2019) Thus, it is significant to study how the charge affects the free energy landscapes of metallic clusters at finite temperatures. Importantly, many of the properties of isomerization transitions, and how conformational states are influenced by the net charge on a metallic cluster, can be observed in small metallic clusters where they may be comprehensively understood.
Among all the noble metals, gold clusters are the most widely explored. Goldsmith et al. (2019); Li et al. (2003) As the number of atoms in a gold cluster increases, the number of isomers increases significantly, resulting in more complex free energy landscapes. Goldsmith et al. (2019) In this work, we choose as a representative cluster and investigate the free energy landscape of gas phase neutral and charged clusters to understand their thermodynamic and structural properties at different temperatures. The cluster discussed previously is the smallest gold cluster which has multiple stable isomers, which are illustrated in Fig.1. First-principles molecular dynamics (FPMD) simulations coupled with advanced sampling methodsSevgen et al. (2018) are applied to explore and analyze this system’s stability and its isomerization rates. We additionally investigate the differences in thermodynamic and structural properties between neutral and charged metal clusters to look into the mechanisms by which the charge would affect the metal clusters’ stability at finite temperature.
Methods
The methods used in our calculation and information necessary to repeat or extend these calculations are discussed below.iiiAll required input files are available via GitHub at https://github.com/shijiale0609/clustersFES Biased first-principles molecular dynamics simulations (FPMD) were carried out using the Qbox code Gygi (2008) coupled with the SSAGES suite Sidky et al. (2018) in client-server mode Sevgen et al. (2018); Govoni et al. (2021); Lee et al. (2021). Electronic structure computations necessary to obtain the forces on nuclei that are evolved in MD are carried using density functional theory (DFT) with the PBE exchange-correlation functional. SG15 optimized norm-conserving Vanderbilt (ONCV) pseudopotentials Schlipf and Gygi (2015) were used as implemented in the Qbox code. Gygi (2008) A plane-wave basis set expanded to an energy cutoff of 45 RyiiiiiiWhile the choice of the energy cutoff has a nominal effect on ground state calculations for these two configurations (which are within approximately of each other), we have verified that this choice does not significantly affect the free energy landscapes which are dominated more by entropy and multiplicity of locally available states. represents the valence electrons, and the calculations include eight empty electronic states and Fermi smearing with an electronic temperature of 500 K. All calculations are performed without restricting spin. We do not explore effects of spin polarization in these calculations, though during preliminary work we compared the forces arising when considering spin polarization explicitly and have found its influence to be negligible, similar to the results of Liu, et al.Liu et al. (2000)
All FPMD calculations involve a periodic cubic cell with an edge length of , which is large enough that the cluster does not interact with its own periodic images. A Bussi-Donadio-Parrinello (BDP) thermostatBussi et al. (2007) is used to sample the canonical ensemble. As \ceAu is a relatively heavy atom, the MD simulation timestep is set to be for a balance of accuracy and efficiency. For each timestep, 10 self-consistent field calculations are performed, each involving five wave-function optimizations. Simulation settings for both charged and neutral clusters are identical, aside from modifying the overall net charge in Qbox to .
Elucidating isomerization transition rates requires efficient sampling of rare events, since free energy barriers must be crossed. Enhanced sampling calculations proceed by applying a bias to collective variables to speed up the exploration of the simulated systems. Collective variables (CVs), closely related to the concept of reaction coordinates, are a low-dimensional projection of the high-dimensional space of MD simulations, which can clearly distinguish reactants from products and quantify dynamical progress along the pathway from reactants to products. Peters (2017) Generally, this defines a vector valued function from the space of nuclear positions to the reduced CV space, , where is the number of atoms and the desired reduced dimensionality. For delineating two basins, it is typically sufficient to define a single collective variable (though this can lead to dynamical bottlenecks if poorly chosenBussi and Laio (2020)). Here, we opt for a single CV, the squared radius of gyration of the cluster , defined as
| (1) |
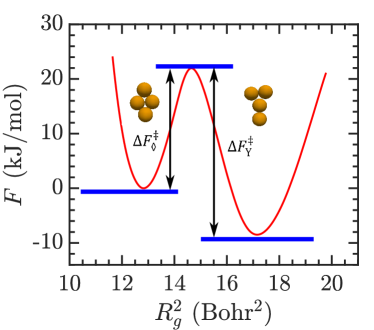
captures the compactness of the cluster, and is thus sufficient to distinguish the two stable conformers. Here and refer to the position of each particle and the center of mass, respectively. This CV is able to distinguish the stable isomers of as shown in Fig. 1, and has been demonstrated a useful variable in past investigations for driving transitions between compact and extended clusters.Huang et al. (2020). Values at each basin in Fig. 1 are approximately and . These positions necessarily shift slightly when the temperature or charge state are modified.
Advanced sampling is carried out using the adaptive bias force (ABF) algorithmDarve et al. (2008) as implemented in SSAGES.Sidky et al. (2018) The ABF method is constructed to swiftly surmount large barriers in free energy by negating the forces which act to restore a configuration to a stable basin; as such it is not only capable of accurately obtaining information about the relative free energies of basins, but can also accurately sample the barriers between them, enabling estimation of the transition rates using methods such as transition state theory (TST). Other sampling techniques could potentially be used. Prior works have applied replica-exchange Monte Carlo and molecular dynamics Beret et al. (2011); Goldsmith et al. (2019) to study the free energy landscape of neutral equilibrium gold clusters ( - ). These calculations require long equilibration times when the free-energy barriers are high between stable and metastable states. Machta (2009) Replica-exchange methods allow for an unbiased search of the potential-energy substrates from which gold cluster structures can be identified. From results by Goldsmith et al Goldsmith et al. (2019) on the free energy landscape of , free energy barriers are not well-sampled especially when the barrier is very high, causing rate calculations to be inaccurate. Provided the CV used is a sufficiently good approximation of the true reaction coordinate, ABF can be used to swiftly scale and accurately determine free energy barriers in reacting processes; this is in particular beneficial when using FPMD as the underlying algorithm to sample configurations.
We utilize four walkersRaiteri et al. (2006) to accumulate the ABF bias on , which is accumulated within the interval [11.5, 20.5] encompassing both basins of interest. When walkers wander outside this grid, a restoring force is applied outside of an initial unbiased buffer zone having a thickness of 0.3 to nudge the system back toward the region of interest. The one-dimensional region utilizes 90 bins, and the restoring forces are generated by a half-harmonic potential with a spring constant of , centered at the edges of the buffer zones. The ABF algorithm requires a minimum number of visits to each grid region before the full force is applied to avoid overemphasizing relatively rare states with large mean forces that can render a simulation unstable; here we set . Prior to applying the ABF algorithm, each walker is run for a short time ( MD steps) to obtain a locally equilibrated state. Enhanced sampling calculations are then performed for another MD steps. We find that these settings are sufficient to explore this system’s basins and transition state.
With the converged free energy landscape, we are able to explore transition rates using transition state theory (TST). Specifically, here, we are interested in the isomerization rate of the \ceAu4 cluster, but our discussion below is general to the computation of any reaction rate where the free energy landscape is known along a single collective variable or reaction coordinate. TST requires only minimal details about the energy surface in the immediate vicinity of transition states barrier, reactant and product basins. The general expression for a reaction rate in TST isPeters (2017)
| (2) |
where the volume per molecule corresponds to the reference concentration and to the volume in the translational partition functions, corresponds to the reaction order, and is the activation free energy. Eq.2 tells us that to calculate the reaction rates for the first order reaction, one merely needs to know the free energy barrier of the transition states relative to the reactant basins. The information about free energy barriers is accessible using advanced sampling capable of driving successfully through these regions. These calculations are greatly facilitated using accurate free energy landscapes obtained through advanced sampling methods. It should be noted that more complex, multivariate expressions for TST can be used if the reaction coordinate is not accurately captured using a single CV; these could prove useful for studying isomerization rates between molecules in more complex clusters.
Results and Discussion
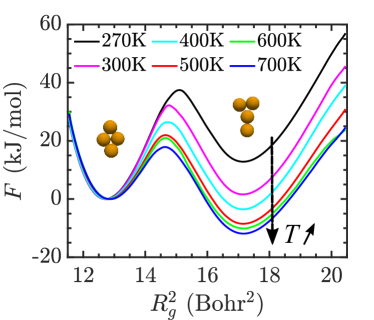
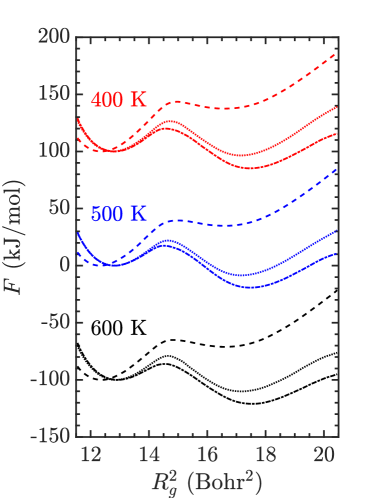
Fig. 2 shows a collection of converged free energy landscapes of neutral clusters at different temperatures between and . As can be reasonably hypothesized, the more compact, energetically favorable rhombus structure is favored at low temperatures, while the increased entropy within the Y-shaped structure is preferred as temperature is increased. It is clear, however, that both configurations are at least metastable at all temperatures explored here. The wells for each are relatively deep, with the free energy difference between the stable basin and transition state approximately or more for each temperature studied. At the lowest temperature, and , corresponding to and , respectively. This marks each configuration as extremely stable on short timescales typical of molecular simulations, with sampling of these transitions unlikely to be accessible without ABF or similar algorithms. The absolute depths of the free energy wells remain on this order as the temperature rises, meaning the activation barrier relative to is reduced significantly at higher temperatures; becomes at (), so that transitions between the two basins become more dynamically favorable.
As temperature is increased, the relative stability of the rhombus decreases, with concomitant increase in the stability of the Y-shaped cluster. At , the Y-shaped isomer becomes the dominant configuration, due to its relatively higher entropy. Such effects have been previously noted to drive two-to-three dimensional transitions in - clusters Goldsmith et al. (2019) as temperature is increased. We can analyse the temperature dependence of cluster stability by computing the equilibrium constant for the isomerization reaction. To obtain this quantity, we subdivide the collective variable domain into two regions belonging to the rhombus or Y-shaped clusters. Note that the equilibrium probability of finding the system in one state is calculated by integrating all the probabilities in that basin, Peters (2017)
| (3) |
where defines the CV of interest, and the fraction of the domain corresponding to basin . Note that this probability is unnormalized; one must divide out by the full partition function to obtain this quantity. Importantly, the probabilities phrased in this way define the occupancy rate for a system to be in one of the stable basins. We separate the free energy landscape using the transition state and integrate each isomer’s probability in the corresponding basin. Therefore, we obtain an expression for the occupancy rate of each isomer as
| (4) |
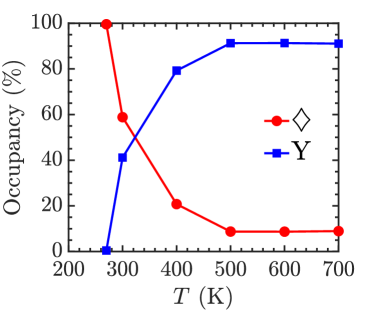
From Fig.3, the rhombus isomer is clearly dominant at low temperature. At 270 K, the occupancy rate of the rhombus isomer is almost 100%, while the occupancy rate of the Y-shaped isomer is almost zero. With increasing temperature, the occupancy rate of the rhombus isomer decreases, and the occupancy rate of the Y-shaped isomer increases. While the basins at are approximately equally deep (see Fig. 2), there is a clear preference for the system to be in the Y basin due to it’s wider character and greater resulting probabilistic weight. Interpolating linearly on our measurements predicts the isomers should be equally observed at approximately . As the temperatures increase to and beyond, the occupancy rates stabilize at approximate fractions and . As temperature is increased further, the two basins would likely merge into a fluid-like single basin, while these would also compete with a dissociated gas-like state, though these transitions cannot be predicted from the data at hand.
The dynamic transition between two isomers may be presented by a mono-molecular reaction with first-order kinetics. Previous experimental results have shown that isomerization with one small metal cluster with no degenerate states obeys a first-order rate law. Imaoka et al. (2019) Therefore, we calculate the reaction equilibrium constant following the first-order reaction rule:
| (5) |
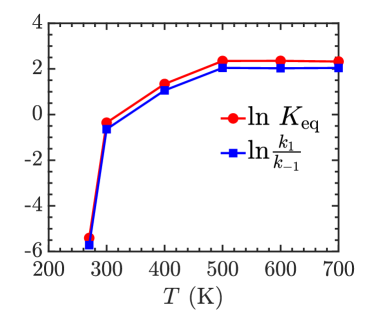
Here we have replaced the typical concentrations in a rate constant expression with the relative populations of each species, which are equivalent in a system of \ceAu4 clusters, provided the system is not dense enough for clusters to interact. We plot the logarithm of the equilibrium constant as a function of temperature in Fig.4(red circles). With increasing temperature, initially increases, and eventually becomes approximately flat, mirroring the flattening of the ratios in Fig. 3. Here we also observe that the transition between clusters should occur at where is zero.
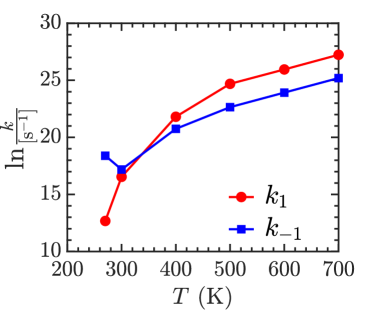
Transition state theory Peters (2017) may be used to calculate the transition rates at different temperatures. The dynamic transition between the metal cluster isomers is a first-order reaction, Imaoka et al. (2019) thus the expression of reaction rate is
| (6) |
Phrasing the reaction as
| (7) |
the forward and reverse rates are plotted in Fig.5. In general, with temperature increasing, and both increase, as is expected, since is relatively constant in magnitude over this temperature range, resulting in decrease of . The exception is the reverse reaction at , which is significantly faster than the same reaction at due to the much lower free energy barrier for the reverse reaction at . This type of feature would be expected for systems which are only marginally stable, and for which the second stable basin may disappear in this CV for low temperatures. This perspective is supported by the occupancy statistics, which show the Y isomer to be essentially unpopulated at .
To close these calculations, we note that we can compare the results of transition state theory to our occupancy-based results for using the relationship
| (8) |
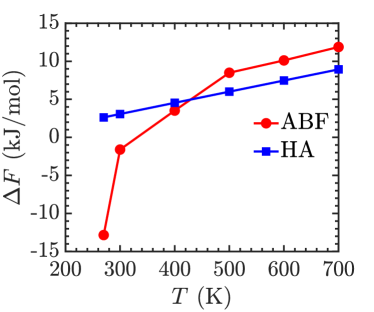
This quantity is plotted alongside our prior results in Fig. 4. We note that the two are in broad agreement, but that the the equilibrium constant that we calculate from Equ. 8 is a bit smaller in comparison to that calculated from occupancy statistics. This is primarily due to the fact that from ABF takes into account the relative weight of the whole basin, which favor more the entropy found in the Y-shaped isomer basin, though there could also be some small effects due to misalignment of the true reaction coordinate with that would cause to differ from the true activation energy. Since the differences are relatively small here, we can conclude that is a reasonable reaction coordinate for this transition.
To put these results within the context of typical ab-initio simulations, we utilize the widely applied harmonic approximation method (HA) Peters et al. (2019); Sethna (2021) to calculate the free energy difference to illustrate the differences which arise between the HA and more comprehensive sampling methods such as ABF. The HA assumes the conformational probability (partition function) may be broken down into contributions from translation , rotation and vibration along with an overall weight from the ground state energy of a given conformation according to Peters Peters et al. (2019) and Meng. Meng et al. (2010)
| (9) |
where labels the conformation of interest. The translational components are essentially equal, but rotational, vibrational, and ground state energies are necessarily different because of differences in the underlying symmetries, inertial axes, and potential energy landscape of each conformation. For the rotational component, Cole et al. (2001) we use the online ABC rotational constant calculator Shattuck to get the relative rotational constants A, B, C for and to plug into the relation
| (10) |
The vibrational component is calculated using Qbox to find the vibrational modes of the cluster, using finite difference calculations of the dynamical matrix, keeping the six highest frequency modes.iiiiiiiiiAll other modes are accounted for in the translational and rotational partition functions of the cluster. The six vibrational frequencies for are 35, 69, 86, 86, 143, and 162 and the six vibrational frequencies for are 21, 37, 86, 94, 156, and 203 We then use the quantum mechanical expressionPeters et al. (2019) for the vibrational free energy,
| (11) |
where the index runs over the different vibrational modes of interest. Finally, adding in the ground state energy difference computed using Qbox, , we arrive at the result plotted in Figure 6. Interestingly, while the ABF sampling shows a clear transition between the two clusters, the harmonic approximation uniformly favors the -shaped conformation, illustrating the key role played by entropy in these transitions, and the importance of using full free energy landscape sampling even in ab initio contexts.
Charged Clusters
As noted, in real catalysts, metal clusters are not always neutral, and in many processes, Green et al. (2021) the charge distribution will change dynamically due to the ligands and substrate interactions involved in the catalytic cycle.As an example, Qiao et al. Qiao et al. (2011) find that in the system, electrons transfer from a Pt atom to the substrates, resulting in positively charged single Pt atoms , which exhibits remarkable catalytic performance for CO oxidation and preferential oxidation. Similarly, Camellone et al Camellone and Fabris (2009) have found that in catalytic oxidation of CO using , the active gold atoms within the catalyst are positive ions. These species activate molecular CO and catalyze its oxidation. Interestingly, oxygen vacancies can attract supported positively charged and turn them into negatively charged . Since charge shifting plays a prominent role in catalytic processes, it is vital to investigate the effect of charge on the free energy of metal clusters. Here, we explore the influence that charge has on the conformational properties of \ceAu4 clusters in comparison to the neutral species.
We summarize our results in Fig. 7. Some clear differences are manifest in the charged systems. We focus here on \ceAu4+ and \ceAu4-, as previous researchers only find at most one positive charge or one negative charge on a small Au cluster for the catalysis process of Au clusters. Camellone and Fabris (2009); Khetrapal et al. (2018); Förstel et al. (2019); Jaeger et al. (2016) The first observed difference is the values of the two isomers. When neutral loses one electron and becomes positively charged, the values of the two isomers becomes smaller than those of the neutral cluster. This is somewhat surprising, since one would expect charges centered at the nuclei to be more repulsive thus expanding the cluster. However, this type of reasoning is inherently classical; the remaining electrons in the positive cluster create a cloud which is effectively smaller than the neutral case, and these localized negative charges act to draw the nuclei closer together. This leads to the decreasing of the values of the whole cluster. Interestingly, when neutral gains one extra electron and becomes negative charged, the values expand slightly, owing to the environment of the electron cloud pulling nuclei further apart. Notably, the effects are more pronounced for \ceAu4+ than for \ceAu4-. It is not clear how much these effects will generalize to larger clusters and higher valence, though it is likely the effects are more pronounced in the case of \ceAu4 than they would be in a larger cluster. Other factors, like the impact of electrostatic repulsion on the cluster size, must then also be considered.
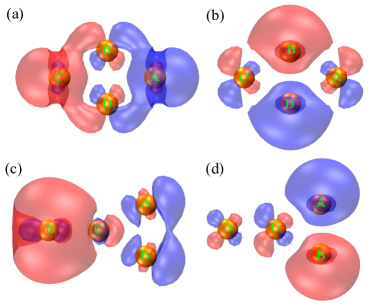
The explanation may be bolstered by analysing the HOMO (Highest Occupied Molecular Orbital) and LUMO (Lowest Unoccupied Molecular Orbital) of the clusters. Liu et al. (2013) For the rhombus isomer, the HOMO and LUMO have a similar anti-bonding "p-like" symmetry, but are located on different pairs of atoms, shown in Fig.8 (a) and (b). The HOMO orbital is mostly localized on atoms A and C, whereas the LUMO is mostly localized on atoms B and D. Adding one extra electron to the LUMO increases the occupation of an anti-bonding state between B and D, which makes the bond length of B and D larger, resulting in an increased . Removing one electron from the HOMO will reduce the occupation of an anti-bonding state between A and C, leading to the a smaller bond between A and C resulting in a smaller . The Y-shaped isomer’s HOMO and LUMO are shown in Fig.8 (c) and (d). The HOMO orbital is mostly localized on A, B and D, whereas the LUMO is mostly localized on A and B. Adding one extra electron to the LUMO increases the occupation of an anti-bonding state between A and B, makes the bond length of A and B larger resulting in a larger . Liu et al. (2013) Removing one electron from the HOMO will reduce the occupation of an anti-bonding state between A and D (or B and D), makes the bond length of A and D (or B and D) smaller and resulting in a smaller . This additionally breaks the symetry of the Y-shaped isomer.
A pronounced effect is also observed in the relative free energy of the two isomers. Compared with the neutral cluster, the relative free energy of Y-shaped isomer in increases significantly, and the Y-shaped isomer is metastable (and only weakly stable) at all studied temperatures; this is commensurate with our explanation relating cluster size to the electron cloud around the metal nuclei, which is unable to stretch as far when the cluster is positively charged. Similarly, the effect of the negative charge is to favor less compact structures, destabilizing the rhombus isomers at all studied temperatures. The relative difference in depth can be quite significant, meaning a cluster that becomes charged when in a stable rhombus (or Y shaped) configuration will experience a significant thermodynamic driving force toward the other conformation when gaining (or losing) an electron. Such effects could have pronounced influence on the effectiveness of nanoparticles in heterogenous catalysis, or the relative structure of nanoparticles capped by specific ligands, Scalise et al. (2018); Chevrier et al. (2018); Salorinne et al. (2020); Rusishvili et al. (2020); Jiang et al. (2020) and signify an important avenue for subsequent research.
Conclusion
In this work, we investigate the thermodynamic and structural properties of clusters (neutral, monoanionic, monocationic) in the gas phase by surveying the free energy landscape and the isomerization rates. From this, a few general conclusions may be reached. One is that temperature is an important factor in determining the likely conformations, as it greatly affects the stability of clusters with higher temperatures favoring larger entropy within the Y-shaped isomer. Exploring these free energy landscapes, we are able to quantitatively calculate the equilibrium constant and transition rates and of the isomerization reaction at different temperatures, observing an intriguing nonmonotonicity, as one of the clusters becomes less mechanically stable at lower temperatures. Further, a cluster’s charge significantly affects its preferred equilibrium energy in surprising ways, concomitantly affecting the relative free energy and stability of the two isomers. The dynamic charge distribution change in catalysis processes can impact the metal cluster’s geometric structures. These observations are enabled by exploration of the full free energy landscape available to the gold clusters using ab initio molecular dynamics and the ABF method; accounting for thermalization and entropy using only density functional theory and the harmonic approximation would have led to different conclusions.
Many other essential factors in the behavior of metal clusters remain to be explored in relation to experimental observations that typically take place near an interface, such as the influence of substrate geometry Camellone and Fabris (2009) and the presence of defect points. Imaoka et al. (2019) Apart from interconversion within one cluster’s multiple isomers, catalysis processes have more complicated cluster-to-cluster transformations, Ren et al. (2018) which make interesting targets for applications of these coupled ab initio and advanced sampling methods. Importantly, industrial catalysis widely uses alloy clusters, Li et al. (2021); León et al. (2018); Jian et al. (2017) and handling the thermodynamic and structural properties of complex alloys is thus essential and challenging. New advances in artificial intelligence and machine learning, Lamoureux et al. (2020); Deringer et al. (2021) have offered new solutions to study structural and transitional properties on complicated metal and alloy systems with faster computational speed while retaining accuracy, and offer the potential to build on the framework established here to study complex physical processes in nanoparticles.
Code Availability
Example scripts and information necessary to run the examples contained in this article are posted at https://github.com/shijiale0609/clustersFES. The Qbox code is available at http://qboxcode.org. SSAGES may be downloaded from http://ssagesproject.github.io.
Acknowledgement
JS, FG, and JKW acknowledge the support of MICCoM, the Midwest Center for Computational Materials, as part of the Computational Materials Sciences Program funded by the U.S. Department of Energy, Office of Science, Basic Energy Sciences, Materials Sciences and Engineering Division, for the development of algorithms and codes used within this work. Contributions of SH and JKW were additionally supported by the United States National Science Foundation (Award No. DMR-1751988). JS and JKW acknowledge the use of computational resources at the Notre Dame Center for Research Computing (CRC). JS and JKW thank Dr. Elizabeth M. Y. Lee (U. Chicago) for assistance and discussions.
References
- Li et al. (2013) Z.-W. Li, Z.-Y. Lu, Y.-L. Zhu, Z.-Y. Sun, and L.-J. An, RSC Adv. 3, 813 (2013), http://dx.doi.org/10.1039/C2RA22108J.
- Bianchi et al. (2015) E. Bianchi, A. Z. Panagiotopoulos, and A. Nikoubashman, Soft Matter 11, 3767 (2015), http://dx.doi.org/10.1039/C5SM00281H.
- Meng et al. (2010) G. Meng, N. Arkus, M. P. Brenner, and V. N. Manoharan, Science 327, 560 (2010), https://science.sciencemag.org/content/327/5965/560.
- Huang et al. (2020) S. Huang, M. J. Quevillon, S. Kyhl, and J. K. Whitmer, J. Chem. Phys. 152, 134901 (2020), https://doi.org/10.1063/1.5144984.
- He et al. (2020) M. He, J. P. Gales, É. Ducrot, Z. Gong, G.-R. Yi, S. Sacanna, and D. J. Pine, Nature 585, 524 (2020), https://doi.org/10.1038/s41586-020-2718-6.
- Wang et al. (2017) Y. Wang, I. C. Jenkins, J. T. McGinley, T. Sinno, and J. C. Crocker, Nat. Commun. 8, 1 (2017), https://doi.org/10.1038/ncomms14173.
- Chen et al. (2011) Q. Chen, J. K. Whitmer, S. Jiang, S. C. Bae, E. Luijten, and S. Granick, Science 331, 199 (2011), https://doi.org/10.1126/science.1197451.
- Zhai et al. (2005) H.-J. Zhai, B. Kiran, B. Dai, J. Li, and L.-S. Wang, J. Am. Chem. Soc. 127, 12098 (2005), pMID: 16117551, https://doi.org/10.1021/ja052618k.
- Zhai et al. (2008) H.-J. Zhai, L.-L. Pan, B. Dai, B. Kiran, J. Li, and L.-S. Wang, J. Phys. Chem. C 112, 11920 (2008), https://doi.org/10.1021/jp803161b.
- Liu et al. (2018) J.-X. Liu, I. A. Filot, Y. Su, B. Zijlstra, and E. J. Hensen, J. Phys. Chem. C 122, 8327 (2018), https://doi.org/10.1021/acs.jpcc.7b12711.
- Austin et al. (2015) N. Austin, J. K. Johnson, and G. Mpourmpakis, J. Phys. Chem. C 119, 18196 (2015), https://doi.org/10.1021/acs.jpcc.5b03459.
- Blaško et al. (2017) M. Blaško, T. Rajskỳ, and M. Urban, Chem. Phys. Lett. 671, 84 (2017), http://www.sciencedirect.com/science/article/pii/S0009261417300301.
- Chen et al. (2008) L. Chen, B. Chen, C. Zhou, J. Wu, R. C. Forrey, and H. Cheng, J. Phys. Chem. C 112, 13937 (2008), https://doi.org/10.1021/jp803504k.
- Lushchikova et al. (2019) O. V. Lushchikova, D. M. M. Huitema, P. López-Tarifa, L. Visscher, Z. Jamshidi, and J. M. Bakker, J. Phys. Chem. Lett. 10, 2151 (2019), pMID: 30977666, https://doi.org/10.1021/acs.jpclett.9b00539.
- Blaško et al. (2017) M. Blaško, T. Rajský, and M. Urban, Chem. Phys. Lett. 671, 84 (2017), ISSN 0009-2614, https://www.sciencedirect.com/science/article/pii/S0009261417300301.
- Häkkinen et al. (2003) H. Häkkinen, S. Abbet, A. Sanchez, U. Heiz, and U. Landman, Angew. Chem. Int. Ed. 42, 1297 (2003), https://onlinelibrary.wiley.com/doi/abs/10.1002/anie.200390334.
- Mills et al. (2003) G. Mills, M. S. Gordon, and H. Metiu, J. Chem. Phys. 118, 4198 (2003), https://doi.org/10.1063/1.1542879.
- Daniel and Astruc (2004) M.-C. Daniel and D. Astruc, Chem. Rev. 104, 293 (2004), pMID: 14719978, https://doi.org/10.1021/cr030698+.
- Yoon et al. (2005) B. Yoon, H. Häkkinen, U. Landman, A. S. Wörz, J.-M. Antonietti, S. Abbet, K. Judai, and U. Heiz, Science 307, 403 (2005), ISSN 0036-8075, https://science.sciencemag.org/content/307/5708/403.
- Pyykkö (2008) P. Pyykkö, Chem. Soc. Rev. 37, 1967 (2008), http://dx.doi.org/10.1039/B708613J.
- Häkkinen (2008) H. Häkkinen, Chem. Soc. Rev. 37, 1847 (2008), http://dx.doi.org/10.1039/B717686B.
- Freund et al. (2011) H.-J. Freund, G. Meijer, M. Scheffler, R. Schlögl, and M. Wolf, Angew. Chem. Int. Ed. 50, 10064 (2011), https://onlinelibrary.wiley.com/doi/abs/10.1002/anie.201101378.
- Beret et al. (2014) E. C. Beret, M. M. van Wijk, and L. M. Ghiringhelli, Int. J. Quant. Chem. 114, 57 (2014), https://onlinelibrary.wiley.com/doi/abs/10.1002/qua.24503.
- Liu et al. (2017) J.-X. Liu, Z. Liu, I. A. W. Filot, Y. Su, I. Tranca, and E. J. M. Hensen, Catal. Sci. Technol. 7, 75 (2017), http://dx.doi.org/10.1039/C6CY02277D.
- Lang et al. (2017) S. M. Lang, T. M. Bernhardt, V. Chernyy, J. M. Bakker, R. N. Barnett, and U. Landman, Angew. Chem. Int. Ed. 56, 13406 (2017), https://onlinelibrary.wiley.com/doi/abs/10.1002/anie.201706009.
- Imaoka et al. (2019) T. Imaoka, T. Toyonaga, M. Morita, N. Haruta, and K. Yamamoto, Chem. Commun. 55, 4753 (2019), http://dx.doi.org/10.1039/C9CC00530G.
- Bonačić-Kouteckỳ et al. (2002) V. Bonačić-Kouteckỳ, J. Burda, R. Mitrić, M. Ge, G. Zampella, and P. Fantucci, J. Chem. Phys. 117, 3120 (2002), https://doi.org/10.1063/1.1492800.
- Böyükata and Belchior (2008) M. Böyükata and J. C. Belchior, J. Braz. Chem. Soc. 19, 884 (2008), https://doi.org/10.1590/S0103-50532008000500012.
- Goldsmith et al. (2019) B. R. Goldsmith, J. Florian, J.-X. Liu, P. Gruene, J. T. Lyon, D. M. Rayner, A. Fielicke, M. Scheffler, and L. M. Ghiringhelli, Phys. Rev. Mater. 3, 016002 (2019), https://link.aps.org/doi/10.1103/PhysRevMaterials.3.016002.
- Liu et al. (2016) J.-C. Liu, Y. Tang, C.-R. Chang, Y.-G. Wang, and J. Li, ACS Catal. 6, 2525 (2016), https://doi.org/10.1021/acscatal.6b00021.
- Wang et al. (2015) Y.-G. Wang, D. Mei, V.-A. Glezakou, J. Li, and R. Rousseau, Nat. Commun. 6, 1 (2015), https://doi.org/10.1038/ncomms7511.
- Xing et al. (2006) X. Xing, B. Yoon, U. Landman, and J. H. Parks, Phys. Rev. B 74, 165423 (2006), https://link.aps.org/doi/10.1103/PhysRevB.74.165423.
- Bulusu et al. (2006) S. Bulusu, X. Li, L.-S. Wang, and X. C. Zeng, Proc. Natl. Acad. Sci. USA 103, 8326 (2006), https://www.pnas.org/content/103/22/8326.
- Kryachko and Remacle (2007) E. S. Kryachko and F. Remacle, Int. J. Quant. Chem. 107, 2922 (2007), https://onlinelibrary.wiley.com/doi/abs/10.1002/qua.21504.
- Olson and Gordon (2007) R. M. Olson and M. S. Gordon, J. Chem. Phys. 126, 214310 (2007), https://doi.org/10.1063/1.2743005.
- Arslan and Güven (1998) H. Arslan and M. Güven, ARI 51, 145 (1998), https://doi.org/10.1007/s007770050047.
- Garzón et al. (1997) I. Garzón, I. Kaplan, R. Santamaria, B. Vaisberg, and O. Novaro, Zeitschrift für Physik D Atoms, Molecules and Clusters 40, 202 (1997), https://doi.org/10.1007/s004600050194.
- Liu et al. (2000) Z. Liu, W. Yim, J. Tse, and J. Hafner, Eur. Phys. J. D 10, 105 (2000), https://doi.org/10.1007/s100530050530.
- Zhang et al. (2019) C. Zhang, H. Duan, X. Lv, B. Cao, A. Abliz, Z. Wu, and M. Long, Sci. Rep. 9, 1 (2019), https://doi.org/10.1038/s41598-019-44055-z.
- Bravo-Pérez et al. (1999) G. Bravo-Pérez, I. Garzón, and O. Novaro, Chem. Phys. Lett. 313, 655 (1999), https://www.sciencedirect.com/science/article/pii/S0009261499009574.
- Lee et al. (2021) E. M. Y. Lee, T. Ludwig, B. Yu, A. R. Singh, F. Gygi, J. K. Nørskov, and J. J. de Pablo, J. Phys. Chem. Lett. 12, 2954 (2021), pMID: 33729797, https://doi.org/10.1021/acs.jpclett.1c00195.
- Camellone and Fabris (2009) M. F. Camellone and S. Fabris, J. Am. Chem. Soc. 131, 10473 (2009), pMID: 19722624, https://doi.org/10.1021/ja902109k.
- Li et al. (2003) J. Li, X. Li, H.-J. Zhai, and L.-S. Wang, Science 299, 864 (2003), ISSN 0036-8075, https://science.sciencemag.org/content/299/5608/864.
- Sevgen et al. (2018) E. Sevgen, F. Giberti, H. Sidky, J. K. Whitmer, G. Galli, F. Gygi, and J. J. de Pablo, J. Chem. Theory Comput. 14, 2881 (2018), pMID: 29694787, https://doi.org/10.1021/acs.jctc.8b00192.
- (45) All required input files are available via GitHub at https://github.com/shijiale0609/clustersFES.
- Gygi (2008) F. Gygi, IBM J. Res. Dev. 52, 137 (2008).
- Sidky et al. (2018) H. Sidky, Y. J. Colón, J. Helfferich, B. J. Sikora, C. Bezik, W. Chu, F. Giberti, A. Z. Guo, X. Jiang, J. Lequieu, et al., J. Chem. Phys. 148, 044104 (2018), ISSN 00219606, http://aip.scitation.org/doi/10.1063/1.5008853.
- Govoni et al. (2021) M. Govoni, J. Whitmer, J. de Pablo, F. Gygi, and G. Galli, npj Comput. Mater. 7, 1 (2021).
- Schlipf and Gygi (2015) M. Schlipf and F. Gygi, Comput. Phys. Commun. 196, 36 (2015), ISSN 0010-4655, https://www.sciencedirect.com/science/article/pii/S0010465515001897.
- (50) While the choice of the energy cutoff has a nominal effect on ground state calculations for these two configurations (which are within approximately of each other), we have verified that this choice does not significantly affect the free energy landscapes which are dominated more by entropy and multiplicity of locally available states.
- Bussi et al. (2007) G. Bussi, D. Donadio, and M. Parrinello, J. Chem. Phys. 126, 014101 (2007).
- Peters (2017) B. Peters, Reaction Rate Theory and Rare Events (Elsevier, 2017), http://www.sciencedirect.com/science/article/pii/B9780444563491000118.
- Bussi and Laio (2020) G. Bussi and A. Laio, Nat. Rev. Phys. 2, 200 (2020).
- Darve et al. (2008) E. Darve, D. Rodríguez-Gómez, and A. Pohorille, J. Chem. Phys. 128, 144120 (2008), https://doi.org/10.1063/1.2829861.
- Beret et al. (2011) E. C. Beret, L. M. Ghiringhelli, and M. Scheffler, Faraday Discuss. 152, 153 (2011), http://dx.doi.org/10.1039/C1FD00027F.
- Machta (2009) J. Machta, Phys. Rev. E 80, 056706 (2009), https://link.aps.org/doi/10.1103/PhysRevE.80.056706.
- Raiteri et al. (2006) P. Raiteri, A. Laio, F. L. Gervasio, C. Micheletti, and M. Parrinello, J. Phys. Chem. B 110, 3533 (2006).
- Peters et al. (2019) L. D. M. Peters, J. C. B. Dietschreit, J. Kussmann, and C. Ochsenfeld, J. Chem. Phys. 150, 194111 (2019), https://doi.org/10.1063/1.5079643.
- Sethna (2021) J. Sethna, Statistical mechanics: entropy, order parameters, and complexity, vol. 14 (Oxford University Press, USA, 2021).
- Cole et al. (2001) J. C. Cole, J. W. Yao, G. P. Shields, W. Motherwell, F. H. Allen, and J. A. Howard, Acta Crystallogr. B 57, 88 (2001).
- (61) T. W. Shattuck, Abc rotational constant calculator, https://www.colby.edu/chemistry/PChem/scripts/ABC.html.
- (62) All other modes are accounted for in the translational and rotational partition functions of the cluster. The six vibrational frequencies for are 35, 69, 86, 86, 143, and 162 and the six vibrational frequencies for are 21, 37, 86, 94, 156, and 203 .
- Green et al. (2021) A. E. Green, A. S. Gentleman, W. Schöllkopf, A. Fielicke, and S. R. Mackenzie, Phys. Rev. Lett. 127, 033002 (2021), https://link.aps.org/doi/10.1103/PhysRevLett.127.033002.
- Qiao et al. (2011) B. Qiao, A. Wang, X. Yang, L. F. Allard, Z. Jiang, Y. Cui, J. Liu, J. Li, and T. Zhang, Nat. Chem. 3, 634 (2011), https://doi.org/10.1038/nchem.1095.
- Khetrapal et al. (2018) N. S. Khetrapal, L.-S. Wang, and X. C. Zeng, J. Phys. Chem. Lett. 9, 5430 (2018), https://doi.org/10.1021/acs.jpclett.8b02372.
- Förstel et al. (2019) M. Förstel, W. Schewe, and O. Dopfer, Angew. Chem. 131, 3394 (2019), https://doi.org/10.1002/anie.201813094.
- Jaeger et al. (2016) B. K. A. Jaeger, M. Savoca, O. Dopfer, and N. X. Truong, Int. J. Mass Spectrom. 402, 49 (2016), http://dx.doi.org/10.1016/j.ijms.2016.02.019.
- Liu et al. (2013) Z. Liu, Z. Qin, H. Xie, R. Cong, X. Wu, and Z. Tang, J. Chem. Phys. 139, 094306 (2013), https://doi.org/10.1063/1.4819789.
- Scalise et al. (2018) E. Scalise, V. Srivastava, E. Janke, D. Talapin, G. Galli, and S. Wippermann, Nat. Nanotechnol. 13, 841 (2018).
- Chevrier et al. (2018) D. M. Chevrier, V. D. Thanthirige, Z. Luo, S. Driscoll, P. Cho, M. A. MacDonald, Q. Yao, R. Guda, J. Xie, E. R. Johnson, et al., Chem. Sci. 9, 2782 (2018), http://dx.doi.org/10.1039/C7SC05086K.
- Salorinne et al. (2020) K. Salorinne, R. W. Y. Man, P. A. Lummis, M. S. A. Hazer, S. Malola, J. C.-H. Yim, A. J. Veinot, W. Zhou, H. Häkkinen, M. Nambo, et al., Chem. Commun. 56, 6102 (2020), http://dx.doi.org/10.1039/D0CC01482F.
- Rusishvili et al. (2020) M. Rusishvili, S. Wippermann, D. V. Talapin, and G. Galli, Chem. Mater. 32, 9798 (2020), https://doi.org/10.1021/acs.chemmater.0c03939.
- Jiang et al. (2020) T. Jiang, G. Qu, J. Wang, X. Ma, and H. Tian, Chem. Sci. 11, 3531 (2020), http://dx.doi.org/10.1039/D0SC00473A.
- Ren et al. (2018) X. Ren, J. Fu, X. Lin, X. Fu, J. Yan, C. Liu, J. Huang, et al., Dalton Trans. 47, 7487 (2018), http://dx.doi.org/10.1039/C8DT01417E.
- Li et al. (2021) Y. Li, S. Li, A. V. Nagarajan, Z. Liu, S. Nevins, Y. Song, G. Mpourmpakis, and R. Jin, Journal of the American Chemical Society 143, 11102 (2021), ISSN 0002-7863, https://pubs.acs.org/doi/10.1021/jacs.1c04606.
- León et al. (2018) I. León, F. Ruipérez, J. M. Ugalde, and L.-S. Wang, J. Chem. Phys. 149, 144307 (2018), https://doi.org/10.1063/1.5040336.
- Jian et al. (2017) T. Jian, L. F. Cheung, J. Czekner, T.-T. Chen, G. V. Lopez, W.-L. Li, and L.-S. Wang, Chem. Sci. 8, 7528 (2017), http://dx.doi.org/10.1039/C7SC02881D.
- Lamoureux et al. (2020) P. S. Lamoureux, T. S. Choksi, V. Streibel, and F. Abild-Pedersen, arXiv preprint arXiv:2005.02572 (2020).
- Deringer et al. (2021) V. L. Deringer, N. Bernstein, G. Csányi, C. B. Mahmoud, M. Ceriotti, M. Wilson, D. A. Drabold, and S. R. Elliott, Nature 589, 59 (2021), https://doi.org/10.1038/s41586-020-03072-z.