Predicting damage in aggregates due to the volume increase of the alkali-silica reaction products
Abstract
Volume increase between the reactants and the products of alkali silica reaction could reach up to . Taking place inside the aggregates, ASR imposes internal pressure on the surrounding material. In the current paper, we study the possibility of crack growth due to such internal loading. This study is done by employing a semi-analytical mechanical model comprising an elastic solution to a well-known Eshelby problem and a linear elastic fracture mechanics solution to a ring-shaped crack encircling a spheroidal inclusion. The proposed method implies the availability of pre-existing micro-fissures within the aggregate.
The study reveals dependence of the crack growing potential on the spheroid’s shape: the larger is the ASR pocket - the longer crack it can open. Two most critical shapes, causing a highest stress intensity factor and developing the longest crack, are a sphere and a spheroid with aspect ratio respectively. The size analysis of the problem suggests a critical spheroid’s radius below which no crack growth is expected. For a chosen material properties and expansion value, such radius lays in the range between and . Independently of the expansion value and the shape of the pocket of ASR product, the maximum crack length has a power-law dependence on the size of a spheroid.
All the theoretical predictions are confirmed by a numerical model based on the combination of the finite element method and cohesive element approach.
keywords:
Alkali-silica reaction , volume increase , Eshelby problem , cohesive element1 Introduction
Alkali-silica reaction (ASR) in concrete is the reaction between \ceSiO2 contained in aggregates and alkalies coming from the cement paste [Swamy, 2003]. ASR products accumulate within the aggregate leading to build-up of stress, expansion of concrete and evolution of cracks. ASR causes substantial damage to the concrete infrastructure worldwide.
The size of the initial ASR products, before aggregates cracks, is in the range of s of nanometres to a few micrometres. They form between adjacent mineral grains within reactive aggregates close to the border with the cement paste [Leemann et al., 2016, Leemann and Münch, 2019]. Shapes of the expanding products are highly irregular as a result of aggregate porosity and pre-existing defects that are common in aggregates. This primary ASR product yields internal loading on aggregates leading to cracking. Resulting cracks originate in the aggregates and extend into cement paste. Opening of cracks could be much larger than the initial ASR product size and pre-existing cracks. As reaction advances, the alkali front moves inwards the aggregates, producing more and more ASR sites. The newly formed cracks start to fill with the secondary ASR products.
The most widely reported hypothesis for the expansion of concrete caused by ASR is swelling of the ASR products due to the absorbance of water. Recent water uptake measurements on synthetic ASR products, however, indicate a very limited water uptake [Shi et al., 2019]. This suggests that ASR expansion is not caused by swelling of the ASR products but by alternative mechanisms. Even if the underlying mechanism for expansion is not known, it is clear that the formation of ASR products leads to an increase in molar volume. ASR products, commonly reported in the literature, precipitate as an amorphous gel. However, it has been shown that in addition to amorphous ASR product, the one present in large cracks within aggregates could be crystalline [Cole and Lancucki, 1983, De Ceukelaire, 1991, Dähn et al., 2016, Leemann et al., 2020].
The goal of this study is to verify the hypothesis if the gel-like ASR product could initiate cracks due to expansion. If this is the case, the role of the shape and size of the pocket of ASR product in this process is to be investigated. First, the responsible chemical reaction is identified and the increase in the volume of the products over the reactants is computed. Then, a semi-analytical mechanical model for an expanding ASR pocket surrounded by a pre-existing micro-crack is formulated. Crack extension is predicted for the ASR pockets of different sizes, shapes and expansion values. Finally, the predictions are verified by a numerical finite element model.
2 Methods
2.1 Chemical reaction
A typical ASR formation reaction could be written as
| (1) |
which describes the formation of an ASR product with molar ratios K/Si and Ca/Si of . These ratios correspond to the elemental ratios observed in ASR products in field samples as well as to those observed in laboratory synthesised ASR products [Leemann and Lura, 2013, Shi et al., 2019, 2020].
Assuming quartz or amorphous \ceSiO2 as silica source, it is possible to calculate the increase of solid volume if ASR products are formed within the space originally occupied by \ceSiO2. Note that other species (\ceK+, \ceCa^2+, \ceOH-, and \ceH2O), needed to form ASR products, are assumed to diffuse into the aggregate from the cement pore solution, such that their volume is not considered. Based on the molar volume of quartz ( cm3/mol), and the volume of crystalline ASR product K-shlykovite, \ceKCa[Si4O9(OH)] * 3H2O, of cm3/mol [Geng et al., 2020] (or cm3/mol if normalised to silica: \ceK_0.25Ca_0.25[SiO_2.25(OH)_0.25] * 0.75H2O) an increase in solid volume by a factor of two is obtained, and a ratio between the additional volume () and the initial volume is , thus leading to expansion. For amorphous ASR products, the molar volume has not been measured, but based on the extensive analysis performed in [Leemann et al., 2020], amorphous ASR product with a composition of \ceNa_0.1K2_0.2Ca2_0.2SiO_2.3(OH)_0.1 * 1.1H2O indicates a similar or even higher volume increase () as for crystalline ASR product. The duplication of the initial volume due to the precipitation of ASR product could potentially lead to formation of cracks within aggregates. This hypothesis was studied in details based on the semi-analytical mechanical model of an inclusion expanding within an infinite medium.
The generation of crystallisation pressures due to over-saturation of the surrounding solution during the formation of ASR cannot be excluded as a possible expansion mechanism. This direction is not further investigated in the present paper as no solution measurements are available, making a reliable estimation of maximum crystallisation pressures presently not possible.
2.2 Analytical model of expanding ASR pockets
Dependence of the possible crack growth on the size and shape of ASR products is studied by exploring a semi-analytical mechanical model, which consists of two components. The first one is a purely analytical model for an inclusion expanding within an infinite medium. The second one is a semi-analytical model of a ring-shaped crack encircling the previously described inclusion. The final model yields stress concentrations at the external crack tip that are used to evaluate the crack growth. A pocket of ASR product is assumed to have an ellipsoidal shape since the latter comprises a wide range of shapes with central symmetry (e.g. spheres, oblate spheroids, disks, etc).
The departing point of the analytical model is the Eshelby problem [Eshelby, 1959], which describes an expanding ellipsoidal inclusion embedded in an infinite medium. The term “inclusion” implies that its elastic properties differ from the ones of the matrix. The inclusion represents a single pocket of ASR product surrounded by the aggregate. Here we assume a relatively small ASR pockets positioned sufficiently far from the aggregate’s boundary not to cause mechanical influence, which justifies the “infinite surrounding medium” condition. Given the known expansion of the inclusion, mechanical properties of the ASR product and the aggregate, their shapes and sizes, the stress and strain fields could be determined. The problem was solved by Eshelby [1959, 1957] for general eigen strains. The solutions for the inclusion and the matrix are different. Later Mura [1987] provided explicit equations for the Eshelby tensor for different shapes of an ellipsoid at the interior points. Ju and Sun [1999, 2001] gave the first explicit formulas for computing the Eshelby tensor in the surrounding matrix. Healy [2009] developed a MATLABTM code with the Eshelby solution in 3D both inside and outside the inclusion.
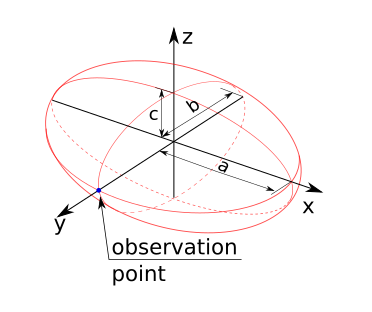
The elliptic inclusion with semi-axes , and (shown in Fig. 1) is embedded in a matrix. In this study, we have considered a spheroidal shape with the equatorial radius . Variation of the semi-axis allows to consider different geometries: 1) sphere (); 2) needle (); 3) penny (). The expansion is applied at the inclusion in the form of eigen strain - strain causing zero stress under no confinement. The eigenstrain is linked to the elastic strain as
| (2) |
where is the total strain. The matrix is an infinite body with remote stress or strain applied. In the current study, we assume stress-free body with and equal to zero. The effect of external loading on ASR was previously studied by multiple authors [e.g. Larive, 1997, Multon and Toutlemonde, 2006, Dunant and Scrivener, 2012].
Strain and stress inside the inclusion are given by [Ju and Sun, 2001]
| (3) |
where is the 4th-order Eshelby tensor for interior points, the matrix stiffness tensor and the identity tensor. The particular property of the Eshelby’s problem is that the stress and strain fields at the interior points are uniform and the Eshelby tensor is independent of the position within the inclusion.
Oppositely, for the external field, strain and stress at a point depend on its position:
| (4) |
where is a 4th-order Eshelby tensor for exterior points.
2.3 Semi-analytical model with a ring-shaped crack
Griffith [1921] in his fundamental work showed that the material strength at the macro-scale is largely affected by the presence of the microscopic flaws. For an expanding inclusion, to grow a crack from its surface, there should be an initial micro-fissure which would facilitate the crack propagation. Higher expansion would be required if such an inclusion would be surrounded by sound material with no pre-existing flaws. Pre-existing defects in the form of microcracks are common in aggregates.
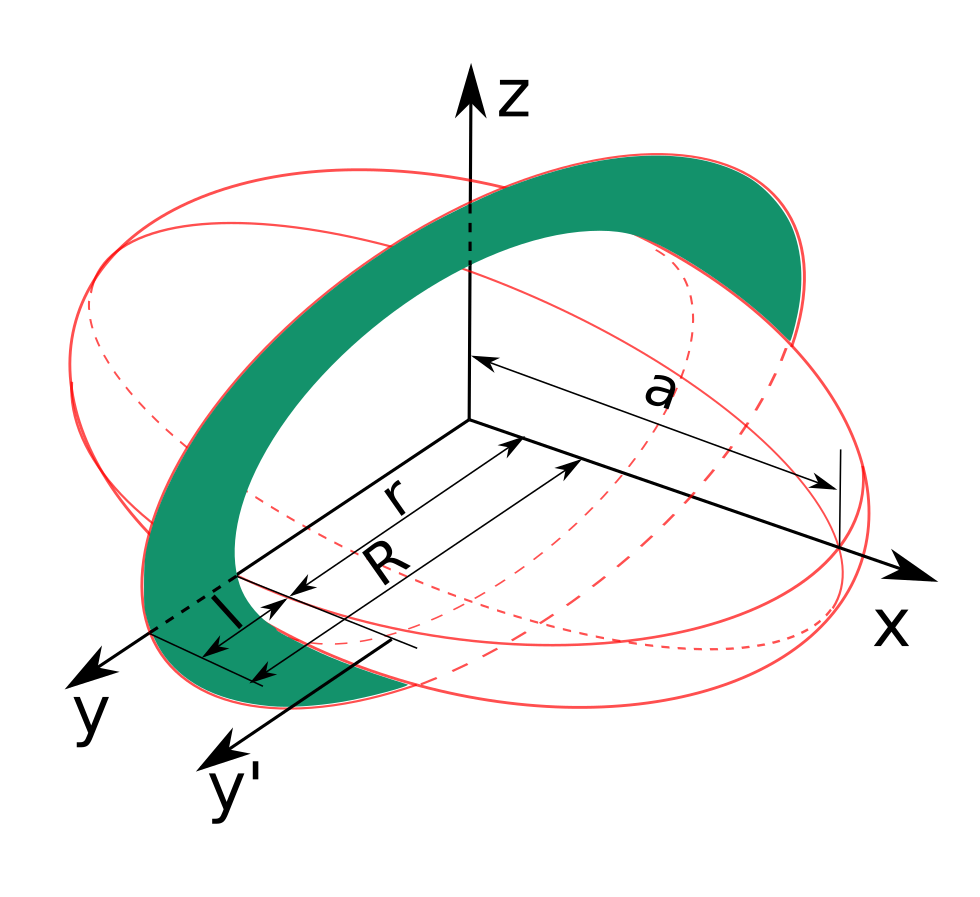
A crack is added to the Eshelby problem as shown in Fig. 2. It has a shape of a flat ring in the -plane. While the inner crack tip lays exactly on the surface of the spheroid, the outer one extends to the distance from the surface. and denote the internal and external crack radii correspondingly. An additional -axis was introduced for illustration purpose: it is a -axis with the origin shifted to the surface of the spheroid. The crack is opening in mode I under the loading symmetric with respect to the crack plane.
Keeping the expansion value fixed, different alignment of a crack would reduce the probability of its extension.
According to the adopted model, the inclusion is always expanding as a solid body. When the crack extends, the ASR product does not flow inside. Therefore this model represents the ASR product in its mature stage. Accounting for the gel fluidity would require an enriched analytical model including mass conservation and pressure redistribution.
To evaluate the crack growth, one has to know - stress intensity factor (SIF) in mode I for the external crack tip. The principle of superposition states that applying on the crack faces is similar to loading the cracked body with loads that cause in the absence of a crack [Petroski and Achenbach, 1978]. To find , we replace the problem of a crack loaded by a spheroidal inclusion by a crack with its faces loaded by the stresses caused by the inclusion in the absence of the crack. The latter ones are known from the Eshelby solution.
Literature has few analytical solutions for computing for ring-shaped cracks under simple loading (e.g. Tada et al. [2000]). Unfortunately, solutions for a general stress distribution are not available. Instead, this problem could be solved by means of weight functions, as proposed by Bueckner [1970] and Rice [1972]. These authors suggested to use the known crack face displacement and the known stress intensity factor for a symmetrical load system on a cracked body to compute unknown for any other symmetrical load system. The equation for SIF reads as
| (5) |
where is a weight function defined as
| (6) |
In Eqs. 5 and 6, is the crack length equal to the difference between the external and internal radii , is a material parameter, is the stress distribution along the crack plane in the unflawed body under the load associated to . Integration is carried out along the crack surface only. Fett and Rizzi [2007] computed weight functions for a ring-shaped crack by the interpolating procedure. The latter is the reason for solution being “semi-analytical”. The weight function for the outer crack tip reads as
| (7) |
Plugging Eq. 7 and the stresses from LABEL:eq:str_outside into Eq. 5 and integrating it numerically results in required values of . Similar approach was previously used by Iskhakov et al. [2019] within a multi-scale model. This solution is built on the principles of linear elastic fracture mechanics (LEFM).
2.4 Numerical validation
Analytical and semi-analytical predictions are validated through numerical modelling. Two components of the final solution are verified. The first component is the elastic stresses in the inclusion’s surroundings in the absence of the crack. The second component is the actual crack radius for different inclusion shapes and sizes. The numerical model is based on the finite element method (FEM). All the simulations are performed using the open-source parallel FE library Akantu [Richart and Molinari 2015, akantu.ch].
The geometry used for the numerical model is shown in Fig. 3. It comprises one quarter of the full space. Symmetry over and planes is established by imposing zero out-of-plane displacements. The simulated block comprises one quarter of the spheroidal inclusion and the surrounding aggregate. The equatorial radius of the spheroid is , while the dimensions of the full block are . Behaviour of the bulk materials (aggregate and inclusion) is linear elastic.
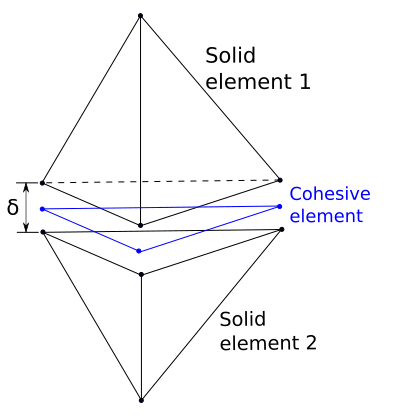
For verification of the maximum crack radius, the crack plane is added to the FE model along the plane. The discontinuity is modelled by cohesive elements approach. The latter yields to dissipation of the fracture energy by interface elements placed between neighbouring solid elements (see Fig. 4(a)). When two solid elements are being pulled apart, a cohesive element in-between resists by generating the inwards traction whose amplitude depends on the opening. The cohesive elements represent the non-linear process zone (or cohesive zone) at a crack tip, as originally proposed by Dugdale [1960] and Barenblatt [1962].
Behaviour of cohesive elements is stipulated through the traction-separation law. For the current study, a bi-linear traction-separation law, shown in Fig. 4(b), is employed. For the cohesive opening, , below the elastic limit , a cohesive element behaves in a linear elastic manner. After the traction reaches the material strength in tension , it decreases linearly, capturing material softening. The latter takes place up to a moment when opening reaches its critical value . Then the element is fully broken. If the loading is removed when the element is in the softening stage (), its behaviour becomes elastic again within the window . Under compression, cohesive elements behave elastically with a penalty coefficient . Opening of a cohesive element dissipates energy . The maximum value that can be dissipated upon reaching the critical opening equals the fracture energy . The latter could be computed from the fracture toughness as
| (8) |
where is the Young’s modulus of surrounding material. It is assumed that no friction is present and only normal opening of cohesive elements takes place.
For a cohesive element model to converge to the LEFM solution, several requirements have to be fulfilled. The size of the cohesive zone, , has to be smaller than all other model length scales (sizes of the inclusion, the crack and the domain). The crack size itself has to be smaller than the domain size. From the numerical side, the cohesive zone has to be sufficiently resolved and comprise several cohesive elements. Size of the cohesive zone can be estimated as:
| (9) |
For an inclusion of radius and a domain of size, a cohesive zone was picked. The mesh along the crack plane was densified down to , which allowed to have multiple elements within the cohesive zone. The cohesive elements are inserted along the pre-defined plane in the beginning of the simulation.
3 Results
The theoretical predictions of stresses and crack radii are computed for different inclusion shapes and sizes. The theory is then validated by comparing with the numerical model.
3.1 Stresses in the bulk
To compute the stresses, material properties given in Table 1 are used. Due to unavailability of the mechanical properties of the amorphous ASR product, those of the crystalline state are taken.
| Material properties | ASR product* | Aggregate | Cohesive material |
| Young’s modulus , [GPa] | - | ||
| Poisson’s ratio , [-] | - | ||
| Fracture toughness , [MPa m1/2] | - | - | |
| Fracture energy , [J/m2] | - | - | |
| Tensile strength , [MPa] | - | - | |
| Elastic opening , [] | - | - | |
| Critical opening , [] | - | - |
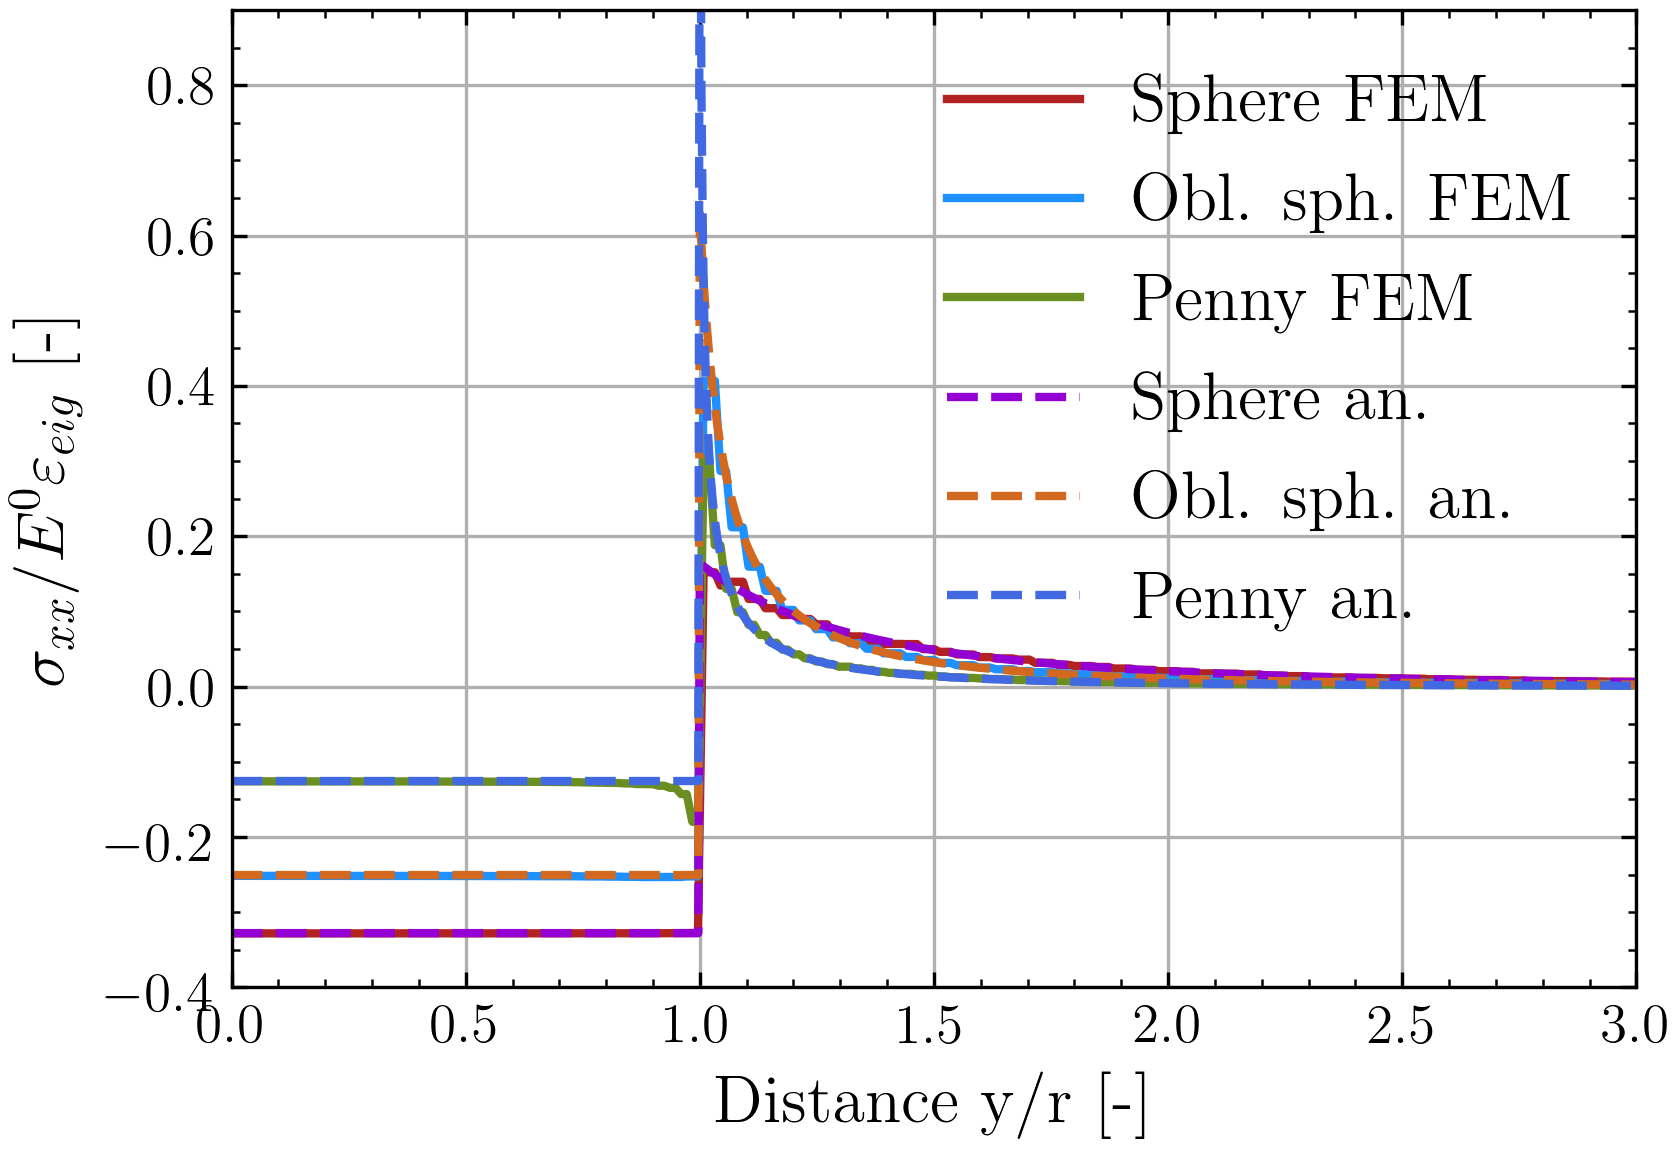
The solution for the principal stresses inside and outside the inclusion is given in Fig. 5.
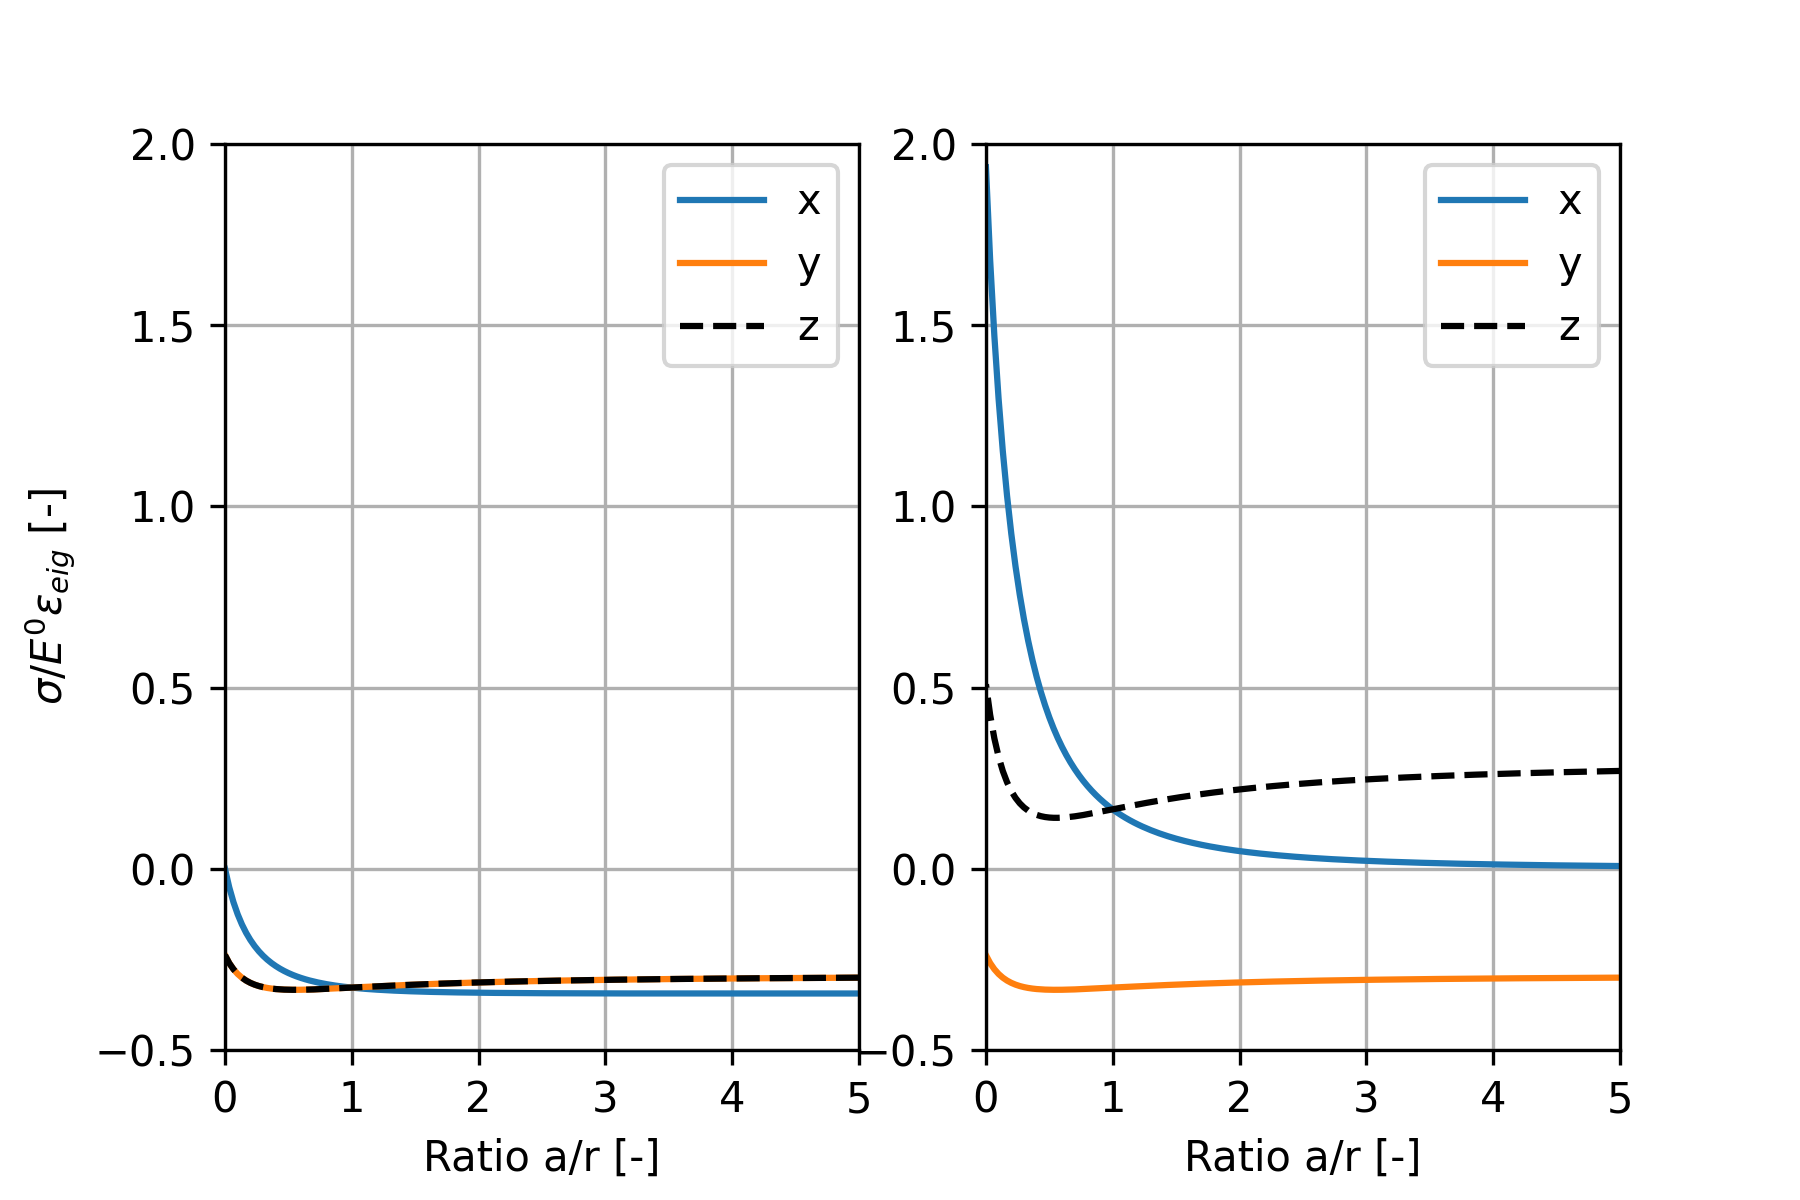
Stresses at the interior points are independent of the point’s position. Stresses in the matrix are plotted at the intersection point between the -axis and the surface of the ellipsoid (see the observation point in Fig. 1). The semi-axis is varied from almost zero to five times the equatorial radius , changing from a penny to a sphere and finally to a needle. Stresses inside the inclusion are always compressive, becoming hydrostatic () in the spherical configuration. When approaching the disk limit, stress in the direction normal to the disk plane tends towards zero. The stress state in the matrix is different. While the stress in -direction is still compressive, the other two stresses are either null or tensile. This creates necessary premises for crack appearance. In the spherical set-up, tensile stresses in - and -directions are equal, which makes any plane passing through the -axis suitable for the crack growth. In the penny-shape limit (), intensifies making -plane preferable for a crack to grow. Since we expect the gel inclusions to have a flat shape, we will limit our analysis to cases when changes from zero to one.
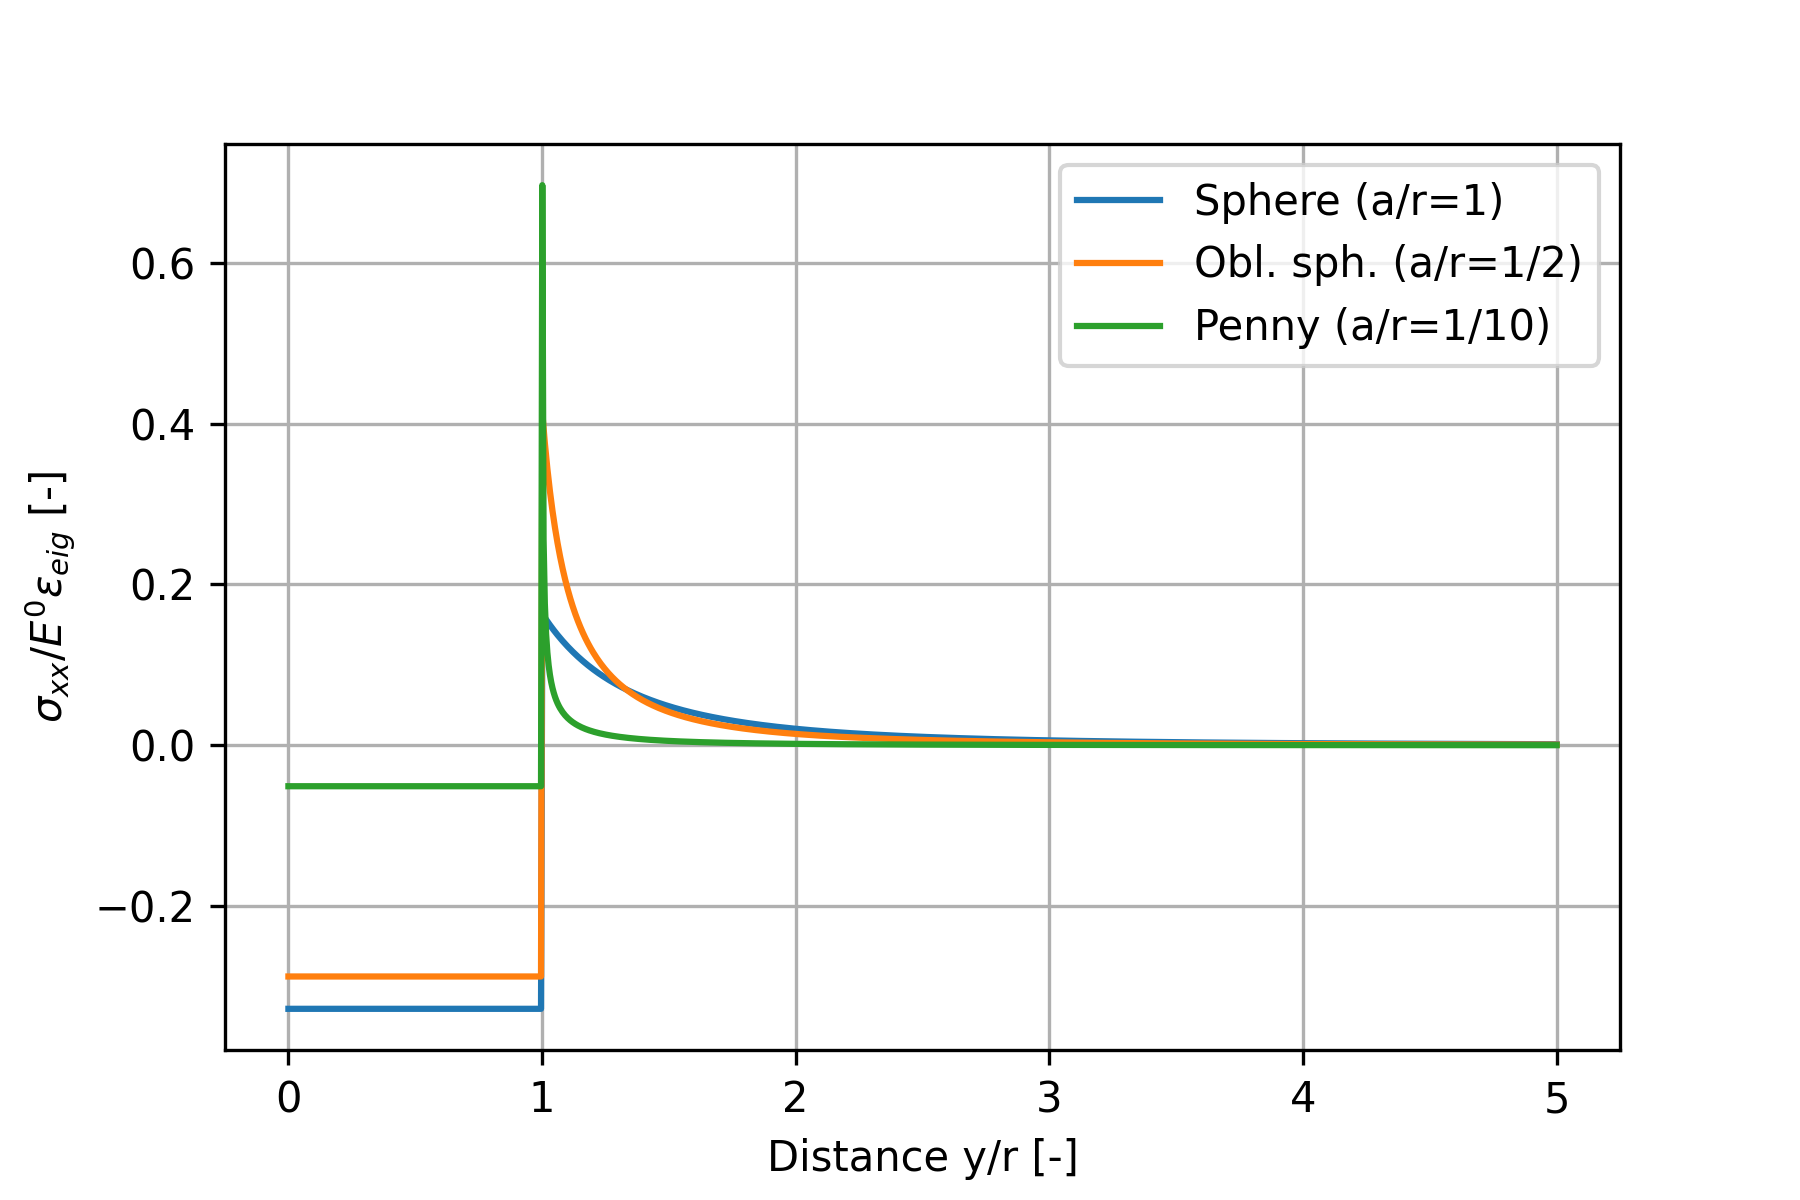
Stresses along the -axis for three different shapes of the inclusion are plotted in Fig. 6. Although the disk shape has a tensile stress at the border much larger than a sphere, it decays much faster. For the spherical configuration (), the stress drops with rate , which matches a well-known analytical solution [Timoshenko and Goodier, 1951, p. 417].
A particularity of the Eshelby solution is its size independence: both small and large inclusions under the same expansion value will generate similar stress and strain fields.
Numerical solution for the stresses along the -axis fairly matches the analytical predictions. Comparison between two sets of results are plotted in Fig. 11 of Appendix. In this solution, no crack is present in the simulation. The only difference between two methods is observed at the boundary, where FEM cannot represent the stress singularity for oblate shapes. Refining the mesh improves the solution. The stress decay further from the inclusion surface is perfectly resolved.
3.2 Crack radius
The crack is added to the previous problem by means of cohesive elements. The parameters of the cohesive law are listed in Table 1. In order to have a small and preserve the fracture energy, the tensile strength had to be assigned a high value and the critical opening had to be adjusted.
Expansion of the inclusion leads to concentration of stresses at the crack tip. The intensity of this concentration is characterised by the stress intensity factor. Solutions for depending on the spheroid shape and the crack radius are plotted in Fig. 7. The equatorial radius of the inclusion in this plot equals m. normalised by the fracture toughness serves as an indicator for crack growth. While values of above one suggest that the crack will extend, strict equality to one indicates the crack radius at which the growth will cease.
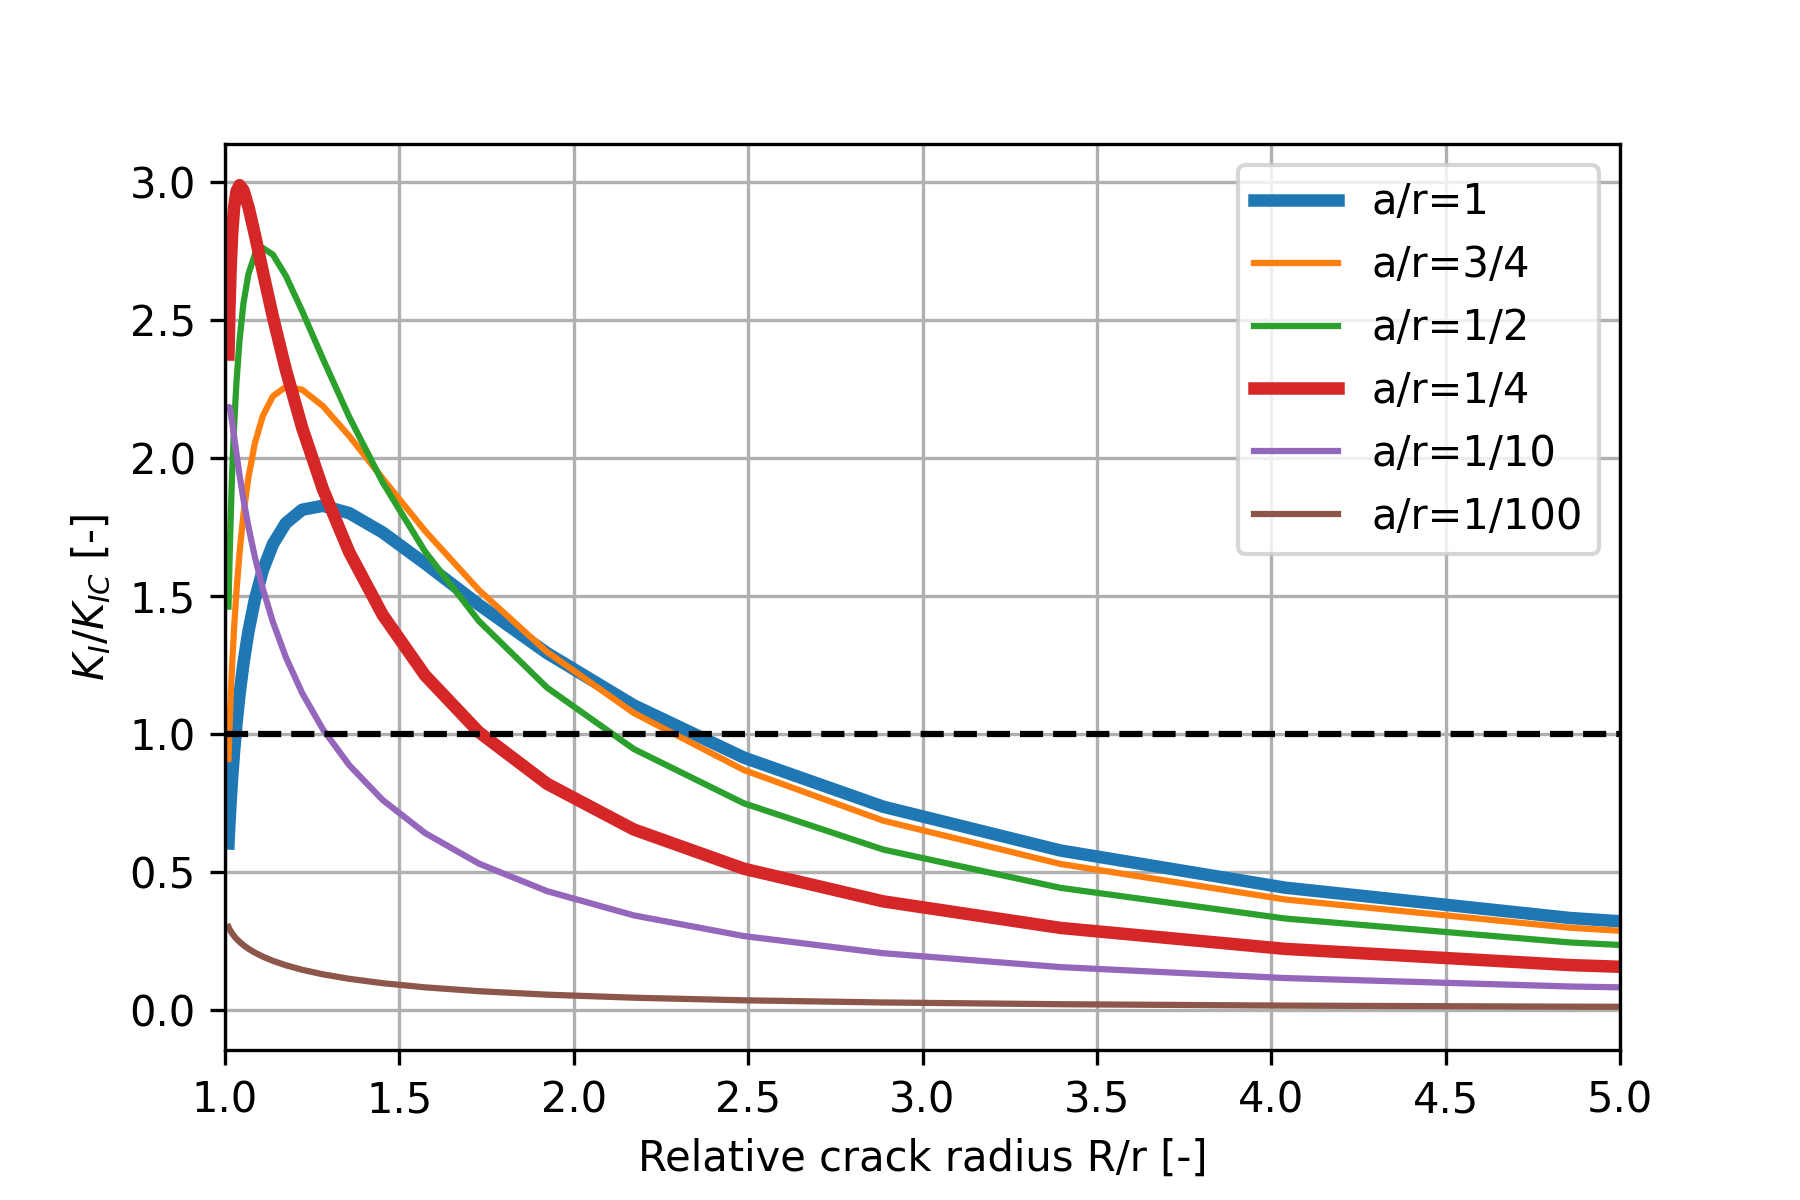
All the curves in Fig. 7 have unimodal distribution shape. At the extreme values of R, zero and , tends towards zero. In physical terms, it means that for a crack to grow, a pre-existing fissure of a finite length must exist. Otherwise, the problem transitions from being toughness-controlled to strength-controlled [Bažant, 1984, Ritchie, 2011]. Overcoming material strength in the absence of micro-fissures would require higher expansion values of the ASR pocket. In contrast, sufficiently large size of a pre-existing crack encircling the inclusion facilitates its further growth. The curves in Fig. 7 are ascending up to the peak value and later descend to zero.
The peak position and its height vary for different inclusion shapes. The highest corresponds to an oblate spheroid with the aspect ratio which makes it the most critical case for high fracture toughness. A sphere () has a lower peak value, but its maximum crack length is the largest. Consequently, a sphere and a spheroid are the two most critical geometries with regards to the intensity and the maximum crack length correspondingly.
For the current equatorial radius of a spheroid m, any aspect ratio leads to the fracture growth. Flattening the shape of the inclusion would reduce its potential to grow the crack. For instance, a penny with thickness m is not expected to develop a crack. The maximum crack radius for all possible spheroids with radius is which is more than twice wider than the ASR pocket itself.
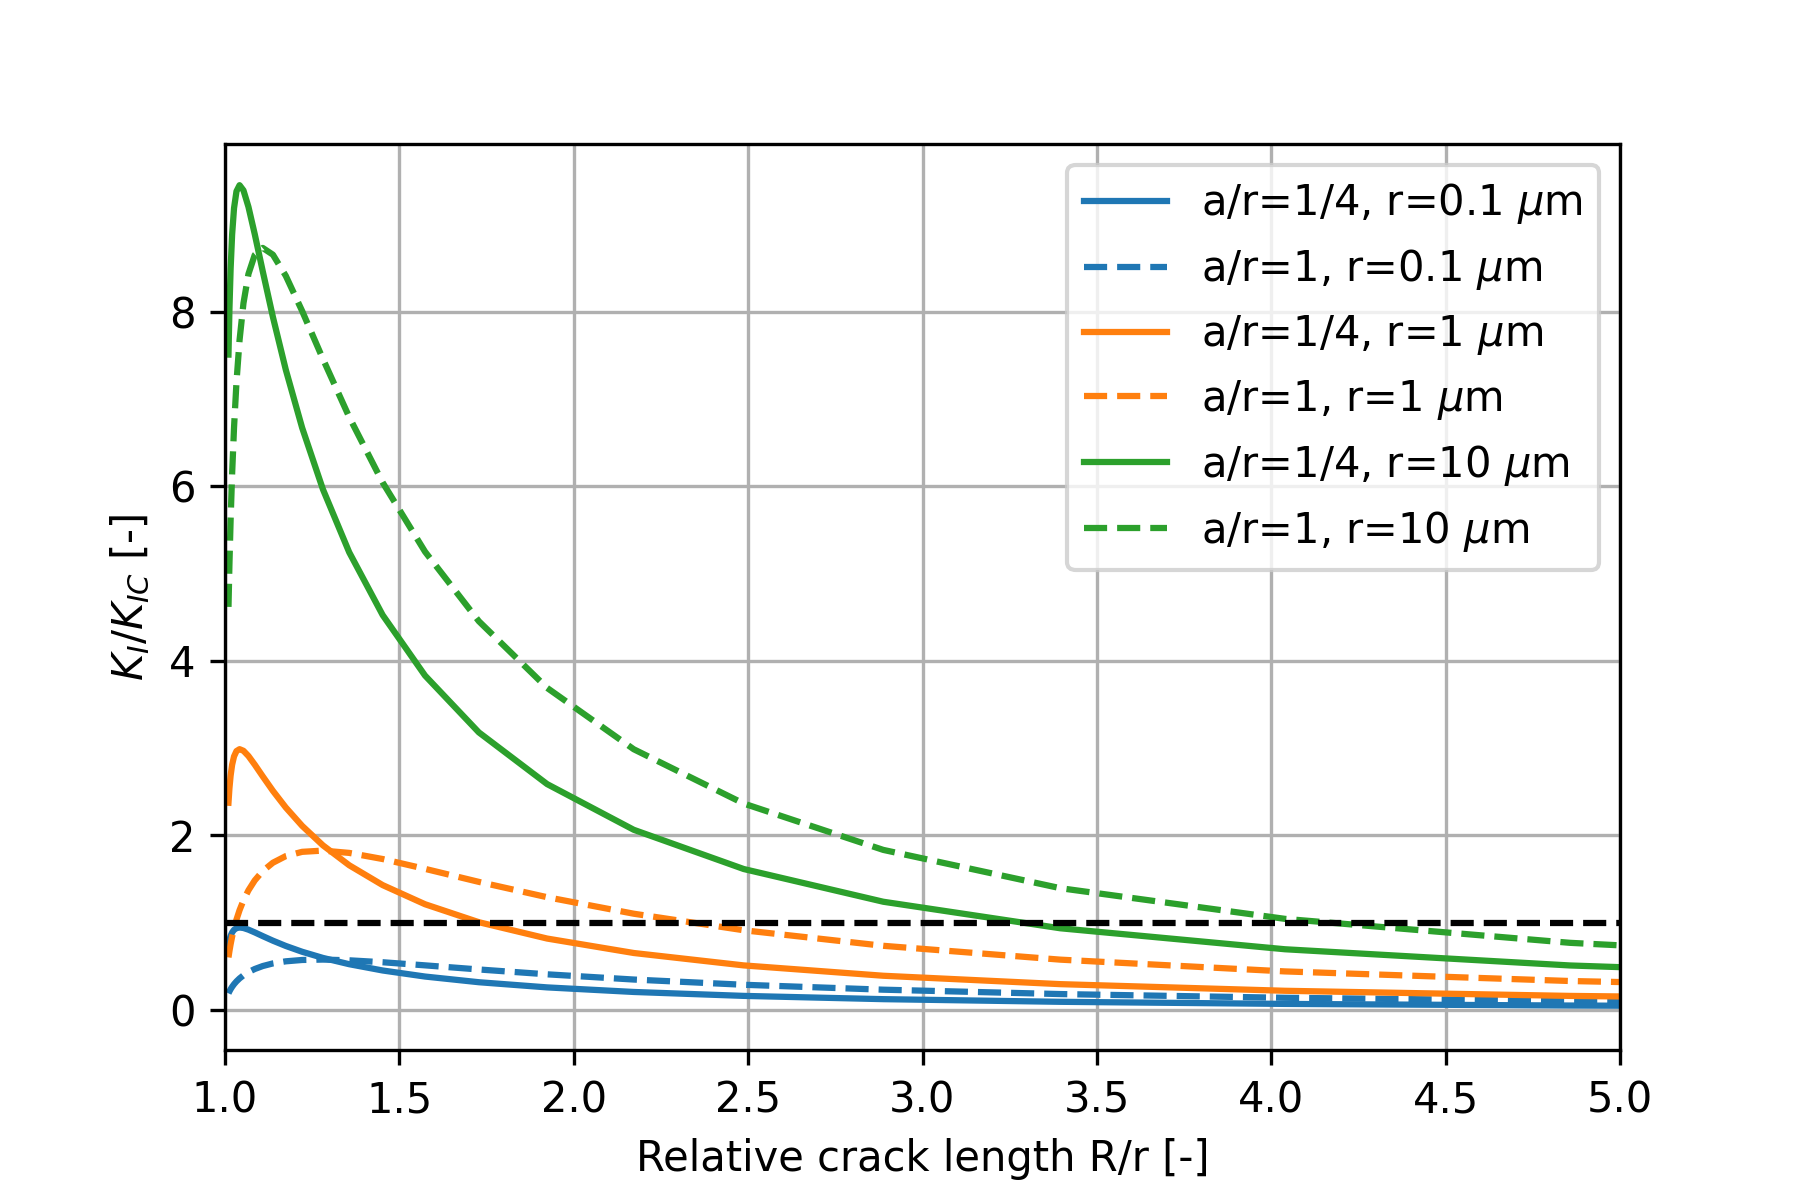
Although the stress solution of Eshelby problem does not depend on the size of the inclusion, the solution for the stress intensity factor does. This is demonstrated in Fig. 8. The two most critical shapes (a sphere and a spheroid) of different radii were tested: , , and . Same expansion value was applied. One can observe a gradual increase in both the peak SIF value and the maximum crack length for bigger inclusions. This allows us to conclude that the size of the ASR pocket has a direct effect on the crack propagation: larger ASR inclusions have higher chance to damage the surrounding aggregate and thus cause a longer crack. Another important observation is that, irrespective of its shape, an inclusion of size or smaller does not trigger crack growth. This observation suggests that there is a critical value of the spheroid radius below which no crack extension will happen for expansion values of and the chosen material properties. This critical radius lays in the range between and .
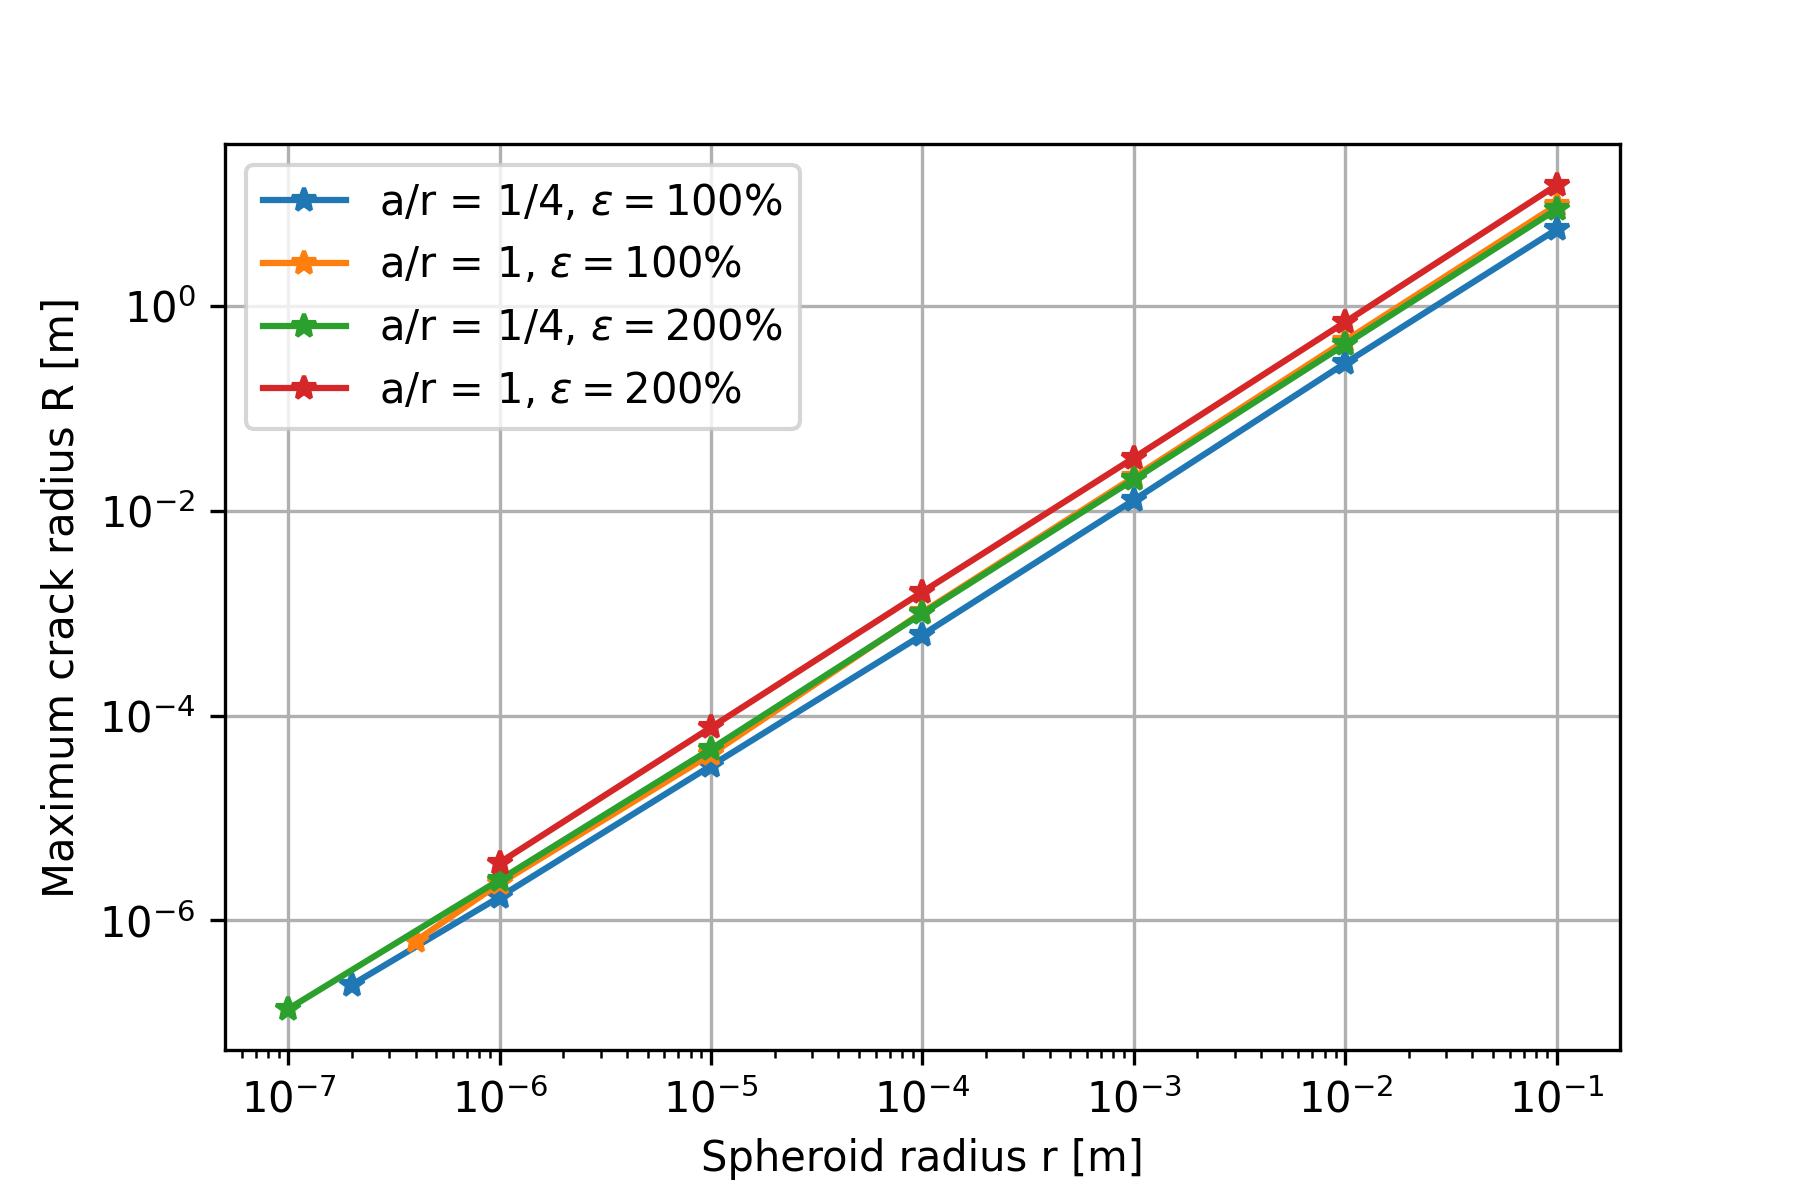
To study how the inclusion size is related to the maximum developed crack radius, an additional parametric study was performed, results of which are presented in Fig. 9. Two previously highlighted shapes (a sphere and a spheroid) were increased in size from hundreds of nanometers to few centimetres and the corresponding maximum crack radii were measured. Such a wide range was chosen for purely illustrative purposes and does not have any physical implications. Expansion values of and were applied. Results are plotted in log-log scale. The maximum crack radius shows power-law dependence on the inclusion size. The power law reveals an exponent of . The results suggest that the same power-law exponent holds for different expansion values.
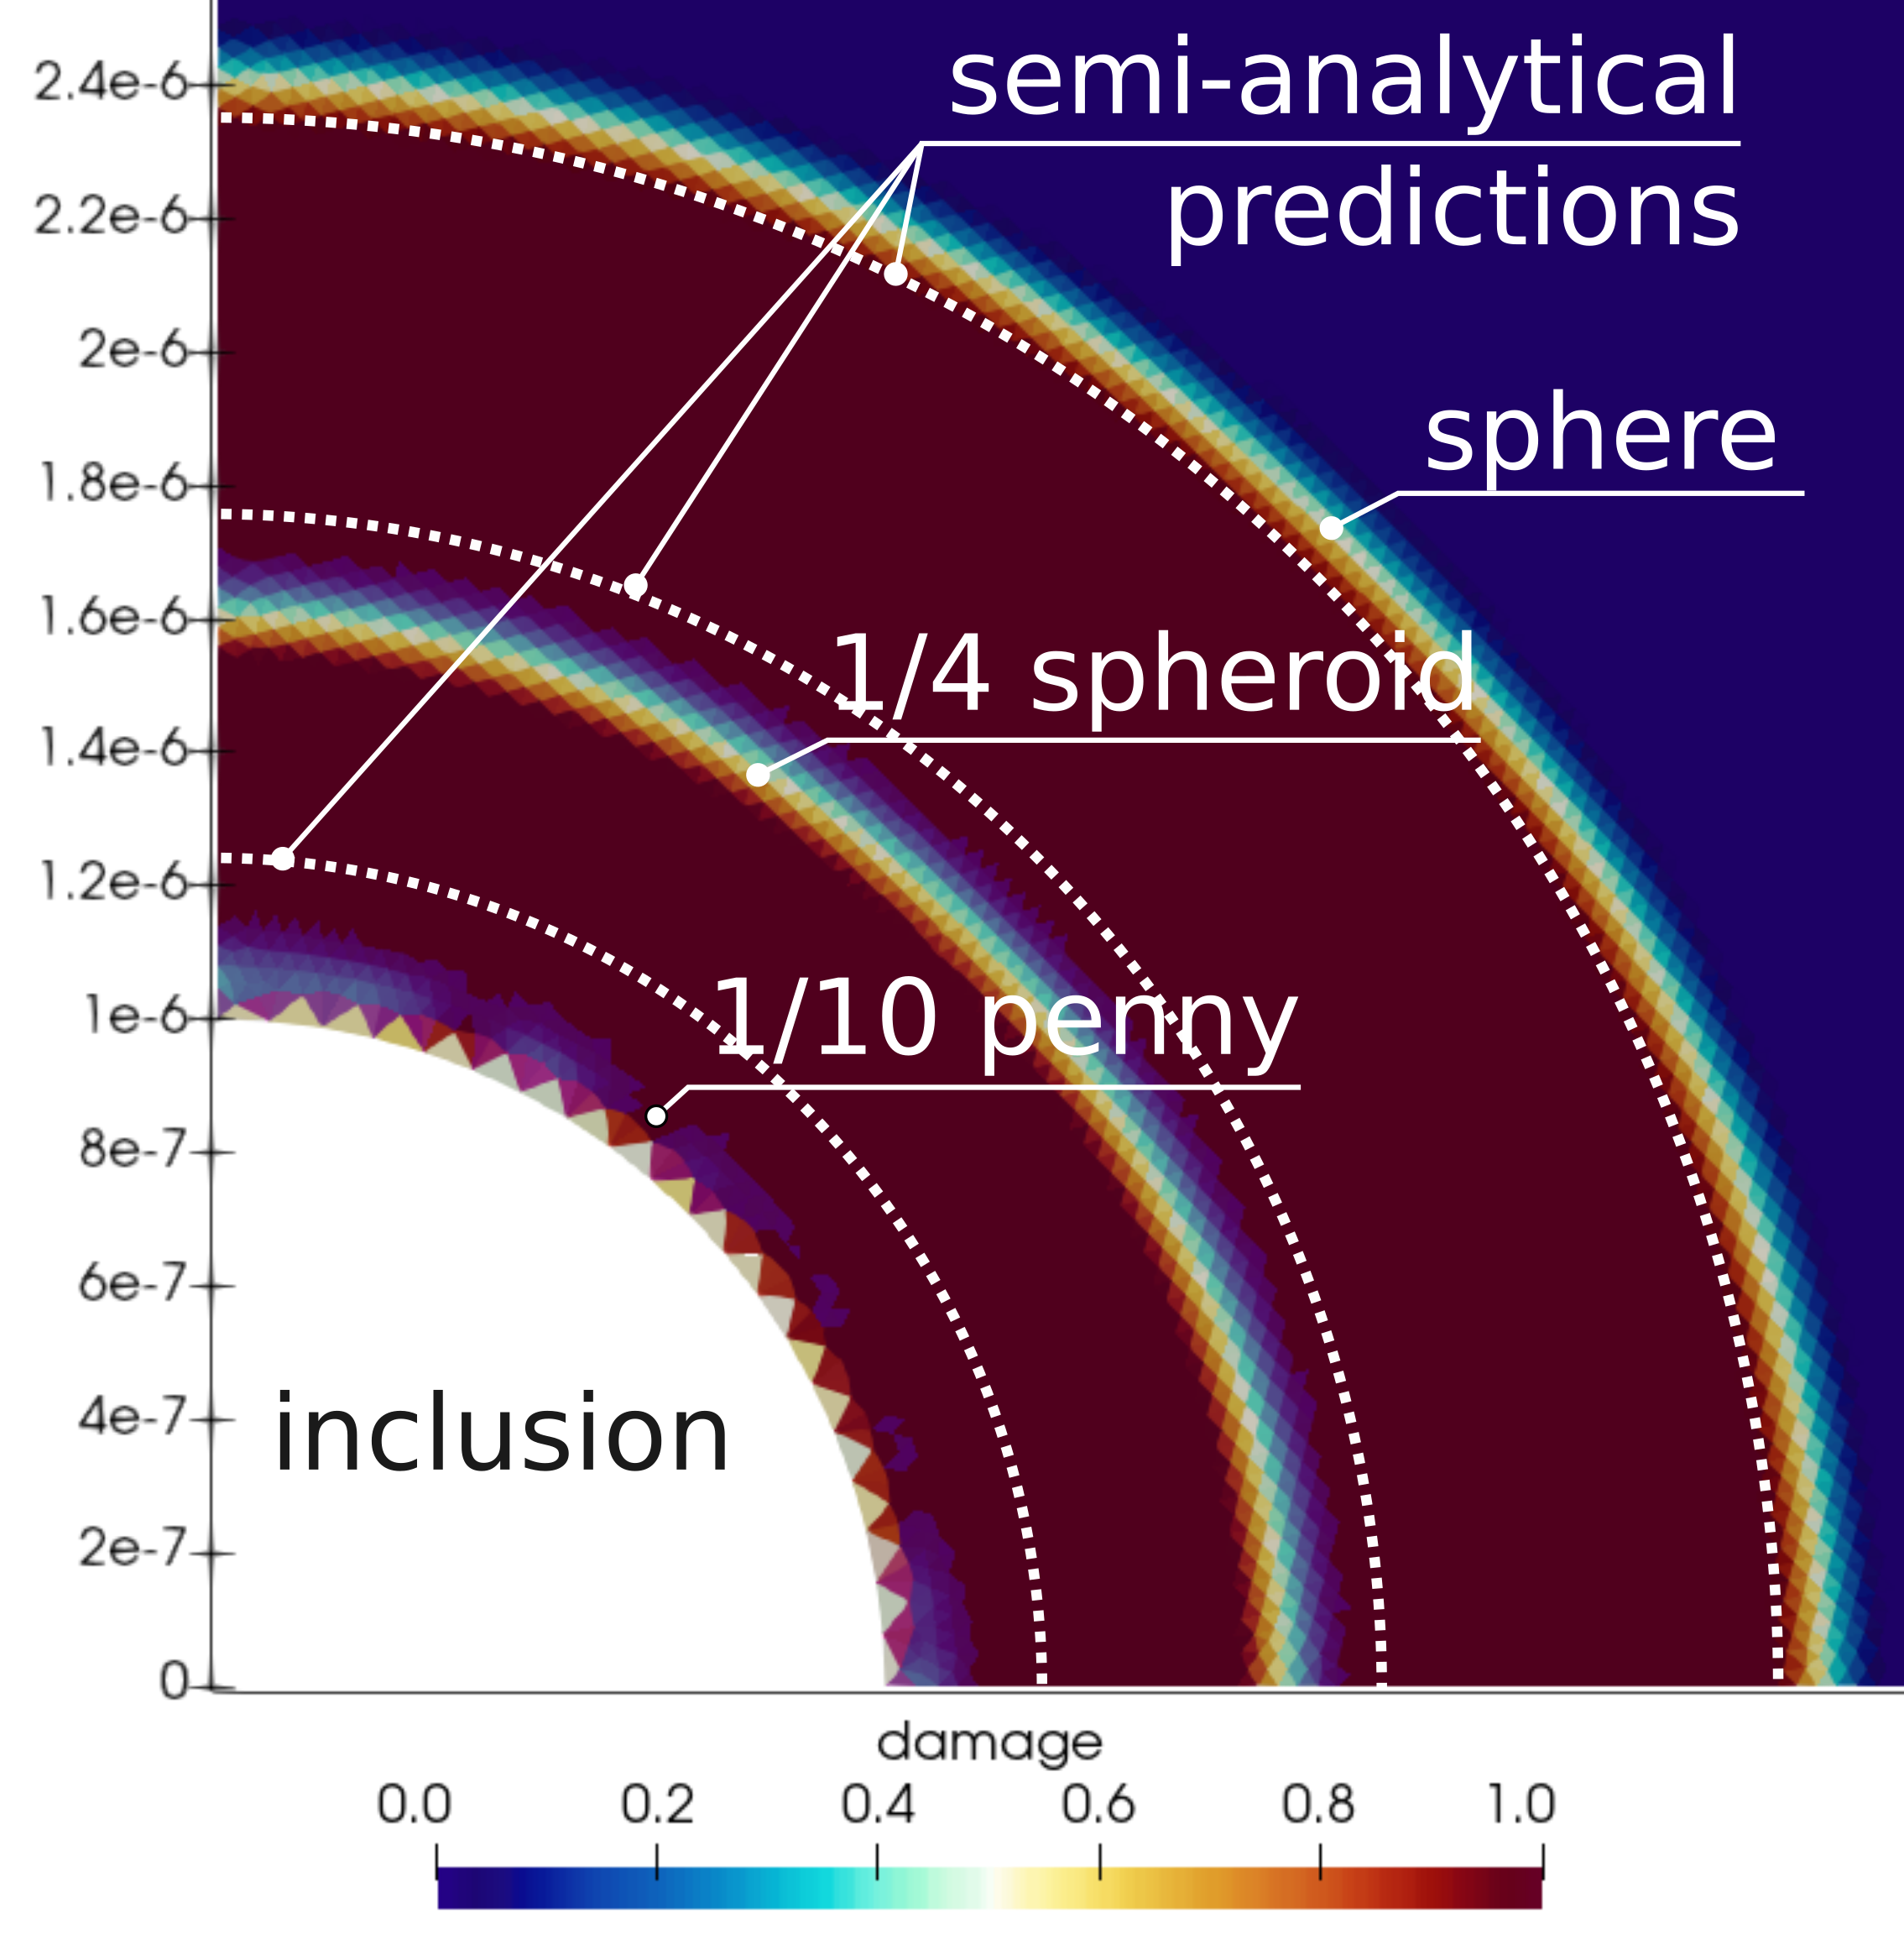
Numerical validation of obtained solution is given in Fig. 10. Here, white dotted lines represent semi-analytical predictions for three spheroids, while the coloured background comprises three numerical crack profiles. Final positions of the numerical cracks can be interpreted through the damage values: one corresponds to fully damaged cohesive elements, zero is for an intact material. Rainbow-coloured regions correspond to the cohesive zones at the external crack radii. The radius of the crack next to a sphere is about which is almost equal to the analytically predicted radius of . For a spheroid, numerically predicted crack measures which is smaller than the analytical value of . Finally, a penny has not developed a full crack and just slightly opened a rim of elements next to it while its analytical prediction is . The reason for the underdeveloped crack is the cohesive zone size being equal to the size of the pre-existing crack. To improve this result, one could reduce the process zone size even more, which would require to refine the numerical mesh. Except for this last case, the numerical model fairly reproduces the semi-analytical predictions.
4 Conclusions
In this study, we have estimated the potential of ASR pockets of different sizes and shapes to cause cracking of surrounding aggregates due to their volume increase of . For this, we have proposed a semi-analytical model consisting of the expanding ellipsoidal inclusion and a ring-shaped crack encircling it. The inclusion here represents the pocket of ASR product at its mature solid state. A prerequisite for such model is the presence of pre-existing fissures, which are abundant in rocks. First, the stresses in the matrix are computed by an analytical solution. Later, the product of computed stresses and the specific weight function are integrated over the surface of a crack to obtain the stress intensity factor for mode I. The latter characterises the crack potential to grow. The maximum distance at which stress intensity factor normalised by the fracture toughness equals one, renders the maximum crack length.
The resulting solution strongly depends on the inclusion’s shape and size. Flat shapes concentrate higher tensile stresses on their sharp edges than the bulging ones. At the same time, these stresses decay much faster further from the inclusion. While the stress intensity factor for mode I is the highest for an oblate spheroid with an aspect ratio equal to , the longest crack is caused by a spherical shape. It makes spheroid and a sphere the two most critical shapes, either for reaching high values of fracture toughness or for causing the longest crack.
Size of the inclusion plays a crucial role in crack growing potential. For an inclusion of radius under expansion of , all spheroidal shapes with aspect ratio above are likely to grow a crack around. Flatter shapes would cause either shorter cracks () or no crack at all. There is a critical inclusion radius in the range between and below which no crack growth is expected for the current combination of and . Consistently, an increase in the inclusion’s size yields higher values of and longer cracks.
Further increase in the inclusion size as well as expansion value suggests a power-law dependence between the radius of a spheroid and the maximum crack radius. Independent of the spheroidal shape or the expansion value, the power-law exponent is about .
Results of the analytical and semi-analytical predictions were confirmed by the numerical model. For verification of the stresses in the bulk in the absence of the crack, a purely elastic finite element model was assembled. For validating the predicted maximum crack length, this model was enriched with cohesive elements. Both the elastic stresses and the crack lengths obtained numerically have a good match with the semi-analytical results.
Acknowledgements
The Swiss National Science Foundation is acknowledged for financial support within the Sinergia project “Alkali-silica reaction in concrete (ASR)” through grant CRSII5_17108.
References
- noa [2021] Akantu (Version 4.0.0), Aug. 2021. URL https://akantu.ch/.
- Alehossein and Boland [2004] H. Alehossein and J. N. Boland. Strength, toughness, damage and fatigue of rock. In Structural Integrity and Fracture: Proceedings of the International Conference, SIF 2004, page 8, 2004.
- Barenblatt [1962] G. Barenblatt. The Mathematical Theory of Equilibrium Cracks in Brittle Fracture. In Advances in Applied Mechanics, volume 7, pages 55–129. Elsevier, 1962. ISBN 978-0-12-002007-2. doi: 10.1016/S0065-2156(08)70121-2. URL https://linkinghub.elsevier.com/retrieve/pii/S0065215608701212.
- Bažant [1984] Z. P. Bažant. Size Effect in Blunt Fracture: Concrete, Rock, Metal. Journal of Engineering Mechanics, 110(4):518–535, Apr. 1984. ISSN 0733-9399, 1943-7889. doi: 10.1061/(ASCE)0733-9399(1984)110:4(518). URL http://ascelibrary.org/doi/10.1061/%28ASCE%290733-9399%281984%29110%3A4%28518%29.
- Bueckner [1970] H. F. Bueckner. Novel principle for the computation of stress intensity factors. Zeitschrift fuer Angewandte Mathematik & Mechanik, 50(9), Sept. 1970. URL https://trid.trb.org/view/3976.
- Cole and Lancucki [1983] W. F. Cole and C. J. Lancucki. Products formed in an aged concrete the occurrence of okenite. Cement and Concrete Research, 13(5):611–618, Sept. 1983. ISSN 0008-8846. doi: 10.1016/0008-8846(83)90049-2. URL https://www.sciencedirect.com/science/article/pii/0008884683900492.
- Dähn et al. [2016] R. Dähn, A. Arakcheeva, P. Schaub, P. Pattison, G. Chapuis, D. Grolimund, E. Wieland, and A. Leemann. Application of micro X-ray diffraction to investigate the reaction products formed by the alkali–silica reaction in concrete structures. Cement and Concrete Research, 79:49–56, Jan. 2016. ISSN 0008-8846. doi: 10.1016/j.cemconres.2015.07.012. URL https://www.sciencedirect.com/science/article/pii/S0008884615002094.
- De Ceukelaire [1991] L. De Ceukelaire. The determination of the most common crystalline alkali-silica reaction product. Materials and Structures, 24(3):169–171, May 1991. ISSN 1359-5997, 1871-6873. doi: 10.1007/BF02472981. URL http://link.springer.com/10.1007/BF02472981.
- Dugdale [1960] D. Dugdale. Yielding of steel sheets containing slits. Journal of the Mechanics and Physics of Solids, 8(2):100–104, May 1960. ISSN 00225096. doi: 10.1016/0022-5096(60)90013-2. URL https://linkinghub.elsevier.com/retrieve/pii/0022509660900132.
- Dunant and Scrivener [2012] C. F. Dunant and K. L. Scrivener. Effects of uniaxial stress on alkali–silica reaction induced expansion of concrete. Cement and Concrete Research, 42(3):567–576, Mar. 2012. ISSN 00088846. doi: 10.1016/j.cemconres.2011.12.004. URL https://linkinghub.elsevier.com/retrieve/pii/S0008884611003267.
- Eshelby [1957] J. D. Eshelby. The determination of the elastic field of an ellipsoidal inclusion, and related problems. Proc. R. Soc. Lond. A, 241(1226):376–396, Aug. 1957. ISSN 0080-4630, 2053-9169. doi: 10.1098/rspa.1957.0133. URL https://royalsocietypublishing.org/doi/10.1098/rspa.1957.0133.
- Eshelby [1959] J. D. Eshelby. The elastic field outside an ellipsoidal inclusion. Proc. R. Soc. Lond. A, 252(1271):561–569, Oct. 1959. ISSN 0080-4630, 2053-9169. doi: 10.1098/rspa.1959.0173. URL https://royalsocietypublishing.org/doi/10.1098/rspa.1959.0173.
- Fett and Rizzi [2007] T. Fett and G. Rizzi. Weight Functions and Stress Intensity Factors for Ring-shaped Cracks. page 48, 2007.
- Geng et al. [2020] G. Geng, Z. Shi, A. Leemann, K. Glazyrin, A. Kleppe, D. Daisenberger, S. Churakov, B. Lothenbach, E. Wieland, and R. Dähn. Mechanical behavior and phase change of alkali-silica reaction products under hydrostatic compression. Acta Crystallogr B Struct Sci Cryst Eng Mater, 76(4):674–682, Aug. 2020. ISSN 2052-5206. doi: 10.1107/S205252062000846X. URL https://scripts.iucr.org/cgi-bin/paper?S205252062000846X.
- Griffith [1921] A. A. Griffith. The phenomena of rupture and flow in solids. Phil. Trans. R. Soc. Lond. A, 221(582-593):163–198, Jan. 1921. ISSN 0264-3952, 2053-9258. doi: 10.1098/rsta.1921.0006. URL https://royalsocietypublishing.org/doi/10.1098/rsta.1921.0006.
- Healy [2009] D. Healy. Elastic field in 3D due to a spheroidal inclusion—MATLAB™ code for Eshelby’s solution. Computers & Geosciences, 35(10):2170–2173, Oct. 2009. ISSN 00983004. doi: 10.1016/j.cageo.2008.11.012. URL https://linkinghub.elsevier.com/retrieve/pii/S0098300409001356.
- Iskhakov et al. [2019] T. Iskhakov, J. J. Timothy, and G. Meschke. Expansion and deterioration of concrete due to ASR: Micromechanical modeling and analysis. Cement and Concrete Research, 115:507–518, Jan. 2019. ISSN 00088846. doi: 10.1016/j.cemconres.2018.08.001. URL https://linkinghub.elsevier.com/retrieve/pii/S0008884618301509.
- Ju and Sun [1999] J. W. Ju and L. Z. Sun. A Novel Formulation for the Exterior-Point Eshelby’s Tensor of an Ellipsoidal Inclusion. Journal of Applied Mechanics, 66(2):570–574, June 1999. ISSN 0021-8936, 1528-9036. doi: 10.1115/1.2791090. URL https://asmedigitalcollection.asme.org/appliedmechanics/article/66/2/570/445956/A-Novel-Formulation-for-the-ExteriorPoint-Eshelbys.
- Ju and Sun [2001] J. W. Ju and L. Z. Sun. Effective elastoplastic behavior of metal matrix composites containing randomly located aligned spheroidal inhomogeneities. Part I: micromechanics-based formulation. International Journal of Solids and Structures, page 19, 2001.
- Larive [1997] C. Larive. Apports combinés de l’expérimentation et de la modélisation à la compréhension de l’alcali-réaction et de ses effets mécaniques. PhD thesis, l’École Nationale des Ponts et Chaussées, 1997.
- Leemann and Lura [2013] A. Leemann and P. Lura. E-modulus of the alkali–silica-reaction product determined by micro-indentation. Construction and Building Materials, 44:221–227, July 2013. ISSN 09500618. doi: 10.1016/j.conbuildmat.2013.03.018. URL https://linkinghub.elsevier.com/retrieve/pii/S0950061813002237.
- Leemann and Münch [2019] A. Leemann and B. Münch. The addition of caesium to concrete with alkali-silica reaction: Implications on product identification and recognition of the reaction sequence. Cement and Concrete Research, 120:27–35, June 2019. ISSN 00088846. doi: 10.1016/j.cemconres.2019.03.016. URL https://linkinghub.elsevier.com/retrieve/pii/S0008884619300730.
- Leemann et al. [2016] A. Leemann, T. Katayama, I. Fernandes, and M. A. T. M. Broekmans. Types of alkali–aggregate reactions and the products formed. Proceedings of the Institution of Civil Engineers - Construction Materials, 169(3):128–135, June 2016. ISSN 1747-650X, 1747-6518. doi: 10.1680/jcoma.15.00059. URL http://www.icevirtuallibrary.com/doi/10.1680/jcoma.15.00059.
- Leemann et al. [2020] A. Leemann, Z. Shi, and J. Lindgård. Characterization of amorphous and crystalline ASR products formed in concrete aggregates. Cement and Concrete Research, 137:106190, Nov. 2020. ISSN 00088846. doi: 10.1016/j.cemconres.2020.106190. URL https://linkinghub.elsevier.com/retrieve/pii/S0008884620304324.
- Multon and Toutlemonde [2006] S. Multon and F. Toutlemonde. Effect of applied stresses on alkali–silica reaction-induced expansions. Cement and Concrete Research, 36(5):912–920, May 2006. ISSN 00088846. doi: 10.1016/j.cemconres.2005.11.012. URL https://linkinghub.elsevier.com/retrieve/pii/S0008884605002838.
- Mura [1987] T. Mura. Micromechanics of defects in solids. 1987. ISBN: 9789400934894 OCLC: 1158181484.
- Petroski and Achenbach [1978] H. Petroski and J. Achenbach. Computation of the weight function from a stress intensity factor. Engineering Fracture Mechanics, 10(2):257–266, Jan. 1978. ISSN 00137944. doi: 10.1016/0013-7944(78)90009-7. URL https://linkinghub.elsevier.com/retrieve/pii/0013794478900097.
- Rice [1972] J. R. Rice. Some remarks on elastic crack-tip stress fields. International Journal of Solids and Structures, 8(6):751–758, June 1972. ISSN 00207683. doi: 10.1016/0020-7683(72)90040-6. URL https://linkinghub.elsevier.com/retrieve/pii/0020768372900406.
- Richart and Molinari [2015] N. Richart and J. Molinari. Implementation of a parallel finite-element library: Test case on a non-local continuum damage model. Finite Elements in Analysis and Design, 100:41–46, Aug. 2015. ISSN 0168874X. doi: 10.1016/j.finel.2015.02.003. URL https://linkinghub.elsevier.com/retrieve/pii/S0168874X15000153.
- Ritchie [2011] R. O. Ritchie. The conflicts between strength and toughness. Nature Mater, 10(11):817–822, Nov. 2011. ISSN 1476-4660. doi: 10.1038/nmat3115. URL https://www.nature.com/articles/nmat3115. Bandiera_abtest: a Cg_type: Nature Research Journals Number: 11 Primary_atype: Reviews Publisher: Nature Publishing Group Subject_term: Mechanical properties Subject_term_id: mechanical-properties.
- Shi et al. [2019] Z. Shi, G. Geng, A. Leemann, and B. Lothenbach. Synthesis, characterization, and water uptake property of alkali-silica reaction products. Cement and Concrete Research, 121:58–71, July 2019. ISSN 00088846. doi: 10.1016/j.cemconres.2019.04.009. URL https://linkinghub.elsevier.com/retrieve/pii/S0008884619301139.
- Shi et al. [2020] Z. Shi, S. Park, B. Lothenbach, and A. Leemann. Formation of shlykovite and ASR-P1 in concrete under accelerated alkali-silica reaction at 60 and 80 °C. Cement and Concrete Research, 137:106213, Nov. 2020. ISSN 0008-8846. doi: 10.1016/j.cemconres.2020.106213. URL https://www.sciencedirect.com/science/article/pii/S0008884620304622.
- Swamy [2003] R. N. Swamy. Alkali-silica reaction in concrete. Blackie and Son ; Taylor and Francis e-Library, Glasgow, England; New York, New York, 2003. ISBN 978-0-203-20033-9. URL https://www.taylorfrancis.com/books/0203036638. OCLC: 1132080496.
- Tada et al. [2000] H. Tada, P. C. Paris, and G. R. Irwin. The stress analysis of cracks handbook. ASME Press, New York, 3rd ed edition, 2000. ISBN 978-0-7918-0153-6.
- Timoshenko and Goodier [1951] S. Timoshenko and J. N. Goodier. Theory of Elasticity. McGraw-Hill, 3 edition, 1951. ISBN 978-0-07-085805-3.
Appendix A Supplementary plots