The TESS View of LOFAR Radio-Emitting Stars
Abstract
The recent detection of the M dwarf GJ 1151 at 144 MHz low radio frequencies using LOFAR has been interpreted as evidence of an exoplanet magnetically interacting with its host star. This would be the first exoplanet detected around a main sequence star by a radio telescope. Radial velocity confirmation of such a planet has proven inconclusive, and it remains possible that the radio emission could be generated by a stellar coronal process. Using data from TESS, we shed light on this question by probing the stellar activity and flares of GJ 1151 as well as fourteen other M dwarfs detected by LOFAR. GJ 1151 and three other star-planet interaction candidates are found to be inactive, with no rotational modulation and few, if any, flares. The remainder of the LOFAR detected M dwarfs flare frequently. We consider it unlikely that stellar activity is responsible for the bright, circularly-polarized emission from GJ 1151 and its three analogs, and support the star-planet magnetic interaction interpretation. \faGithub
single = false, list/sort = true, cite/group = true, cite/group/cmd = cite/group/pre = ;, \DeclareAcronymtess short = TESS , long = Transiting Exoplanet Survey Satellite, cite = ricker15 \DeclareAcronymecmi short = ECMI, long = electron cyclotron maser instability \DeclareAcronymjwst short = JWST , long = James Webb Space Telescope, cite= jwst \DeclareAcronymaskap short = ASKAP, long = the Australian Square Kilometre Array Pathfinder \DeclareAcronymrms short = RMS, long = root-mean-square \DeclareAcronymzdi short = ZDI, long = Zeeman Doppler Imaging \DeclareAcronymlotss short = LoTSS, long = The LOFAR Two-metre Sky Survey, cite = shimwell17 \DeclareAcronymhpf short = HPF, long = the Habitable-Zone Planet Finder, cite = hpf \DeclareAcronymspi short = SPI, long = star-planet magnetic interactions, cite = zarka2001 \DeclareAcronymracs short = RACS, long = Rapid ASKAP Continuum Survey, \DeclareAcronymrv short = RV, long = radial velocity \DeclareAcronymcme short = CME, long = coronal mass ejections
1 Introduction
Since the dawn of radio astronomy, it has been known that the Sun and planets of our Solar System are bright sources of radio emission (Pawsey et al., 1946; Kaiser & Desch, 1984). The Sun emits radio waves from its active regions, flares, and corona (Melrose, 1980; Dulk, 1985), while the Earth and planets produce low-frequency auroral radio emission (Zarka et al., 2001). In addition to this, Jupiter electrodynamically interacts with its innermost moons, especially Io, giving rise to strong coherent radio emission (Bigg, 1964).
Nevertheless, outside of the Solar System, the vast majority of detected low-frequency radio sources are active or star-forming galaxies, compact objects, or interacting binaries. Main-sequence stars detected in the radio are typically nearby () and chromospherically active (Güdel & Benz, 1993). While stellar flares can be bright in the radio spectrum (Crosley & Osten, 2018; Zic et al., 2020), only a handful of the nearest main-sequence stars have been detected in quiescent emission (e.g. Trigilio et al., 2018; Pérez-Torres et al., 2021). Detecting coherent radio waves from quiescent stellar systems would provide valuable information not only about the magnetospheres of the vast majority of stars, but also about possible \acspi. Pérez-Torres et al. (2021) interpret variability in the radio emission of Proxima Cen as SPI, though this is inconsistent with other models (Kavanagh et al., 2021). While known exoplanet-host stars have been targeted by sensitive radio searches, no exoplanets have been conclusively identified in low-frequency radio emission (Lynch et al., 2018; Turner et al., 2021).
Radio emission is a strong indication of the space weather environment, which is key to understanding planetary habitability. M dwarf stars are thought to host the great majority of temperate terrestrial planets (Hsu et al., 2020), defined such that equilibrium temperatures could sustain liquid water at the planet’s surface. Around small, dim stars, planetary transits are deep () and the liquid-water habitable zone contains short orbital periods on the order of days. The potential for high-quality atmospheric characterization of habitable planets using transmission spectroscopy (Morley et al., 2017) means that M dwarfs are a cornerstone of the transiting exoplanet science planned with \actess and \acjwst.
M dwarfs are highly active, especially when they are young and rapidly rotating (Newton et al., 2017), and close-in ‘habitable’ planets may be rendered uninhabitable by a harsh space weather environment and frequent flares (Tarter et al., 2007; Shields et al., 2016). A risk is that the liquid-water habitable zone may lie inside of the Alfvén surface, defined such that the Alfvén speed exceeds the plasma flow speed. Within this region the magnetic field lines threading a planet’s plasma environment are directly connected to the field of the star, rather than (as for Earth) forming separate magnetospheres delineated by a shock discontinuity. The stellar wind can then impinge directly on the planet’s atmosphere, potentially stripping it of volatiles and irradiating the surface in a way that would be hostile to life (Garraffo et al., 2017). For these reasons, detecting radio emission from \acspi is rare observational probe of the stellar influence on M dwarf planetary habitability (Kavanagh et al., 2021).
1.1 M Dwarf Radio Emission
Radio emission from stellar systems can be classified into coherent or incoherent processes, distinguished by radiation characteristics such as the brightness temperature, degree of circular polarisation, and duration (Melrose, 1980; Dulk, 1985).
Coherent radio emission processes are further divided two categories: plasma and \acecmi emission. Plasma emission can be driven by stellar activity, produced via impulsively heated plasma being injected into a colder plasma (Stepanov et al., 2001; Osten et al., 2006) as in stellar flares and \accme (Dulk, 1985; Matthews, 2019). We refer to nonthermal radio emission from plasma distributions heated by stellar flares and magnetic reconnection as ‘activity-driven’.
ecmi emission can also be generated via auroral processes similar to those seen on Jupiter (Zarka, 1998). Currents that accelerate electrons into the neutral Jovian atmosphere can be established by the breakdown of co-rotation when the magnetospheric plasma lags behind the magnetic field of Jupiter (Hill & Michel, 1976), or by Jupiter’s magnetic field sweeping over its conducting satellite Io (Turnpenney et al., 2017). The loss of high-energy electrons in the atmosphere of Jupiter establishes the population inversion necessary for ECMI emission (Cowley & Bunce, 2001). We define stellar auroral emission in this context as any stellar \acecmi radio emission that is not generated directly via stellar activity, with Jovian analog processes in mind.
1.2 LOFAR Radio Detections
Instead of using a targeted radio study as in previous detections, a larger number of radio-bright M dwarfs have now been detected using wide-field interferometric surveys. For example, using \acaskap at 888 MHz in the Rapid \acaskap Continuum Survey of the whole sky , Pritchard et al. (2021) have identified emission from 33 stars, including chemically-peculiar stars, interacting binaries, and 18 K and M dwarfs.
At lower frequencies still, LOFAR (LOw-Frequency ARray; van Haarlem et al., 2013), with its deep sensitivity and fast survey speed, is an ideal instrument for searching for this. Low frequencies are the ideal spectral window to search for coherent radio emission associated with star-planet magnetic interactions: the expected \acecmi emission is cut off above a frequency proportional to the magnetic field strength of the emitter (Treumann, 2006), and can be distinguished from fundamental plasma emission, for which the brightness temperature frequency . \aclotss is an ongoing survey of the entire Northern sky, which currently covers 20% of the northern hemisphere using a low-frequency radio band centered at 144 MHz, reaching sensitivities with 100Jy \acrms noise an order of magnitude deeper than comparable previous low-frequency surveys.
Cross-matching LOFAR-detected sources against the Gaia DR2 optical catalog (Gaia Collaboration et al., 2018) has led to the detection of GJ 1151 (Vedantham et al., 2020), a quiescent, slowly-rotating M7 dwarf only 8 pc away. While it is faint in X-rays (Foster et al., 2020), it emits bright, highly-circularly-polarized low-frequency radio emission, which Vedantham et al. (2020) interpret as a sign of \acspi with a terrestrial-mass planet in a few-day orbit. Nevertheless, \acrv observations of GJ 1151 place limits of 1.2 on any planet with an orbital period shorter than five days (Pope et al., 2020; Perger et al., 2021; Mahadevan et al., 2021). Without confirmation of a planetary orbit or radio modulation at its period, it is not certain whether the radio emission observed from GJ 1151 is powered by \acspi.
Expanding the LoTSS-Gaia M dwarf sample, Callingham et al. (2021a) have reported the detection of 18 M dwarfs in addition to GJ 1151, across a range of spectral types, stellar activity levels, and including both binaries and single stars. They conclude that there may be two sets of emission mechanisms responsible for the low-frequency radio detections: 1) an activity-driven plasma mechanism responsible for polarized bursts, in which solar-like coronal processes are at work in active stars; and 2) an auroral emission mechanism operating in the most inactive stars, with \acecmi produced by the breakdown of co-rotation between the star and plasma in its magnetosphere for the fastest rotating stars, or by the magnetic interaction with an exoplanet.
2 The TESS View
Optical light curves can help distinguish between activity-driven and auroral radio emission mechanisms for these stars. Pineda et al. (2017) support the idea that radio emission from ultracool dwarfs is auroral partly on the basis that they have much lower flare rates than main-sequence M dwarfs, and that flares are responsible for the coronal heating which gives rise to the coronal radio emission. On the same basis, the non-detection of optical flares in \acspi candidate systems would add to the evidence that their radio emission source is not coronal.
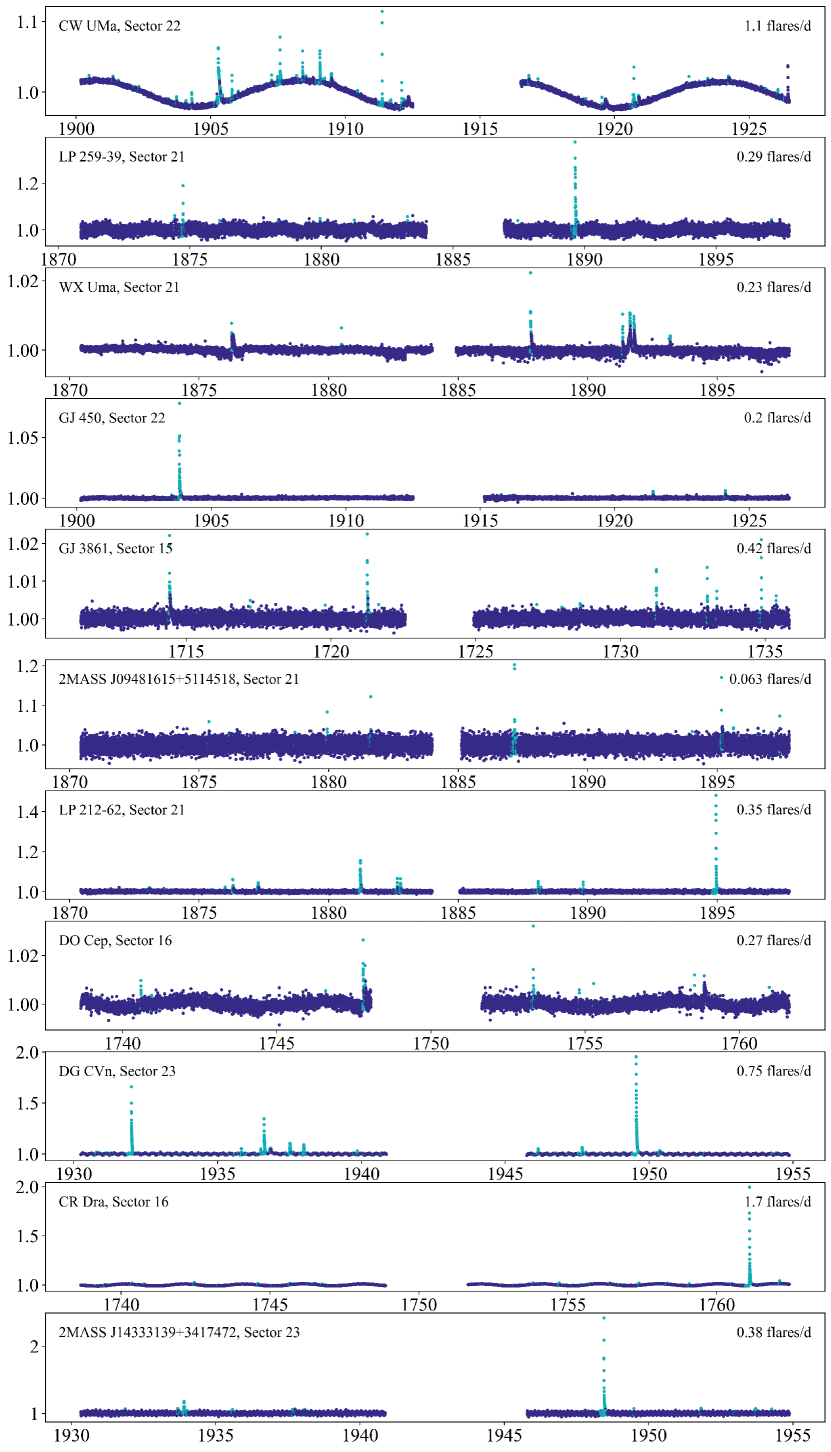
In this paper we examine optical light curves of the Callingham et al. (2021a) sample using \actess. Since its launch in 2018, \actess has been obtaining time-series photometry of nearly the entire sky, in sequential Sectors each of duration 27 days. Fifteen of the LOFAR-detected stars were observed (not simultaneously) with \actess at 2-minute cadence, high-precision photometry (for , typically better than 1 mmag in 1 hr; Handberg et al., 2021), which can reveal flares and starspot modulation from stellar rotation. By applying the stella machine-learning code to detect stellar flares (Feinstein et al., 2020b, a), we obtain uniform measures of flare rate and intensity across the sample, previously-published only for CR Dra (Callingham et al., 2021b).
Two sources, GJ 450 and 2MASS J09481615+5114518, were observed simultaneously by LOFAR and TESS, for eight-hour windows beginning UTC 20:11:00 on 2020-03-16 and UTC 20:45:40 on 2020-01-31 respectively. The stars were not detected by LOFAR in this time period, and no flares were detected by TESS during the simultaneous observations, or in the hours immediately before or after.
While sensitive non-detection of optical flares does not necessarily indicate auroral processes, and the observations are not simultaneous, a lack of \actess flares reveals a quiescent chromosphere where the radio emission is more likely powered by magnetospheric acceleration mechanisms instead of chromospheric ones. We show that the active systems identified by Callingham et al. (2021a) display flares in the TESS band as well, while four systems that were identified as quiescent and potentially auroral flare either infrequently or even not at all during the TESS observations.
| Name | TIC | X-ray Lum. | LOFAR Lum. | Flare Rate | Rotation Period |
|---|---|---|---|---|---|
| ( erg/s) | ( erg/s/Hz) | (d-1) | (d-1) | ||
| GJ 1151 | 11893637 | 125. | |||
| LP 169-22 | 148673115 | – | |||
| G 240-45 | 307957392 | – | |||
| GJ 625 | 207492082 | 79.8 | |||
| 2M J0948+5114* | 453430899 | – | |||
| GJ 450* | 144400022 | 23.0 | |||
| WX Uma | 252803603 | 0.780 | |||
| DO Cep | 414587194 | 0.410 | |||
| LP 259-39 | 166597074 | 1.7† | |||
| LP 212-62 | 392365135 | 60.8 | |||
| 2M J1433+3417 | 409372963 | 0.14† | |||
| GJ 3861 | 298164374 | – | |||
| DG CVn | 368129164 | 0.110 | |||
| CW UMa | 85334035 | 7.77 | |||
| CR Dra | 207436278 | 1.98 |
2.1 TESS Data Reduction
We examine all M dwarfs in the Callingham et al. (2021a) sample using TESS short-cadence data, to look for flares, rotational modulation, and other signatures of stellar activity. Because these are high proper motion sources, all sources are identified by position and proper motion in the TESS Input Catalog (TIC; Stassun et al., 2019) by manual inspection of the catalog on the Mikulski Archive for Space Telescopes (MAST), with TIC identifications listed in Table 1.
A similar pipeline to that used in Callingham et al. (2021b) was applied to all stars in the sample. The lightkurve package (Lightkurve Collaboration et al., 2018) is used to query MAST for each TIC in our target list and download 120 s-cadence light curves. The Pre-search Data Conditioning Simple Aperture Photometry (PDCSAP) flux for all available Sectors is then cleaned of nan values and quality-flagged epochs, and normalized.
If some of our stars of interest have very low activity rates, a confident measure of a very low rate would suggest that coronal processes are unlikely to be producing the low-frequency radio emission.
We apply a flare-finding algorithm using convolutional neural networks (CNNs) (Feinstein et al., 2020b). This package, stella, uses the average output from an ensemble of CNNs trained on an existing catalog of flares from TESS (Günther et al., 2020).
We use stella v.0.1.0 (Feinstein et al., 2020a) to detect flares in the sector-by-sector PDCSAP light curves, providing per-cadence uncalibrated probabilities of each time sample belonging to a flare. The time-series is then grouped by contiguous chunks into a table of individual flares, within which peaks are identified.
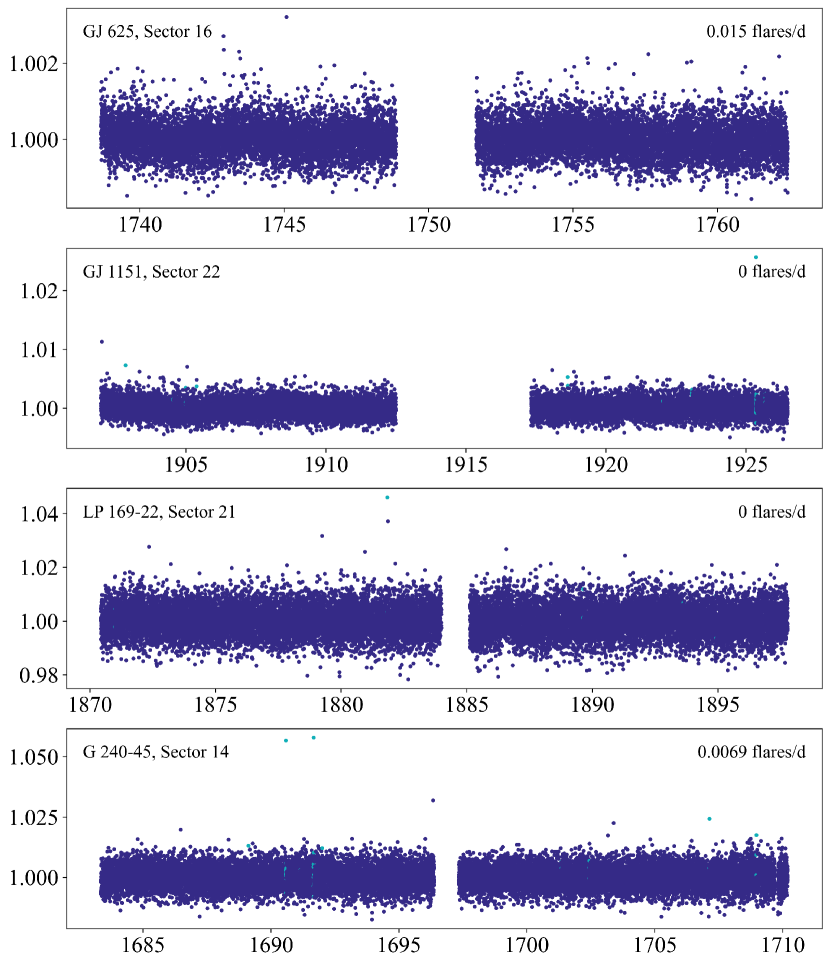
False positives are identified by simple filters: any flare is removed if its fractional amplitude is lower than the \acrms of the light curve smoothed on 400 min timescales, or if its fitted duration (rise + fall) is shorter than 4 minutes, i.e. two TESS cadences. The empirical flare rate for each star is then estimated by the probability-weighted sum of the number of flares divided by the observing time. Uncertainties are calculated conservatively as two-sided Poisson confidence intervals (Gehrels, 1986). To turn this into a flare rate, we divide this by the total observed time. The results are displayed in Table 1, with light curves coloured by flare classification displayed in Figures 1 and 2. Two of our stars (GJ 1151 and LP 169-22) show no flares in TESS, while four more show fewer than 5; for these, we report one-sided upper limits.
One highly active source – WX UMa – is the secondary component of the M1+M6 binary GJ 412 AB. With five magnitudes difference in flux between the components, the quiescent primary dominates the light curve. Furthermore, only the primary is allocated 2-min cadence pixels, and as TESS marginally resolves the wide binary, the default SPOC aperture excludes the contribution from the secondary, and no flares are visible. By using a smaller aperture centered on WX UMa, we extract a light curve with a reduced contamination from the brighter primary. The different realization of the systematics here means that stella identifies only one flare, while others can be seen by human inspection but are returned as false negatives in stella. Accordingly we visually examined the light curve in day-long chunks, and manually identified nine flares, and use this number in determining flare rate.
AD Leo lies close to the ecliptic, and is therefore outside the viewing zones in TESS Cycles 1-3. It will, however, be observed in the extended ecliptic mission in Cycle 4, in Sectors 45, 46, and 48.
3 Discussion
Of the stars considered here, Callingham et al. (2021a) identified five targets as being quiescent, whose emission is best understood as auroral: GJ 450, GJ 625, GJ 1151, G 240-45, and LP 169-22. These were classified as quiescent based on a conjunction of low H luminosity, low X-ray luminosity, and long rotation periods (where known). The remainder of the Callingham et al. (2021a) sample are all coherent emitters but more active, and emission may be auroral or activity-driven.
The TESS flare rates and rotational variability add a new dimension to this analysis. In Section 3.1, we situate these stars in a three-dimensional Güdel-Benz relation between radio luminosity, X-ray luminosity, and TESS flare rate. We find that while GJ 450 is actively flaring, the four remaining quiescent candidates are very inactive in TESS, and conclude that these are strong candidates for auroral emission and \acspi.
3.1 Güdel-Benz Relation
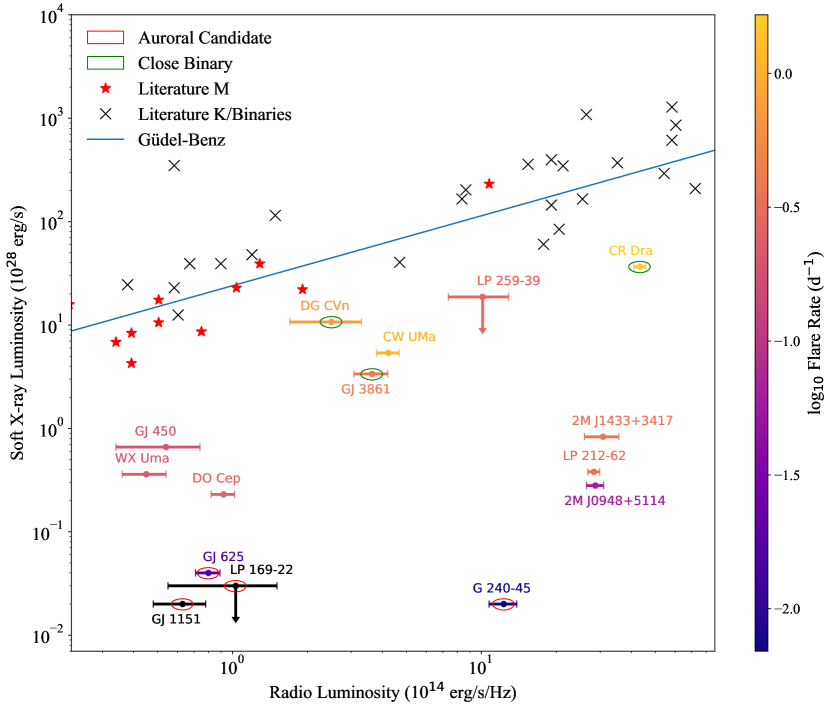
The Güdel-Benz relation is a scaling relation between the X-ray and radio luminosity of many active stars (Güdel & Benz, 1993; Benz & Güdel, 1994). This is generally understood to originate from non-thermal radio emission coming from electrons accelerated by magnetic reconnection events associated with stellar flares and prominences; this also heats surrounding plasma in the chromosphere, giving rise to thermal X-ray emission. If radio emission is being generated by this process, we expect not only a high X-ray luminosity, but also a correspondingly high rate of optical flares as the source of the heat driving the X-rays (Matthews, 2019).
One of the arguments made by Callingham et al. (2021a) for why the radio emission from GJ 1151 and their other quiescent detections must be non-coronal, potentially due to \acspi, is that it disobeys the Güdel-Benz relation: e.g. GJ 1151 is radio-loud but X-ray faint. Such a violation of the Güdel-Benz relationship is consistent with the radio emission being coherent. In the case of auroral emission from a Jupiter-Io process or the breakdown of corotation, we would expect to see radio-bright sources that are under-luminous in X-rays relative to the Güdel-Benz relationship; we would also expect them to have significantly lower flare rates.
We have therefore made an X-ray versus radio luminosity Güdel-Benz diagram for our sample (Figure 3), situating our stars relative to those from Güdel & Benz (1993) and Benz & Güdel (1994) and coloring each LOFAR star by its TESS flare rate. All LOFAR stars fall below the Güdel-Benz relation, which as noted by Callingham et al. (2021a) means that the majority are coherent emitters.
The four stars GJ 625, GJ 1151, G 240-45, and LP 169-22 are not only two to three orders of magnitude under-luminous in X-rays, but also two or more orders of magnitude lower in flare rate than comparably radio-bright sources. Their empirical flare rates would put all of them in the bottom 2.5% of the M dwarfs by flare rate determined by Günther et al. (2020). Their low flare rate and slow rotation favor an \acspi model for radio emission.
The presence of flares does not in general indicate the absence of auroral emission. Young, rapidly-rotating M dwarfs are more likely to flare (Feinstein et al., 2020b), while the rapid (2 d) rotation period also allows radio emission via the breakdown of co-rotation. This means that these effects are confounded for active stars and cannot be disentangled based solely on these data. Callingham et al. (2021b) showed that CR Dra had an unusually high TESS flare rate among M dwarfs, and detected both a quiescent component and a flaring component of radio emission. This quiescent component could be due to a breakdown of corotation in a magnetized plasma disk around one component of the binary system, and the flares may be due to local structure in the magnetosphere.
A cluster of actively-flaring stars with lower radio and X-ray emission includes WX UMa, DO Cep, and GJ 450. Similar flare rates and X-ray luminosities are sustained by 2M 1433+3417, LP 212-62, and 2M 0948+5114, but at much higher luminosities. While Callingham et al. (2021a) proposed GJ 450 may be quiescent due to its low H emission, on the basis of its flare rate, we suggest that the radio emission from GJ 450 and these other sources could plausibly be activity-driven or auroral.
DO Cep is one of the few stars from Callingham et al. (2021a) that was considered likely to be radio-bright due to plasma emission. In particular, DO Cep in unique among the LOFAR sample for its low circular polarization fraction (). The location of WX UMa is harder to explain, as the radio emission is likely generated by ECMI (Davis et al., 2021). The strong surface dipole magnetic field of WX UMa (Morin et al., 2010) plausibly allows ECMI to be produced via a large coronal loop, rather than breakdown of co-rotation or a satellite interaction.
4 Conclusions and Future Work
TESS light curves reveal that the LOFAR radio emitting stars differ by orders of magnitude in optical flare rate. The least X-ray luminous sources are shown to have very low flare rates, which is further evidence that their emission is from \acspi rather than activity-driven processes.
Nevertheless, none of the \acspi auroral emission candidates host known exoplanet candidates, or are TESS Objects of Interest transit candidates. Periodic radio emission, in phase with a known planetary period, would be definitive evidence of \acspi.
We recommend further observations of GJ 1151, LP 169-22, G 240-45, and GJ 625 as high-priority LOFAR and \acrv targets, to search for short-period planets that could cause this proposed \acspi, or to sensitively rule out such planets.
As shown by Zic et al. (2020), simultaneous optical and radio flares can be used to determine the nature of both radio emission and optical signatures and probe the stellar space weather environment directly. Simultaneous LOFAR and TESS observations will be important in establishing the physical mechanism connecting optical and radio variability in these sources.
Short-period known planets around very quiet stars will also merit follow-up radio observations. For instance, Nowak et al. (2020) and Cloutier et al. (2020) have detected a pair of planets orbiting the M dwarf LTT 3780, using both TESS photometry \acrv instruments. The Nowak et al. (2020) team note especially that LTT 3780 is a similar star to GJ 1151, and that given one planet has an ultra-short orbital period of 0.77 d, it is a promising target for radio search. As noted by Cloutier et al. (2020) and reproduced by our pipeline, LTT 3780 is not found to flare in the entire TESS Sector 9 in which it is observed. We therefore encourage radio follow-up of this system and systems like it.
The low-frequency arm of the Square Kilometre Array, SKA-Low, will even in its Phase 1 have a sensitivity nearly an order of magnitude better than LOFAR in Stokes V, and will detect many more stellar and \acspi systems (Pope et al., 2019). The great majority of sources SKA-Low will detect will be in the Southern Hemisphere, and will be inaccessible to northern NIR instruments best suited to M dwarf observations. We therefore recommend in the longer-term improving access to NIR \acrv facilities in the Southern Hemisphere as part of SKA science and exoplanet science generally, as the best understanding of M dwarf space weather and habitability will be gained from optical follow-up of SKA sources.
5 Open Science
In the interests of open science, we have made available the Jupyter notebooks used to generate the figures in this paper, under a BSD 3-clause open source license at github.com/benjaminpope/mtv. We encourage and welcome other scientists to replicate, apply, and extend our work.
Acknowledgements
BJSP and JRC are grateful to the School of Physics and Sydney Institute for Astronomy at the University of Sydney for hosting them as visiting researchers during the COVID-19 pandemic. We acknowledge and pay respect to the Gadigal people of the Eora Nation. It is upon their unceded, sovereign, ancestral lands that the University of Sydney is built. BJSP would like to acknowledge the traditional owners of the land on which the University of Queensland is situated, the Turrbal and Jagera people. We pay respects to their Ancestors and descendants, who continue cultural and spiritual connections to Country.
JRC thanks the Nederlandse Organisatie voor Wetenschappelijk Onderzoek (NWO) for support via the Talent Programme Veni grant. The LOFAR data in this manuscript were (partly) processed by the LOFAR Two-Metre Sky Survey (LoTSS) team. ADF acknowledges the support from the National Science Foundation Graduate Research Fellowship Program under Grant No. (DGE-1746045). MNG acknowledges support from MIT’s Kavli Institute as a Juan Carlos Torres Fellow. Any opinions, findings, and conclusions or recommendations expressed in this material are those of the authors and do not necessarily reflect the views of the National Science Foundation.
This team made use of the LOFAR direction independent calibration pipeline (https://github.com/lofar-astron/prefactor), which was deployed by the LOFAR e-infragroup on the Dutch National Grid infrastructure with support of the SURF Co-operative through grants e-infra 160022 and e-infra 160152 (Mechev et al., 2017). The LoTSS direction dependent calibration and imaging pipeline (http://github.com/mhardcastle/ddf-pipeline/) was run on computing clusters at Leiden Observatory and the University of Hertfordshire, which are supported by a European Research Council Advanced Grant [NEWCLUSTERS-321271] and the UK Science and Technology Funding Council [ST/P000096/1]. This paper includes data collected by the TESS mission. Funding for the TESS mission is provided by the NASA Explorer Program.
This research has made use of the SIMBAD database, operated at CDS, Strasbourg, France, and NASA’s Astrophysics Data System.
References
- Astropy Collaboration et al. (2013) Astropy Collaboration, Robitaille, T. P., Tollerud, E. J., et al. 2013, A&A, 558, A33, doi: 10.1051/0004-6361/201322068
- Benz & Güdel (1994) Benz, A. O., & Güdel, M. 1994, A&A, 285, 621
- Bigg (1964) Bigg, E. K. 1964, Nature, 203, 1008, doi: 10.1038/2031008a0
- Callingham et al. (2021a) Callingham, J. R., Vedantham, H. K., Shimwell, T. W., & Pope, B. J. S. 2021a, Nature Astronomy (in press), xxx, xxx
- Callingham et al. (2021b) Callingham, J. R., Pope, B. J. S., Feinstein, A. D., et al. 2021b, A&A, 648, A13, doi: 10.1051/0004-6361/202039144
- Cloutier et al. (2020) Cloutier, R., Eastman, J. D., Rodriguez, J. E., et al. 2020, AJ, 160, 3, doi: 10.3847/1538-3881/ab91c2
- Cowley & Bunce (2001) Cowley, S. W. H., & Bunce, E. J. 2001, Planet. Space Sci., 49, 1067, doi: 10.1016/S0032-0633(00)00167-7
- Crosley & Osten (2018) Crosley, M. K., & Osten, R. A. 2018, ApJ, 862, 113, doi: 10.3847/1538-4357/aacf02
- Davis et al. (2021) Davis, I., Vedantham, H. K., Callingham, J. R., et al. 2021, arXiv e-prints, arXiv:2105.01021. https://arxiv.org/abs/2105.01021
- Dulk (1985) Dulk, G. A. 1985, ARA&A, 23, 169, doi: 10.1146/annurev.aa.23.090185.001125
- Feinstein et al. (2020a) Feinstein, A., Montet, B., & Ansdell, M. 2020a, The Journal of Open Source Software, 5, 2347, doi: 10.21105/joss.02347
- Feinstein et al. (2020b) Feinstein, A. D., Montet, B. T., Ansdell, M., et al. 2020b, AJ, 160, 219, doi: 10.3847/1538-3881/abac0a
- Foster et al. (2020) Foster, G., Poppenhaeger, K., Alvarado-Gómez, J. D., & Schmitt, J. H. M. M. 2020, MNRAS, 497, 1015, doi: 10.1093/mnras/staa1982
- Gaia Collaboration et al. (2018) Gaia Collaboration, Brown, A. G. A., Vallenari, A., et al. 2018, A&A, 616, A1, doi: 10.1051/0004-6361/201833051
- Gardner et al. (2006) Gardner, J. P., Mather, J. C., Clampin, M., et al. 2006, Space Sci. Rev., 123, 485, doi: 10.1007/s11214-006-8315-7
- Garraffo et al. (2017) Garraffo, C., Drake, J. J., Cohen, O., Alvarado-Gómez, J. D., & Moschou, S. P. 2017, ApJ, 843, L33, doi: 10.3847/2041-8213/aa79ed
- Gehrels (1986) Gehrels, N. 1986, ApJ, 303, 336, doi: 10.1086/164079
- Günther et al. (2020) Günther, M. N., Zhan, Z., Seager, S., et al. 2020, AJ, 159, 60, doi: 10.3847/1538-3881/ab5d3a
- Güdel & Benz (1993) Güdel, M., & Benz, A. O. 1993, ApJ, 405, L63, doi: 10.1086/186766
- Handberg et al. (2021) Handberg, R., Lund, M. N., White, T. R., et al. 2021, arXiv e-prints, arXiv:2106.08341. https://arxiv.org/abs/2106.08341
- Hill & Michel (1976) Hill, T. W., & Michel, F. C. 1976, J. Geophys. Res., 81, 4561, doi: 10.1029/JA081i025p04561
- Hsu et al. (2020) Hsu, D. C., Ford, E. B., & Terrien, R. 2020, MNRAS, 498, 2249, doi: 10.1093/mnras/staa2391
- Hunter (2007) Hunter, J. D. 2007, Computing In Science & Engineering, 9, 90
- Jones et al. (2001) Jones, E., Oliphant, T., Peterson, P., & Others. 2001, SciPy: Open source scientific tools for Python. http://www.scipy.org/
- Kaiser & Desch (1984) Kaiser, M. L., & Desch, M. D. 1984, Reviews of Geophysics and Space Physics, 22, 373, doi: 10.1029/RG022i004p00373
- Kavanagh et al. (2021) Kavanagh, R. D., Vidotto, A. A., Klein, B., et al. 2021, arXiv e-prints, arXiv:2103.16318. https://arxiv.org/abs/2103.16318
- Lightkurve Collaboration et al. (2018) Lightkurve Collaboration, Cardoso, J. V. d. M., Hedges, C., et al. 2018, Lightkurve: Kepler and TESS time series analysis in Python, Astrophysics Source Code Library. http://ascl.net/1812.013
- Lynch et al. (2018) Lynch, C. R., Murphy, T., Lenc, E., & Kaplan, D. L. 2018, MNRAS, doi: 10.1093/mnras/sty1138
- Mahadevan et al. (2021) Mahadevan, S., Stefánsson, G., Robertson, P., et al. 2021, arXiv e-prints, arXiv:2102.02233. https://arxiv.org/abs/2102.02233
- Matthews (2019) Matthews, L. D. 2019, PASP, 131, 016001, doi: 10.1088/1538-3873/aae856
- Mechev et al. (2017) Mechev, A., Oonk, J. B. R., Danezi, A., et al. 2017, in Proceedings of the International Symposium on Grids and Clouds (ISGC) 2017, 2. https://arxiv.org/abs/1712.00312
- Melrose (1980) Melrose, D. B. 1980, Space Sci. Rev., 26, 3, doi: 10.1007/BF00212597
- Morin et al. (2010) Morin, J., Donati, J. F., Petit, P., et al. 2010, MNRAS, 407, 2269, doi: 10.1111/j.1365-2966.2010.17101.x
- Morley et al. (2017) Morley, C. V., Kreidberg, L., Rustamkulov, Z., Robinson, T., & Fortney, J. J. 2017, The Astrophysical Journal, 850, 121, doi: 10.3847/1538-4357/aa927b
- Newton et al. (2017) Newton, E. R., Irwin, J., Charbonneau, D., et al. 2017, ApJ, 834, 85, doi: 10.3847/1538-4357/834/1/85
- Nowak et al. (2020) Nowak, G., Luque, R., Parviainen, H., et al. 2020, A&A, 642, A173, doi: 10.1051/0004-6361/202037867
- Osten et al. (2006) Osten, R. A., Hawley, S. L., Allred, J., et al. 2006, ApJ, 647, 1349, doi: 10.1086/504889
- Pawsey et al. (1946) Pawsey, J. L., Payne-Scott, R., & McCready, L. L. 1946, Nature, 157, 158, doi: 10.1038/157158a0
- Pérez & Granger (2007) Pérez, F., & Granger, B. E. 2007, Computing in Science and Engineering, 9, 21, doi: 10.1109/MCSE.2007.53
- Pérez-Torres et al. (2021) Pérez-Torres, M., Gómez, J. F., Ortiz, J. L., et al. 2021, A&A, 645, A77, doi: 10.1051/0004-6361/202039052
- Perger et al. (2021) Perger, M., Ribas, I., Anglada-Escudé, G., et al. 2021, arXiv e-prints, arXiv:2103.10216. https://arxiv.org/abs/2103.10216
- Pineda et al. (2017) Pineda, J. S., Hallinan, G., & Kao, M. M. 2017, ApJ, 846, 75, doi: 10.3847/1538-4357/aa8596
- Pope et al. (2020) Pope, B. J. S., Bedell, M., Callingham, J. R., et al. 2020, ApJ, 890, L19, doi: 10.3847/2041-8213/ab5b99
- Pope et al. (2019) Pope, B. J. S., Withers, P., Callingham, J. R., & Vogt, M. F. 2019, MNRAS, 484, 648, doi: 10.1093/mnras/sty3512
- Pritchard et al. (2021) Pritchard, J., Murphy, T., Zic, A., et al. 2021, MNRAS, 502, 5438, doi: 10.1093/mnras/stab299
- Ricker et al. (2015) Ricker, G. R., Winn, J. N., Vanderspek, R., et al. 2015, Journal of Astronomical Telescopes, Instruments, and Systems, 1, 014003, doi: 10.1117/1.JATIS.1.1.014003
- Shields et al. (2016) Shields, A. L., Ballard, S., & Johnson, J. A. 2016, Phys. Rep., 663, 1, doi: 10.1016/j.physrep.2016.10.003
- Shimwell et al. (2017) Shimwell, T. W., Röttgering, H. J. A., Best, P. N., et al. 2017, A&A, 598, A104, doi: 10.1051/0004-6361/201629313
- Stassun et al. (2019) Stassun, K. G., Oelkers, R. J., Paegert, M., et al. 2019, AJ, 158, 138, doi: 10.3847/1538-3881/ab3467
- Stepanov et al. (2001) Stepanov, A. V., Kliem, B., Zaitsev, V. V., et al. 2001, A&A, 374, 1072, doi: 10.1051/0004-6361:20010518
- Tarter et al. (2007) Tarter, J. C., Backus, P. R., Mancinelli, R. L., et al. 2007, Astrobiology, 7, 30, doi: 10.1089/ast.2006.0124
- Treumann (2006) Treumann, R. A. 2006, A&A Rev., 13, 229, doi: 10.1007/s00159-006-0001-y
- Trigilio et al. (2018) Trigilio, C., Umana, G., Cavallaro, F., et al. 2018, MNRAS, 481, 217, doi: 10.1093/mnras/sty2280
- Turner et al. (2021) Turner, J. D., Zarka, P., Grießmeier, J.-M., et al. 2021, A&A, 645, A59, doi: 10.1051/0004-6361/201937201
- Turnpenney et al. (2017) Turnpenney, S., Nichols, J. D., Wynn, G. A., & Casewell, S. L. 2017, MNRAS, 470, 4274, doi: 10.1093/mnras/stx1508
- Van Der Walt et al. (2011) Van Der Walt, S., Colbert, S. C., & Varoquaux, G. 2011, Computing in Science & Engineering, 13, 22
- van Haarlem et al. (2013) van Haarlem, M. P., Wise, M. W., Gunst, A. W., et al. 2013, A&A, 556, A2, doi: 10.1051/0004-6361/201220873
- Vedantham et al. (2020) Vedantham, H. K., Callingham, J. R., Shimwell, T. W., et al. 2020, Nature Astronomy, 4, 577, doi: 10.1038/s41550-020-1011-9
- Zarka (1998) Zarka, P. 1998, J. Geophys. Res., 103, 20159, doi: 10.1029/98JE01323
- Zarka et al. (2001) Zarka, P., Treumann, R. A., Ryabov, B. P., & Ryabov, V. B. 2001, Ap&SS, 277, 293, doi: 10.1023/A:1012221527425
- Zic et al. (2020) Zic, A., Murphy, T., Lynch, C., et al. 2020, ApJ, 905, 23, doi: 10.3847/1538-4357/abca90