Landslide Detection in Real-Time Social Media Image Streams
Abstract
Lack of global data inventories obstructs scientific modeling of and response to landslide hazards which are oftentimes deadly and costly. To remedy this limitation, new approaches suggest solutions based on citizen science that requires active participation. However, as a non-traditional data source, social media has been increasingly used in many disaster response and management studies in recent years. Inspired by this trend, we propose to capitalize on social media data to mine landslide-related information automatically with the help of artificial intelligence (AI) techniques. Specifically, we develop a state-of-the-art computer vision model to detect landslides in social media image streams in real time. To that end, we create a large landslide image dataset labeled by experts and conduct extensive model training experiments. The experimental results indicate that the proposed model can be deployed in an online fashion to support global landslide susceptibility maps and emergency response.
Introduction
Landslides occur all around the world and cause thousands of deaths and billions of dollars in infrastructural damage worldwide every year (Kjekstad and Highland 2009). However, landslide events are often under-reported and insufficiently documented due to their complex natural phenomena governed by various intrinsic and external conditioning and triggering factors such as earthquakes and tropical storms, which are usually more conspicuous, and hence, more widely reported (Lee and Jones 2004). Due to this oversight and lack of global data inventories to study landslides, any attempt to quantify global landslide hazards and the associated impacts is destined to be an underestimation (Froude and Petley 2018).
In an attempt to tackle the challenge of building a global landslide inventory, NASA launched a website111https://gpm.nasa.gov/landslides/index.html in 2018 to allow citizens to report about the regional landslides they see in-person or online (Juang, Stanley, and Kirschbaum 2019). Following the same idea, researchers further developed other means such as mobile apps to collect citizen-provided data (Kocaman and Gokceoglu 2019; Cieslik et al. 2019). These efforts also help address concerns about news media sources’ reporting biases (Moeller 2006; Pennington and Harrison 2013). However, this means the bulk of data collection and interpretation still involves time consuming work by specialists searching the Internet for news and social media reports, or directly engaging in communications with those submitting information and then interpreting the data received (Kocaman and Gokceoglu 2019; Juang, Stanley, and Kirschbaum 2019; Pennington et al. 2015; Taylor et al. 2015).
To alleviate the need for opt-in participation and manual processing, we strive to develop a state-of-the-art AI model that can automatically detect landslides222By landslides, we refer to all downward and outward movement of loosen slope materials such as landslip, debris flows, mudslides, rockfalls, earthflows, and other mass movements. in social media image streams in real time. To achieve this goal, we first create a large image dataset comprising more than 11,000 images from various data sources annotated by domain experts. We then exploit this dataset in a comprehensive experimentation searching for the optimal landslide model configuration. This exploration reveals interesting insights about the model training process. More importantly, the experimental results show that the optimal landslide model achieves a promising performance on a held-out test set. Based on this model, we envision a system that can contribute to harvesting of global landslide data, and hence, facilitate further landslide research. Furthermore, it can support global landslide susceptibility maps to provide situational awareness and improve emergency response and decision making.
Related Work
The literature on landslide detection and mapping approaches mainly uses four types of data sources: (i) physical sensors, (ii) remote sensing, (iii) volunteers, and (iv) social networks. Sensor-based approaches rely on land characteristics such as rainfall, altitude, soil type, and slope, to detect landslides and develop models to predict future events (Merghadi et al. 2020; Ramesh, Kumar, and Rangan 2009). While these approaches can be highly accurate for sub-catchments to the referenced data area, their large-scale deployment is extremely costly.
Earth observation data obtained using high-resolution satellite imagery has been widely used for landslide detection, mapping, and monitoring (Tofani et al. 2013). Remote sensing techniques either use Synthetic Aperture Radar (SAR) or optical imagery to perform landslide detection as an image classification, segmentation, object detection, or change detection task (Mohan et al. 2021; Cheng et al. 2013). While remote sensing through satellites can be useful to monitor landslides globally, their deployment can prove costly and time-consuming. Moreover, satellite data is susceptible to noise such as clouds.
A few studies demonstrate the use of Volunteered Geographical Information (VGI) as an alternative method to detect landslides (Kocaman and Gokceoglu 2019; Can, Kocaman, and Gokceoglu 2019, 2020). These studies assume active participation of volunteers to collect landslide data where the volunteers opt in to use a mobile app to provide information such as photos, time of occurrence, damage description and other observations about a landslide event. On the contrary, our work aims to capitalize on massive social media data without any active participation requirement and with better scalability. In addition, we construct a much larger dataset to train deep learning models and perform more extensive experimental evaluations.
The use of social media data for landslide detection has not been explored extensively. To the best of our knowledge, no prior work has explored the use of social media imagery to detect landslides. The most relevant work reported in (Musaev, Wang, and Pu 2014; Musaev et al. 2017) combines social media text data and physical sensors to detect landslides. The authors used textual messages collected through a set of landslide-related keywords on Twitter, Instagram, and YouTube, which were then combined with sensor data about seismic activity and rainfall to train a machine learning classifier that can identify landslide incidents. In this study, we focus on analyzing social media images which can provide more detailed information about the impact of the landslide event. To that end, our work can be considered as complementary to prior art.
Dataset
| LANDSLIDE | NOT-LANDSLIDE | ||||
|
|
|
|
|
|
|
|
|
|
|
|
|
|
|
|
|
|
|
|
|
|
|
|
| BGS | BGS | ||||
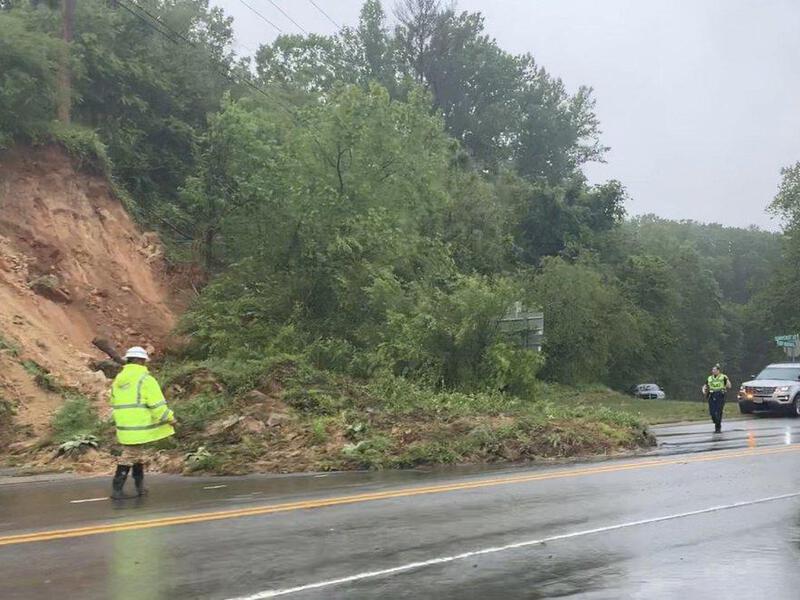
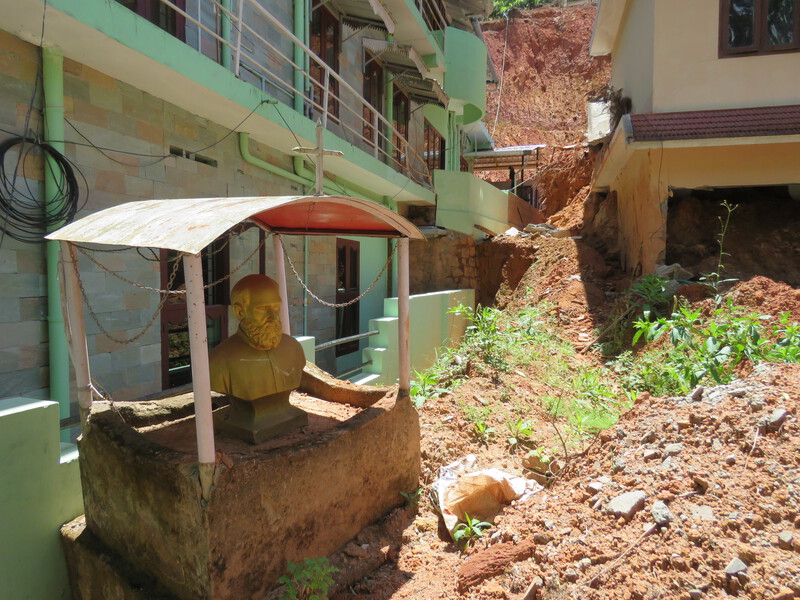
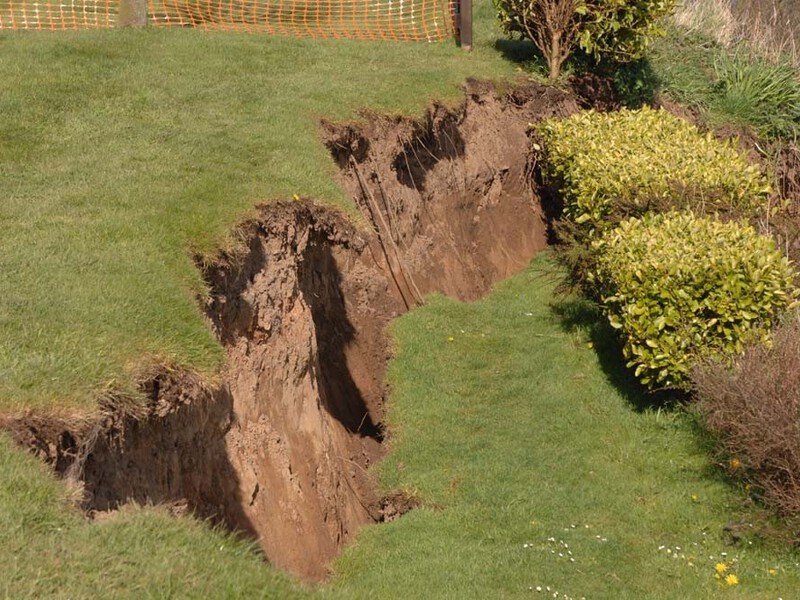
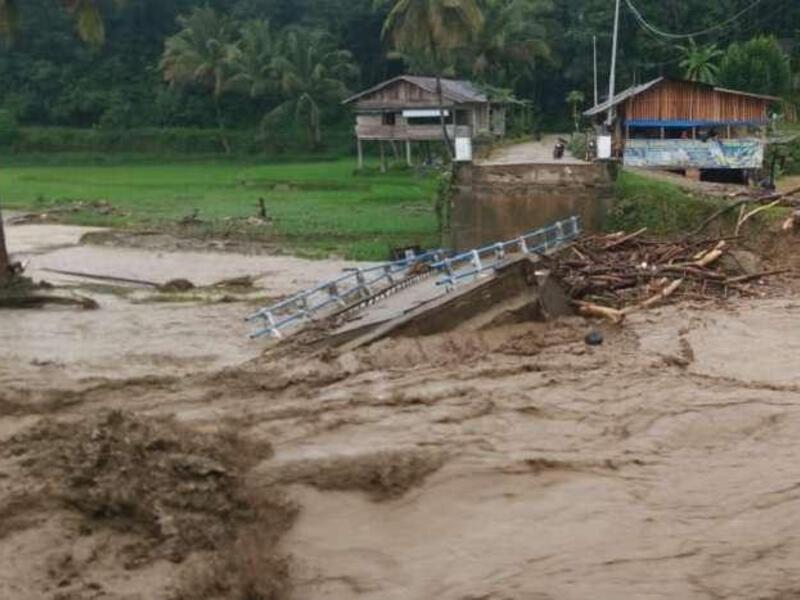
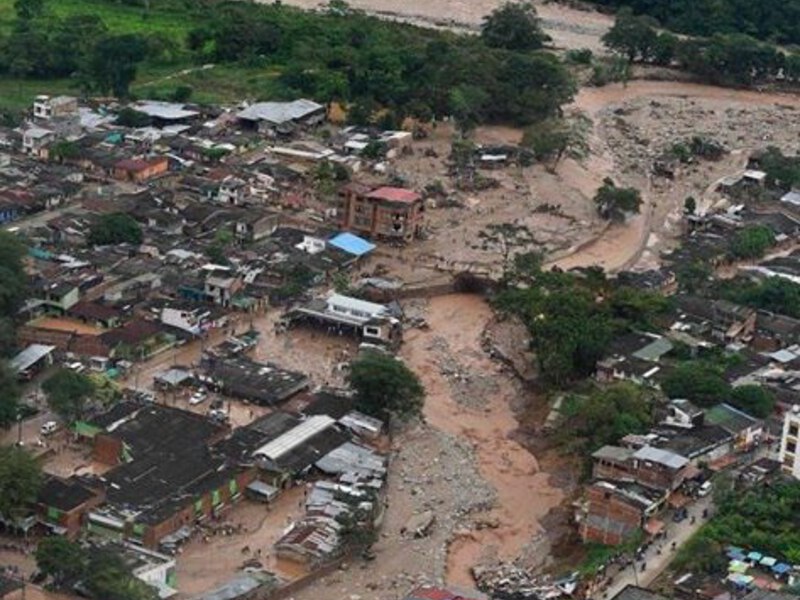
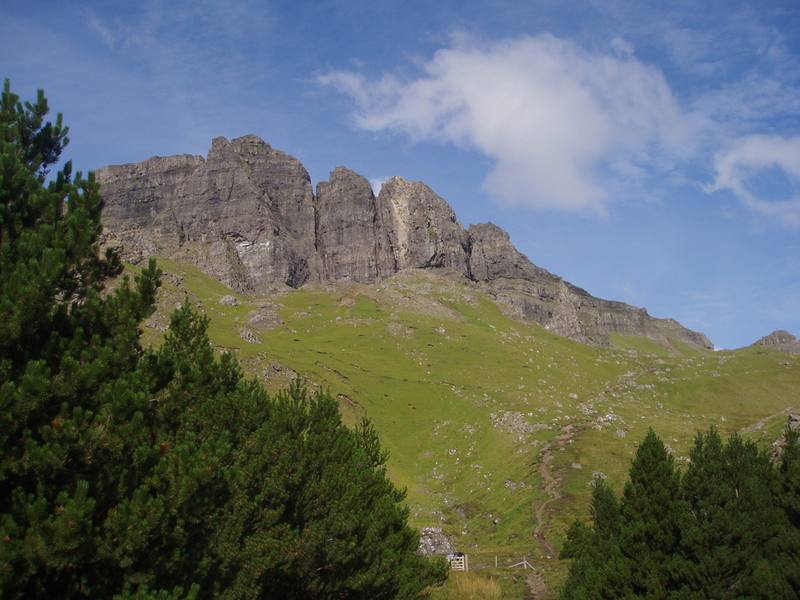
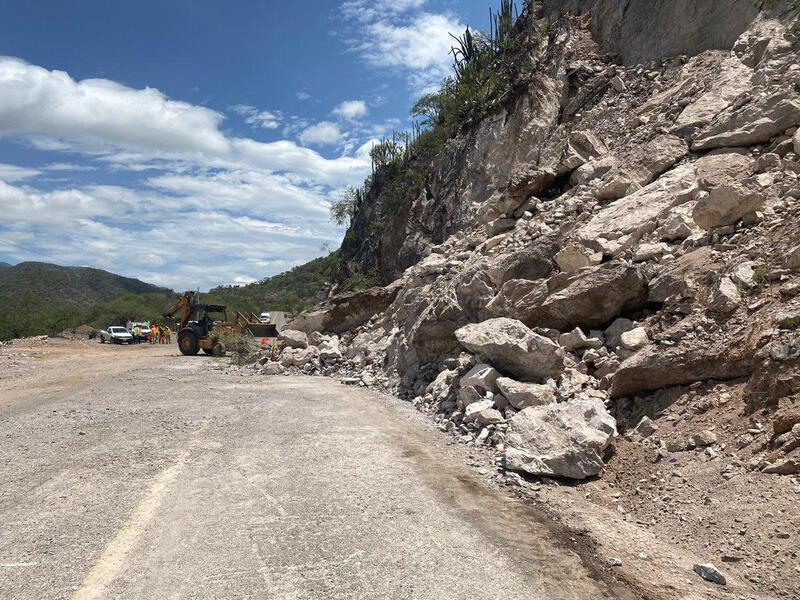
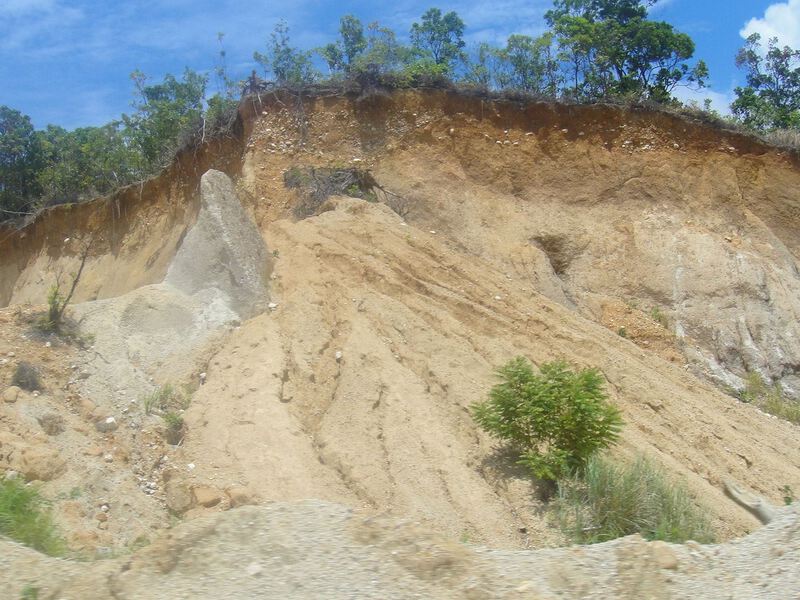
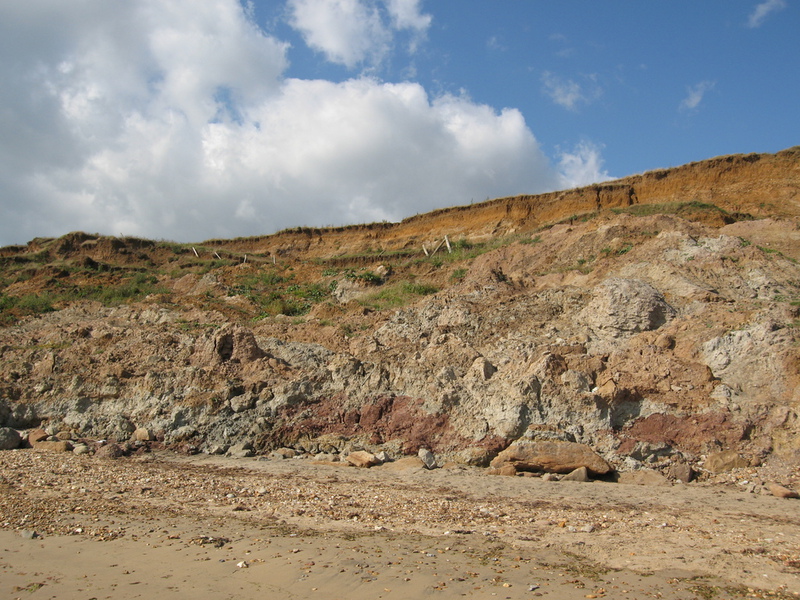
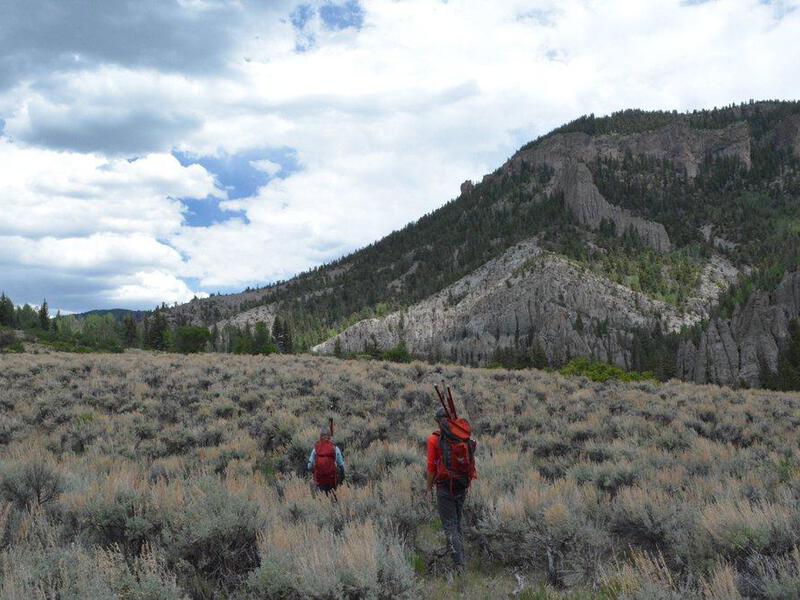
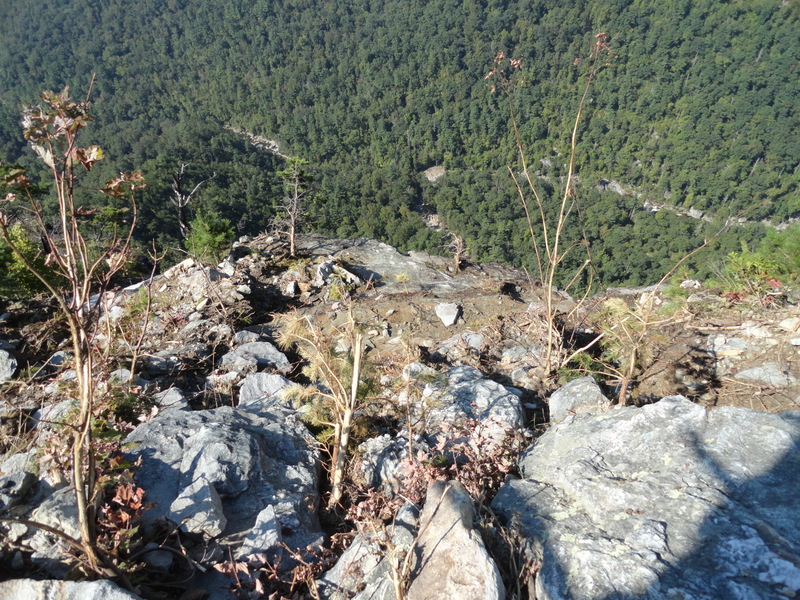
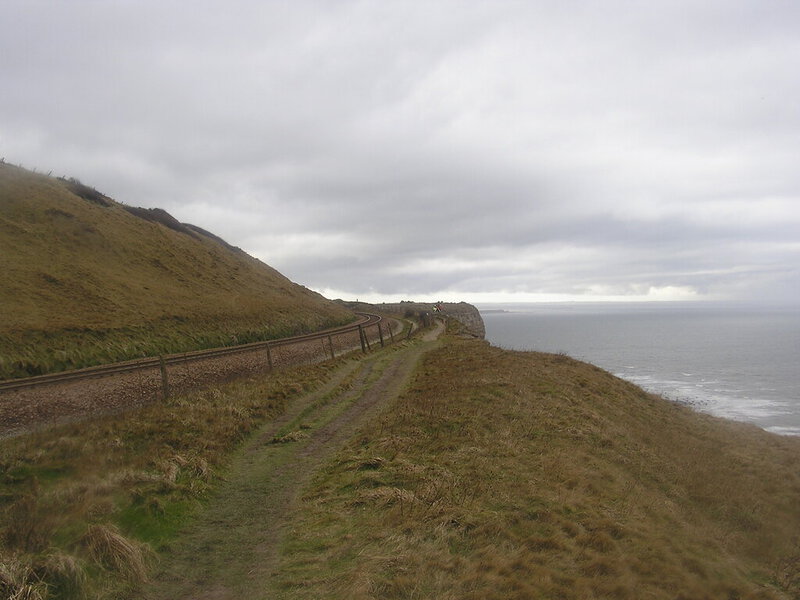
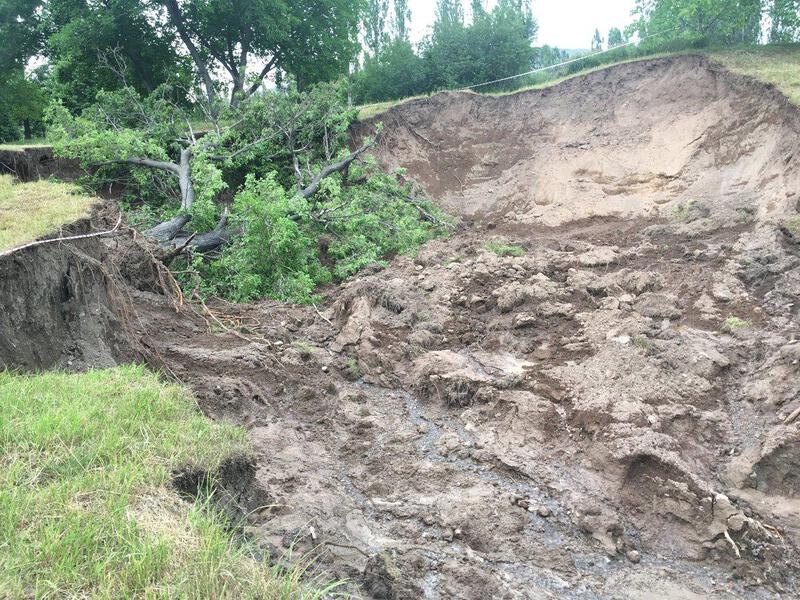
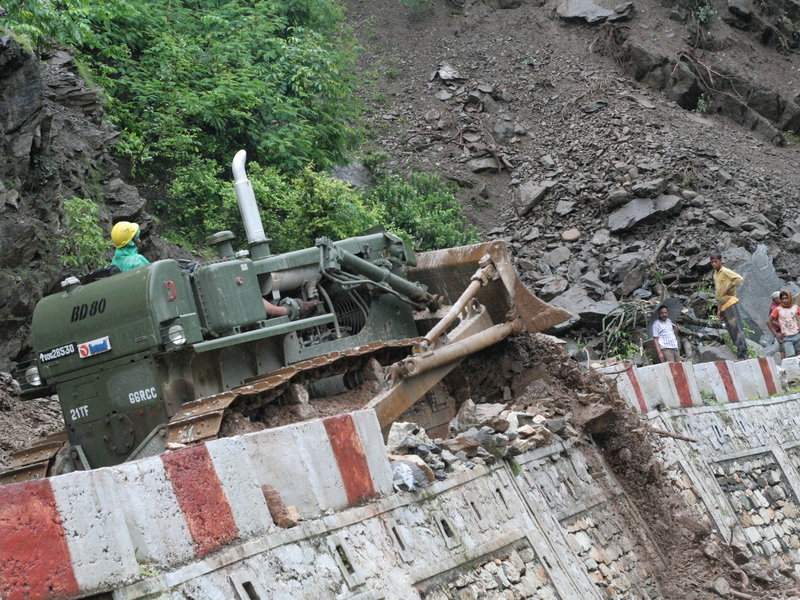
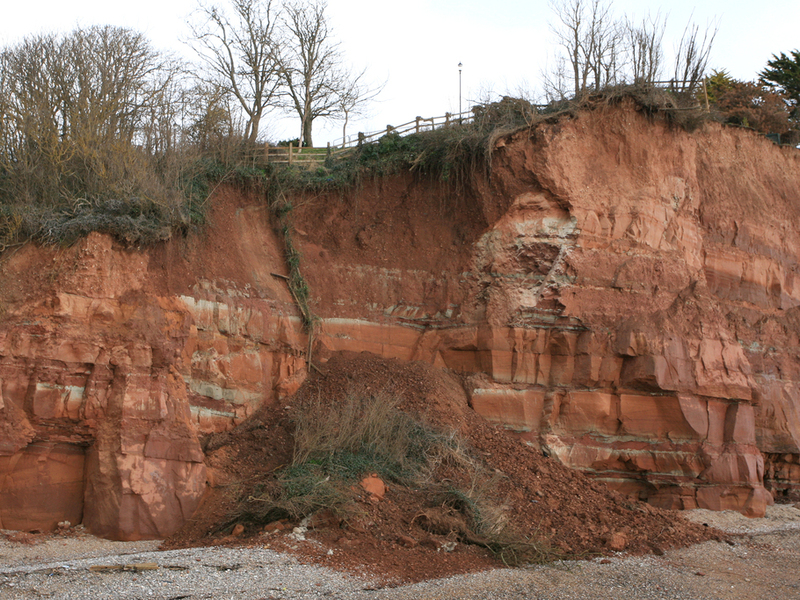
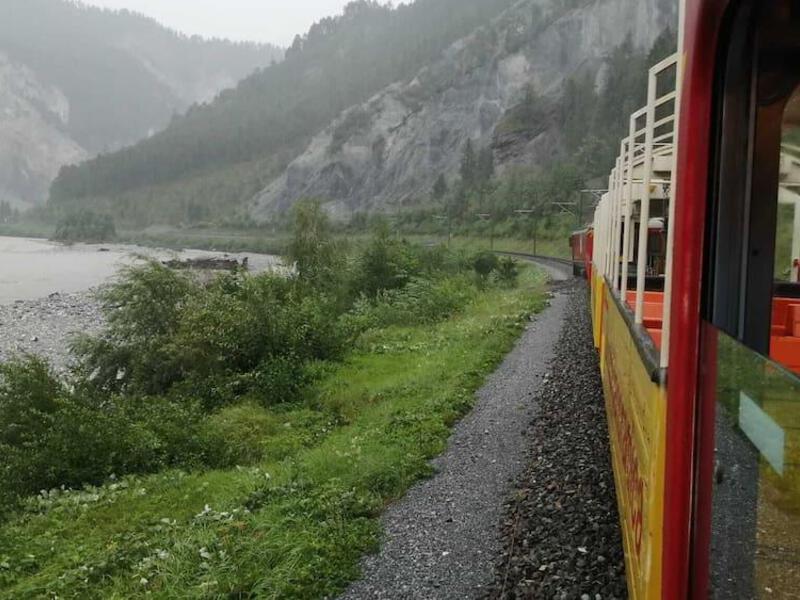
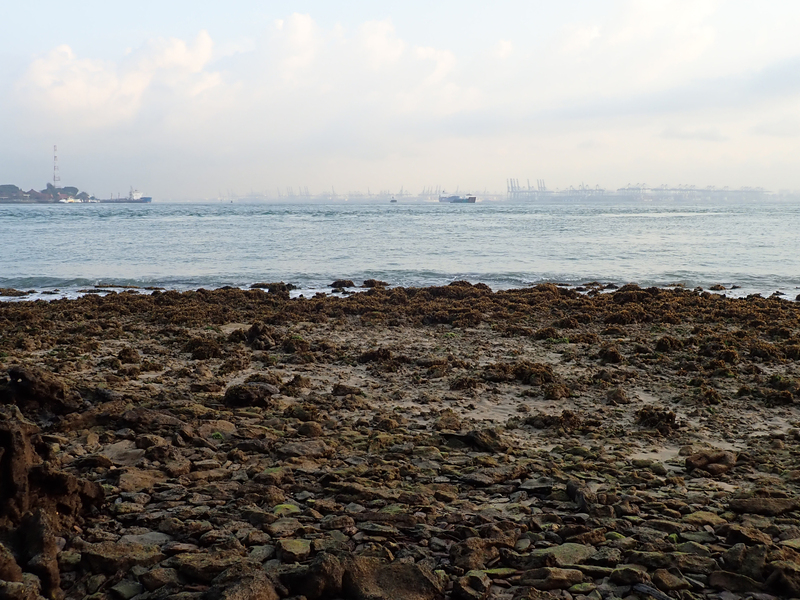
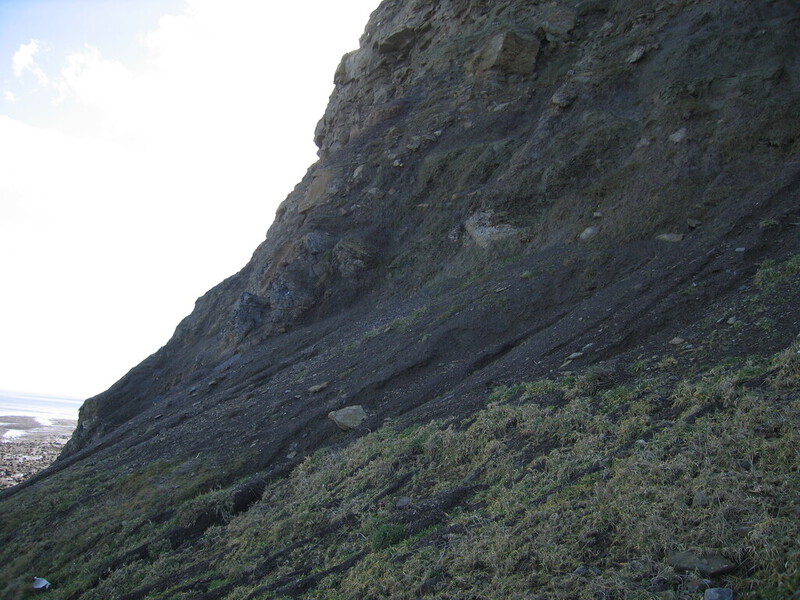
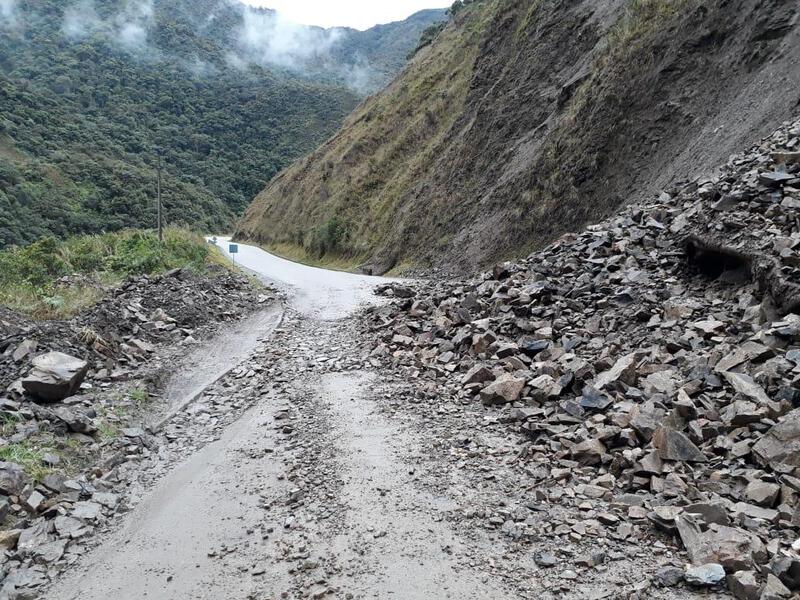
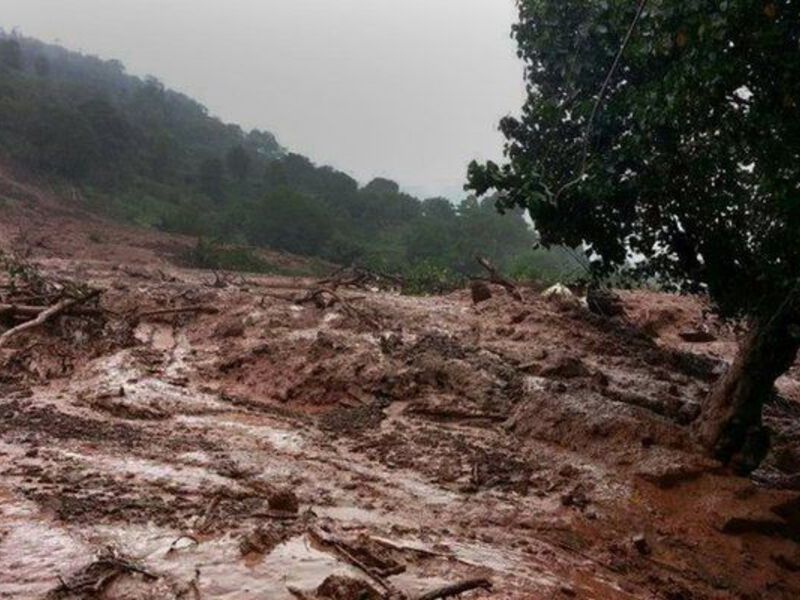
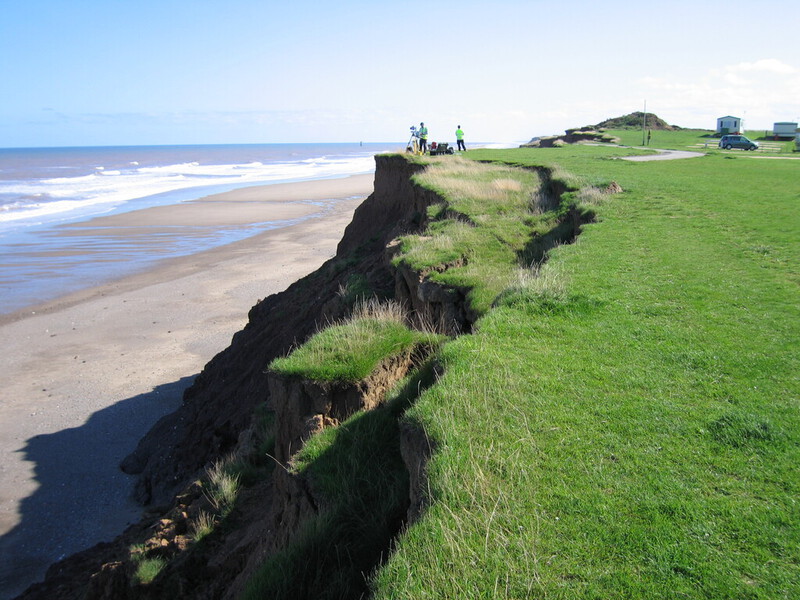
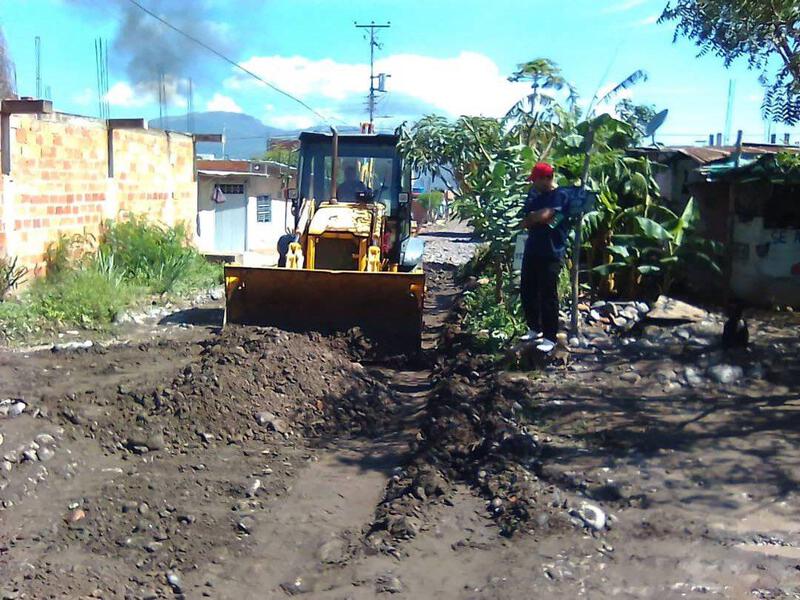
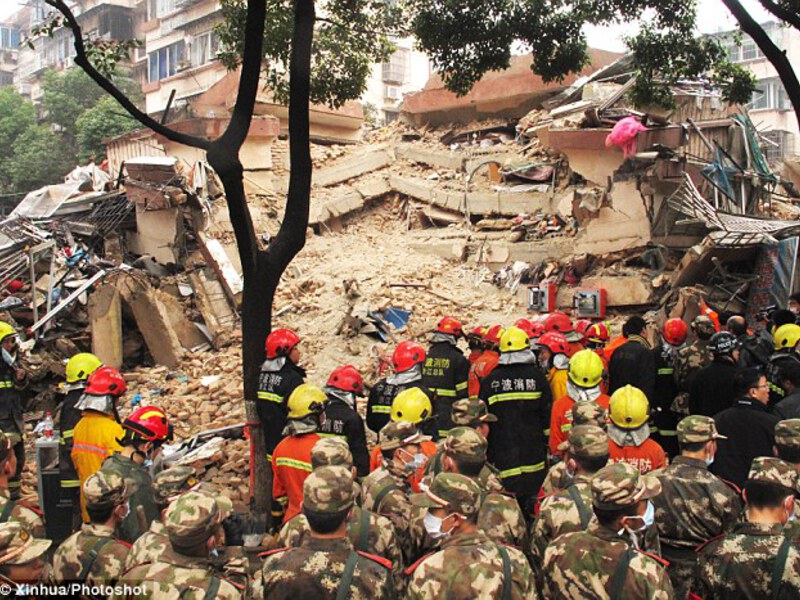
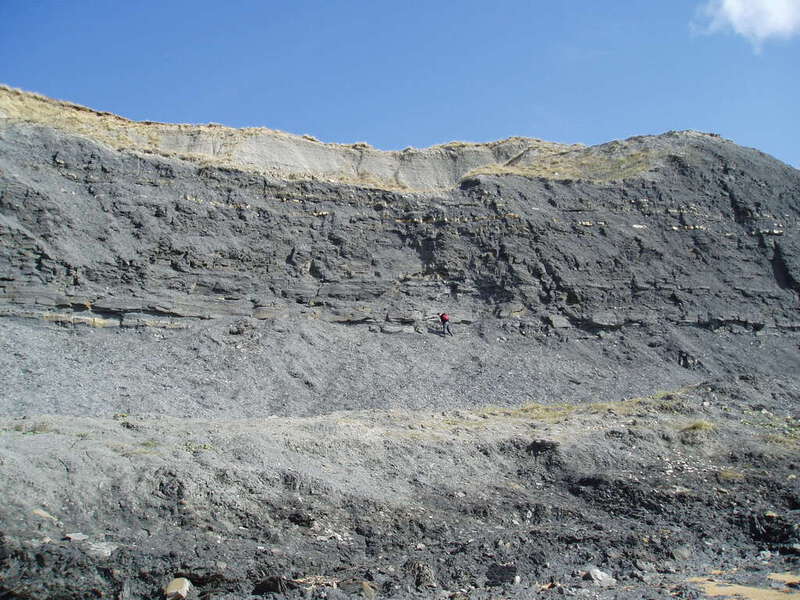
To train models that can detect landslides in images, we curated a large image dataset from multiple sources with different characteristics. Some images were obtained from the Web using Google Image search with keywords such as landslide, landslip, earth slip, mudslide, rockslide, rock fall whereas some images were collected from Twitter using similar landslide-related hashtags. Additional images were obtained from the British Geological Survey archives. The images obtained from social media or the Web are usually noisy and can include duplicates. Therefore, the collected data is manually labeled by three landslide experts who are also co-authors of this study. Since the AI task at hand is “given an image, recognize landslides” (i.e., no other external information or expert knowledge is available to the AI model), the experts were instructed to keep this computer-vision perspective in mind and label only the most evident cases as “landslide” images (i.e., the images where the landslide is the main theme exhibiting substantial visual cues for the computer vision model to learn from). In this context, the BGS images were also included in the labeling process to maintain label consistency across the dataset. On the other hand, since our ultimate goal is to develop a system that will continuously monitor the noisy social media streams to detect landslide events in real time, we retained negative (i.e., not-landslide) images that illustrate completely irrelevant cases (e.g., cartoons, advertisements, selfies) as well as difficult scenarios such as post-disaster images from earthquakes and floods in addition to other natural scenes without landslides in the final dataset. Despite the inherent difficulty of the task, the experts achieved an overall Fleiss’ Kappa score of 0.58 (Fleiss 1971), which indicates an almost substantial inter-annotator agreement. The final dataset contains 11,737 images. Some example images are shown in Figure 1. The distribution of images across data sources is summarized in Table 1 and their breakdown into data splits are presented in Table 2. As suggested by Table 2, only about 23% of the images are categorized as “landslide”.
| Training | Validation | Test | Total | |
|---|---|---|---|---|
| 4,398 | 628 | 1,258 | 6,284 | |
| 807 | 115 | 231 | 1,153 | |
| BGS | 3,010 | 430 | 860 | 4,300 |
| Total | 8,215 | 1,173 | 2,349 | 11,737 |
| Training | Validation | Test | Total | |
|---|---|---|---|---|
| Landslide | 1,883 | 271 | 536 | 2,690 |
| Not-landslide | 6,332 | 902 | 1,813 | 9,047 |
| Total | 8,215 | 1,173 | 2,349 | 11,737 |
Landslide Model
Many computer vision tasks have greatly benefited from the recent advances in deep learning. The features learned in deep convolutional neural networks (CNNs) are proven to be transferable and quite effective when used in other visual recognition tasks (Donahue et al. 2014; Sermanet et al. 2014; Zeiler and Fergus 2014; Girshick et al. 2014; Oquab et al. 2014), particularly when training samples are limited and learning a successful deep model is not feasible. Considering we also have limited training examples for data-hungry deep CNNs, we follow a transfer learning approach to adapt the features and parameters of the network from the broad domain (i.e., large-scale image classification) to the specific one (i.e., landslide classification). To that end, we conducted extensive experiments where we trained several different deep CNN architectures using different optimizers, learning rates, weight decays, and class balancing strategies.
CNN Architecture. The type of CNN architecture (arch) plays a significant role on the performance of the resulting model depending on the available data size and problem characteristics. Therefore, we explored a representative sample of well-known CNN architectures in our experiments including VGG16 (Simonyan and Zisserman 2015), ResNet18, ResNet50, ResNet101 (He et al. 2016), DenseNet (Huang et al. 2017), InceptionNet (Szegedy et al. 2016), and EfficientNet (Tan and Le 2019), among others.
Optimizer. An optimizer (opt) is an algorithm or method that changes the attributes of a neural network (e.g., weights and learning rate) in order to reduce the optimization loss and to increase the desired performance metric (e.g., accuracy). In this study, we experimented with the most popular optimizers, i.e., Stochastic Gradient Descent (SGD) and Adam (Kingma and Ba 2015) with decoupled weight decay regularization (Loshchilov and Hutter 2019).
Learning rate. Learning rate (lr) controls how quickly the model is adapted to the problem. Using a too large learning rate can cause the model to converge too quickly to a suboptimal solution whereas a too small learning rate can cause the process to get stuck. Since learning rate is one of the most important hyperparameters and setting it correctly is critical for real-world applications, we performed a grid search over a range of values typically covered in the literature (i.e., ).
Weight decay. Weight decay (wd) controls the regularization of the model weights, which in turn, helps to avoid overfitting of a deep neural network on the training data and improve the performance of the model on the unseen data (i.e., better generalization ability). In light of this, we experimented with a range of weight decay values (i.e., ).
Class balancing. An imbalanced dataset can bias the prediction model towards the dominant class (i.e., not-landslide) and lead to poor performance on the minority class (i.e., landslide), which would not be ideal for our application. There are many approaches to tackle this problem, ranging from generating synthetic data to using specialized algorithms and loss functions. In this study, we explored one of the basic approaches, i.e., data resampling, where we oversampled images from the landslide class (i.e., sampling with replacement) to create a balanced training set.
Other training details. We ran all our experiments on Nvidia Tesla P100 GPUs with 16GB memory using PyTorch library.333https://pytorch.org/ We adjusted the batch size according to each CNN architecture in order to maximize GPU memory utilization. We used a fixed step size of 50 epochs in the learning rate scheduler of the SGD optimizer and a fixed patience of 50 epochs in the ‘ReduceLROnPlateau’ scheduler of the Adam optimizer, both with a factor of 0.1. All of the models were initialized using the weights pretrained on ImageNet (Russakovsky et al. 2015) and trained for a total of 200 epochs. Consequently, we trained a total of 560 CNN models in our quest for the best model configuration.
Results
Due to limited space, Table 3 presents results only for the best performing 10 model configurations ranked based on F1-scores obtained on the validation set. The top-performing model configuration (i.e., arch: ResNet50, opt: Adam, lr: , wd: , no class balancing) achieves an F1-score of 0.805 and an overall accuracy of 0.913, which is deemed plausible performance by the landslide specialists.
| Optimizer | Architecture |
|
|
|
Accuracy | Precision | Recall | F1 | ||||||
|---|---|---|---|---|---|---|---|---|---|---|---|---|---|---|
| Adam | ResNet50 | No | 0.913 | 0.834 | 0.779 | 0.805 | ||||||||
| Adam | ResNet50 | Yes | 0.912 | 0.868 | 0.731 | 0.794 | ||||||||
| SGD | ResNet50 | Yes | 0.907 | 0.816 | 0.771 | 0.793 | ||||||||
| SGD | EfficientNet | No | 0.904 | 0.793 | 0.790 | 0.791 | ||||||||
| SGD | ResNet50 | No | 0.906 | 0.821 | 0.760 | 0.789 | ||||||||
| Adam | ResNet50 | No | 0.906 | 0.826 | 0.753 | 0.788 | ||||||||
| Adam | ResNet50 | Yes | 0.907 | 0.835 | 0.745 | 0.788 | ||||||||
| SGD | ResNet101 | No | 0.904 | 0.806 | 0.768 | 0.786 | ||||||||
| SGD | DenseNet | No | 0.905 | 0.819 | 0.753 | 0.785 | ||||||||
| Adam | EfficientNet | No | 0.905 | 0.819 | 0.753 | 0.785 |
Nevertheless, we investigate the full table of results for interesting patterns and identify the following insights:
-
•
When everything but the optimizer is kept fixed, the models trained with the Adam optimizer outperforms the models trained with the SGD optimizer (175 vs. 104).
-
•
Despite the fact that top-performing model is trained without a class balancing strategy, the overall trend indicates that, while everything else is the same, the models trained with class balancing yield better performance than those trained without class balancing (178 vs. 95).
-
•
ResNet50 architecture tops the rankings among all CNN architectures by achieving the best average ranking as well as the highest mean F1-score according to Table 4. However, the overall difference between architectures do not seem to be significant except for InceptionNet which yields a significantly poor performance than others.
-
•
The impact of the learning rate on model performance shows opposite trends for different optimizers. As per Table 5, smaller learning rates (e.g., ) seem to work better with the Adam optimizer whereas larger learning rates (e.g., ) seem to work better with the SGD optimizer.
-
•
As expected, the value of the weight decay also impacts the overall performance significantly (in particular, for the Adam optimizer). A large weight decay (e.g., ) hurts the overall performance which tends to improve as the weight decay takes on smaller values (see Table 6).
| Architecture | mean(F1) | std(F1) | Avg. Rank |
|---|---|---|---|
| ResNet50 | 0.6308 | 0.2262 | 2.70 |
| DenseNet | 0.6256 | 0.2131 | 3.19 |
| ResNet101 | 0.6259 | 0.2146 | 3.28 |
| VGG16 | 0.6114 | 0.2293 | 3.74 |
| EfficientNet | 0.6029 | 0.2089 | 3.90 |
| ResNet18 | 0.6003 | 0.2176 | 4.48 |
| InceptionNet | 0.4001 | 0.1933 | 6.73 |
| Adam | Learning Rate | SGD | ||
|---|---|---|---|---|
| (mean) | (std) | (mean) | (std) | |
| 0.6843 | 0.0904 | 0.2168 | 0.2102 | |
| 0.7001 | 0.0890 | 0.4292 | 0.2339 | |
| 0.7203 | 0.0954 | 0.6600 | 0.1130 | |
| 0.6298 | 0.1382 | 0.7185 | 0.0778 | |
| 0.3791 | 0.2525 | 0.7145 | 0.0858 | |
| Adam | Weight Decay | SGD | ||
|---|---|---|---|---|
| (mean) | (std) | (mean) | (std) | |
| 0.6618 | 0.1448 | 0.5582 | 0.2488 | |
| 0.6573 | 0.1468 | 0.5570 | 0.2524 | |
| 0.6319 | 0.1646 | 0.5569 | 0.2495 | |
| 0.5400 | 0.2657 | 0.5192 | 0.2598 | |
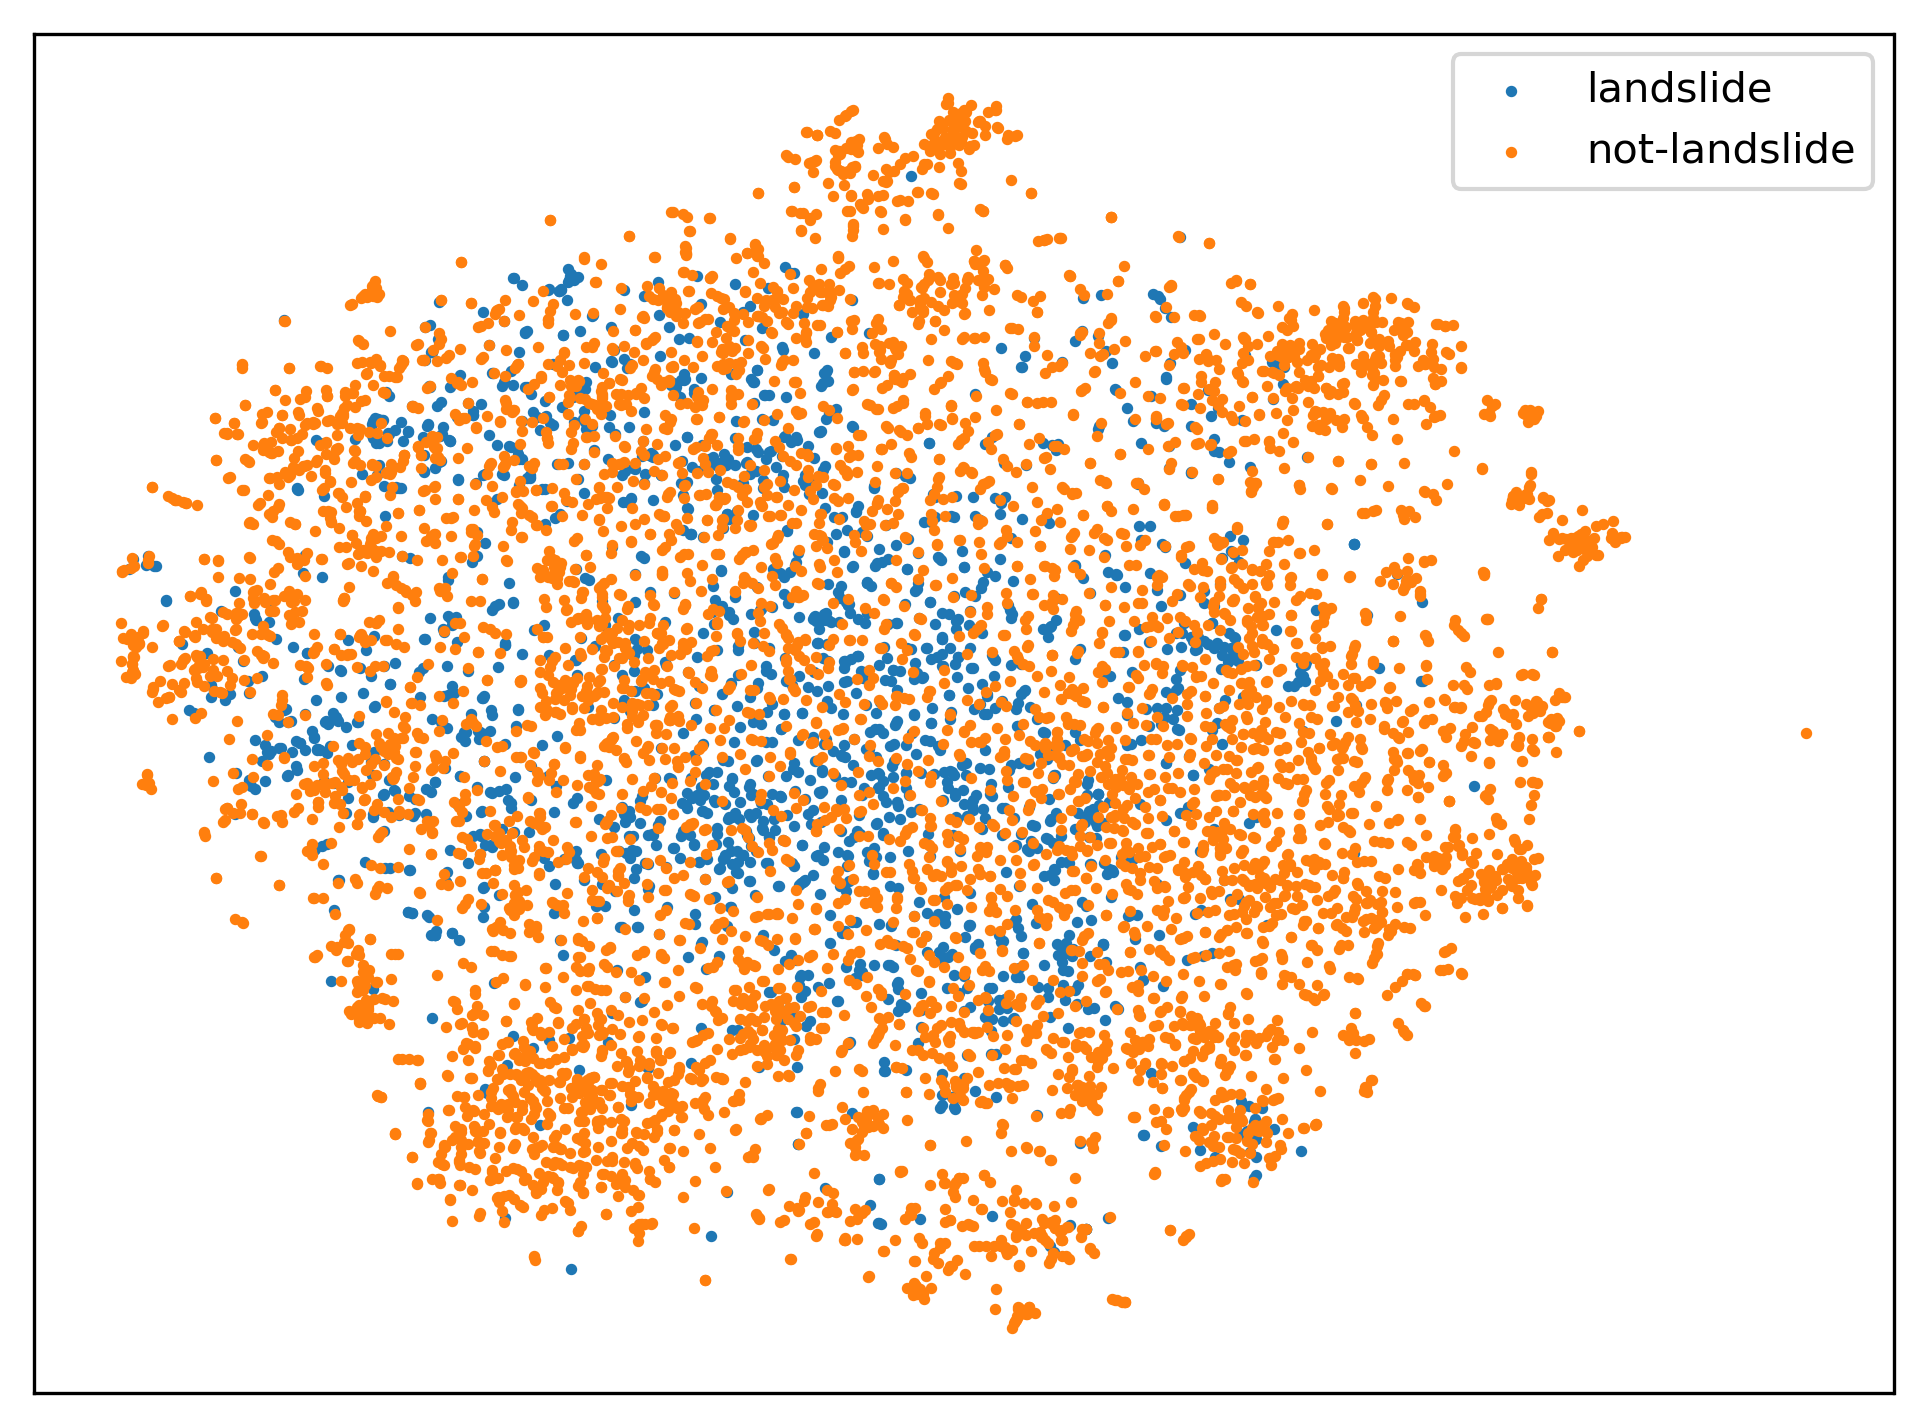
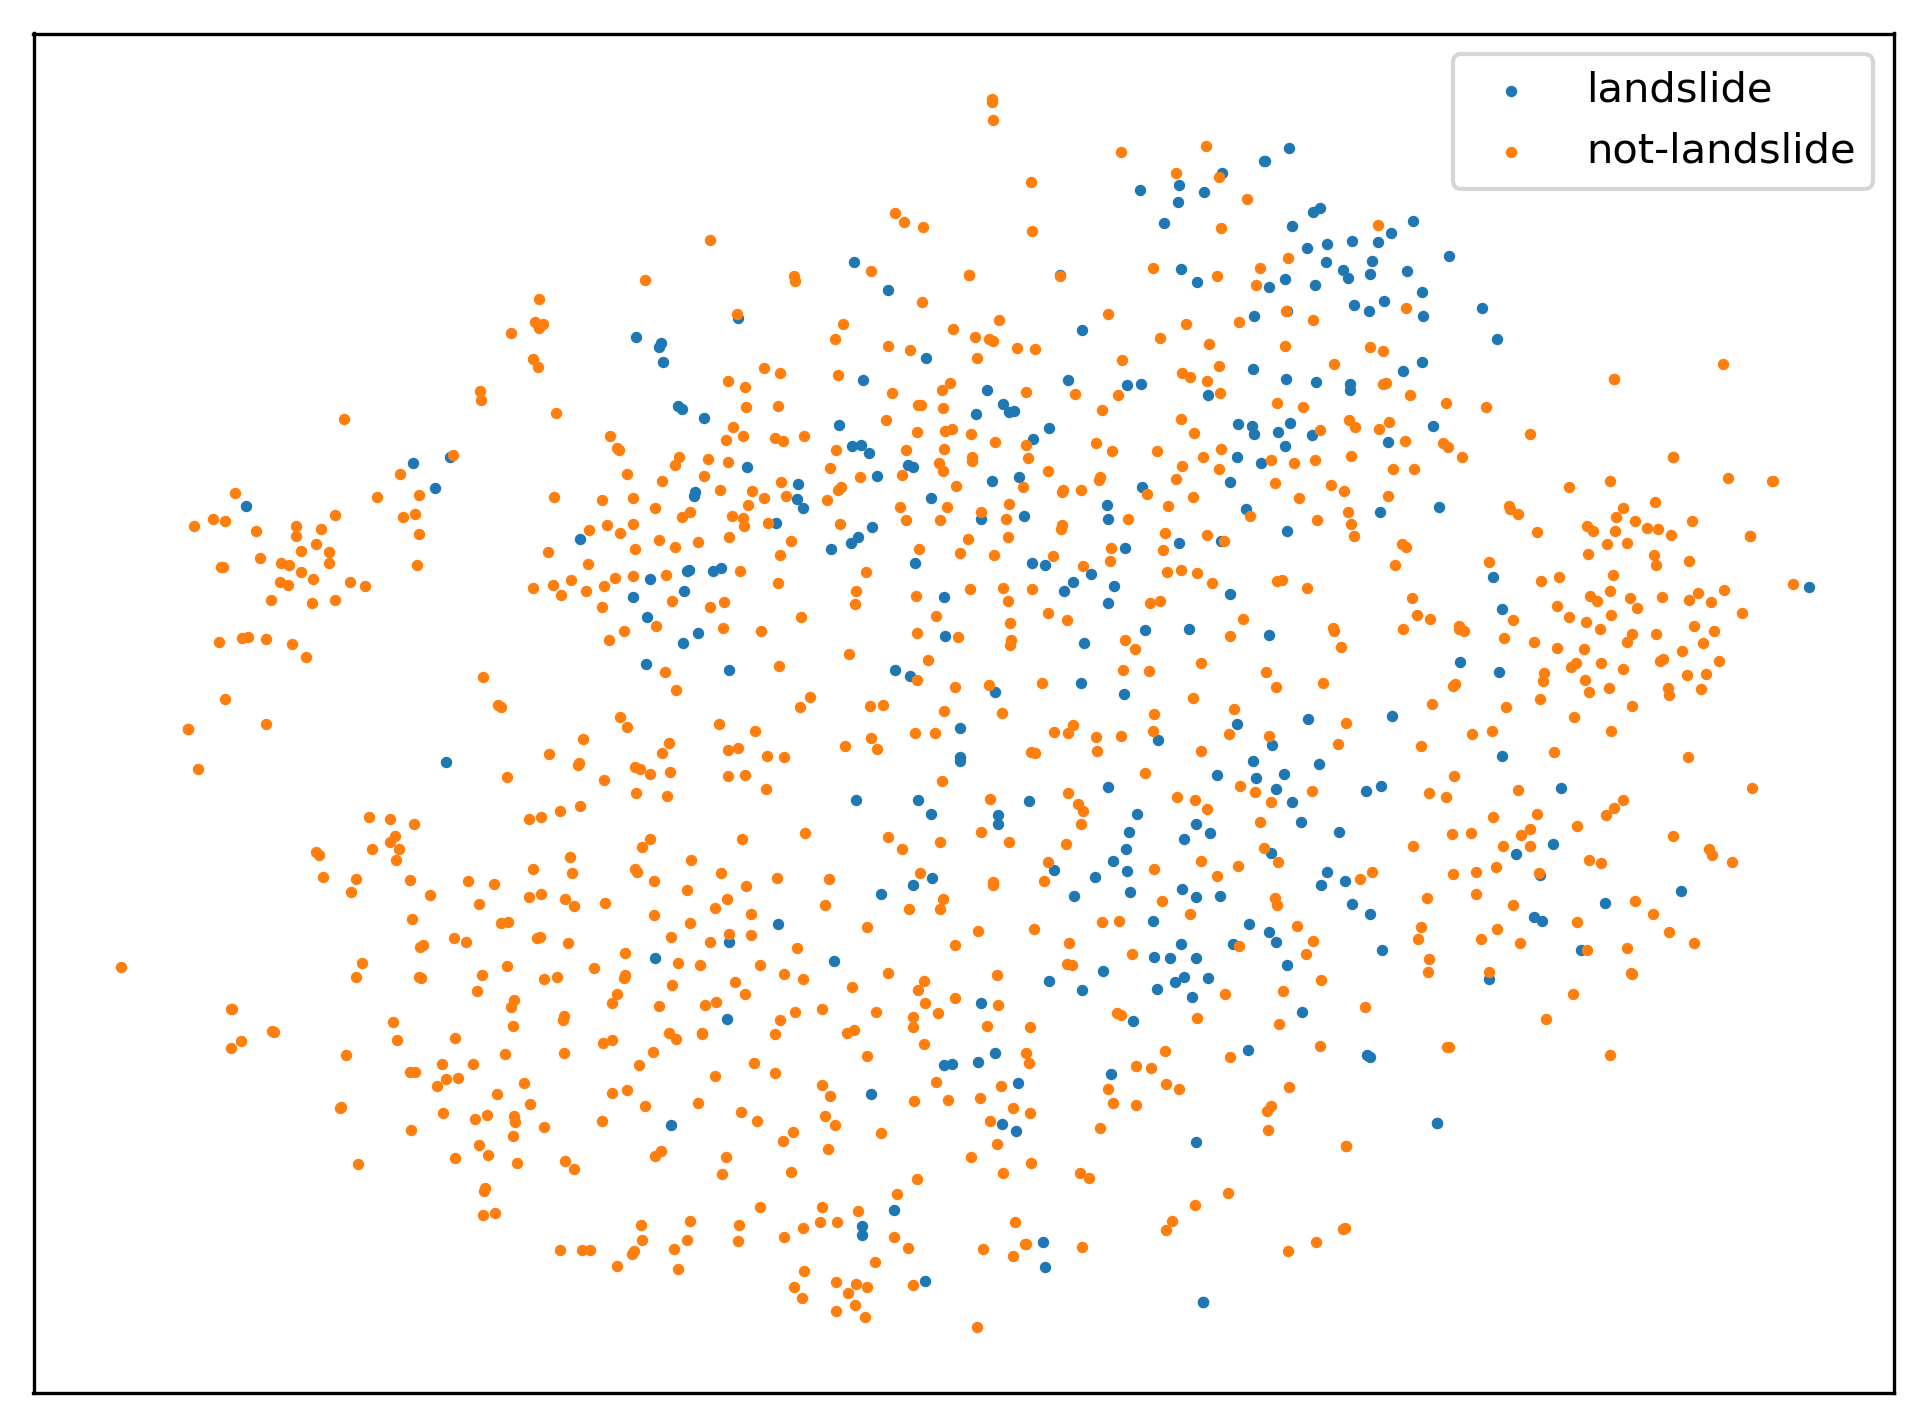
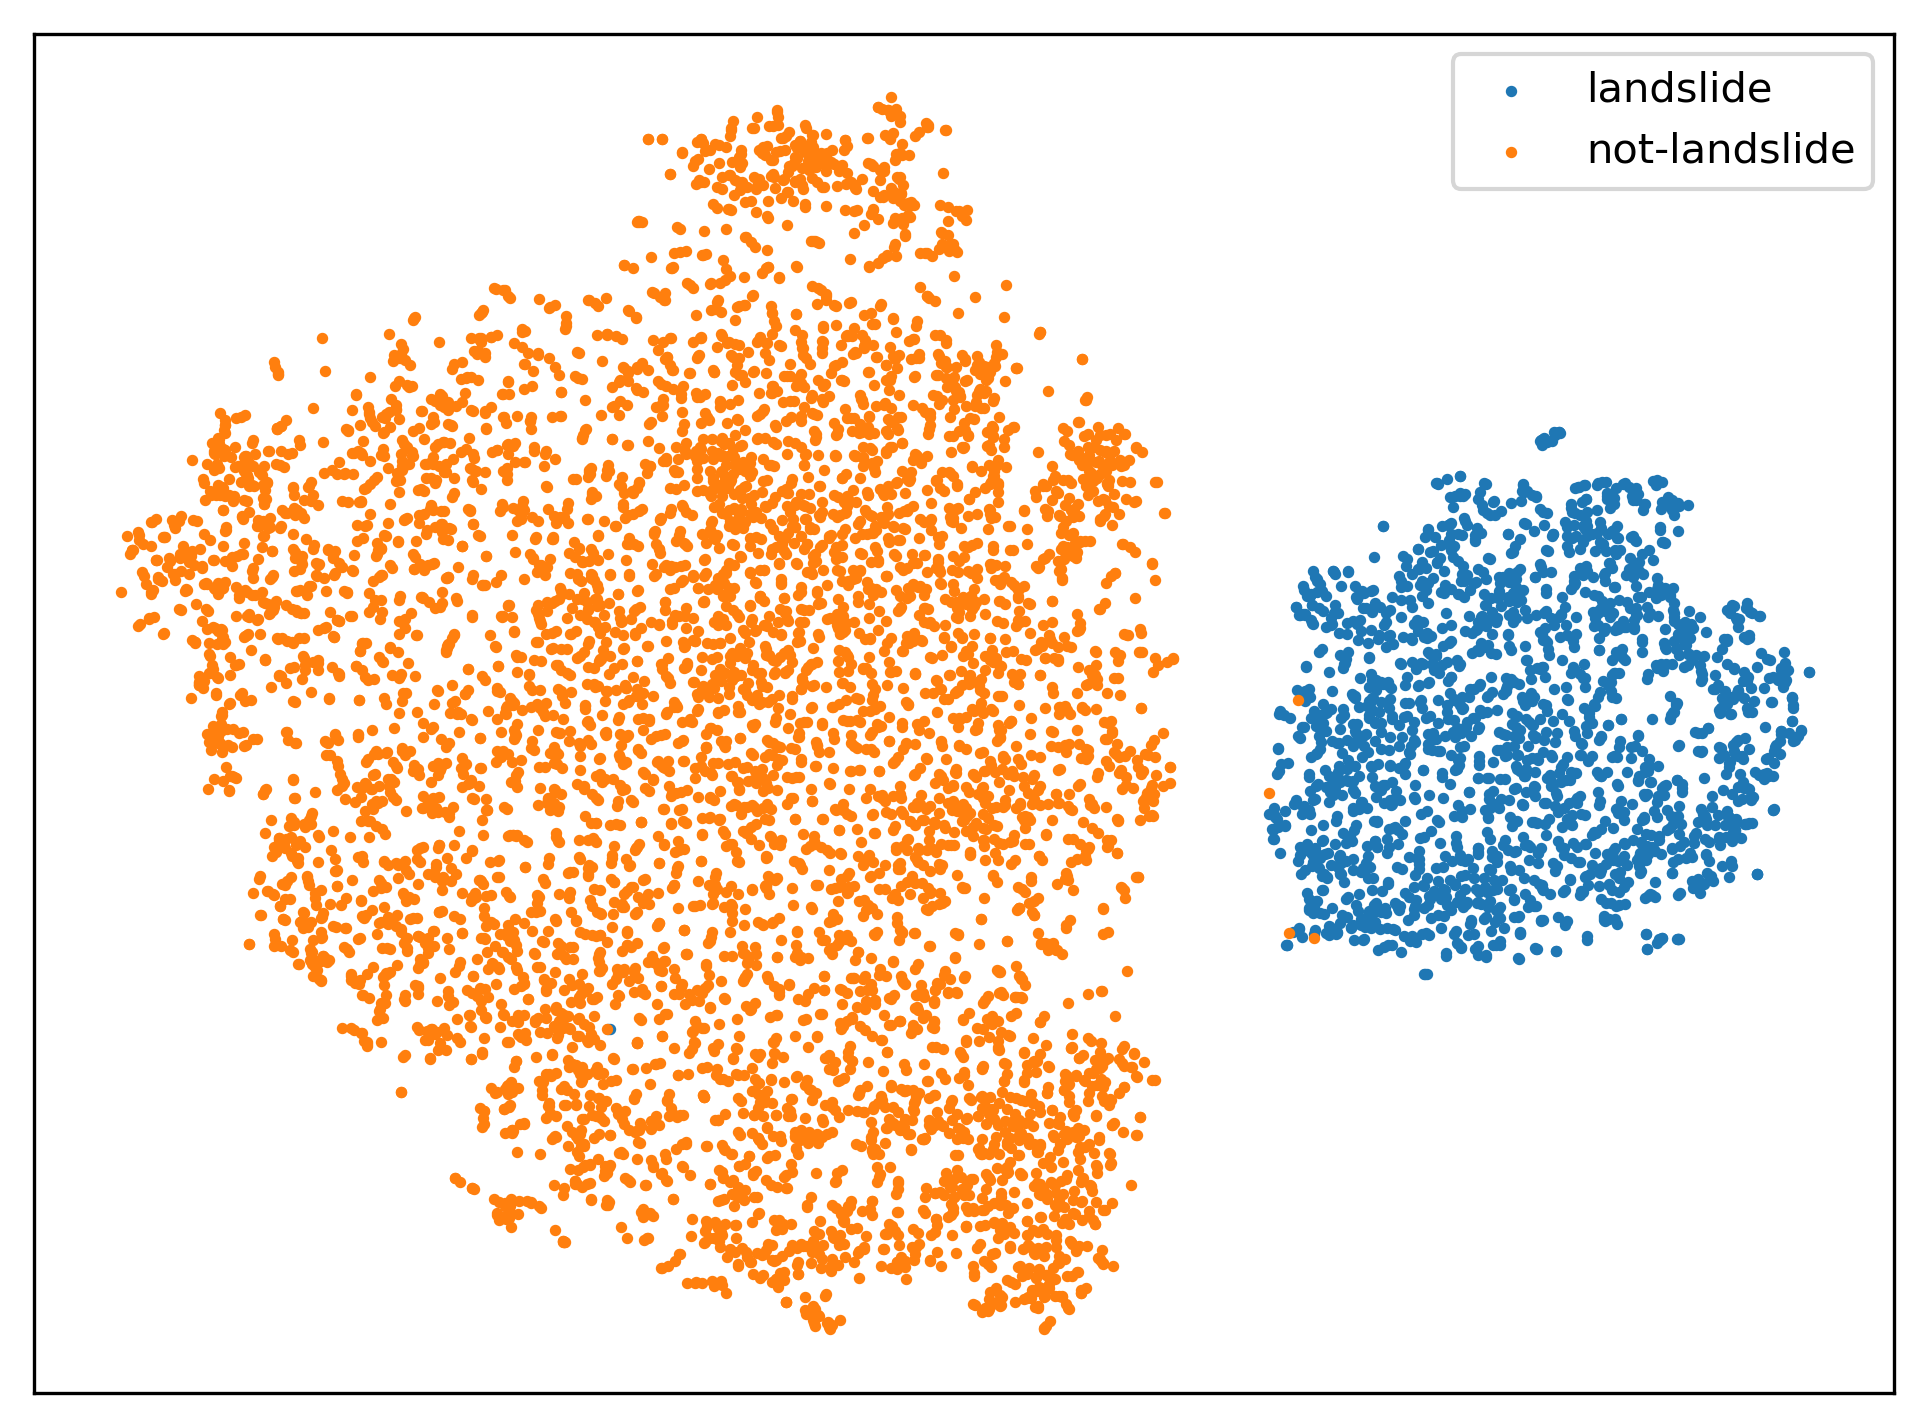
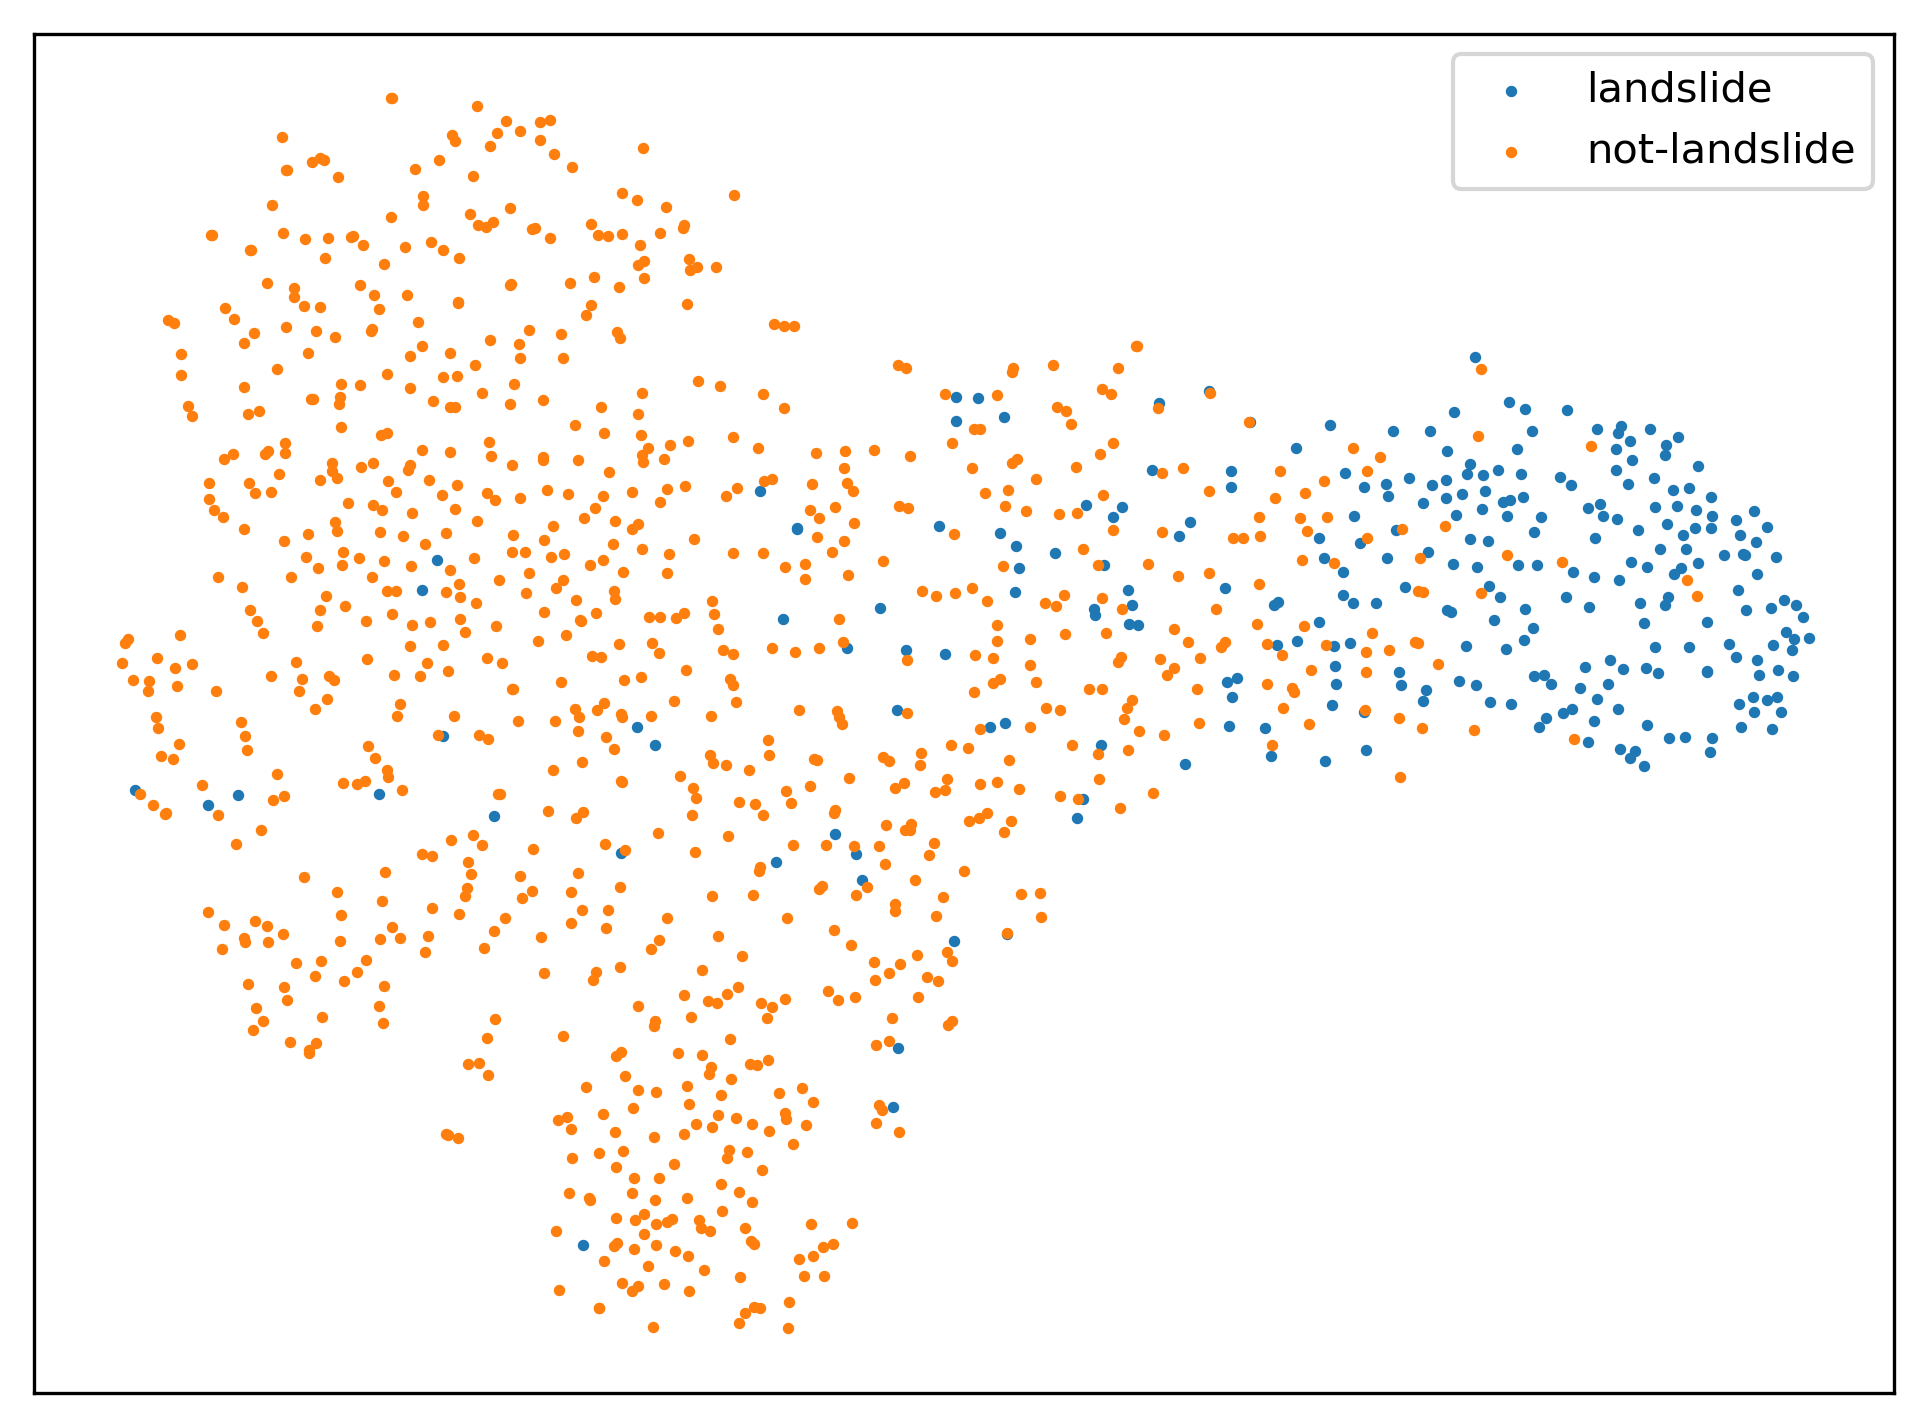
To illustrate the success of the transfer learning approach employed in this study, we created t-SNE (Van der Maaten and Hinton 2008) visualizations of the feature embeddings before and after the training of the best-performing model. As can be seen in Figure 2, the original ResNet50 model pretrained on ImageNet cannot distinguish landslide images from not-landslide images neither in the training set (Figure 2(a)) nor in the validation set (Figure 2(b)). However, after finetuning the model on the target landslide dataset, the resulting feature embeddings show almost perfect separation of the classes in the training set (Figure 2(c)) and a reasonably well separation in the validation set (Figure 2(d)).
When applied on the held-out test set, the best-performing model achieves an F1-score of 0.701 and an accuracy of 0.870 as opposed to the F1 and accuracy scores of 0.805 and 0.913, respectively, on the validation set (Table 7). Although the difference in accuracy is relatively small, the difference in F1 is considerably large due to significant drops in precision and recall scores of the model on the test set. This phenomenon can be explained by the more-than-twice increase in the false positive (128 vs. 42) and false negative (178 vs. 60) predictions of the model on the test set as shown in Table 8.
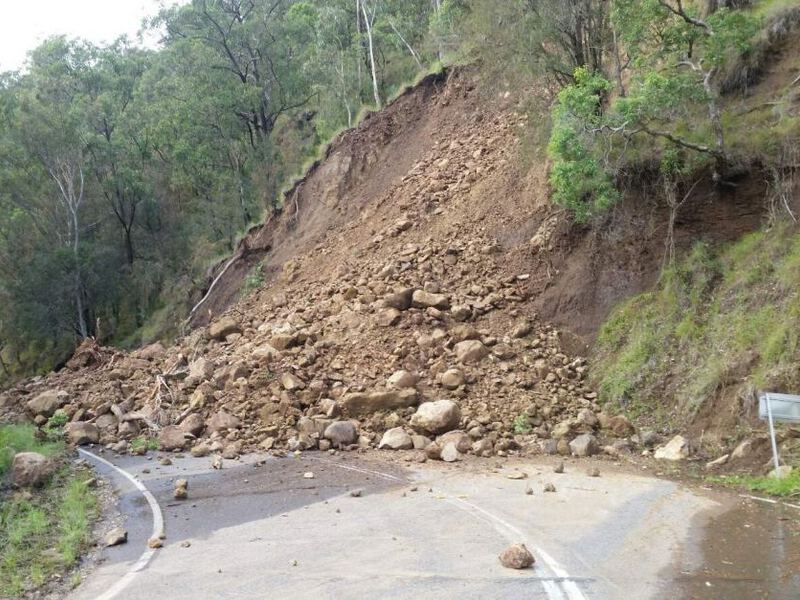
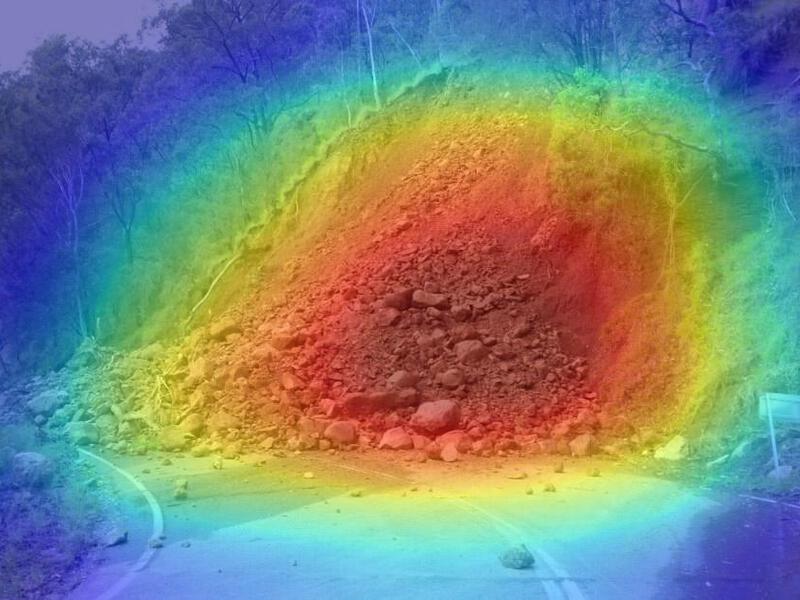
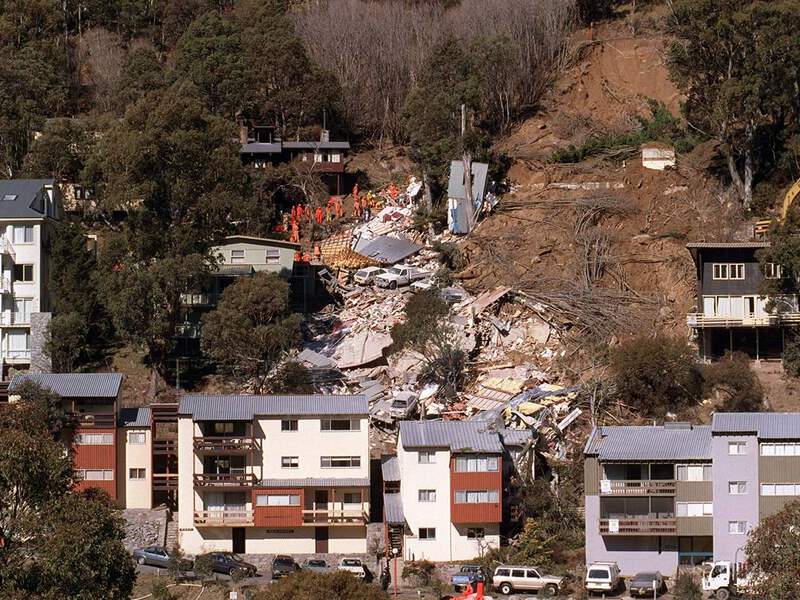
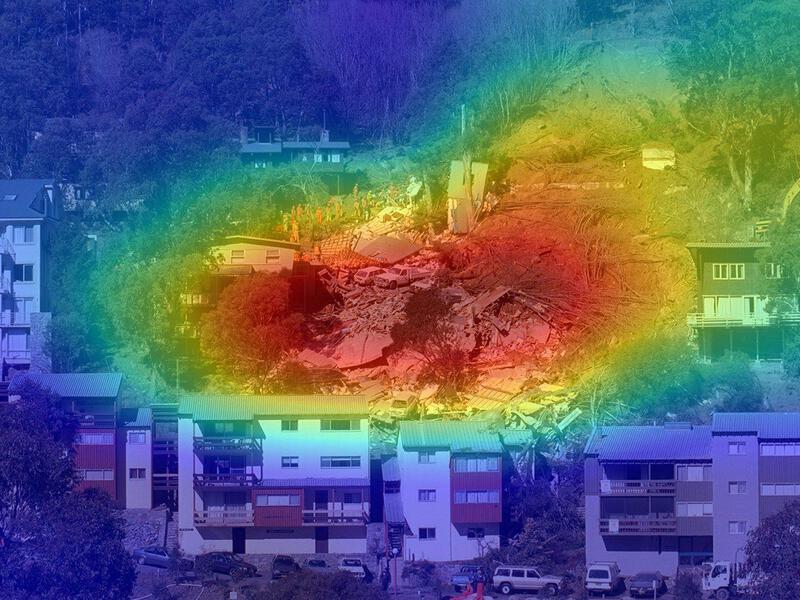
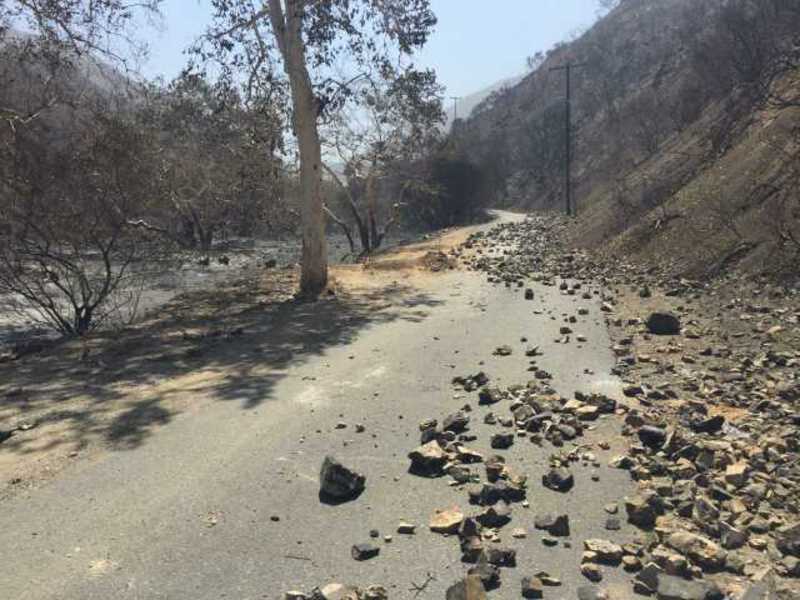
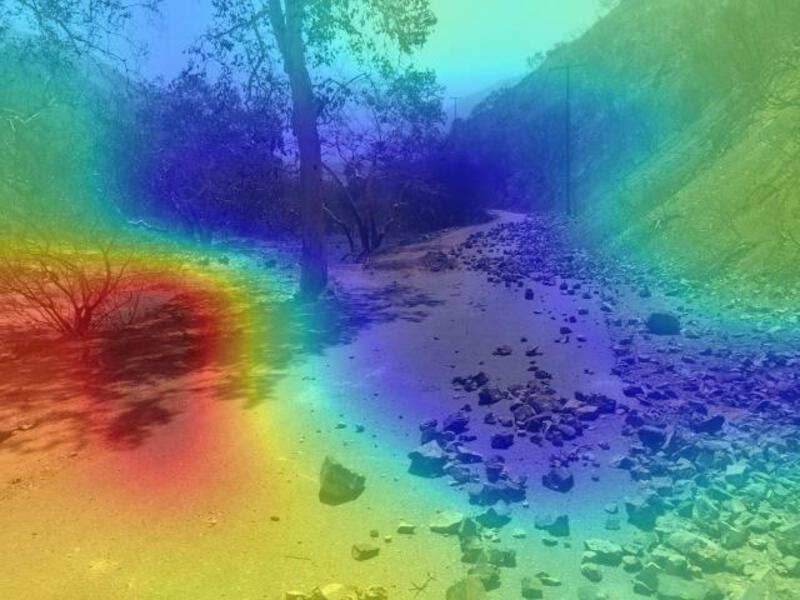
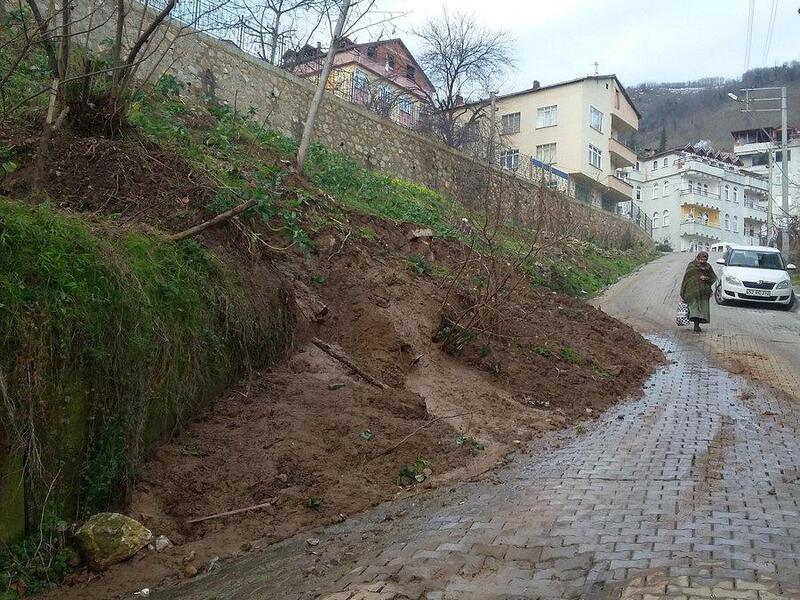
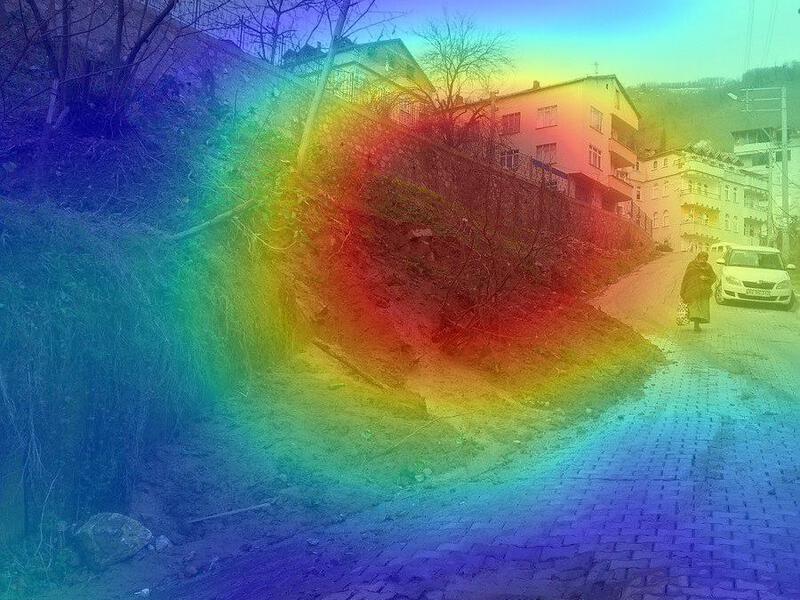
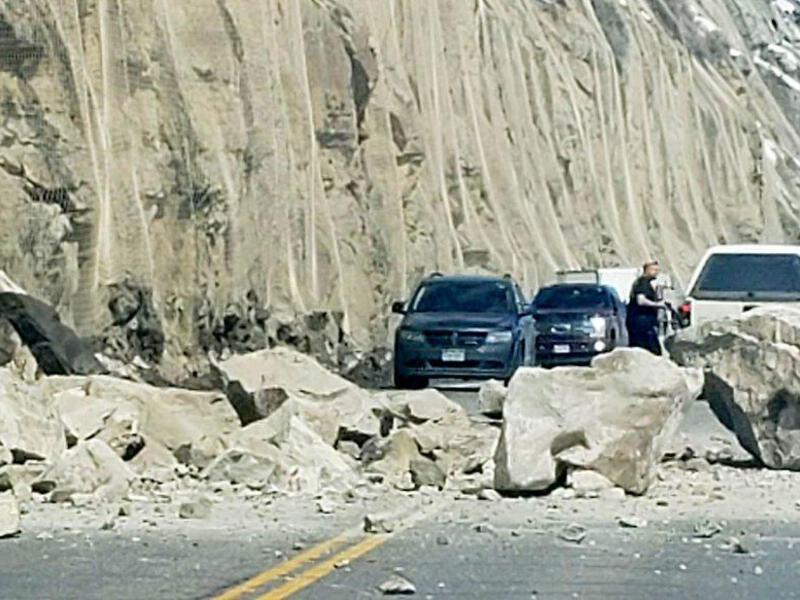
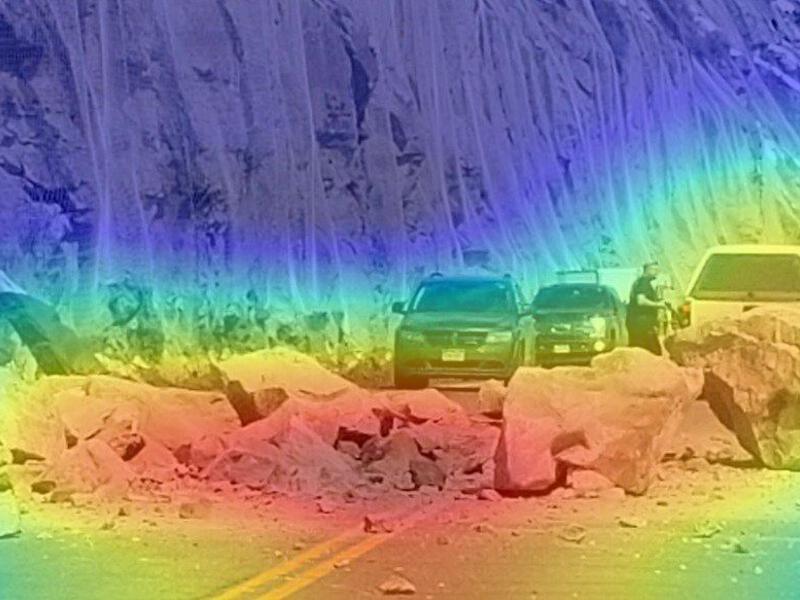
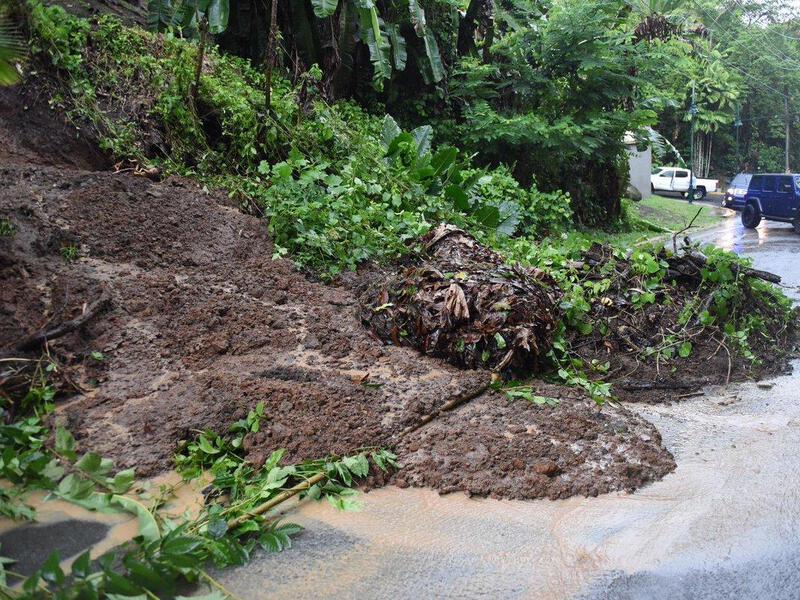
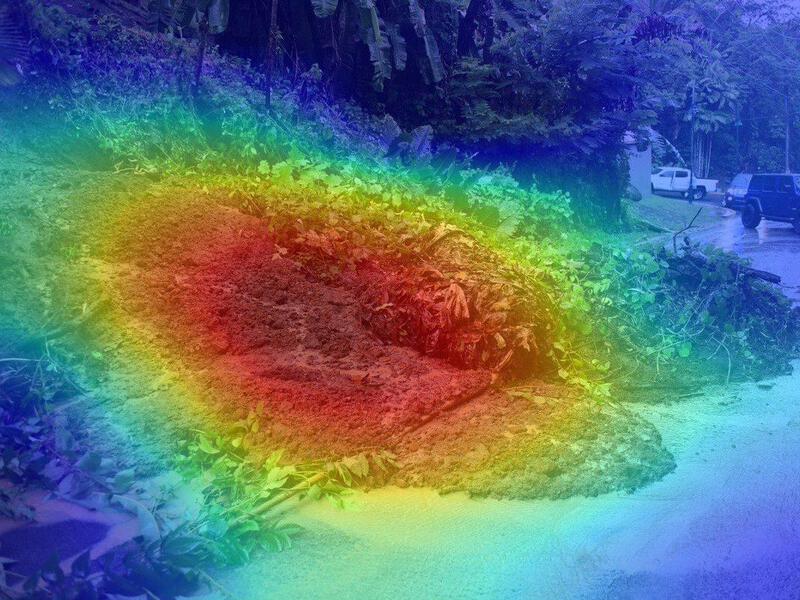
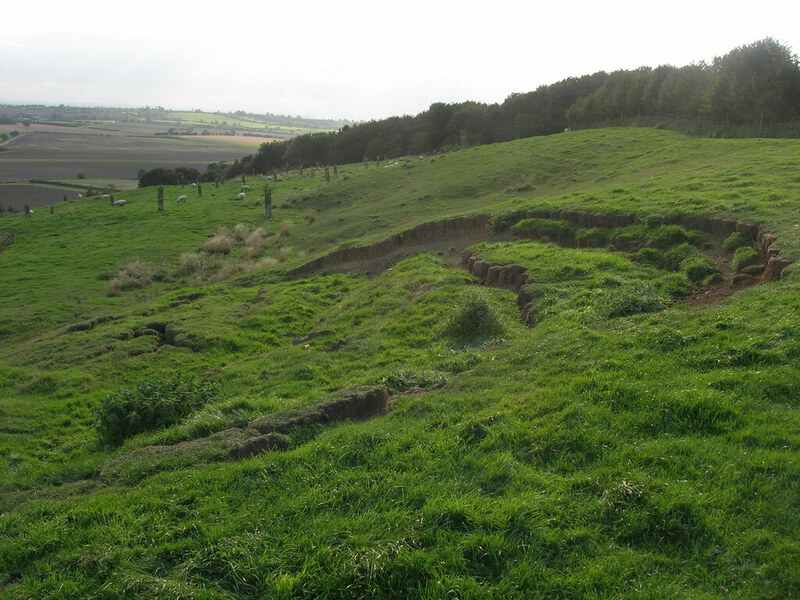
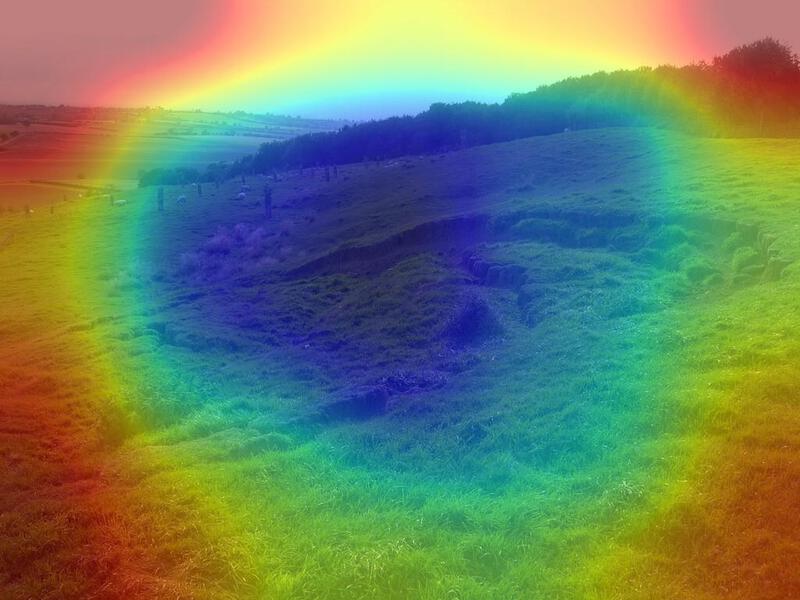
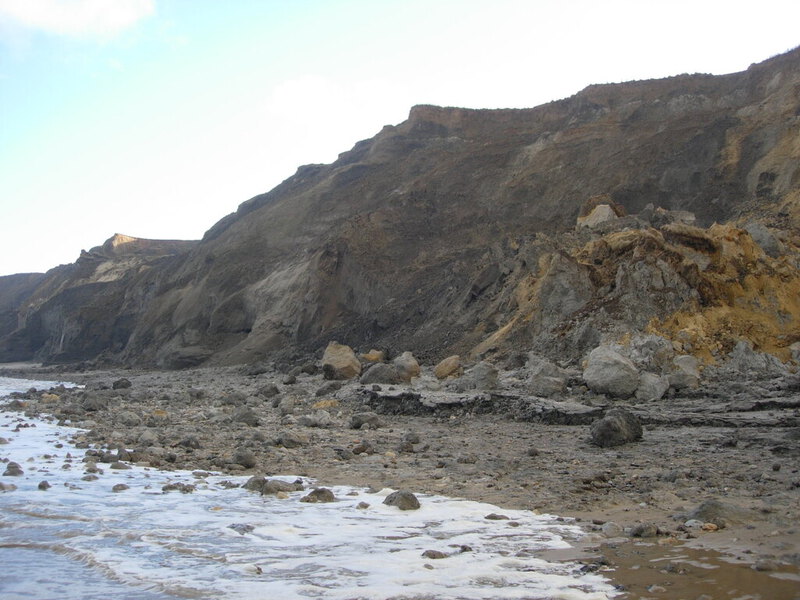
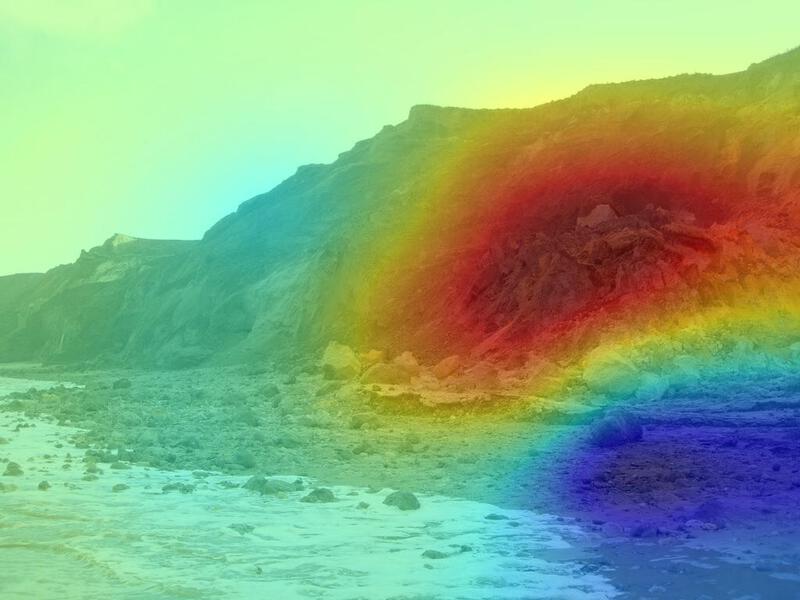
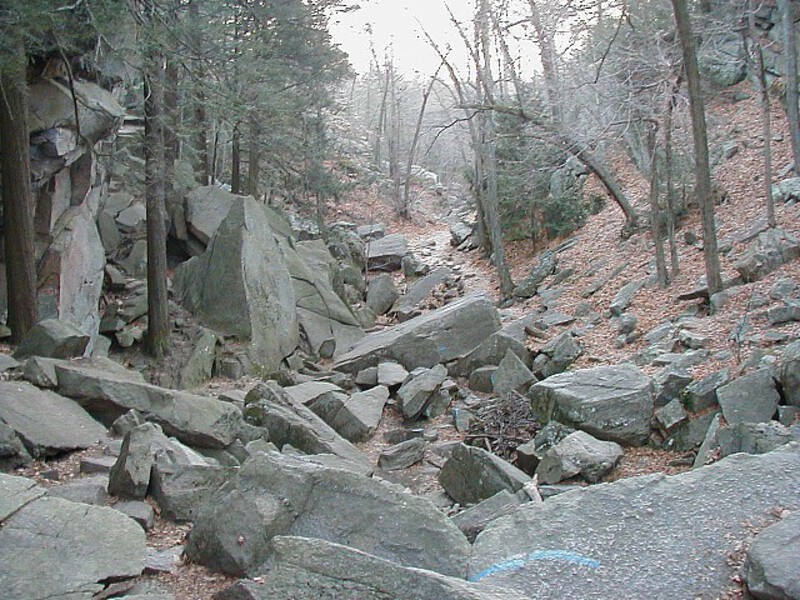
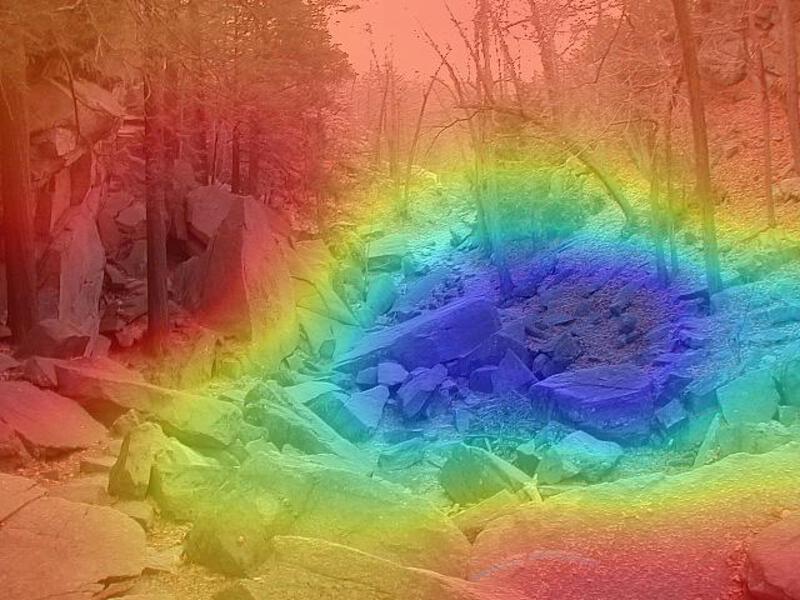
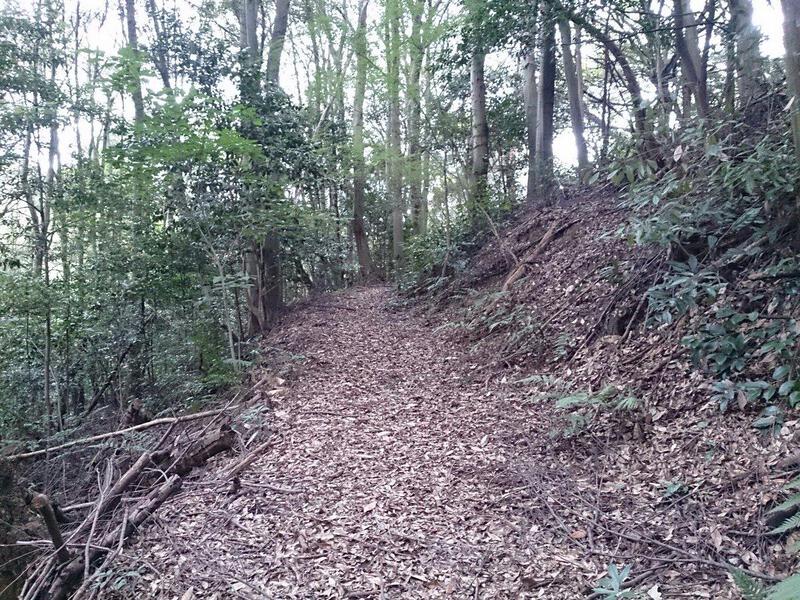
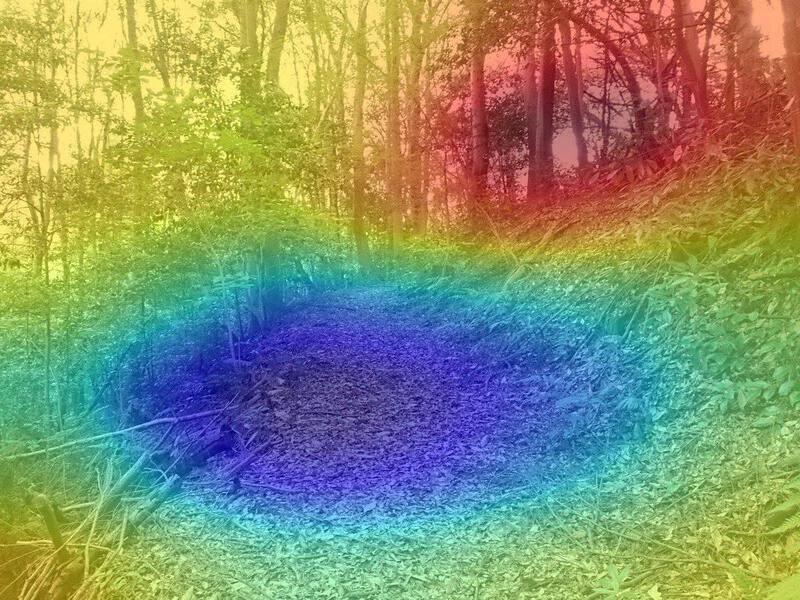
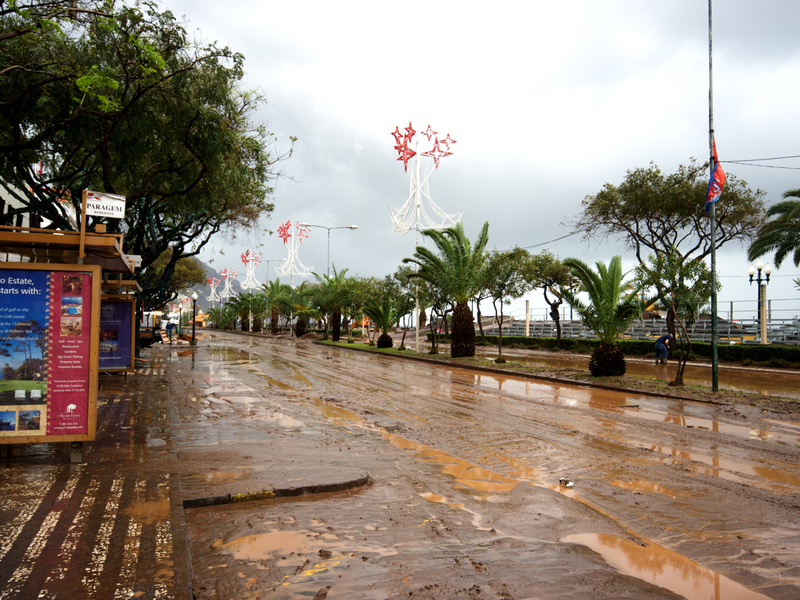
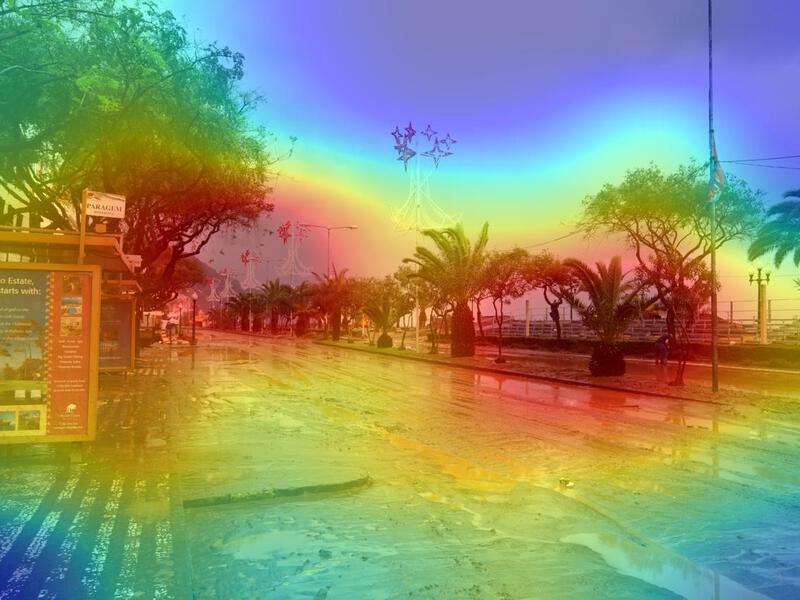
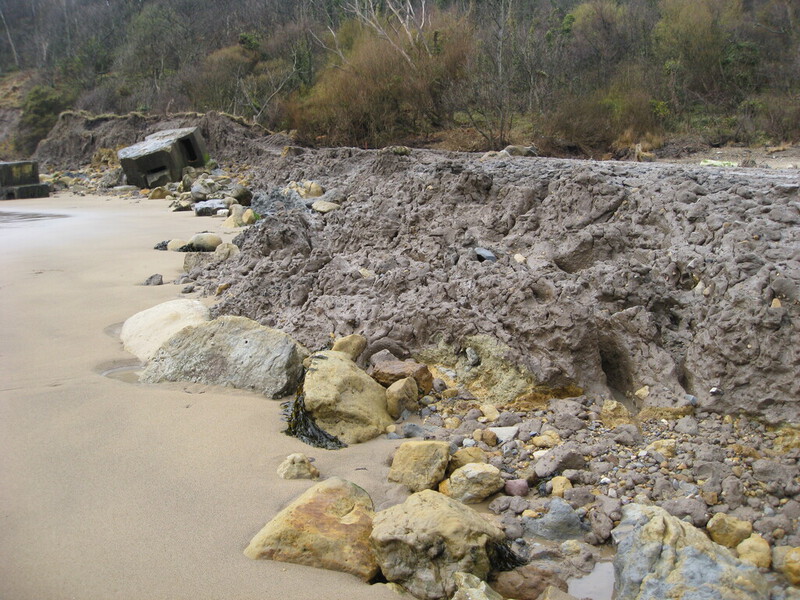
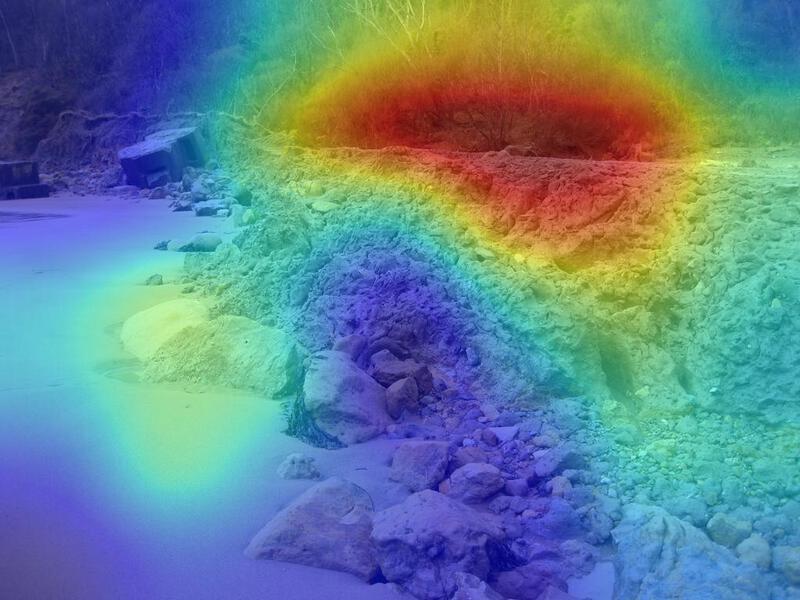
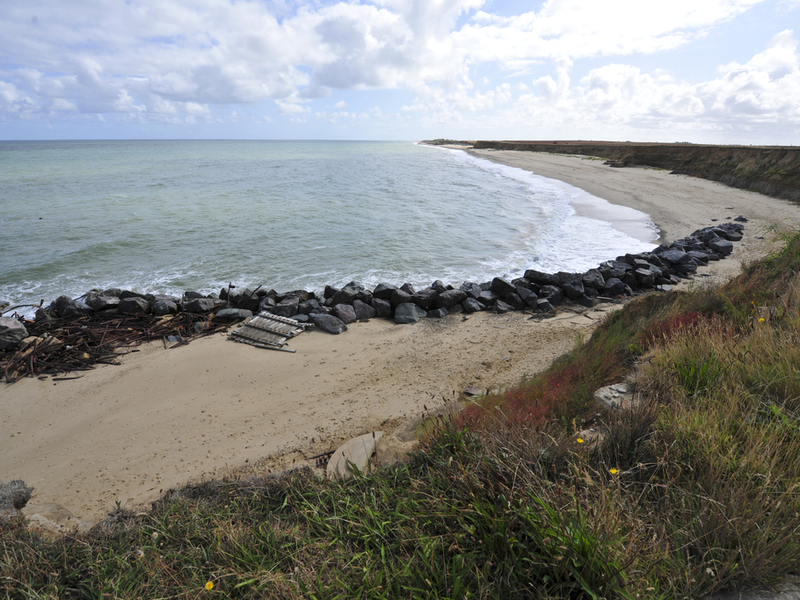
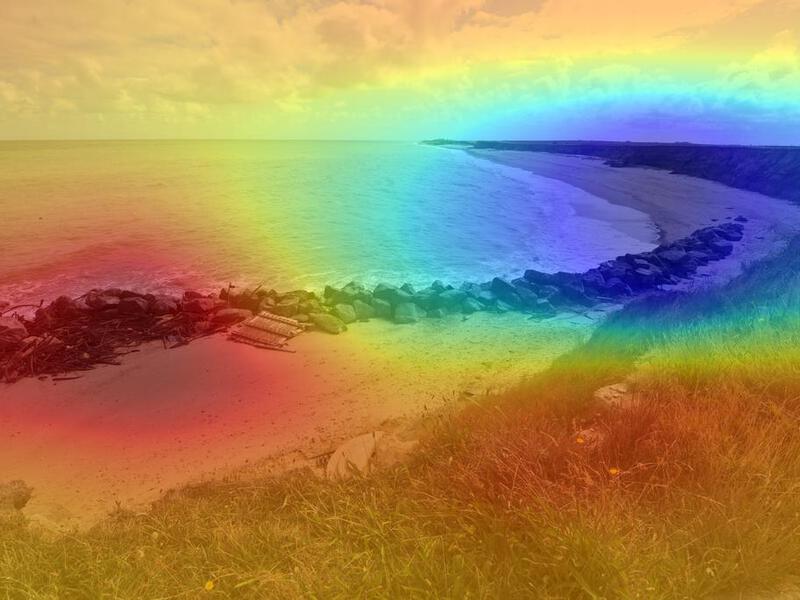
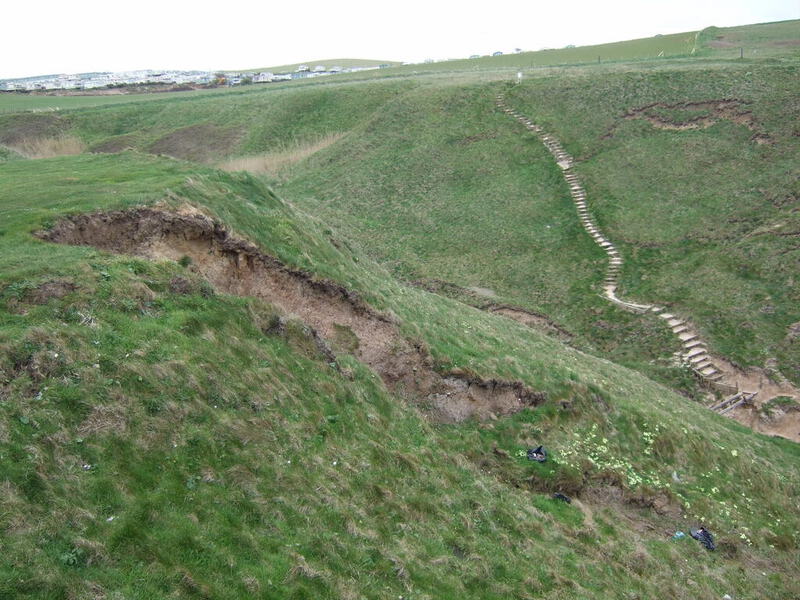
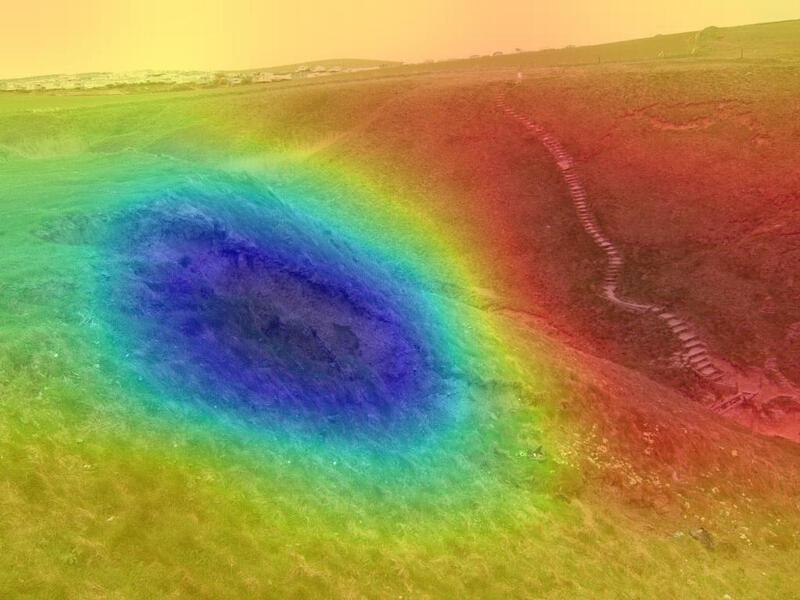
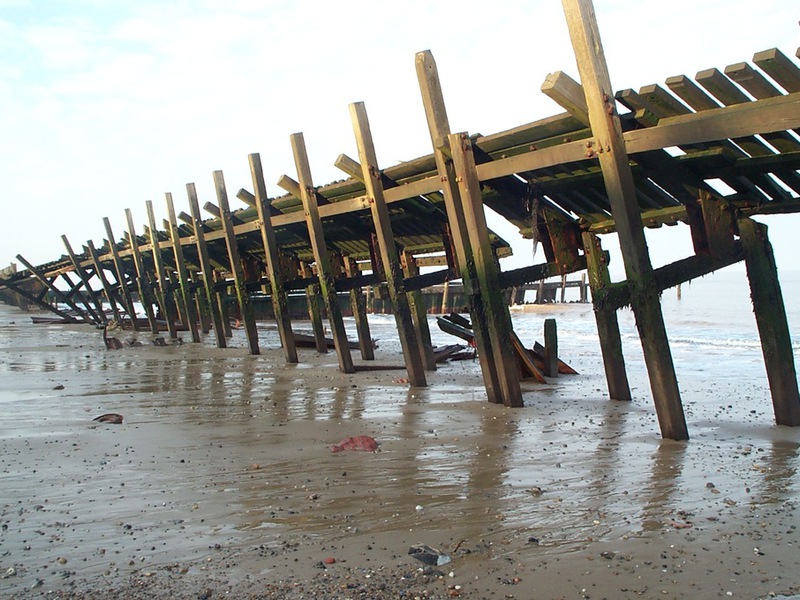
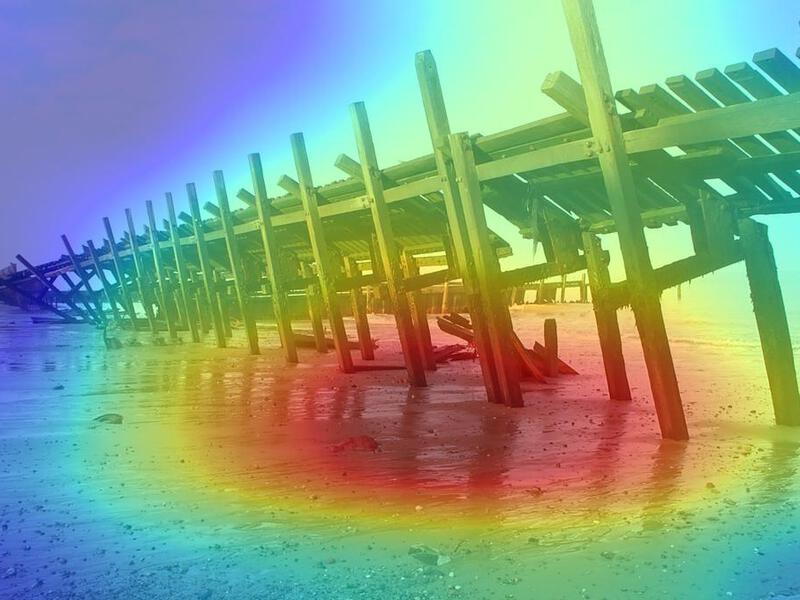
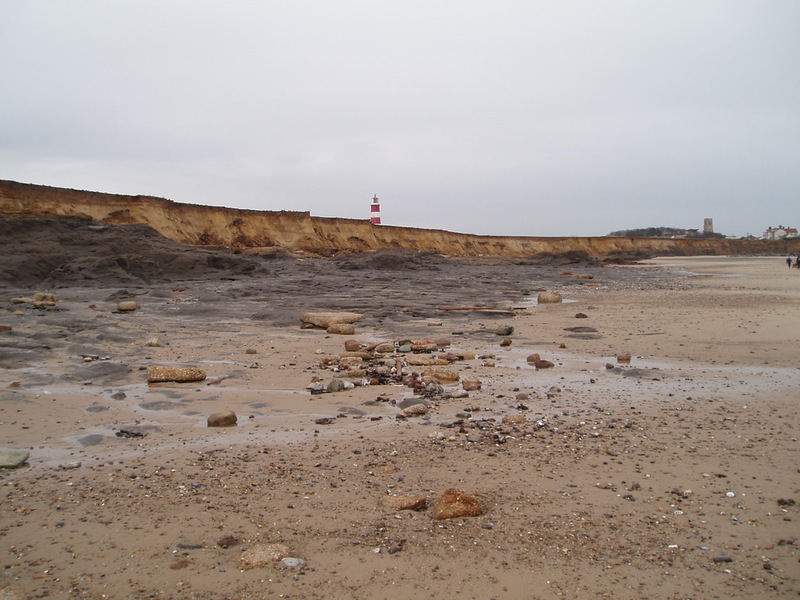
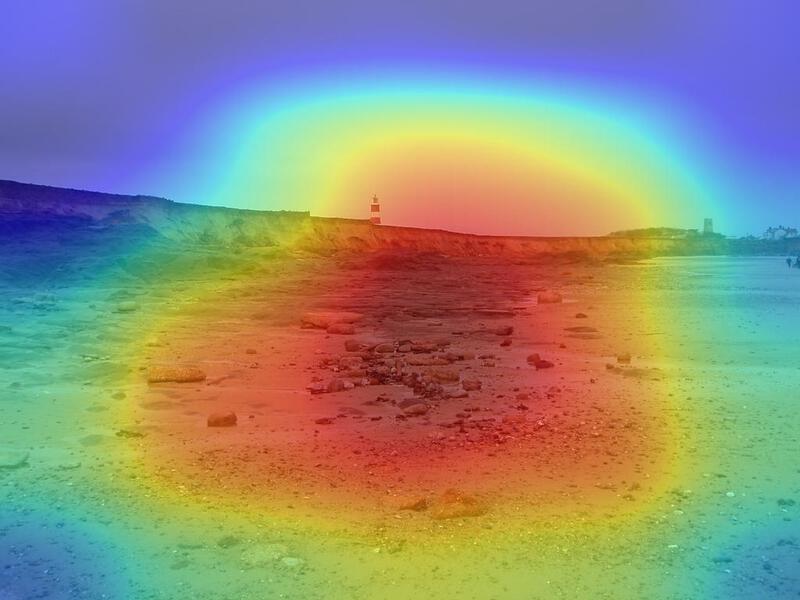
To have a better understanding of the inner workings of the model, we investigated class activation maps (Zhou et al. 2016), which highlight the discriminative image regions that the CNN model pays attention to decide whether an image belongs to landslide or not-landslide class. Figure 3 demonstrates example visualizations for all four cases, i.e., true positives, true negatives, false positives, and false negatives. The visualizations for the true positive predictions indicate that the model successfully localizes the landslide regions (e.g., rockfalls, earthslip, etc.) in the images. Similarly for the true negative predictions, the model focuses on areas that do not show any landslide cues, successfully avoiding tricky conditions such as muddy roads, wet surfaces, and natural rocky areas on a beach. However, in both false positive and false negative predictions, we observe that the errors occur mainly because the model fails to localize its attention on a particular region in the image, or is tricked by the image regions that are reminiscent of landslide scenes.
| Set | Accuracy | Precision | Recall | F1 |
|---|---|---|---|---|
| Validation | 0.913 | 0.834 | 0.779 | 0.805 |
| Test | 0.870 | 0.737 | 0.668 | 0.701 |
| Prediction | |||
| Ground Truth | Landslide | Not-landslide | |
| V (10%) | Landslide | 211 | 60 |
| Not-landslide | 42 | 860 | |
| T (20%) | Landslide | 358 | 178 |
| Not-landslide | 128 | 1,685 | |
| TRUE POSITIVES | FALSE NEGATIVES | ||
|
|
|
|
|
|
|
|
| FALSE POSITIVES | TRUE NEGATIVES | ||
|
|
|
|
|
|
|
|
Path to Deployment
We envision a system that continuously monitors social media (i.e., Twitter) for general landslide-related content and deploys our landslide classification model to identify and retain the most relevant information. The planned system will follow a design approach similar to the one presented in (Alam, Imran, and Ofli 2017; Alam, Ofli, and Imran 2018) without the human-in-the-loop aspect (for now). Specifically, there will be a Tweet Collector module that will collect live tweets from the Twitter Streaming API 444https://developer.twitter.com/en/docs/tutorials/consuming-streaming-data that matches landslide-related keywords and hashtags in multiple languages. This module will be followed by an Image Collector module that will extract image URLs from the tweets (if any) and download images. Then, the Image Classifier module will run the downloaded images through our landslide model to tag each image as landslide or not-landslide. In parallel, the Geolocation Inference module will use tweet metadata to geolocate the images following the approach presented in (Qazi, Imran, and Ofli 2020). Eventually, all the results will be stored in a database by the Persister module, which will then be used by the Visualizer Module to create a dashboard and/or a map representation of the detection results. With this plan, we hope to translate this fruitful collaboration between researchers and practitioners into a solid outcome that can benefit the landslide community as well as the government agencies and humanitarian organizations.
Conclusion
In this study, we aimed to develop a model that can automatically detect landslides in social media image streams. For this purpose, we created a large image collection from multiple sources with different characteristics to ensure data diversity. Then, the collected images were assessed by three experts to attain high quality labels with almost substantial inter-annotator agreement. At the heart of this study lied an extensive search for the optimal landslide model configuration with various CNN architectures, network optimizers, learning rates, weight decays, and class balancing strategies. We provided several insights about the impact of each optimization dimension on the overall performance. The best-performing model achieved high performance in terms of accuracy and F1 scores, which can be deemed sufficient for the purpose. Furthermore, presented error analyses pointed at potential improvements for future work. Finally, we described a road map to deploy the proposed landslide model in an online, real-time system.
References
- Alam, Imran, and Ofli (2017) Alam, F.; Imran, M.; and Ofli, F. 2017. Image4Act: Online social media image processing for disaster response. In Proceedings of the 2017 IEEE/ACM International Conference on Advances in Social Networks Analysis and Mining 2017, 601–604.
- Alam, Ofli, and Imran (2018) Alam, F.; Ofli, F.; and Imran, M. 2018. Processing social media images by combining human and machine computing during crises. International Journal of Human–Computer Interaction, 34(4): 311–327.
- Can, Kocaman, and Gokceoglu (2019) Can, R.; Kocaman, S.; and Gokceoglu, C. 2019. A convolutional neural network architecture for auto-detection of landslide photographs to assess citizen science and volunteered geographic information data quality. ISPRS International Journal of Geo-Information, 8(7): 300.
- Can, Kocaman, and Gokceoglu (2020) Can, R.; Kocaman, S.; and Gokceoglu, C. 2020. Development of a CitSci and artificial intelligence supported GIS platform for landslide data collection. The International Archives of Photogrammetry, Remote Sensing and Spatial Information Sciences, 43: 43–50.
- Cheng et al. (2013) Cheng, G.; Guo, L.; Zhao, T.; Han, J.; Li, H.; and Fang, J. 2013. Automatic landslide detection from remote-sensing imagery using a scene classification method based on BoVW and pLSA. International Journal of Remote Sensing, 34(1): 45–59.
- Cieslik et al. (2019) Cieslik, K.; Shakya, P.; Uprety, M.; Dewulf, A.; Russell, C.; Clark, J.; Dhital, M. R.; and Dhakal, A. 2019. Building resilience to chronic landslide hazard through citizen science. Frontiers in Earth Science, 7: 278.
- Donahue et al. (2014) Donahue, J.; Jia, Y.; Vinyals, O.; Hoffman, J.; Zhang, N.; Tzeng, E.; and Darrell, T. 2014. DeCAF: A Deep Convolutional Activation Feature for Generic Visual Recognition. In International Conference on Machine Learning, 647–655.
- Fleiss (1971) Fleiss, J. L. 1971. Measuring nominal scale agreement among many raters. Psychological bulletin, 76(5): 378.
- Froude and Petley (2018) Froude, M. J.; and Petley, D. N. 2018. Global fatal landslide occurrence from 2004 to 2016. Natural Hazards and Earth System Sciences, 18(8): 2161–2181.
- Girshick et al. (2014) Girshick, R. B.; Donahue, J.; Darrell, T.; and Malik, J. 2014. Rich Feature Hierarchies for Accurate Object Detection and Semantic Segmentation. In IEEE Conference on Computer Vision and Pattern Recognition, 580–587.
- He et al. (2016) He, K.; Zhang, X.; Ren, S.; and Sun, J. 2016. Deep Residual Learning for Image Recognition. In IEEE Conference on Computer Vision and Pattern Recognition (CVPR), 770–778. IEEE.
- Huang et al. (2017) Huang, G.; Liu, Z.; Maaten, L. v. d.; and Weinberger, K. Q. 2017. Densely Connected Convolutional Networks. In IEEE Conference on Computer Vision and Pattern Recognition (CVPR), 2261–2269. IEEE.
- Juang, Stanley, and Kirschbaum (2019) Juang, C. S.; Stanley, T. A.; and Kirschbaum, D. B. 2019. Using citizen science to expand the global map of landslides: Introducing the Cooperative Open Online Landslide Repository (COOLR). PloS one, 14(7): e0218657.
- Kingma and Ba (2015) Kingma, D. P.; and Ba, J. 2015. Adam: A Method for Stochastic Optimization. In International Conference on Learning Representations (ICLR).
- Kjekstad and Highland (2009) Kjekstad, O.; and Highland, L. 2009. Economic and social impacts of landslides. In Landslides–disaster risk reduction, 573–587. Springer.
- Kocaman and Gokceoglu (2019) Kocaman, S.; and Gokceoglu, C. 2019. A CitSci app for landslide data collection. Landslides, 16(3): 611–615.
- Lee and Jones (2004) Lee, E. M.; and Jones, D. K. 2004. Landslide risk assessment, volume 10. Thomas Telford London.
- Loshchilov and Hutter (2019) Loshchilov, I.; and Hutter, F. 2019. Decoupled weight decay regularization. In International Conference on Learning Representations (ICLR).
- Merghadi et al. (2020) Merghadi, A.; Yunus, A. P.; Dou, J.; Whiteley, J.; ThaiPham, B.; Bui, D. T.; Avtar, R.; and Abderrahmane, B. 2020. Machine learning methods for landslide susceptibility studies: A comparative overview of algorithm performance. Earth-Science Reviews, 207: 103225.
- Moeller (2006) Moeller, S. D. 2006. ” Regarding the Pain of Others”: Media, Bias and the Coverage of International Disasters. Journal of International Affairs, 173–196.
- Mohan et al. (2021) Mohan, A.; Singh, A. K.; Kumar, B.; and Dwivedi, R. 2021. Review on remote sensing methods for landslide detection using machine and deep learning. Transactions on Emerging Telecommunications Technologies, 32(7): e3998.
- Musaev, Wang, and Pu (2014) Musaev, A.; Wang, D.; and Pu, C. 2014. LITMUS: Landslide detection by integrating multiple sources. In ISCRAM.
- Musaev et al. (2017) Musaev, A.; Wang, D.; Xie, J.; and Pu, C. 2017. REX: Rapid ensemble classification system for landslide detection using social media. In 2017 IEEE 37th International Conference on Distributed Computing Systems (ICDCS), 1240–1249. IEEE.
- Oquab et al. (2014) Oquab, M.; Bottou, L.; Laptev, I.; and Sivic, J. 2014. Learning and Transferring Mid-level Image Representations Using Convolutional Neural Networks. In IEEE Conference on Computer Vision and Pattern Recognition, 1717–1724.
- Pennington et al. (2015) Pennington, C.; Freeborough, K.; Dashwood, C.; Dijkstra, T.; and Lawrie, K. 2015. The National Landslide Database of Great Britain: Acquisition, communication and the role of social media. Geomorphology, 249: 44–51.
- Pennington and Harrison (2013) Pennington, C.; and Harrison, A. 2013. 2012: landslide year? Geoscientist, 23(5): 10–15.
- Qazi, Imran, and Ofli (2020) Qazi, U.; Imran, M.; and Ofli, F. 2020. GeoCoV19: a dataset of hundreds of millions of multilingual COVID-19 tweets with location information. SIGSPATIAL Special, 12(1): 6–15.
- Ramesh, Kumar, and Rangan (2009) Ramesh, M. V.; Kumar, S.; and Rangan, P. V. 2009. Wireless Sensor Network for Landslide Detection. In ICWN, 89–95.
- Russakovsky et al. (2015) Russakovsky, O.; Deng, J.; Su, H.; Krause, J.; Satheesh, S.; Ma, S.; Huang, Z.; Karpathy, A.; Khosla, A.; Bernstein, M.; Berg, A. C.; and Fei-Fei, L. 2015. ImageNet Large Scale Visual Recognition Challenge. International Journal of Computer Vision, 115(3): 211–252.
- Sermanet et al. (2014) Sermanet, P.; Eigen, D.; Zhang, X.; Mathieu, M.; Fergus, R.; and LeCun, Y. 2014. OverFeat: Integrated Recognition, Localization and Detection using Convolutional Networks. In International Conference on Learning Representations (ICLR).
- Simonyan and Zisserman (2015) Simonyan, K.; and Zisserman, A. 2015. Very Deep Convolutional Networks for Large-Scale Image Recognition. In International Conference on Learning Representations ICLR.
- Szegedy et al. (2016) Szegedy, C.; Vanhoucke, V.; Ioffe, S.; Shlens, J.; and Wojna, Z. 2016. Rethinking the inception architecture for computer vision. In IEEE Conference on Computer Vision and Pattern Recognition (CVPR), 2818–2826. IEEE.
- Tan and Le (2019) Tan, M.; and Le, Q. 2019. Efficientnet: Rethinking model scaling for convolutional neural networks. In International Conference on Machine Learning (ICML), 6105–6114. PMLR.
- Taylor et al. (2015) Taylor, F. E.; Malamud, B. D.; Freeborough, K.; and Demeritt, D. 2015. Enriching Great Britain’s national landslide database by searching newspaper archives. Geomorphology, 249: 52–68.
- Tofani et al. (2013) Tofani, V.; Segoni, S.; Agostini, A.; Catani, F.; and Casagli, N. 2013. Use of remote sensing for landslide studies in Europe. Natural Hazards and Earth System Sciences, 13(2): 299–309.
- Van der Maaten and Hinton (2008) Van der Maaten, L.; and Hinton, G. 2008. Visualizing high-dimensional data using t-SNE. Journal of machine learning research, 9(11): 2579–2605.
- Zeiler and Fergus (2014) Zeiler, M. D.; and Fergus, R. 2014. Visualizing and Understanding Convolutional Networks. In European Conference on Computer Vision, 818–833.
- Zhou et al. (2016) Zhou, B.; Khosla, A.; Lapedriza, A.; Oliva, A.; and Torralba, A. 2016. Learning deep features for discriminative localization. In Proceedings of the IEEE conference on computer vision and pattern recognition, 2921–2929.