Phase-separation during sedimentation of dilute bacterial suspensions†
Phase-separation during sedimentation of dilute bacterial suspensions
-
Bryan O. Torres Maldonado1, Ranjiangshang Ran 1, K. Lawrence Galloway1, Quentin Brosseau1, Shravan Pradeep2, and Paulo E. Arratia1†
-
1)Department of Mechanical Engineering & Applied Mechanics, University of Pennsylvania, Philadelphia, PA 19104.
2)Department of Earth and Environmental Science, University of Pennsylvania, Philadelphia, PA 19104.
†E-mail:parratia@seas.upenn.edu
-
Numerous natural systems depend on the sedimentation of passive particles in presence of swimming microorganisms. Here, we investigate the dynamics of the sedimentation of spherical colloids at various E. coli concentration within the dilute regime. Results show the appearance of two sedimentation fronts, a spherical particle front and the bacteria front. We find that the bacteria front behave diffusive at short times, whereas at long times decays linearly. The sedimentation speed of passive particles decays at a constant speed and decreases as bacteria concentration () is increased. As is increased further, the sedimentation speed becomes independent of . The timescales of the bacteria front is associated with the particle settling speeds. Remarkably, all experiments collapse onto a single master line by using the bacteria front timescale. A phenomenological model is proposed that captures the sedimentation of passive particles in active fluids.
1 Introduction
The settling of particles in the presence of microorganisms is a ubiquitous natural process from small river tributaries to lakes to oceans 1, 2, 3, 4, 5, 6. Sedimentation of biological matter, for instance, plays an important role on the distribution of plankton in oceans, which is key part of the carbon cycle (i.e. ocean’s biological pump) that transports carbon from the ocean’s surface to depth 7, 8, 9. From a technological stand point, microbial activity can affect many process such as the production of food, biofuels, and even vaccines 10, 11, 12, 13, 14. While the settling of passive particles, as a function of suspension volume fraction () and interparticle interactions, have been extensively studied 15, 16, 17, 18, 19, 20, 21, 22, 23, much less is known about particle sedimentation in the presence of swimming microorganisms.
At infinite dilution, the particle sedimentation speed is set by the balance between the gravitational and viscous drag forces, and the associated velocity called the Stokes’ settling speed is given as, , where is the particle radius, is the density difference between the particle and the solvent, is the acceleration due to gravity, and is the solvent viscosity 17. As increases, the competition between the interparticle forces and thermal motion determines the suspension microstructure, affecting the hydrodynamic interactions between the particles, and in turn the suspension sedimentation speed. These effects are on suspension sedimentation speed are usually described by the hindered settling function, given as , where is the mean sedimentation speed due to the upward fluid flow between the settling particles 21.
Obtaining the exact form of for quiescent particle suspensions is quite challenging and has been the subject of much investigation 24, 18. One of the first empirical functional form that captures the -dependence on the hindered settling function was proposed by Richardson and Zaki nearly 70 years ago 16, as where for particles Reynolds numbers () below 0.2 when wall effects can be neglected. This relationship was found to be valid for both sedimentation and fluidization processes. It is worth emphasizing that there is still a debate on the exact value of the exponent . Recently, a comprehensive study has shown that the exponent has in fact two values: for Brownian particles and for non-Brownian particles. At very dilute particle concentration, the exponents converge to , a value that is close to Batchelor’s theoretical prediction, , obtained by including many-body hydrodynamic interactions between monodisperse constituent particles 15.
While there is a rich history (and much still to understand) on the subject of sedimentation of passive suspensions 23, 19, 20, 25, 21, 18, there has been a growing interest in systems that emulate the sedimentation of natural processes, particularly those that include living matter such as swimming microorganisms 26, 27, 28, 29, 30, 31. Presence of active particles (living or synthetic) inject energy to a suspending solution. Activity can drive the fluid out of equilibrium even in the absence of external forcing and lead to many poorly understood phenomena including low values of reduced viscosity 32, 33, enhancement in particle diffusivity 34, 35, 36, 37, 38, and collective motion (at high densities) 39, 40, 41. Thus, one expects activity to also affect the sedimentation of passive particles and the associated hindered settling function .
Experiments with synthetic active Janus particles has shown some intriguing results 26, 31, 29. These investigations show that the particle steady-state density profiles are significantly affected by activity and can be described by an exponential decay 26. Increasing particle activity leads to a slower exponential decay, which is described by using an effective temperature (and diffusivity) that is much larger than for passive systems 26. Varying sedimentation speed while maintaining a constant system activity also led to exponential decay in particle diffusivity 31. These steady-state results agree well with theory and simulations 42, 43, 44, 30, 31.
Sedimentation experiments with live organisms have been far less common but also show unusual phenomena. For example, bacteria has been shown to enhance sedimentation rates in the presence of polymers due to aggregation 45. In mixtures of swimming algae and particles, the (exponential) steady-state sedimentation profile of passive particle is found to be described by an effective diffusivity (or temperature) that increases linearly with the concentration of swimming microbes 46, similar to results in artificial active particles. Recently it was found that the sedimentation speed of passive particles can be significantly hindered by the presence of swimming microorganisms (E. coli) in the dilute regime 28; the hindered settling function for these settling active suspensions is captured by a Richardson-Zaki-type equation 16 with an exponent that is much larger than for passive systems and a function of bacteria activity. The time-dependent concentration profiles can be adequately described by an advection-diffusion equation coupled with sink-source terms to describe bacteria population dynamics, and with a dispersivity parameter that increases linearly with bacteria concentration 28. Nevertheless, the effects of bacterial activity on suspension sedimentation dynamics is still not fully understood.
Here, we experimentally investigate the sedimentation dynamics of dilute active suspensions using mixtures of passive colloidal spheres and swimming E. coli. These initially well-mixed suspensions settle for a period up to three days (depending on bacteria concentration ) and image analysis techniques are used to track the height of the particle sedimentation front. We find that the suspension phase separate into a particle- and bacteria-rich fronts. A simple model is presented that can capture the phase separation time based on species dispersivities and settling speeds.
2 Experimental Methods
In this contribution we experimentally study sedimentation of particles in the presence of bacteria. Active suspensions are prepared by mixing Escherichia coli (wild-type K12 MG1655) and polystyrene spheres (density g/cm3, Thermo Scientific) of diameter m in deionized (DI) water. Bacteria are grown to saturation ( cells/mL) in culture media (LB broth, Sigma-Aldrich). Both spheres and the saturated culture are centrifuged (Centrifuge 5430, eppendorf) and mixed with DI water to reach the desired bacteria volume fraction.
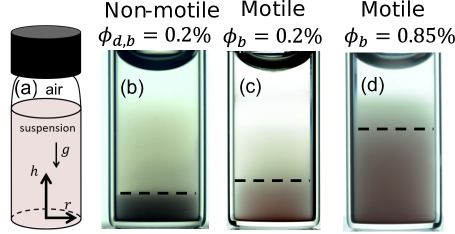
We transfer 1.5 mL of the prepared suspensions into glass vials (9.7 mm in diameter, 35 mm in height), as shown schematically in Fig. 1(a); the liquid column is approximately 20 mm tall. The suspensions are homogenized by hand with a pipette so that the bacteria and colloids are uniformly distributed at the start of the experiment. These vials are placed in a water tank to maintain the vials at room temperature °C and to remove optical aberrations during imaging (cylindrical vials are preferred to avoid effects from sharp edges). Images are taken every 10 min for a period of 2-3 days with a Nikon D7100 camera that is equipped with a 105 mm Sigma lens. The light source is a Edge-lit Collimated Backlights (CX,Advanced Illumination).
The initial motile bacteria volume fraction in the vials ranges from to , while the spherical colloids volume fraction is kept constant at . Both and concentrations are considered dilute, and no large scale collective behavior are observed for these bacteria-particle suspensions. The range of used here are below which collective motion is generally observed ( cells/mL) 47. Under these dilute conditions, E. coli swims at speeds ranging from m/s to m/s by the actuation of a helical flagellar bundle. This mode of swimming, under steady conditions, can be described in the far field by an extensile dipole flow (i.e., "pusher") 40.
3 Results and Discussion
Sample snapshots of the sedimentation experiments are shown in Fig. 1(b) – (d) at hr. The control passive case, (mixture of non-motile bacteria at with spherical colloidal particles at ) is shown in Fig. 1(b), while motile bacteria at and cases are shown in Fig. 1(c) and Fig. 1(d), respectively. The images show that bacterial activity hinders the settling speed of passive particles, as previously reported 28. We find that the passive particle sedimentation front sits higher in the case than in the non-motile bacteria case (). This trend continues for the case, which indicates that particle settling speed decreases with increasing (see SM for more information). We also observe the formation of two sedimentation fronts, one that is rich in passive particle and one that is rich in bacteria, as shown in Fig. 1(b) – (d). These two fronts settle at different speeds. These qualitative results show that (i) bacteria significantly hinders particle sedimentation speed and (ii) the two species phase separate during the sedimentation process. While the appearance of the bacteria front has been previously reported 28, here we will focus on quantifying and understanding the appearance of the two sedimentation fronts and its relationship to particle sedimentation front speed.
3.1 Front Sedimentation Heights & Speeds
We begin by measuring the sedimentation height of the passive spheres front as a function of time at different . The particle front sedimentation height, , is located in the vial by identifying the peak in the vertical gradient of the image intensity. By plotting as a function of time, we can extract the sedimentation speed of the particle front and define a hindered settling function as a function of bacteria concentration. The hindered settling function is defined as the ratio of the mean sedimentation speed of the particle front over the sedimentation speed of a single particle such that . We note that the Stokes’ sedimentation speed is m/s for the 2 m polystyrene particles in water.
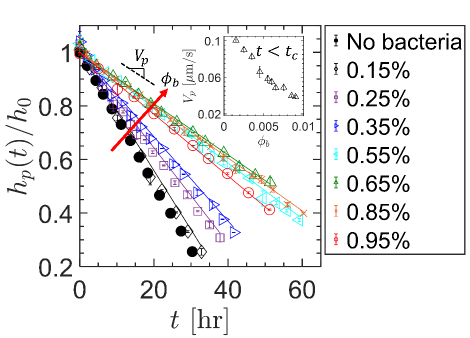
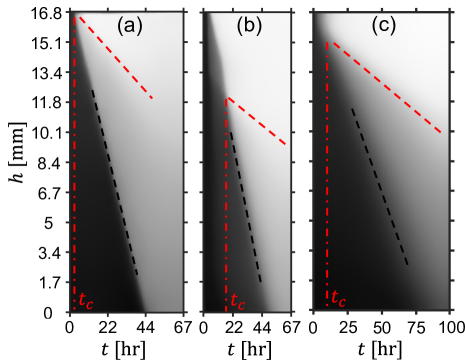
Figure 2(a) – (c) shows sedimentation kymographs ( vs ) for the mixture of particles with non-motile bacteria () case and two with active suspensions, and , respectively; these kymographs correspond to the data shown in Fig. 1(b) – (d). These experimental kymographs are obtained by the juxtaposition of a single pixel line at the center of the vial for each image of the time series. As noted before, all samples have a fixed particle volume fraction (). In each case a sedimentation front is formed and moves downward from the top of the container at a speed . A first look at the corresponding kymographs reveal that the velocity , here visible as the slope of the colloid front (black dashed line), decreases as the concentration of bacteria increases. We again observe the formation of a bacteria front that separates from spherical particles after a time (red dashed line). The timescale is defined as the time that the bacteria-rich front diverge from the particle-rich front. Experiments with non-motile bacteria and spherical particles shows that the two phases separate at relatively short time-scales ( hr), as shown in Fig. 2(a). Suspensions of motile bacteria (with particles) on the other hand phase separate at much longer time-scales ( hr). That is, activity seems to delay phase separation. Moreover, the phase separation time, , seems to decrease with , that is, .
The particle front sedimentation speed is found by linear fits to the kymograph plots such that
| (1) |
where is the initial front position; in all cases studied here, this linear relationship works relatively well even at long times ( hr). In absence of bacteria (), the front sedimentation speed m/s, which is relatively close to the sedimentation speed of a single sphere, m/s. This result indicates that hydrodynamic interaction among passive particles are relatively weak in our study. This not surprising since particle volume fraction is quite dilute, .
Figure 3 shows the normalized height of the particle sedimentation front, , for different bacteria volume fractions , where is the front initial height. We find that the settling height of the particle front is linear through all experiments, so it is described by a average speed, . A constant sedimentation speed is not a trivial result because the decrease in bacteria activity is commensurable with the time of the experiment. At 48 hr of experiment, approximately 70 of the population has lost motility and behave as a passive colloid 28. This has been previously characterized by the bacteria motility loss rate , which is approximately (see Ref. 28). We believe that the decrease in activity promotes a faster sedimentation; concurrently, the increase in passive particles (non-motile bacteria) should decrease the overall sedimentation speed. These two processes are not necessarily of the same magnitude.
The data also show that decreases as increases (Fig. 3). Surprisingly, this trend weakens and becomes independent of for at long times (). This transition, however, is not observed at short times (). To better illustrate this trend, we plot as a function of for all cases (Fig. 3, inset); we find that, for , decreases linearly with . Overall, we find two different functionalities regarding the effects of bacteria activity on : (i) for , decreases linearly with for all cases; (ii) for , decreases linearly with for followed by an asymptote for .
3.2 Hindered Settling Function for Active Suspensions
We now compute the suspension hindered settling function as a function of bacteria concentration, ; note that is kept constant at 0.04% for all cases. This variable is explored as a touchstone to previous literature and as a tool to develop our phenomenological model for the sedimentation of active suspensions. Similar to the data (and as expected), we find two regimes for . (i) For , decreases linearly with for all cases [Fig. 4(a), black triangles]; (ii) for , decreases linearly with for followed by an asymptote () for [Fig. 4(a), red diamonds]. These data show that bacterial activity can reduce the particle sedimentation speed by a factor of 2, which illustrates the dramatic effect of bacterial activity on sedimentation dynamics. The first regime () can be described by a linearized version of the Richardson-zaki equation 16 such that , with a best fit of [Fig. 4(a), black line]. This exponent is significantly larger than the expected fitting parameter for Brownian particles () 21 and Batchelor’s result () 15, but in line with our own previous results () 28. While the mechanisms leading to the linear dependence of on was previously investigated in our previous work 28, the transition of from a linear dependence to a -independent regime at has yet to be reported and/or understood.
The observed -independent regime in may be due to the increase in the amount (or volume fraction) of non-motile bacteria within the suspension during the sedimentation process. If we assume a a constant motility loss rate 28, it follows that an increase in would result in the production of more non-motile bacteria for the same experimental time . This increase in non-motile concentration within the system may overwhelm the effect of activity (), although it is not enough to significantly affect particle sedimentation speed. That is, the dependence of on passive (non-motile) particle volume fraction is much weaker than on motile bacterial volume fraction.
3.3 Phase Separation During Sedimentation
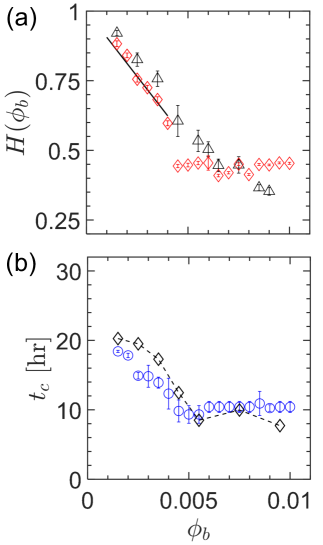
The images and kymographs shown in Fig. 1 and Fig. 2, respectively, show that after a certain period of sedimentation time, the active suspension separates into particle-rich and bacteria-rich fronts. Figure 4(b) [blue circles] shows the experimentally measured phase separation time as a function of for all cases. Similar to , the quantity shows a decreasing trend with , suggesting a deeper underlying relation at play. We now provide a simple argument to understand the origins of by noting that the behavior of the bacteria front is diffusive and can be captured by an equation of the form:
| (2) |
Here, is a dispersivity related to bacterial activity and is the sedimentation speed of the bacteria front. A dispersion length scale can thus be defined as . At earlier times, the bacteria front [or Eq. 2] settles faster than the particle front [or Eq. 1], but slower at later times (see SM Fig. 3). The phase separation time, , is the time at which the particle front crosses over the bacteria front, or . By equating Eq. 1 and Eq. 2, we obtain the following equation for the phase separation time:
| (3) |
All variables in the above equation can be measured or estimated. For example, is experimentally measured as a function of (Fig. 3) and m/s is approximately independent of in the dilute regime investigated here (see SM for more information). The dispersivity can be obtained by fitting Eq. 2 to the bacteria front shown in the kymograph. The data shows that decays exponentially with time as such that , where is the initial dispersivity, and is a dispersivity decay rate; the values of and can be found in the SM. The decay in dispersivity over time may be due to nutrient and oxygen depletion, or even aerotactic response near the air-liquid interface 48, 49 (see SM for more information). For simplicity, we will proceed with an average dispersivity defined as:
| (4) |
We plot the calculated phase separation time using in Fig. 4(b) [black diamonds]. Results show that this simple argument is able to capture the nonlinear experimental data relatively well, including the decreasing trend of with . Here, is a long enough time to provide a statistically meaningful average, longer than the experimentally measured phase separation time.
3.3.1 Scaling for Hindering Settling Function
The data show above makes it clear that there is a relationship between the timescale associated with phase separations and the hindering settling function . The other time scale present in the experiments is the bacteria motility loss rate, . We can use these two time-scales, and , to non-dimensionalize both and . The quantity is used to obtain a "separation" length-scale, , to normalize such that . This quantity tells us how far or close the front is from separating. Next, we non-dimensionalize time with the motility loss rate, . The quantity provides a measure of activity left in the sample. Figure 5(a) shows the normalized particle sedimentation height, , as a function of scaled time, , for a range of . The data shows that decreases linearly with , suggesting that activity prevents phase separation likely by mixing the two phases during the sedimentation process. Also, we find an average slope of through all experiments, indicating that these sample share similar dynamics.
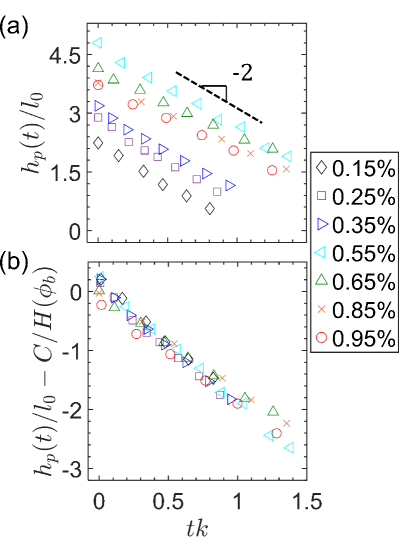
Next, we account for the intercept in Fig. 5(a) by noticing that it changes similarly to the inverse of the hindered settling function, ) (see SM for more information). Therefore, we subtract the re-scaled height () by a constant divided by the hindered settling function such that . The constant is obtained by equating the intercept of with , giving a value of . Remarkably, all experiments collapse onto a single master curve [Fig. 5(b)]. Putting together these results, the sedimentation front of passive particles can be described by the following differential equation:
| (5) |
which can be rearranged to be
| (6) |
We take the linear solution to this equation to obtain
| (7) |
Equation 5 shows that the sedimentation front of the passive particles are described by three main terms. The first term is (sedimentation) height normalized by a diffusion-based length-scale associated with the bacteria-particle settling process. The second term quantifies passive settling under gravity via the hindered settling function. The third term is time normalized by the motility decay rate, and quantifies the level of activity left in the sample. We note that a solution to Equation 5 is a line and is shown in Equation 7. If we solve the equation and revisit front height over time [Fig. 3], we observe that the solution captures all cases of active suspensions.
Our experimental observations show that sedimentation and separation of passive particles and bacteria suspensions are described by using sedimentation and diffusive length scales. The quantity of active suspensions occurs over very long time-scales compared to mixtures of passive particles that have two different masses and is reminiscent of the effects of centrifuging. This timescale plateau above a critical bacteria concentration (). We find that when plateau when , and has the same functionality. A possible mechanism that explains our experimental observations is due to an increased presence of non-motile bacteria which overwhelm the effects of the increased activity. The injection of energy by the bacteria swimming motion plays an important role in the sedimentation process; its decay is quantified by a motility loss rate , which is used to describe the settling of spherical particles.
Preparation of new experiments that track spherical particles while they sediment would help to understand these observations. This could be achieved by using a confocal microscope with a smaller vial. The downside of this proposed approach is that controlling the temperature at long times is a challenge. With this approach we would be able to obtain 3-D imaging as a function of time, which would allow to track the spherical particles and explore particle fluctuations.
4 Conclusions
The sedimentation of passive particles in the presence of swimming bacteria is experimentally investigated. We find that bacterial activity (even in the dilute regime) hinders the sedimentation of passive particles and phase separates at large time-scales, whereas the bacteria front with non-motile bacteria shows at smaller time-scales ( hr). Particle hindered settling function, ), as well as , show two distinct regimes: (i) a monotonic decay by increasing and (ii) a regime in which both ) and are no longer dependent of . A simple model based on particle and bacteria length scales is proposed which describes for a range of . Using non-dimensional analysis, we collapse all sedimentation front data onto a single master line that captures both bacteria concentration regimes. A phenomenological model is proposed to describe the height of the particle sedimentation front. The solution of this model captures relatively well the height of the sedimentation front of the passive particles for all within the dilute regime. In summary, an addition of a diffusive length-scale can captures the short time behavior of the bacteria front, and a sedimentation speed length scales captures the long time behavior of the bacteria front and the particle front. Further study on this field with different colloid concentrations and swimmer actuation modes (pusher vs puller) would presumably shed light on how the hydrodynamic interactions between the passive particles and active bacteria underlay the dynamics of our system and be generalized to others.
Conflicts of interest
There are no conflicts to declare.
Acknowledgements
We thank D. Jerolmack, C. Kammer, and A. Patteson for fruitful discussions. S.P. and P.E.A. acknowledge support from Army Research Office (ARO, Grant W911NF2010113). B.O.T.M., R.R., and P.E.A. acknowledge support by the National Science Foundation grant DMR-1709763.
Notes and references
- Schallenberg and Kalff 1993 M. Schallenberg and J. Kalff, Ecology, 1993, 74, 919–934.
- Zhang et al. 2020 L. Zhang, D. Tu, X. Li, W. Lu and J. Li, BMC Microbiology, 2020, 20, 254.
- Roberto et al. 2018 A. A. Roberto, J. B. Van Gray and L. G. Leff, Water Research, 2018, 134, 353–369.
- Nealson 1997 K. H. Nealson, Annual Review of Earth and Planetary Sciences, 1997, 25, 403–434.
- Herndl and Reinthaler 2013 G. J. Herndl and T. Reinthaler, Nature Geoscience, 2013, 6, 718–724.
- Vaccaro et al. 1950 R. F. Vaccaro, M. P. Briggs, L. Carey and B. H. Ketchum, American Journal of Public Health, 1950, 40, 1257–1266.
- Tréguer and Pondaven 2000 P. Tréguer and P. Pondaven, Nature, 2000, 406, 358.
- Sarmiento and Toggweiler 1984 J. Sarmiento and J. Toggweiler, Nature, 1984, 308, 621–624.
- Kiørboe 2008 T. Kiørboe, A Mechanistic Approach to Plankton Ecology, Princeton University Press, 2008.
- Giorgi et al. 2018 S. Giorgi, B. A. H. Reitsma, H. J. F. van Fulpen, R. W. P. Berg and M. Bechger, Water Science and Technology, 2018, 78, 1597–1602.
- Boock et al. 2019 J. T. Boock, A. J. E. Freedman, G. A. Tompsett, S. K. Muse, A. J. Allen, L. A. Jackson, B. Castro-Dominguez, M. T. Timko, K. L. J. Prather and J. R. Thompson, Nature Communications, 2019, 10, 587.
- Vázquez et al. 2020 J. A. Vázquez, A. I. Durán, A. Menduíña and M. Nogueira, Biomolecules, 2020, 10, .
- Hugenholtz and Smid 2002 J. Hugenholtz and E. J. Smid, Current Opinion in Biotechnology, 2002, 13, 497–507.
- Boutilier et al. 2009 L. Boutilier, R. Jamieson, R. Gordon, C. Lake and W. Hart, Water Research, 2009, 43, 4370–4380.
- Batchelor 1972 G. Batchelor, Journal of fluid mechanics, 1972, 52, 245–268.
- Richardson 1954 J. Richardson, Transactions of the institution of chemical engineers, 1954, 32, 35–53.
- Russel et al. 1991 W. B. Russel, W. Russel, D. A. Saville and W. R. Schowalter, Colloidal dispersions, Cambridge university press, 1991.
- Guazzelli and Morris 2011 E. Guazzelli and J. F. Morris, A physical introduction to suspension dynamics, Cambridge University Press, 2011, vol. 45.
- Guazzelli and Hinch 2011 E. Guazzelli and J. Hinch, Annual Review of Fluid Mechanics, 2011, 43, 97–116.
- Piazza 2014 R. Piazza, Reports on Progress in Physics, 2014, 77, 056602.
- Brzinski and Durian 2018 T. A. Brzinski and D. J. Durian, Phys. Rev. Fluids, 2018, 3, 124303.
- Brady 1988 J. F. Brady, The Physics of fluids, 1988, 31, 717–727.
- Davis and Acrivos 1985 R. H. Davis and A. Acrivos, Annual Review of Fluid Mechanics, 1985, 17, 91–118.
- Bürger and Wendland 2001 R. Bürger and W. L. Wendland, Journal of Engineering Mathematics, 2001, 41, 101–116.
- Piazza et al. 2012 R. Piazza, S. Buzzaccaro and E. Secchi, Journal of Physics: Condensed Matter, 2012, 24, 284109.
- Palacci et al. 2010 J. Palacci, C. Cottin-Bizonne, C. Ybert and L. Bocquet, Physical Review Letters, 2010, 105, 088304.
- Hermann and Schmidt 2018 S. Hermann and M. Schmidt, Soft Matter, 2018, 14, 1614–1621.
- Singh et al. 2021 J. Singh, A. Patteson, B. Torres Maldonado, P. K. Purohit and P. E. Arratia, Soft Matter, 2021, 4151–4160.
- Ginot et al. 2015 F. Ginot, I. Theurkauff, D. Levis, C. Ybert, L. Bocquet, L. Berthier and C. Cottin-Bizonne, Physical Review X, 2015, 5, 011004.
- Vachier and Mazza 2019 J. Vachier and M. G. Mazza, The European Physical Journal E, 2019, 42, 11.
- Ginot et al. 2018 F. Ginot, A. Solon, Y. Kafri, C. Ybert, J. Tailleur and C. Cottin-Bizonne, New Journal of Physics, 2018, 20, 115001.
- López et al. 2015 H. M. López, J. Gachelin, C. Douarche, H. Auradou and E. Clément, Physical Review Letters, 2015, 115, 028301.
- Gachelin et al. 2013 J. Gachelin, G. Miño, H. Berthet, A. Lindner, A. Rousselet and E. Clément, Physical Review Letters, 2013, 110, 268103.
- Wu and Libchaber 2000 X.-L. Wu and A. Libchaber, Physical Review Letters, 2000, 84, 3017–3020.
- Chen et al. 2007 D. T. N. Chen, A. W. C. Lau, L. A. Hough, M. F. Islam, M. Goulian, T. C. Lubensky and A. G. Yodh, Physical Review Letters, 2007, 99, 148302.
- Miño et al. 2011 G. Miño, T. E. Mallouk, T. Darnige, M. Hoyos, J. Dauchet, J. Dunstan, R. Soto, Y. Wang, A. Rousselet and E. Clement, Physical Review Letters, 2011, 106, 048102.
- Jepson et al. 2013 A. Jepson, V. A. Martinez, J. Schwarz-Linek, A. Morozov and W. C. K. Poon, Physical Review E, 2013, 88, 041002.
- Patteson et al. 2016 A. E. Patteson, A. Gopinath, P. K. Purohit and P. E. Arratia, Soft Matter, 2016, 12, 2365–2372.
- Marchetti et al. 2013 M. C. Marchetti, J. F. Joanny, S. Ramaswamy, T. B. Liverpool, J. Prost, M. Rao and R. A. Simha, Rev. Mod. Phys., 2013, 85, 1143–1189.
- Berg 2008 H. C. Berg, E. coli in Motion, Springer Science & Business Media, 2008.
- Ramaswamy 2010 S. Ramaswamy, Annual Review of Condensed Matter Physics, 2010, 1, 323–345.
- Nash et al. 2010 R. W. Nash, R. Adhikari, J. Tailleur and M. E. Cates, Phys. Rev. Lett., 2010, 104, 258101.
- Tailleur and Cates 2008 J. Tailleur and M. Cates, Phys. Rev. Lett., 2008, 100, 218103.
- Wang et al. 2014 Z. Wang, H. Y. Chen, Y. J. Sheng and H. K. Tsao, Soft Matter, 2014, 10, 3209–3217.
- Schwarz-Linek et al. 2012 J. Schwarz-Linek, C. Valeriani, A. Cacciuto, M. E. Cates, D. Marenduzzo, A. N. Morozov and W. C. K. Poon, Proc. Natl. Acad. Scien., 2012, 109, 4052–4057.
- Jeanneret et al. 2016 R. Jeanneret, D. O. Pushkin, V. Kantsler and M. Polin, Nature Comm., 2016, 7, 12518.
- Kasyap et al. 2014 T. V. Kasyap, D. L. Koch and M. Wu, Physics of Fluids, 2014, 26, 081901.
- Douarche et al. 2009 C. Douarche, A. Buguin, H. Salman and A. Libchaber, Phys. Rev. Lett., 2009, 102, 198101.
- Schwarz-Linek et al. 2016 J. Schwarz-Linek, J. Arlt, A. Jepson, A. Dawson, T. Vissers, D. Miroli, T. Pilizota, V. A. Martinez and W. C. Poon, Colloids and Surfaces B: Biointerfaces, 2016, 137, 2–16.