Stochastic pH oscillations in a model of the urea–urease reaction confined to lipid vesicles111
This document is the unedited author’s version of a submitted work that was
subsequently accepted for publication in The Journal of Physical Chemistry Letters, copyright ©American Chemical Society after peer review. To access the final edited and published work,
see DOI: 10.1021/acs.jpclett.1c03016
Cite as: A. V. Straube, S. Winkelmann, C. Schütte,
F. Höfling, J. Phys. Chem. Lett. 12, 9888–9893 (2021)
Abstract
The urea–urease clock reaction is a pH switch from acid to basic that can turn into a pH oscillator if it occurs inside a suitable open reactor. We study the confinement of the reaction to lipid vesicles, which permit the exchange with an external reservoir by differential transport, enabling the recovery of the pH level and yielding a constant supply of urea molecules. For microscopically small vesicles, the discreteness of the number of molecules requires a stochastic treatment of the reaction dynamics. Our analysis shows that intrinsic noise induces a significant statistical variation of the oscillation period, which increases as the vesicles become smaller. The mean period, however, is found to be remarkably robust for vesicle sizes down to approximately . The observed oscillations are explained as a canard-like limit cycle that differs from the wide class of conventional feedback oscillators.
Freie Universität Berlin, Department of Mathematics and Computer Science,
Arnimallee 6, 14195 Berlin, Germany
\alsoaffiliationZuse Institute Berlin, Takustraße 7, 14195 Berlin, Germany
![[Uncaptioned image]](/html/2110.03465/assets/x1.png)
Oscillations are vital for the processes of life such as metabolism, signalling, cell growth and division 1, 2 with examples ranging from fast signalling cycles and calcium oscillations to slow circadian rhythms3. Cells gain control over these processes by biochemical reaction networks 4, 5, e.g., gene-regulatory, protein-interaction, and metabolic networks, which almost always involve enzyme-catalyzed reactions. Protonation and bi-protonation can significantly affect the enzymatic activity, leading to a bell-shaped dependence of the reaction speed on the \chH+ concentration or, equivalently, the pH level 6. Such a dependence can give rise to pronounced periodic pH variations, the key driving factor for pH oscillators 7. A conventional \chpH oscillator is built up by balancing a positive, autocatalytic feedback (production of \chH+) with a time-delayed, negative feedback (e.g., consumption of products) 2, 7. A qualitatively different pH oscillator has recently been suggested for a lipid vesicle with the urea-urease clock reaction8, 9, 10 periodically recovered by the differential transport of acid and urea across the vesicle membrane 11, 12, 13.
Experimentally, urea–urease pH oscillations were observed so far in macroscopic reaction volumes 9, 14. Also, most analyses of pH oscillators to date have relied on deterministic reaction rate equations (RRE). Furthermore, there is a growing interest in chemical oscillators for applications.15, 16, 17, 18, 19 This motivates the question whether stable limit cycles persist and how they change upon downscaling from the macroscopic to, e.g., intracellular reaction volumes. Indeed, the cytoplasm is a highly heterogeneous medium exhibiting macromolecular crowding and compartmentalization, with repercussions on the reaction kinetics 20, 21, 22, 23. Enzymatic activity is confined to small reaction chambers ranging from about for lipid membrane organelles 24 down to for bacterial microcompartments 25, 26 and outer membrane vesicles 27, 28. Such small compartments can host only very limited copy numbers of molecules, necessitating the replacement of RREs by their discrete and inherently stochastic counterparts 29, 30, 31. Intrinsic noise due to such molecular discreteness leads to a breakdown of the macroscopic theory of Michaelis–Menten kinetics 32, 33, 34. For monostable reaction networks, not only the size of fluctuations35, 36 but also the mean concentrations 37, 38 become volume dependent. Furthermore, intrinsic noise may change the stability of steady states, inducing oscillations in deterministic systems without limit cycles 39, 40, or alter the characteristics of limit cycles 41. However, its impact on pH-regulated systems has remained largely unexplored.
In this work, we consider the urea–urease reaction and study how the stable rhythmic variation of the pH level 12, 14 is affected by intrinsic noise when decreasing reaction volumes to biologically relevant scales. Within one cycle, molecular copy numbers can vary from few molecules to several thousands almost instantaneously, which is captured by the stochastic simulations. We detect irregular oscillations, perform a statistical analysis of the period lengths and gain further insight into the oscillation mechanism.
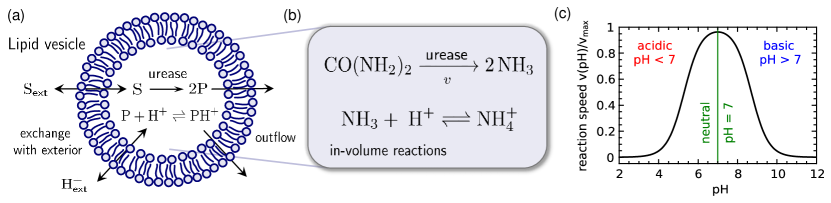
Model. Our study is based on a minimal model for the urease-catalyzed urea hydrolysis, which exhibits pH oscillations while admitting a simple representation as a reaction network to facilitate the stochastic simulations. Bánsági and Taylor11 showed that the full model of the urea–urease reaction cycle, involving the concentrations of eight molecular species, can be reduced to an effective 5-variable model. To further simplify, we eliminate one more species (\chOH-) from the reaction network with merely small quantitative changes to the evolution of the remaining concentrations (see Supporting Information). The corresponding reaction scheme involves only four species and consists of two core reactions that are assumed to take place inside a lipid vesicle, serving as a small-size, well-mixed reaction compartment of volume . In addition, the vesicle can exchange molecules with its exterior via a permeable membrane (Figure 1a). Under the action of urease enzymes, urea \chCO(NH_2)_2 as the substrate species \chS is converted into ammonia molecules \chNH_3 as product \chP (Figure 1b). Concomitantly, ammonia reacts with the acid to form ammonium ions (abbreviated as \cePH+ in the following). Thus, the reactions inside the vesicle read:
| (1a) | |||
| (1b) | |||
The speed of reaction (1a) is crucially affected by the acidity of the medium and controlled by the available amount of protons \chH+; the proton concentration is converted to the pH value via in terms of the molar volume and Avogadro’s number . Hereafter, we denote the numbers of molecules of species \chS, \chH+, \chP, and \chPH+ as , , , , respectively; we will reserve square brackets to refer to concentrations, , etc.
The efficacy of the catalytic step (1a) is modeled by an effective rate6, 42, 11
| (2) |
with the conventional Michaelis–Menten rate in the absence of \chpH-effects given by
| (3) |
and the Michaelis–Menten constant43, 9, 11 . The rate possesses a maximum that is proportional to at an optimal amount of \chH+, and reaction (1a) is suppressed for \chH+ concentrations smaller and larger than this value, or, equivalently at large and small \chpH values, as determined by the constants 43, 9, 11 and , see Figure 1c. For the stochastic simulations in terms of particle numbers we evaluate as the propensity for reaction (1a) to occur. This reaction is further coupled to reaction (1b), meaning that the product is also affected by the acidity and can reversibly turn into ammonium ions \chPH+. The corresponding rates are set as44, 9, 11 and .
Apart from the in-volume reactions, (1a) and (1b), we assume outflow or decay of the product in both its forms, \chP and \chPH+, with the rate constant . Further, we consider an explicit exchange of \chS and \chH+ with the exterior of the vesicle serving as a reservoir, with rates and , respectively, equal in both directions. The spatial exchange between the interior and the exterior of the vesicle is modeled as stochastic jump process along the lines of the spatio-temporal master equation 45, 46 and can be written as reactive transitions. Thus, the interaction with the exterior of the reaction volume is summarized as
| (4a) | |||
| (4b) | |||
We treat the reservoir as sufficiently large, such that reactions (4b) lead only to marginal changes to the amounts of and . Therefore, we approximate their concentrations by fixed values and and replace reactions (4b) by
| (5) |
To inspect oscillatory regimes, we rely on the parameters that were shown to exhibit periodic deterministic oscillations for the urease-loaded membrane 11. Generally, the rate of proton transport shall be faster than that of urea ; here, we use and . The outflow rate of the products is set to and the maximum speed as , where the latter corresponds to an urease concentration of . In all simulations, the external values of and were fixed to match the concentrations and , or equivalently, to an acidic environment at . Inside of the vesicle, the initial values of and were chosen to correspond to concentrations and (or ), respectively.
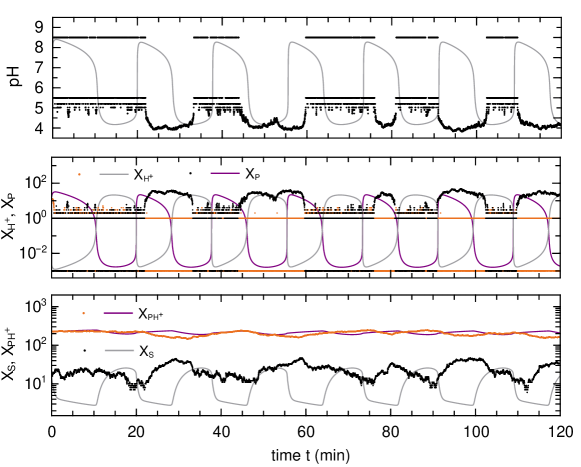
Results and discussion. The deterministic evolution of the macroscopic concentrations obeys the RREs of the 4-species model (see eqs. (S1) of the Supporting Information). For the parameter values chosen above, the results from numerical integration are quantitatively similar to the earlier findings within the 5-variable model 11. For an exemplary vesicle size of in diameter (i.e., a reaction volume of ) the evolution of all variables after a short transient displays clear periodic oscillations (Figure 2, solid lines). Especially, the pH level varies strongly between and (upper panel). Correspondingly, the copy number of protons (as rescaled solution of the RRE) on a logarithmic scale mirrors this behavior, and the product evolves in antiphase relative to , with both quantities changing over four orders of magnitude rapidly (middle panel). The values of show comparably little variation and remain large and distinctly greater than those of the other species (bottom panel). The maximum copy numbers of and are similar in magnitude to the typical values for the substrate \chS, while the minima of and correspond formally to average copy numbers of the order . Although such values are not prohibited by the reaction rate formalism, the actual copy numbers must be integer with the closest allowed values being either or . This inconsistency is a signature of the deficiency of the macroscopic description at such a small scale.
Stochastic simulations of the reactions (1), (4a), and (5) were performed by the stochastic simulation algorithm 47, 48. In the macroscopic limit of a large reaction volume (e.g., for giant vesicles of diameter ), the stochastic concentrations converge to the solution of the deterministic RRE given by eqs. (S1), as expected.48, 31 With decreasing volume, the role of intrinsic noise grows and one anticipates deviations from the deterministic description. The stochastic trajectories develop well pronounced fluctuations and differ significantly from the corresponding deterministic solutions, as demonstrated for a vesicle size of in Figure 2. These stochastic effects are weaker for species of large copy number, e.g. \chPH+, while they are strong for the acid and the product, whose amounts drop to few molecules and even becomes zero frequently. The same features are reflected in the oscillations of the pH level, which directly follows from .
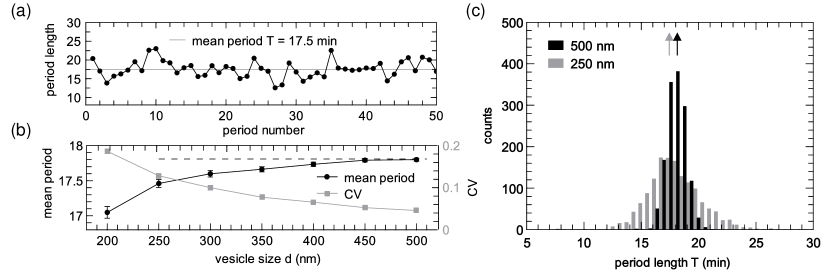
We stress that the intrinsic noise perturbs the rhythm of the pH variation. The stochastic oscillations become clearly irregular, from time to time showing either longer or shorter periods compared to their strictly regular deterministic counterparts. To characterize this kind of stochasticity, we have extracted the period lengths from a single, long trajectory of covering about 1500 periods. The obtained sequence of -values shows a high variability (Figure 3a) around the mean period of , which is slightly shorter than the value predicted by the deterministic model, . Further, the data show no sign of a temporal trend in the period length, and an autocorrelation analysis suggests that the lengths of subsequent periods are independent. The large scatter of period lengths along a stochastic trajectory is evidenced from their statistical distribution, shown in Figure 3c for vesicle sizes of and . The scatter is larger for the smaller vesicle, and we infer a small shift of the mean value. Indeed, Figure 3b corroborates that the mean oscillation period becomes monotonically shorter upon decreasing the size of the vesicle. At the same time, the coefficient of variation (CV), which is the dimensionless ratio of the standard deviation over the mean, gradually grows for smaller reaction volumes, see Figure 3(b). At large volumes, CV tends to zero as required by the macroscopic limit; for the smallest vesicle size shown (), we have . Generally, this trend is expected since smaller reaction volumes correspond to more discrete and therefore more noisy systems. Overall, with the decrease in volume, the oscillations become more and more irregular. For very small vesicles (e.g., , see Fig. S1 of Supporting Information), the size of fluctuations becomes comparable to the oscillation amplitude and the oscillatory behavior breaks down.
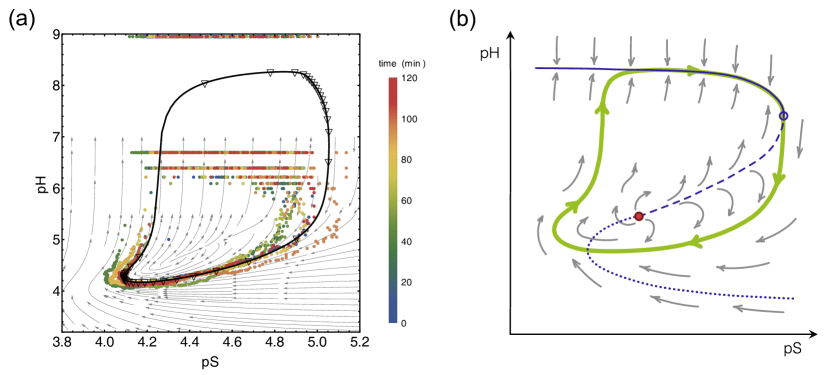
For a dynamic system showing regular oscillations, the deterministic solution (after an initial transient) follows a limit cycle, i.e., an attractive, closed orbit in the space of concentrations. For the 4-variable model studied here, Figure 4a shows the deterministic limit cycle (solid line) in the pH-pS plane, where , overlaid with a short exemplary stochastic trajectory (dots). In this representation, the cycle is followed clockwise. We infer that intrinsic noise causes pronounced irregularities of the stochastic loop, with the trajectory points distributed well around the deterministic cycle for the smaller values of \chpH (high ), but significantly deviating from it for larger \chpH (low ). The latter is due to the fact that non-integer copy numbers are not permitted in the stochastic simulation. The discreteness of the number of protons is apparent in the figure for and incompatible with the deterministic solution, which implies for for the chosen reaction volume. Thus, the lowest possible values of either undershoot () or overshoot (, i.e., formally ) the upper branch of the deterministic limit cycle.
Further insight into the oscillation mechanism is gained by studying the structure of the deterministic flow (Figure 4a, stream lines). As such a flow map is non-trivial to obtain for a system of more than two variables, we have approximately reduced the -variable RRE system to a two-dimensional dynamic system, by resorting to the quasi-steady-state assumptions49 for the products and . This ad-hoc simplification preserves the fixed points of the original system and captures the qualitative structure of the flow; in particular, it yields a limit cycle quantitatively close to that of the full model for . The closed-loop attractor results from the interplay of an unstable focus point at , which is the only fixed point, and a canard-type behavior50, 51 at high \chpH values. This combination leads to an oscillator motif that differs from standard pictures of bistability 7, 2, 52 (Figure 4b).
Typical for canard-type behavior is a coupling between fast and slow dynamics. As depicted in Figure 4b, the upper branch of the \chpH-nullcline (i.e., the manifold ) is strongly attractive (solid line) and combines fast, almost transverse motion towards the limit cycle orbit followed by the creeping along it (\chpS increases), which holds until the turning point (open circle) is reached. At this point, the nullcline bends back accompanied by a change of stability: the manifold between the turning point and the fixed point (red circle) is unstable (dashed line) and locally separates the flow into regions of increasing and decreasing \chpH level. In contrast to toy models for canard dynamics, where the dynamics switches between two attractive branches, the rest of the nullcline in the present system is neutrally stable (dotted line) and has no obvious effect on the flow structure. Thus, after reaching the turning point, the pH level decreases quickly and the phase trajectory follows the flow set between the repelling manifold and the outer flow field, around the unstable focus until the loop is closed. For the stochastic trajectories, which traverse the interior of the limit cycle, we infer that different crossing points of the separatrix lead to a scatter in the phase plane (near ), which explains the observed variability in the period length.
In conclusion, we have studied the urea–urease reaction confined to a nanosized lipid vesicle, which presents a typical clock reaction8 effectively raising the pH level. Under suitable conditions, the clock recovers due to the exchange of acid and urea with an external reservoir, leading to a \chpH oscillator that differs from the wide class of conventional feedback oscillators7; instead, it resembles a canard dynamics 50, 51. The insight gained into the oscillation mechanism can help to optimize experimental setups and to design chemical oscillators based on the same principles.
The presented stochastic analysis, in contrast to deterministic studies, shows that intrinsic noise induces a significant statistical variation of the oscillation period, which increases upon downscaling the vesicle size. We note that although the mean period is remarkably robust for intermediate vesicle sizes, it slightly changes with the vesicle size. Therefore and because of the inevitable size disparity in vesicle suspensions 12, different oscillators possess slightly detuned eigenfrequencies, an important issue for understanding intervesicle communication and synchronization of rhythms53, 54, 55, which would not be captured by deterministic models. Finally, our findings suggest that below a certain scale, which may be still relevant for applications, the periodicity of the rhythm is gradually destroyed. Namely, apart from the irregularity in the period length, there appear strong deviations in the oscillation amplitude masked by fluctuations growing with the decrease in vesicle size. It is likely that similar trends take place for other \chpH oscillators, which can be answered by specific tests along the lines presented here.
We thank Tamás Bánsági and Federico Rossi for clarifying details of the models in Refs. 11, 13. This research has been supported by Deutsche Forschungsgemeinschaft (DFG) through grant SFB 1114, project no. 235221301 (sub-project C03) and under Germany’s Excellence Strategy – MATH+ : The Berlin Mathematics Research Center (EXC-2046/1) – project no. 390685689 (subproject AA1-1).
References
- Goldbeter 1996 Goldbeter, A. Biochemical Oscillations and Cellular Rhythms; Cambridge University Press: Cambridge, 1996
- Novák and Tyson 2008 Novák, B.; Tyson, J. J. Design principles of biochemical oscillators. Nat. Rev. Mol. Cell Biol. 2008, 9, 981–991, DOI: 10.1038/nrm2530
- Panda et al. 2002 Panda, S.; Hogenesch, J. B.; Kay, S. A. Circadian rhythms from flies to human. Nature 2002, 417, 329–335, DOI: 10.1038/417329a
- Tyson et al. 2003 Tyson, J. J.; Chen, K. C.; Novak, B. Sniffers, buzzers, toggles and blinkers: dynamics of regulatory and signaling pathways in the cell. Curr. Opin. Cell Biol. 2003, 15, 221–231, DOI: 10.1016/S0955-0674(03)00017-6
- Alon 2020 Alon, U. An Introduction to Systems Biology: Design Principles of Biological Circuits, 2nd ed.; CRC Press: New York, 2020
- Alberty and Massey 1954 Alberty, R. A.; Massey, V. On the interpretation of the pH variation of the maximum initial velocity of an enzyme-catalyzed reaction. Biochim. Biophys. Acta 1954, 13, 347–353, DOI: 10.1016/0006-3002(54)90340-6
- Orbán et al. 2015 Orbán, M.; Kurin-Csörgei, K.; Epstein, I. R. pH-regulated chemical oscillators. Acc. Chem. Res. 2015, 48, 593–601, DOI: 10.1021/ar5004237
- Lente et al. 2007 Lente, G.; Bazsa, G.; Fábián, I. What is and what isn’t a clock reaction? New J. Chem. 2007, 31, 1707–1707, DOI: 10.1039/B708846A
- Hu et al. 2010 Hu, G.; Pojman, J. A.; Scott, S. K.; Wrobel, M. M.; Taylor, A. F. Base-catalyzed feedback in the urea-urease reaction. J. Phys. Chem. B 2010, 114, 14059–14063, DOI: 10.1021/jp106532d
- Bubanja et al. 2018 Bubanja, I. N.; Bánsági, T.; Taylor, A. F. Kinetics of the urea-urease clock reaction with urease immobilized in hydrogel beads. React. Kinet. Mech. Cat. 2018, 123, 177–185
- Bánsági and Taylor 2014 Bánsági, T.; Taylor, A. F. Role of differential transport in an oscillatory enzyme reaction. J. Phys. Chem. B 2014, 118, 6092–6097, DOI: 10.1021/jp5019795
- Miele et al. 2016 Miele, Y.; Bánsági, T.; Taylor, A. F.; Stano, P.; Rossi, F. Engineering enzyme-driven dynamic behaviour in lipid vesicles. Advances in Artificial Life, Evolutionary Computation and Systems Chemistry. Cham, 2016; pp 197–208, DOI: 10.1007/978-3-319-32695-5_18
- Miele et al. 2018 Miele, Y.; Bánsági, T.; Taylor, A. F.; Rossi, F. Modelling approach to enzymatic pH oscillators in giant lipid vesicles. Adv. Bionanomater.: Lecture Notes in Bioengineering. Cham, 2018; pp 63–74, DOI: 10.1007/978-3-319-62027-5_6
- Muzika et al. 2019 Muzika, F.; Růžička, M.; Schreiberová, L.; Schreiber, I. Oscillations of pH in the urea–urease system in a membrane reactor. Phys. Chem. Chem. Phys. 2019, 21, 8619–8622, DOI: 10.1039/C9CP00630C
- Cupić et al. 2021 Cupić, Ž. D.; Taylor, A. F.; Horváth, D.; Orlik, M.; Epstein, I. R. Editorial: Advances in oscillating reactions. Front. Chem. 2021, 9, 690699, DOI: 10.3389/fchem.2021.690699
- Shklyaev et al. 2020 Shklyaev, O. E.; Yashin, V. V.; Balazs, A. C. Effects of an imposed flow on chemical oscillations generated by enzymatic reactions. Front. Chem. 2020, 8, 618, DOI: 10.3389/fchem.2020.00618
- Maria 2020 Maria, G. In silico determination of some conditions leading to glycolytic oscillations and their interference with some other processes in E. coli cells. Front. Chem. 2020, 8, 526679, DOI: 10.3389/fchem.2020.526679
- Budroni et al. 2020 Budroni, M. A.; Torbensen, K.; Pantani, O. L.; Ristori, S.; Rossi, F.; Abou-Hassan, A. Microfluidic compartmentalization of diffusively coupled oscillators in multisomes induces a novel synchronization scenario. Chem. Commun. 2020, 56, 11771–11774, DOI: 10.1039/D0CC05046F
- Mallphanov and Vanag 2021 Mallphanov, I. L.; Vanag, V. K. Distance dependent types of coupling of chemical micro-oscillators immersed in a water-in-oil microemulsion. Phys. Chem. Chem. Phys. 2021, 23, 9130–9138, DOI: 10.1039/D1CP00758K
- Höfling and Franosch 2013 Höfling, F.; Franosch, T. Anomalous transport in the crowded world of biological cells. Rep. Prog. Phys. 2013, 76, 046602, DOI: 10.1088/0034-4885/76/4/046602
- Weiss 2014 Weiss, M. In New Models of the Cell Nucleus: Crowding, Entropic Forces, Phase Separation, and Fractals; Hancock, R., Jeon, K. W., Eds.; Int. Rev. Cell Mol. Biol.; Academic Press, 2014; Vol. 307; Chapter 11, pp 383–417, DOI: 10.1016/B978-0-12-800046-5.00011-4
- Schneider et al. 2015 Schneider, S. H.; Lockwood, S. P.; Hargreaves, D. I.; Slade, D. J.; LoConte, M. A.; Logan, B. E.; McLaughlin, E. E.; Conroy, M. J.; Slade, K. M. Slowed Diffusion and Excluded Volume Both Contribute to the Effects of Macromolecular Crowding on Alcohol Dehydrogenase Steady-State Kinetics. Biochemistry 2015, 54, 5898–5906, DOI: 10.1021/acs.biochem.5b00533
- Tsiapalis and Zeugolis 2021 Tsiapalis, D.; Zeugolis, D. I. It is time to crowd your cell culture media – Physicochemical considerations with biological consequences. Biomaterials 2021, 275, 120943, DOI: 10.1016/j.biomaterials.2021.120943
- Cooper and Hausman 2009 Cooper, G. M.; Hausman, R. E. The Cell: A Molecular Approach; ASM Press: Washington, DC, 2009
- Sutter et al. 2008 Sutter, M.; Boehringer, D.; Gutmann, S.; Günther, S.; Prangishvili, D.; Loessner, M. J.; Stetter, K. O.; Weber-Ban, E.; Ban, N. Structural basis of enzyme encapsulation into a bacterial nanocompartment. Nat. Struct. Mol. Biol. 2008, 15, 939–947, DOI: 10.1038/nsmb.1473
- Kerfeld et al. 2010 Kerfeld, C. A.; Heinhorst, S.; Cannon, G. C. Bacterial Microcompartments. Ann. Rev. Microbiol. 2010, 64, 391–408, DOI: 10.1146/annurev.micro.112408.134211
- Kaparakis-Liaskos and Ferrero 2015 Kaparakis-Liaskos, M.; Ferrero, R. L. Immune modulation by bacterial outer membrane vesicles. Nat. Rev. Immunol. 2015, 15, 375–387, DOI: 10.1038/nri3837
- Schwechheimer and Kuehn 2015 Schwechheimer, C.; Kuehn, M. J. Outer-membrane vesicles from Gram-negative bacteria: biogenesis and functions. Nat. Rev. Microbiol. 2015, 13, 605–619, DOI: 10.1038/nrmicro3525
- Grima and Schnell 2008 Grima, R.; Schnell, S. Modelling reaction kinetics inside cells. Essays Biochem. 2008, 45, 41–56, DOI: 10.1042/bse0450041
- Wilkinson 2009 Wilkinson, D. J. Stochastic modelling for quantitative description of heterogeneous biological systems. Nat. Rev. Genet. 2009, 10, 122–133, DOI: 10.1038/nrg2509
- Winkelmann and Schütte 2020 Winkelmann, S.; Schütte, C. Stochastic Dynamics in Computational Biology; Springer, 2020
- Stéfanini et al. 2005 Stéfanini, M. O.; McKane, A. J.; Newman, T. J. Single enzyme pathways and substrate fluctuations. Nonlinearity 2005, 18, 1575–1595, DOI: 10.1088/0951-7715/18/4/008
- Grima 2009 Grima, R. Noise-induced breakdown of the Michaelis-Menten equation in steady-state conditions. Phys. Rev. Lett. 2009, 102, 218103, DOI: 10.1103/PhysRevLett.102.218103
- Grima 2009 Grima, R. Investigating the robustness of the classical enzyme kinetic equations in small intracellular compartments. BMC Syst. Biol. 2009, 3, 101, DOI: 10.1186/1752-0509-3-101
- Grima et al. 2011 Grima, R.; Thomas, P.; Straube, A. V. How accurate are the nonlinear chemical Fokker-Planck and chemical Langevin equations? J. Chem. Phys. 2011, 135, 084103, DOI: 10.1063/1.3625958
- Thomas et al. 2012 Thomas, P.; Straube, A. V.; Grima, R. The slow-scale linear noise approximation: an accurate, reduced stochastic description of biochemical networks under timescale separation conditions. BMC Syst. Biol. 2012, 6, 39, DOI: 10.1186/1752-0509-6-39
- Thomas et al. 2010 Thomas, P.; Straube, A. V.; Grima, R. Stochastic theory of large-scale enzyme-reaction networks: Finite copy number corrections to rate equation models. J. Chem. Phys. 2010, 133, 195101, DOI: 10.1063/1.3505552
- Ramaswamy et al. 2012 Ramaswamy, R.; González-Segredo, N.; Sbalzarini, I. F.; Grima, R. Discreteness-induced concentration inversion in mesoscopic chemical systems. Nat. Commun. 2012, 3, 779, DOI: 10.1038/ncomms1775
- McKane et al. 2007 McKane, A. J.; Nagy, J. D.; Newman, T. J.; Stefanini, M. O. Amplified biochemical oscillations in cellular systems. J. Stat. Phys. 2007, 128, 165–191, DOI: 10.1007/s10955-006-9221-9
- Thomas et al. 2013 Thomas, P.; Straube, A. V.; Timmer, J.; Fleck, C.; Grima, R. Signatures of nonlinearity in single cell noise-induced oscillations. J. Theor. Biol. 2013, 335, 222–234, DOI: 10.1016/j.jtbi.2013.06.021
- Ramaswamy and Sbalzarini 2011 Ramaswamy, R.; Sbalzarini, I. F. Intrinsic noise alters the frequency spectrum of mesoscopic oscillatory chemical reaction systems. Sci. Rep. 2011, 1, 154, DOI: 10.1038/srep00154
- Fidaleo and Lavecchia 2003 Fidaleo, M.; Lavecchia, R. Kinetic study of enzymatic urea hydrolysis in the pH range 4–9. Chem. Biochem. Eng. Quat. 2003, 17, 311–318, DOI: 10.15255/CABEQ.2014.599
- Krajewska 2009 Krajewska, B. Ureases I. Functional, catalytic and kinetic properties: A review. J. Mol. Catal. B: Enzym. 2009, 59, 9–21, DOI: 10.1016/j.molcatb.2009.01.003
- Eigen 1964 Eigen, M. Proton Transfer, Acid-base catalysis, and enzymatic hydrolysis. Part I: Elementary processes. Angew. Chem. Int. Ed. 1964, 3, 1–19, DOI: 10.1002/anie.196400011
- Winkelmann and Schütte 2016 Winkelmann, S.; Schütte, C. The spatiotemporal master equation: Approximation of reaction-diffusion dynamics via Markov state modeling. J. Chem. Phys. 2016, 145, 214107
- Winkelmann et al. 2021 Winkelmann, S.; Zonker, J.; Schütte, C.; Conrad, N. D. Mathematical modeling of spatio-temporal population dynamics and application to epidemic spreading. Math. Biosciences 2021, 336, 108619
- Gillespie 1977 Gillespie, D. T. Exact stochastic simulation of coupled chemical reactions. J. Phys. Chem. 1977, 81, 2340–2361, DOI: 10.1021/j100540a008
- Gillespie et al. 2013 Gillespie, D. T.; Hellander, A.; Petzold, L. R. Perspective: Stochastic algorithms for chemical kinetics. J. Chem. Phys. 2013, 138, 170901, DOI: 10.1063/1.4801941
- Segel and Slemrod 1989 Segel, L. A.; Slemrod, M. The quasi-steady-state assumption: A case study in perturbation. SIAM Review 1989, 31, 446–477, DOI: 10.1137/1031091
- Benoît et al. 1981 Benoît, É.; Callot, J. L.; Diener, F.; Diener, M. Chasse au canard. Collect. Math. 1981, 31, 37–119
- Desroches and Jeffrey 2011 Desroches, M.; Jeffrey, M. R. Canards and curvature: the ‘smallness of ’ in slow-fast dynamics. Proc. R. Soc. A 2011, 467, 2404–2421, DOI: 10.1098/rspa.2011.0053
- Hirsch et al. 2013 Hirsch, M. W.; Smale, S.; Devaney, R. L. Differential equations, dynamical systems, and an introduction to chaos; Academic Press: Boston, 2013
- Pikovsky et al. 2001 Pikovsky, A.; Rosenblum, M.; Jürgen, K. Synchronization a Universal Concept in Nonlinear Sciences; Cambridge University Press: Cambridge, UK, 2001
- Budroni et al. 2020 Budroni, M. A.; Torbensen, K.; Ristori, S.; Abou-Hassan, A.; Rossi, F. Membrane structure drives synchronization patterns in arrays of diffusively coupled self-oscillating droplets. J. Phys. Chem. Lett. 2020, 11, 2014–2020, DOI: 10.1021/acs.jpclett.0c00072
- Budroni et al. 2021 Budroni, M. A.; Pagano, G.; Conte, D.; Paternoster, B.; D’ambrosio, R.; Ristori, S.; Abou-Hassan, A.; Rossi, F. Synchronization scenarios induced by delayed communication in arrays of diffusively coupled autonomous chemical oscillators. Phys. Chem. Chem. Phys. 2021, 23, 17606–17615, DOI: 10.1039/D1CP02221K
0.0.1 Deterministic reaction rate equations
As suggested earlier 11, the original eight-variable model can be simplified by neglecting the production of \ceCO2, leaving us with five species, see eqs. (A2)–(A7) in Ref. 11. From numerical tests we found that also the explicit dynamics of \ceOH- has no qualitative and no pronounced quantitative effect on the dynamics of the other species. Aiming at a minimal model capable of oscillations, we therefore neglect the presence of \ceOH-. Formally, this can be achieved by neglecting the exchange with the exterior for \ceOH- and making use of the quasi-steady state assumption49, assuming that the evolution of \ceOH- is fast compared to that of the catalytic step, eq. 1a of the main text. Hence, setting yields a slaved dynamics of the form . As a result, we obtain the four-variable model discussed in the paper. The temporal evolution of the urea–urease reaction scheme, see reactions (1) and (4a), coupled to a reservoir according to eq. 5 is governed by the following reaction rate equations for the mean concentrations:
| (S1a) | ||||
| (S1b) | ||||
| (S1c) | ||||
| (S1d) | ||||
where the rate of the catalytic step depends on [\chS] and [\chH+] as given by eqs. 2 and 3 of the main text. The mean molecule numbers shown in Figure 2 of the main text are obtained by rescaling with the molar volume, e.g., and accordingly for all other species.
0.0.2 Breakdown of periodic rhythms upon downscaling
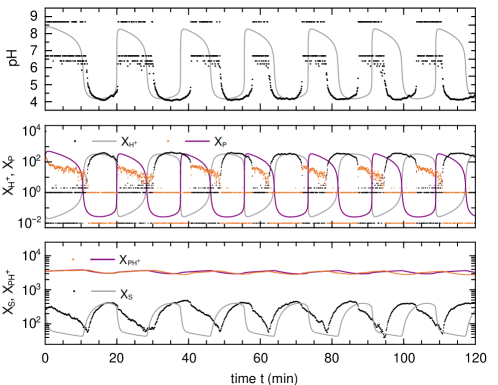
As stated in the main text, below the rhythms are found to gradually lose its periodicity. In Figure S1, we show the stochastic evolution for a vesicle, cf. Figure 2 of the main text.