∎
22email: p.pooladvand@maths.usyd.edu.au 33institutetext: Peter S. Kim 44institutetext: School of Mathematics and Statistics, The University of Sydney, Sydney, NSW 2006, Australia
55institutetext: Barbara Fazekas de St Groth 66institutetext: Discipline of Pathology, School of Medical Sciences, Faculty of Medicine and Health, The University of Sydney, Sydney, NSW 2006, Australia 77institutetext: * Corresponding author
Both authors contributed comparably
The Role of Antigen Competitive Dynamics in Regulating the Immune Response
Abstract
The clonal expansion of T cells during an infection is tightly regulated to ensure an appropriate immune response against invading pathogens. Although experiments have mapped the trajectory from expansion to contraction, the interplay between mechanisms that control this response are not fully understood. Based on experimental data, we propose a model in which the dynamics of CD4+ T cell expansion is controlled through the interactions between T cells and antigen-presenting cells, where T cell stimulation is proportional to antigen availability and antigen availability is regulated through downregulation of antigen by T cells. This antigen-dependent-feedback mechanism operates alongside an intrinsic reduction in cell proliferation rate that may also be responsible for slowing expansion. Our model can successfully predict T cell recruitment rates into division, expansion and clonal burst size per cell when initial precursors are varied or when T cells are introduced late into an ongoing immune response. Importantly, the findings demonstrate that a feedback mechanism between T cells and antigen presenting cells, along with a reduction in cell proliferation rate, can explain the ability of the immune system to adapt its response to variations in initial conditions or changes that occur later in the response, ensuring a robust yet controlled line of defence against pathogens.
Keywords:
CD4+ T cell activation T cell proliferation and regulation Antigen availability Delay differential equations (DDEs)1 Introduction
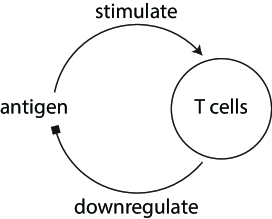
A primary T cell response triggers T cell division and differentiation in a highly organised manner, occurring almost synchronously for a limited time (Homann et al, 2001; Beverley and Maini, 2000). Although this controlled expansion is essential to mount an appropriate response to pathogens and protect against autoimmune diseases, the mechanisms that drive this behaviour are not well understood. One explanation is that T cell proliferation and resulting clonal expansion are dependent on continual antigen stimulation, which has been observed experimentally for CD4+ T cells (Rabenstein et al, 2014; Yarke et al, 2008). During an immune response, antigen-specific, naive CD4+ T cells interact with mature antigen-presenting cells (APCs) in lymph nodes and become activated. Here, the theory is that the activated T cells continue to interact with APCs leading to a period of clonal expansion. If T cells are stimulated by antigen to continue dividing, then we must consider the mechanism that limits the expansion. One theory is that T cells downregulate antigen presented by APCs and this behaviour controls the overall T cell clonal expansion, ensuring that larger populations of T cells experience more competition for antigen than smaller populations. Specific antigen downregulation during T cell responses has been observed experimentally (Furuta et al, 2012; Kedl et al, 2000), and may be mediated via an intercellular molecular transfer process called trogocytosis, reviewed by (Dhainaut and Moser, 2014).
The mechanisms that drive the controlled behaviour of CD4+ T cell proliferation in relation to antigen availability have been explored using mathematical models. Borghans et al. used ordinary differential equations to experiment with a variety of T cell proliferation functions. Fitting models to in vitro data providing proliferation estimates of a CD4+ T cell clone over a 24-hour culture, they concluded that T cells compete for antigen sites on APCs, and this competition controls the overall level of T cell expansion (Borghans et al, 1999).
De Boer et al., designed a model that assumes CD4+ T cell expansion is proportional to the average concentration of antigen (peptide-MHC concentration) on an APC, and antigen concentration is affected by a T cell downregulation mechanism, called grazing. Grazing (the consumption of surface antigen by interacting T cells) saturates for large T cell numbers under the assumption that APCs can bind to a limited number of T cells at a time (De Boer and Perelson, 2013). This model successfully explained in vivo experimental results by Quiel et al., in which initial T cell numbers were varied and the factor of expansion (the ratio of the number of T cells at day 7 to the number of T cells at day 1) was measured (Quiel et al, 2011). Following this work, Mayer et al. also explained the experimental results by Quiel et al. using a T cell competition model in which T cell proliferation is regulated by antigen presentation (concentration of peptide-MHC molecules), the number of T cells present and the affinity of T cells to antigen. In this model, T cells do not influence the downregulation of peptides, and overall expansion is limited by antigen decay (Mayer et al, 2019).
The role of CD4+ T cells has also been included in models capturing the broader dynamics and interactions involved in cell-mediated immunity response. Pappalardo et al. adopted an agent-based approach to describe the response of immune cells (B lymphocytes, CD4+ T cells, CD8+ T cells, macrophages and dendritic cells) to influenza A virosome when administered in conjunction with pre-selected adjuvants (a substance that can improve the immune response) (Pappalardo et al, 2016). In this model CD4+ T cells activate and proliferate through interactions with B cells and macrophages. The model predicts the most suitable adjuvant to be used in conjunction with influenza A virosome based on the response of antibodies (immunoglobulin G). The authors show that the model prediction is in good agreement with in vivo results. Pennisi et al. modelled the efficacy of the RUTI® vaccine against Mycobacterium tuberculosis (MTB) by using the Universal Immune System Simulator (UISS), an agent-based computational framework (Pennisi et al, 2019). The authors used this simulator to build a complex system of interactions, considering both innate and adaptive immunity. The model captures interactions between cells and cytokines released during the immune response. Naïve CD4+ T cells differentiate into phenotypes and interact with B cells driving the response. The model is in good agreement with the results from a phase II clinical trial where the subjects with latent tuberculosis infection were treated with RUTI®.
In this paper, we consider a model in which CD4+ T cell expansion is controlled at a rate proportional to antigen concentration and antigen concentration is downregulated by T cells as in Figure 1; however, our model does not assume saturation due to limitations in space or binding of T cells to MHC molecules. We base this assumption on experiments by Spencer et al. (Spencer et al, 2020), where the behaviour of monoclonal, high affinity CD4+ T cells responding to specific peptide-MHC complexes in vivo is observed. The authors showed that the response to a second, independent antigen did not limit the initial response even when the same dendritic cells presented both antigens (refer to Figure 4-7 in (Spencer et al, 2020)). Our model also considers an intrinsic reduction in cell proliferation upon subsequent divisions, which is implied by fitting the model to experimental data. Building a mechanistic system of delay differential equations, we track T cell divisions and total T cell numbers to explain the dynamics of T cell expansion during a primary immune response from two separate experimental scenarios: one in which the overall clonal expansion of CD4+ T cells is measured against initial T cell numbers, and another in which T cell recruitment and division is measured for a cohort of T cells that is introduced later in an ongoing immune response. By fitting our model to these scenarios we demonstrate that the regulation of T cell clonal expansion may result from an antigen competitive environment along with a reduction in T cell proliferation rate.
The work is organised as follows. In Section 1.1 we summarise the experimental method. In Sections 2 and 3 we introduce our model and discuss model calibration to three experimental data sets. In Section 4 we compare our model prediction to the experimental results. Finally, we discuss the implications of our model and future work in Section 5.
1.1 Overview of experimental method
We summarise the experiments of Smith et al. and Spencer et al., which we will use to quantify the dynamics of CD4+ T cell expansion during an immune response.
-
•
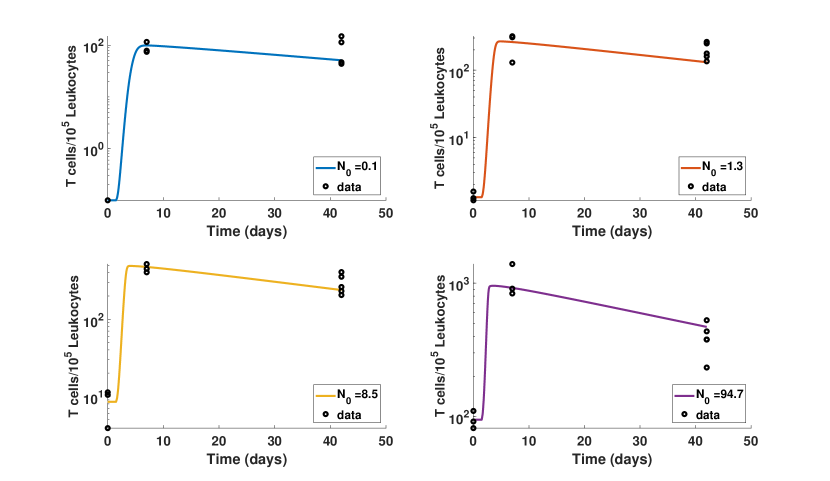
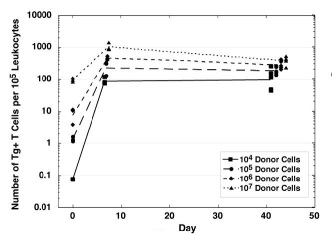
Experiment 1 (Smith and Fazekas de St Groth, 2020) measures T cell clonal expansion during an immune response in relation to initial T cell numbers. In this experiment, transgenic lymph node T cells are injected into non-transgenic Ly5.1 congenic recipient mice in doses of , , and cells. T cells in the system are measured on day 0 and all mice receive a fixed dose (10g) of cognate antigen, injected on the same day. T cells are counted on days 7 and 42. Results in Figure 12 show the number of Tg+ T cells per leukocytes measured in the draining lymph nodes.
-
•
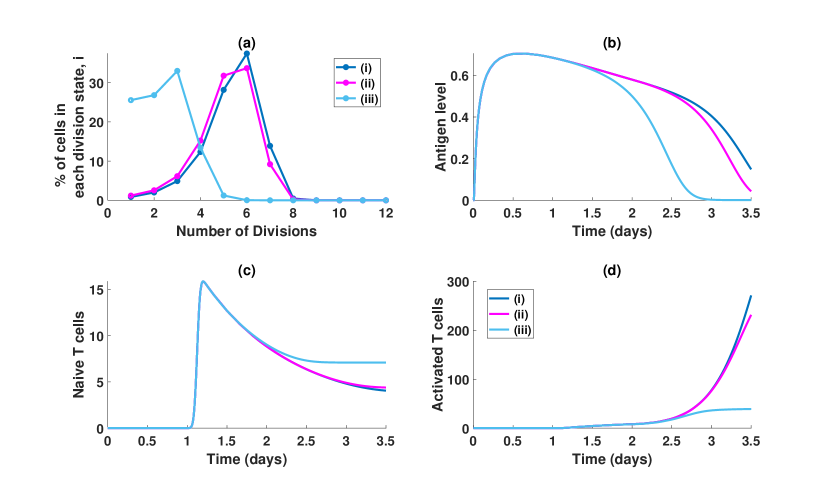
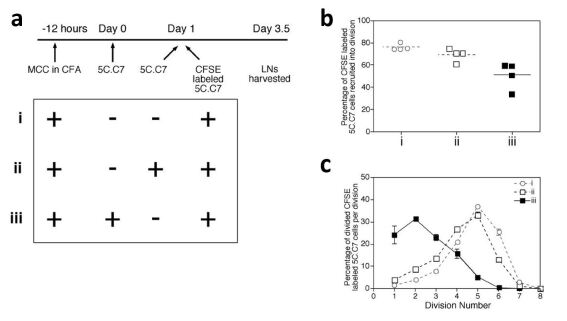
Experiment 2 (Spencer et al, 2020) measures the percentage of T cells recruited and their division profiles when CD4+ T cells are injected later in an ongoing immune response. In this experiment, two cohorts of 5C.C7 T cells are injected into recipient mice. The first cohort is the competing T cells and the second is the CFSE-labelled cells, which we are tracking. Group (i) is the control group where no competing cohort is injected. In Group (ii), both cohorts are injected on the same day, and in Group (iii), the competing cohort is injected 24 hours prior to the labelled cells. All recipient mice receive the same dose of cognate antigen (g) 12 hours prior to the start of experiment. The results for this experiment are shown in Figure 13.
-
•
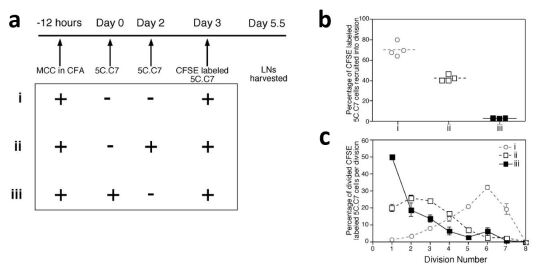
Experiment 3 (Spencer et al, 2020) is similar to Experiment 2 but with an extended delay for the CFSE-labelled cells. In this experiment, we have a control group Group (i) with no competing cohort, Group (ii) with a 24-hour delay between the competing cohort and the labelled cells and Group (iii) with a 72-hour delay for the labelled cells. Results are shown in Figure 14.
We optimise the parameters in our model by fitting to all three experiments simultaneously.
2 Model
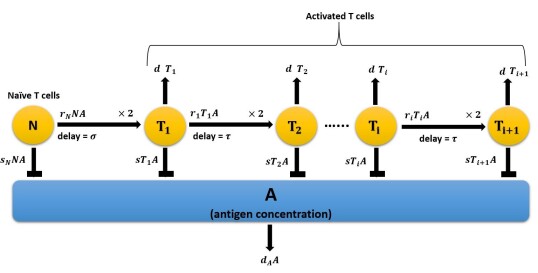
We consider a scenario in which adoptively transferred, naive CD4+ T cells interact with mature antigen-presenting cells (APCs) in lymph nodes during a primary immune response. For simplicity, we model the general level of antigen, instead of explicitly introducing a population of APCs. Our model includes antigen, ; naive T cells, ; and activated T cells, , , …, , …, where the subscript represents the number of cell divisions undergone by the population by time . Along with estimating the total number of T cells in time, we will also use this model to estimate the number of divisions in the timespan of 3.5 and 5.5 days. These are the timespans for Experiment 2 and 3 respectively. For this reason we use a system of delay differential equations to capture the time delay between divisions more accurately. The following system of delay differential equations (DDE) describes the interactions between our populations:
| (1) | ||||
| (2) |
with activated T cell populations
| (3) | ||||
| (4) | ||||
| (5) | ||||
In equation (1), antigen is supplied to the lymph nodes at rate . We assume downregulation of antigen occurs at mass-action rates proportional to antigen availability and T cell population size. We also consider that downregulation may occur at different rates for naive cells compared with activated cells. Therefore the rates and describe the downregulation of antigen by naive and activated T cells respectively. Antigen decays at rate .
In equation (2), naive T cells, , enter the lymph nodes at rate and activate at mass-action rate upon interaction with antigen with coefficient . The half life of naive CD4+ T cells in mice is approximately 7 weeks (den Braber et al, 2012), so for the timescale of our model, we assume naive T cells do not decay and remain constant in lymph nodes if no antigen is present.
The first term of equation (3) accounts for T cells that have undergone their first round of divisions arriving in state . The time delay accounts for the time taken for naive T cells to activate and divide once. The next round of divisions occur at rate and daughter cells move to state after a delay of . The population of T cells continue to divide in this manner with each T cell state having a distinct activation/proliferation rate . Equation (5) describes the general form for the number of T cells in state . We note that subsequent divisions following experience the same delay of length . The factor accounts for the cells that decay or leave the lymph nodes during the delay period. All T cells decay or exit lymph nodes at rate . The population interactions are illustrated in Figure 2.
3 Parameter estimates
In keeping with Experiment 1’s design, we scale the T cell population as numbers of cells per leukocytes and antigen as proportions of the injected dose , so that the initial dose scales to 1. We administer this dose using the supply rate . As we have a system of delay differential equations, we need to specify a history for our populations, so we set all populations, , and to zero, for . Initial populations at time 0 will be outlined in Section 4 as they are unique to each experiment.
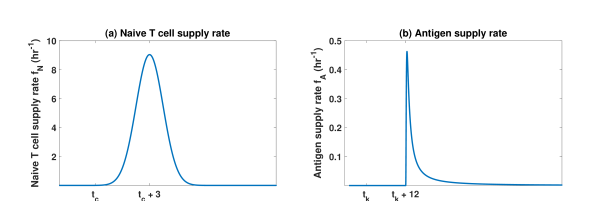
After transfer, CD4+ T cells migrate to lymph nodes within minutes with substantial numbers entering 2 to 4 hours later (Liou et al, 2012). Using this information, we set a normal distribution function for the naive T cell supply at time :
| (6) |
where , is the time of injection of naive T cells and as illustrated in Figure 3a. Our choice in and means that the supply peak is at 3 hours following T cell transfer, with the majority (91%) of cells supplied by the fourth hour. Increasing up to 5 so that T cells are supplied over 48 hours does not significantly alter the outcome.
Previous experiments in mice have shown that activated dendritic cells begin to appear in the draining lymph nodes 8 to 16 hours following footpad injections (Liou et al, 2012). Allan et al. measured small numbers of DCs in the lymph nodes at 12 hours with peak numbers 1 to 2 days after treatment (Allan et al, 2006). Data presented by Tomura et al. described a steep rise in DCs for the first 24 hours following treatment with a very small increase in the next 24 hours (Tomura et al, 2014). With this information in mind, we assume that antigen enters the lymph nodes 12 hours following injection time, , with the majority of antigen supplied within the first day. We use a stable distribution
| (7) |
with shape parameters and , scale parameter and location parameter , to supply the lymph nodes with antigen. Antigen injection time, , depends on the experiment and will be detailed in Section 4. These parameters produce a long tailed supply function as in Figure 3b. Using a decreasing step function is also suitable for this system and produces similar results as long as we are in the range of 2 days for the delivery of the majority of antigen.
The first division of CD4+ T cells takes approximately 24 hours (Obst, 2015), so we let hours. In recreating Experiment 2 and Experiment 3, we need to track the number of divisions experienced by T cells in a short time period of 3.5 and 5.5 days respectively. This means that the initial delay is an important parameter to capture the wait time between T cell activation and the time at which T cells begin to rapidly divide and downregulate antigen. The equivalent ordinary differential equation system without delay cannot capture the initial mean division time even at very low proliferation rates. The delay of subsequent divisions is fitted to experimental data with an optimum fit value of 3.9863 which agrees with the observed range of 4 to 6 hours (Rabenstein et al, 2014; Van de Velde and Murray, 2016).
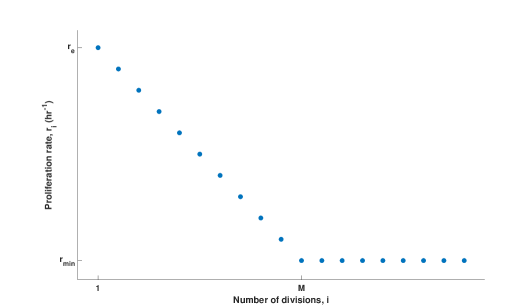
We model T cell activation and division as proportional to antigen availability. As stated previously, we do not consider saturation or space limitations as a cause for reduction in T cell divisions; instead, we assume that T cell division rate slows with subsequent divisions. This reduction in proliferation rates has been observed experimentally. For example, Homman et al. measured the division rates of CD4+ T cells during an immune response and concluded that the average division rates are 9-20 hours between days 5 and 7 reducing to 20-40 hours between days 7 and 9 (Homann et al, 2001). We will treat this reduction in division as a function of the number of divisions , rather than a reduction in time. We choose a proliferation function for that is linearly decreasing with each division, reaching a constant division rate after divisions as in Figure 4. Therefore our proliferation parameter is a piece-wise function of the number of divisions :
| (8) |
where is the maximum division rate of T cells and . We note that an exponentially decaying proliferation function such as or a step function constant at when divisions are below approximately 7 or 8 and reducing to a fraction of for larger divisions describes the data equally well. Therefore, the model does not heavily depend on the type of function, rather that the proliferation rate decreases as cells divide. The experimental results in Figures 13c and 14c show that T cells divided up to 7 times in 2.5 days following an immune response, so we choose . Our choice in using a linear function is motivated so as to not over-dampen the divisions experienced per cell. We fit and to the experimental data. The fitted maximum proliferation rate . This value equates to an average doubling time of hours in agreement with experimental results reporting 5 to 8 division in 24 to 36 hours (Van de Velde and Murray, 2016) and another reporting division every 4 to 6 hours (Rabenstein et al, 2014).
We also need to consider the activation and first division rate, , of naive T cells. This parameter controls the number of cells that are recruited to the response and is measured in Experiment 2 (see Figure 13b) and Experiment 3 (see Figure 14b). We fit this parameter to the experimental data.
Given that we are implicitly modelling presentation of antigen on APCs, we estimate that the rate corresponds to the turnover of APCs. Mature dendritic cells have an estimated half life of 2 to 3 days under steady-state conditions (Diao et al, 2006; Kamath et al, 2002). Assuming the majority of our antigen-presenting cells are dendritic cells, we use 2.5 days (60 hours) for the half life of our population so that .
Lambrecht et al., showed that CD4+ T cells begin to exit the lymph nodes approximately 2 days following immunisation (Lambrecht et al, 2000). From our simulations, cells enter state approximately 1.5 days following infection. For simplicity, we fit a constant clearance rate to all populations of T cells. The clearance rate accounts for T cells leaving the lymph nodes in the early stages of the response and dying at later stages. For the purpose of this model, we consider these cells as permanently removed from the lymph nodes, although it is likely that a small number will continue to recirculate through the priming node.
Lastly, we consider downregulation of antigen for naive and activated T cells with rates and , respectively. By optimising to data, we find that the optimal value for this parameter is very small and the confidence interval contains the null value. Therefore, we simplify our model by setting this parameter to zero. The removal of this parameter means that we assume naive T cells do not significantly contribute to the downregulation of antigen. The parameter is fitted to experimental data.
All parameter estimates can be found in Table I. Parameters , , , , and are optimised to data by solving model (1-5) in MATLAB R2018a and performing a simultaneous fit of model output to experimental data in Figure 12, Figure 13b, Figure 13c, Figure 14b and Figure 14c. We use the built-in fitter ‘lsqcurvefit’, nonlinear least-squares, trust-region-reflective algorithm.
| Parameter estimates | ||||
|---|---|---|---|---|
| Parameter | Description | Units | Estimate | Source/Conf Interval |
| Maximum T cell proliferation rate | hr-1 | 1.5412 | ||
| Naive T cell proliferation rate | hr-1 | 0.0497 | ||
| Change in T cell proliferation rate per division | - | 0.0994 | ||
| T cell clearance rate | hr-1 | 0.0009 | ||
| Largest number of divisions before reaches a constant | - | 10 | Estimated | |
| Antigen downregulation | hr-1 | 0.0009 | ||
| Naive T cell activation/first division delay | hours | 24 | (Obst, 2015) | |
| Activated T cell proliferation delay | hours | 3.9796 | ||
| Death rate of APCs | hr-1 | 0.01 | (Diao et al, 2006; Kamath et al, 2002) | |
| Time of injection for naive T cells | - | Details in Section 4 | ||
| Time of injection for antigen | - | Details in Section 4 | ||
| Supply rate of antigen | hr-1 | (Allan et al, 2006; Tomura et al, 2014) | ||
| Supply rate of naive T cells | hr-1 | ) | (Liou et al, 2012) | |
4 Results
We solve (1)-(5) numerically using ‘dde23’ in MATLAB R2018a. We first consider the case in which initial naive T cell counts are varied for a fixed dose of antigen, see Figure 12. In this experiment, naive CD4+ T cells are injected into recipient mice in four different doses, increasing incrementally by factors of 10. The T cells are injected 3 days prior to the start of the experiment and numbers are measured at day 0. We run the model with each initial condition as the average measured at day 0, namely , , and (cells/ leukocytes). In the experiment, no additional T cells are introduced into the system, so for all . Since the cognate antigen is injected on day 0 of the experiment, we set for the antigen supply function, described in equation (7). To track total T cells in time, we calculate the sum of T cells in all states at time t as
| (9) |
In this equation, represents cells undergoing first division, where
| (10) |
and represents cells undergoing the division, where
| (11) |
so that is the transition state between and , and is the transition state between and . From equation (10), naive T cells enter at rate and remain in this state for hours before exiting to . For higher division states , the exponential factor in the second term accounts for the fraction of cells that survive the division period of hours, consistent with equations (3)-(5). We truncate simulations at 20 divisions as number of dividing cells at this threshold drop below .
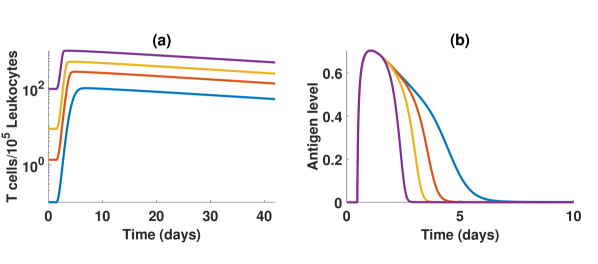
In Figure 5, we have the total number of T cells over 42 days from expansion to contraction (semi-log) fitted to experimental data taken at days 0, 7 and 42. The results show that our model can capture the behaviour in the data for varying initial precursor doses of antigen-specific naive T cells. If we compare the rise in T cell numbers between the precursors at the three time points, 0, 7 and 42, as in Figure 6a, there is a clear reduction in clonal expansion of T cells as the precursor dose is increased from (blue) to (purple) in agreement with results in Figure 12. As initial precursors are increased, antigen levels decrease more rapidly due to T cell downregulation of antigen, controlling the size of clonal expansion. In Figure 6b, we see that antigen levels diminish faster as initial precursors rise. In the smaller precursors, where antigen is available over a longer period of time, the cell intrinsic proliferation rate, limits the expansion. Together, antigen availability and reduction in cell proliferation, capture the observations from Experiment 1.
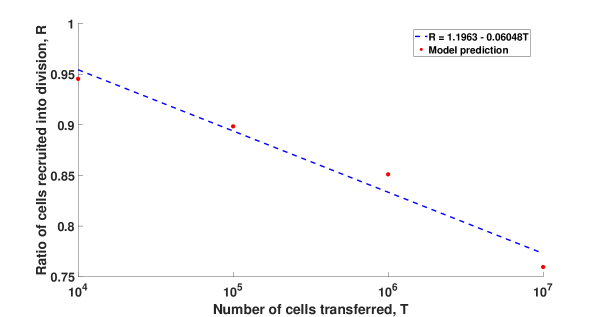
The fold difference (ratio of largest population () to smallest population ()) from experimental results are 1000 at day 0 and 12 at day 7. Our model predicts a fold difference of 9.3 on day 7. We can also use our model to estimate the percentage of cells that are recruited into division by calculating the ratio of naive cells on the last day of experiment to naive cells on day 0 as
| (12) |
In Figure 7 we have the ratio of recruitment into division for each group of transferred cells. From the line of best fit we can estimate a reduction of per factor 10 increase in initial naive cell counts.
In the next experiment, the efficiency of CD4+ T cells to contribute to an ongoing immune response is determined by transferring two separate cohorts of naive T cells into recipient mice and increasing the time delay between the two transfers, Figure 13a. The results in Figure 13 track the delayed population (CFSE-labelled cells) and compare the effect of delay on the percentage of cells recruited into division, Figure 13b, and division profiles on the final day of experiment (day 3.5), Figure 13c. To simulate these results, we introduce a second cohort of T cells with naive cells, , and activated cells in state , . We also define a T cell supply rate , such that , where , and is the transfer time for the second cohort of T cells. These populations mirror our original system, (1-5), with total T cells as measured in equation (9). We will refer to our original population as the CFSE-labelled cells (or just labelled cells) and the second cohort as the competing cells. In this experiment, antigen is injected approximately 12 hours prior to the first injection of naive T cells, so we set time of antigen injection for our antigen supply function . Since the injected dose of antigen in this series of experiments is the same as the previous, we assume that a similar antigen concentration will be presented by the APCs, and therefore, total antigen dose is 1. From experimental design in Figure 13a, in all three groups (i) to (iii), our labelled T cell population is injected 24 hours after day 0. Therefore we set time of injection and for our T cell supply function . Each injected dose of T cells is . In the previous experiment (Figure 12), a cell transfer of resulted in 8.5 cells/ leukocytes measured in the lymph nodes on day 0. Doubling this, we set the T cell dose at 17 cells/ leukocytes for each injection and supply it using for CFSE-labelled cells and for the competing cohort of cells. To match the experimental design, we set as follows:
-
•
Group (i) - control group, no competing cohort, .
-
•
Group (ii) - competing cohort injected at the same time as labelled cells ().
-
•
Group (iii) - competing cohort injected 24 hours prior to labelled cells ().
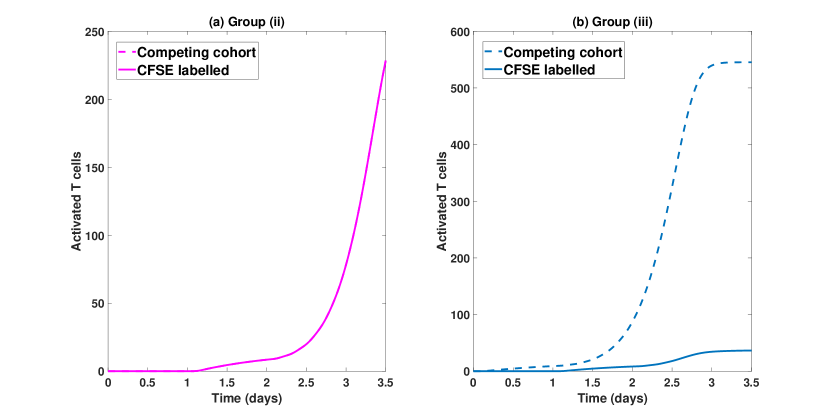
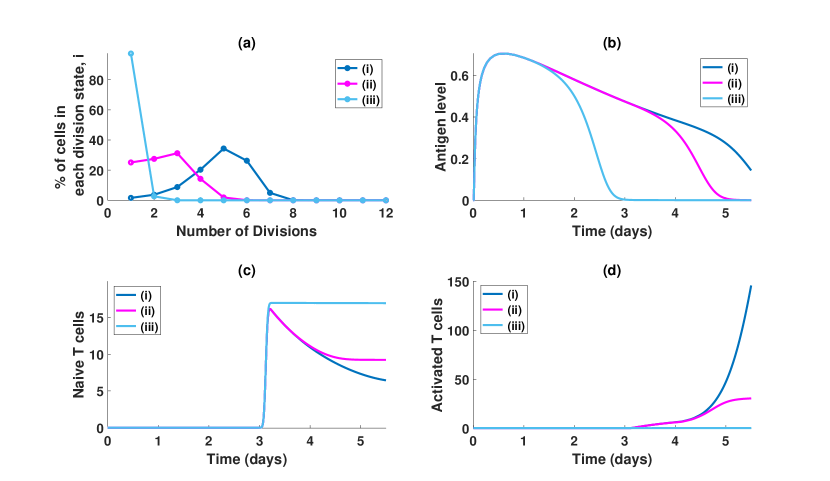
We now compare experimental results in Figure 13 with model output in Figure 8, tracking the CFSE-labelled cells. Our results in Figure 8a demonstrate that if the competing cohort is released on the same day as the labelled cells (group (ii)), there is no change in the division profile compared with control group (i). However, if the competing cohort is injected one day prior to the labelled cells, the model estimates a significant drop in division profiles in line with experimental results, Figure 13c. In Figure 8b, we see how antigen downregulation by T cells affects each population. No significant difference in loss of antigen is apparent between groups (i) and (ii) until approximately day 3. For group (iii), downregulation of antigen begins earlier, limiting the division of labelled cells as the competing cohort is injected at an earlier time. The similarity in antigen availability for groups (i) and (ii) means that naive and activated T cells experience almost identical dynamics in the timespan of the experiment as in Figures 8c and 8d respectively. On the other hand, the delay of 24 hours in group (iii) causes the naive population to stabilise much earlier than when we have no delay (group (ii)) or no competing cohort (group (i)). As a result the total activated population in group (iii) reaches peak numbers around day 3 while the other groups continue to grow. Using equation (12), with , there is a minimal effect on cell recruitment into division between (i) and (ii) from to . The delayed cohort, group (iii), only experiences recruitment. The estimated percentages are a good approximation to the experimental results in Figure 13b. We can compare the contribution of total activated T cells in the immune response from each cohort (competing cells versus labelled cells) in Figure 9. From Figure 9a, when both cohorts are injected at the same time, they contribute equally to the overall expansion (trajectories trace each other). With a 24-hour delay between transfer of competing cohort and labelled cells, there is a significant drop in the contribution of labelled cells. These results suggest that for a given number of initial precursors, the observed reduction in T cell divisions and recruitment can be explained by restrictions in antigen availability as growing cohorts of T cells downregulate antigen ensuring that T cells arriving late to an ongoing response will experience only limited activation and proliferation.
We now simulate the experimental set up in Figure 14, which tests the response of T cells to a longer delay between the labelled cells and competing cohort. Following the experimental design in Figure 14a, the CFSE-labelled cells are injected on day 3. We set in so that peak of T cell supply occurs at hours. We also need to specify the supply of the competing cohort. From experimental design, they are injected at hours for group (ii) and for group (iii). We set as follows:
-
•
Group (i) - control group, no competing cohort, .
-
•
Group (ii) - competing cohort injected at t=48 ().
-
•
Group (iii) - competing cohort injected at t=0 ().
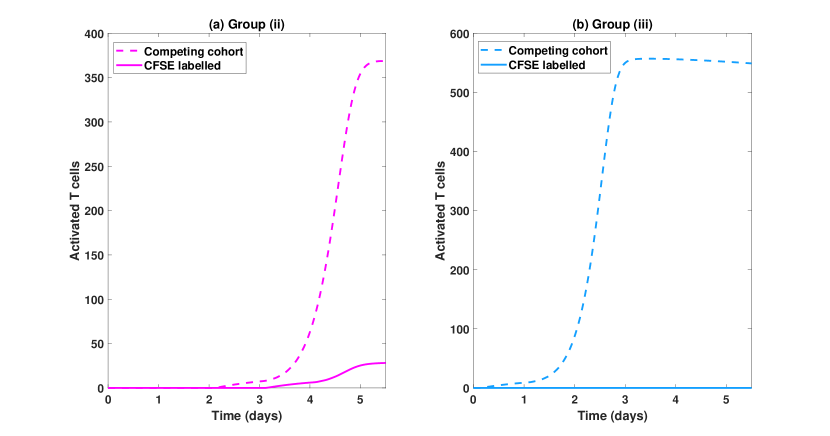
Our results indicate a significant drop in division profiles for the labelled cells as the delay in transfer of CFSE cells is increased from no delay (no competing cohort) in group (i), to a 1-day delay (competing cohort injected 1 day earlier) in group (ii) and finally a 3-day delay (competing cohort injected 3 days earlier) in group (iii), Figure 10a. Figure 10b shows that antigen downregulation by T cells is very rapid in group (iii) due to the the growing competing cohort injected at t=0. The effect of rapid downregulation of antigen on the labelled T cell populations can be seen in Figure 10(c-d), where hardly any naive T cells get activated in group (iii). Our model calculates the number of cells recruited into division as , and for groups (i), (ii), and (iii) respectively which is inline with experimental outcome in Figure 14b. Comparing the total number of activated cells in each cohort, Figure 11 indicates that increasing the delay in arrival of cells to an ongoing response significantly reduces the contribution of the CFSE-labelled cells.
Overall, the simulations from our model are a close approximation to experimental results showing that limitations in antigen supply, along with a reduction in T cell proliferation rate can explain the controlled behaviour of CD4+ T cell dynamics during an immune response. Specifically the model recreates the findings where clonal expansion of T cells reduce as precursor numbers increase as in Experiment 1 and T cell recruitment in to division and subsequent cell burst size drastically reduce as T cells are delayed into an ongoing immune response as in Experiments 2 and 3. We will now present a general discussion as to the significance of the results.
5 Discussion
The experiments by Smith et al. and Spencer et al. demonstrated that the immune system exerts a tight control on CD4+ T cell clonal expansion by restricting recruitment into division and the number of divisions experienced per parent cell. To explain this behaviour, we used a mathematical model describing a negative feedback between antigen stimulation of T cells and T cell downregulation of antigen. In this way, we simulated an environment where T cells compete for limited antigen. Fitting our model to Experiment 1 demonstrated that antigen availability can explain the reduction in T cell expansion as initial precursors were increased by factors of ten. This suggests that the clonal expansion during an infection may be determined and limited by the magnitude of infection and antigen downregulation. Interestingly, we found that when antigen is available for longer, as with the smallest precursor population, a reduction in T cell proliferation rate may be responsible in further controlling the clonal expansion. This extra control would insure that cell division is limited at high antigen doses. Limitations in clonal expansion when antigen is increased has been observed experimentally. An in vitro study by Jelley-Gibbs et al. (Jelley-Gibbs et al, 2005) showed that when antigen presentation is limited to 2 days, maximum CD4+ effector expansion is achieved while repeated antigen stimulation impaired T cell generation. Quiel et al. (Quiel et al, 2011) measured the factor of expansion (ratio of the number of antigen-specific T cells at day 7 to the number of cells before immunisation) in two different sizes of antigen-specific precursors, 300 and 30 000 cells, when the cells were exposed to two levels of antigen, 100 g and 1 mg. They found that increasing antigen dose resulted in a modest increase in the factor of expansion in each population size ((Quiel et al, 2011), Figure 5A). The reduction in the proliferation rate as T cells continue to be stimulated by antigen could also arise from T cell anergy (Schwartz, 2003). This is a process in which T cells become unresponsive to the proliferative effect of IL-2 following antigen exposure. Yamamoto et al. demonstrated in vivo, that Th1, CD4+ T cells become anergic depending on intensity of antigen stimulation and duration of exposure (Yamamoto et al, 2007). Therefore, if a proportion of T cells become anergic after a period of time, then the overall proliferation rate would reduce.
Our model estimated a drop in T cell recruitment into division for each factor 10 increase in precursors, so that when a competing cohort of cells was released at the same time as the labelled cells, effectively doubling the initial T cell dose (Experiment 2, group (ii)), there was no significant change in
recruitment into division or burst size per cell. This can be seen by comparing the division profiles for control group (i) with no competing cohort against group (ii) as in Figure 8a. Our result captures the experimental outcome showing that there is no significant alteration in recruitment of the CFSE-labelled cells when there is no delay in response or if the response is in the same order of magnitude. Tracking activation profiles, we found that the two populations contributed equally to the response.
Increasing the delay between the competing cohort and the labelled cells reduced both recruitment and burst size in line with experimental results. The activation profiles from these simulations revealed that cells arriving late to an ongoing response were excluded from recruitment and division, and this exclusion increased for increasing delay (from 24 hours to 72 hours). Our model attributed this drastic change to antigen downregulation by cells arriving earlier to the response. Mayerova et al. obtained similar results, showing a decrease in expansion of a delayed cohort for CD8+ T cells, (Mayerova et al, 2006). In their case, the authors attributed the reduction in clonal expansion to phenotypic changes in the APCs (Langerhans cells), which were proposed to compromise the stimulation of the naïve T cells; however, additional experiments by Spencer et al, showed that a competing cohort responding to the same APCs but an unrelated antigen specificity had no effect on the activation of labelled cells, regardless of delay (Spencer et al, 2020). This allowed the authors to exclude changes in APC phenotype and other antigen non-specific effects (such as T cell crowding around APCs) as causes of reduction in recruitment and division.
Studies have also suggested that cytokine signalling molecules such as interleukins can control the response of T cells to antigen presentation. One such cytokine is interleukin 2 (IL-2), a cytokine linked to T cell growth, differentiation and suppression of the immune response (Bachmann and Oxenius, 2007). Experiments by Villarino et al. suggested a negative feedback loop for the production of IL-2 by CD4+ T cells (Villarino et al, 2007). They demonstrated in vivo, that when CD4+ T cells are introduced into an environment rich in IL-2, they suppress their production of this growth signal during an immune response. This effect was deemed to be transient and requires continual availability of IL-2. In another study by Blattman et al. the introduction of IL-2 during the expansion phase reduced peak numbers of CD4+ T cells by , interestingly IL-2 introduction did not affect CD8+ T-cell response (Blattman et al, 2003). In contrast, IL-2 introduction during the contraction and memory phases resulted in increased proliferation and survival of T cells. IL-12 and interferon-gamma (IFN-) have also been shown to impact T cell response. Eriksson et al. showed that CD4+ cell proliferation in IL-12 deficient mice was poor (Eriksson et al, 2001b). On the other hand, mice that were deficient in IFN- developed autoimmune disease. The role of IFN- as a cytokine responsible for the downregulation of T-cell response has been reported in other studies (Badovinac et al, 2000; Hosking et al, 2016; Eriksson et al, 2001a; Bachmann and Kopf, 2002). Regulatory T cells (Tregs) have also been implicated in the suppression of T-cell response. Dowling et al. demonstrated that Tregs can mediate the magnitude of effector T cells by changing the number of overall T cell divisions (Dowling et al, 2018). In an opinion article by Gasteiger and Kastenmuller, it was proposed that the availability of IL-2 is mediated by Tregs, restricting the CD4+ t cell response (Gasteiger and Kastenmuller, 2012).
The examples above demonstrate that the complexity of the interactions during a T-cell mediated immune response has led to a diverse range of experimental results. A variety of mathematical models also explain these dynamics by investigating the affects of cytokines and Tregs. As an example, Ganusov et al. produced a mathematical model that describes the in vitro dynamics of CD4+ T cells with respect to IL-2 concentration (Ganusov et al, 2007). The model suggests that at low IL-2 concentrations fewer cells are recruited into division and the rate of cell death also increases. Overall, the authors summarised that IL-2 concentration affects cell death rate and not cell division rate. An overview of combined mathematical models and experiments can be found in (Morel et al, 2014). We leave this discussion by considering that it is likely that T cells exhibit many traits during an immune response and in modelling the dynamics we can attempt to find the extent of dependency of the clonal expansion on these characteristics. In our model, the clonal expansion of T cells can successfully be described by antigen downregulation, a conclusion that is supported by the experimental findings that competing responses to a different antigen have no effect on clonal expansion (Spencer et al, 2020); however, the addition of cytokines and Tregs into the model could assist in understanding the impact of signalling in this scenario and is an opportunity for future investigation.
6 Conclusion
Our results indicate that the dynamics of T cell expansion may heavily depend on antigen availability. From this perspective, T cells require continual communication with APCs during the expansion phase leading to an antigen competitive environment. Subsequently, competition for antigen leads to an appropriate immune response corresponding to the magnitude of infection. Further to this, our results also suggest that an extra layer of control is established by an intrinsic reduction in T cell proliferation rate, especially for a large antigen dose or prolonged antigen exposure. Testing our model against experimental data where the extent of T cell expansion is measured in relation to variations in antigen dose and duration of infection will greatly assist in calibrating this model to gain a deeper understanding into the mechanisms that drive a robust and tailored response to pathogens.
Acknowledgements.
The authors gratefully acknowledge support for this work through Australian Government Research Training Program Scholarship (PP) and the Australian Research Council Discovery Project DP180101512 (PSK).References
- Allan et al (2006) Allan RS, Waithman J, Bedoui S, Jones CM, Villadangos JA, Zhan Y, Lew AM, Shortman K, Heath WR, Carbone FR (2006) Migratory dendritic cells transfer antigen to a lymph node-resident dendritic cell population for efficient ctl priming. Immunity 25(1):153–162
- Bachmann and Kopf (2002) Bachmann MF, Kopf M (2002) Balancing protective immunity and immunopathology. Curr Opin Immunol 14(4):413–419
- Bachmann and Oxenius (2007) Bachmann MF, Oxenius A (2007) Interleukin 2: from immunostimulation to immunoregulation and back again. EMBO Rep 8(12):1142–1148
- Badovinac et al (2000) Badovinac VP, Tvinnereim AR, Harty JT (2000) Regulation of antigen-specific cd8+ t cell homeostasis by perforin and interferon-. Science 290(5495):1354–1357
- Beverley and Maini (2000) Beverley PC, Maini MK (2000) Differences in the regulation of cd4 and cd8 t–cell clones during immune responses. Philos Trans R Soc, B 355(1395):401–406
- Blattman et al (2003) Blattman JN, Grayson JM, Wherry EJ, Kaech SM, Smith KA, Ahmed R (2003) Therapeutic use of il-2 to enhance antiviral t-cell responses in vivo. Nat Med 9(5):540–547
- Borghans et al (1999) Borghans JA, Taams LS, Wauben MH, De Boer RJ (1999) Competition for antigenic sites during t cell proliferation: a mathematical interpretation of in vitro data. Proc Natl Acad Sci U S A 96(19):10,782–10,787
- den Braber et al (2012) den Braber I, Mugwagwa T, Vrisekoop N, Westera L, Mögling R, de Boer AB, Willems N, Schrijver EH, Spierenburg G, Gaiser K, et al (2012) Maintenance of peripheral naive t cells is sustained by thymus output in mice but not humans. Immunity 36(2):288–297
- De Boer and Perelson (2013) De Boer RJ, Perelson AS (2013) Antigen-stimulated cd4 t cell expansion can be limited by their grazing of peptide–mhc complexes. J Immunol 190(11):5454–5458
- Dhainaut and Moser (2014) Dhainaut M, Moser M (2014) Regulation of immune reactivity by intercellular transfer. front immunol 5: 112
- Diao et al (2006) Diao J, Winter E, Cantin C, Chen W, Xu L, Kelvin D, Phillips J, Cattral MS (2006) In situ replication of immediate dendritic cell (dc) precursors contributes to conventional dc homeostasis in lymphoid tissue. J Immunol 176(12):7196–7206
- Dowling et al (2018) Dowling MR, Kan A, Heinzel S, Marchingo JM, Hodgkin PD, Hawkins ED (2018) Regulatory t cells suppress effector t cell proliferation by limiting division destiny. Front Immunol 9:2461
- Eriksson et al (2001a) Eriksson U, Kurrer M, Bingisser R, Eugster H, Saremaslani P, Follath F, Marsch S, Widmer U (2001a) Lethal autoimmune myocarditis in interferon- receptor–deficient mice: Enhanced disease severity by impaired inducible nitric oxide synthase induction. Circulation 103(1):18–21
- Eriksson et al (2001b) Eriksson U, Kurrer MO, Sebald W, Brombacher F, Kopf M (2001b) Dual role of the il-12/ifn- axis in the development of autoimmune myocarditis: induction by il-12 and protection by ifn-. J Immunol 167(9):5464–5469
- Furuta et al (2012) Furuta K, Ishido S, Roche PA (2012) Encounter with antigen-specific primed cd4 t cells promotes mhc class ii degradation in dendritic cells. Proc Natl Acad Sci U S A 109(47):19,380–19,385
- Ganusov et al (2007) Ganusov VV, Milutinović D, De Boer RJ (2007) Il-2 regulates expansion of cd4+ t cell populations by affecting cell death: insights from modeling cfse data. J Immunol 179(2):950–957
- Gasteiger and Kastenmuller (2012) Gasteiger G, Kastenmuller W (2012) Foxp3+ regulatory t-cells and il-2: the moirai of t-cell fates? Front Immunol 3:179
- Homann et al (2001) Homann D, Teyton L, Oldstone MB (2001) Differential regulation of antiviral t-cell immunity results in stable cd8+ but declining cd4+ t-cell memory. Nat Med (N Y, NY, U S) 7(8):913
- Hosking et al (2016) Hosking MP, Flynn CT, Whitton JL (2016) Tcr independent suppression of cd8+ t cell cytokine production mediated by ifn in vivo. Virology 498:69–81
- Jelley-Gibbs et al (2005) Jelley-Gibbs DM, Dibble JP, Filipson S, Haynes L, Kemp RA, Swain SL (2005) Repeated stimulation of cd4 effector t cells can limit their protective function. J Exp Med 201(7):1101–1112
- Kamath et al (2002) Kamath AT, Henri S, Battye F, Tough DF, Shortman K (2002) Developmental kinetics and lifespan of dendritic cells in mouse lymphoid organs. Blood 100(5):1734–1741
- Kedl et al (2000) Kedl RM, Rees WA, Hildeman DA, Schaefer B, Mitchell T, Kappler J, Marrack P (2000) T cells compete for access to antigen-bearing antigen-presenting cells. J Exp Med 192(8):1105–1114
- Lambrecht et al (2000) Lambrecht BN, Pauwels RA, Groth BFdS (2000) Induction of rapid t cell activation, division, and recirculation by intratracheal injection of dendritic cells in a tcr transgenic model. J Immunol 164(6):2937–2946
- Liou et al (2012) Liou HR, Myers JT, Barkauskas DS, Huang AY (2012) Intravital imaging of the mouse popliteal lymph node. J Visualized Exp (60):e3720
- Mayer et al (2019) Mayer A, Zhang Y, Perelson AS, Wingreen NS (2019) Regulation of t cell expansion by antigen presentation dynamics. Proc Natl Acad Sci U S A 116(13):5914–5919
- Mayerova et al (2006) Mayerova D, Wang L, Bursch LS, Hogquist KA (2006) Conditioning of langerhans cells induced by a primary cd8 t cell response to self-antigen in vivo. J Immunol 176(8):4658–4665
- Morel et al (2014) Morel PA, Faeder JR, Hawse WF, Miskov-Zivanov N (2014) Modeling the t cell immune response: a fascinating challenge. J Pharmacokinet Pharmacodyn 41(5):401–413
- Obst (2015) Obst R (2015) The timing of t cell priming and cycling. Front Immunol 6:563
- Pappalardo et al (2016) Pappalardo F, Fichera E, Paparone N, Lombardo A, Pennisi M, Russo G, Leotta M, Pappalardo F, Pedretti A, De Fiore F, et al (2016) A computational model to predict the immune system activation by citrus-derived vaccine adjuvants. Bioinformatics 32(17):2672–2680
- Pennisi et al (2019) Pennisi M, Russo G, Sgroi G, Bonaccorso A, Palumbo GAP, Fichera E, Mitra DK, Walker KB, Cardona PJ, Amat M, et al (2019) Predicting the artificial immunity induced by ruti® vaccine against tuberculosis using universal immune system simulator (uiss). BMC bioinform 20(6):1–10
- Quiel et al (2011) Quiel J, Caucheteux S, Laurence A, Singh NJ, Bocharov G, Ben-Sasson SZ, Grossman Z, Paul WE (2011) Antigen-stimulated cd4 t-cell expansion is inversely and log-linearly related to precursor number. Proc Natl Acad Sci U S A 108(8):3312–3317
- Rabenstein et al (2014) Rabenstein H, Behrendt AC, Ellwart JW, Naumann R, Horsch M, Beckers J, Obst R (2014) Differential kinetics of antigen dependency of cd4+ and cd8+ t cells. J Immunol 192(8):3507–3517
- Schwartz (2003) Schwartz RH (2003) T cell anergy. Annu Rev Immunol 21(1):305–334
- Smith and Fazekas de St Groth (2020) Smith AL, Fazekas de St Groth B (2020) T cell competition profoundly reduces the effect of initial precursor frequency on the generation of cd4 t cell memory. bioRxiv DOI 10.1101/2020.09.09.290627, URL https://www.biorxiv.org/content/early/2020/09/10/2020.09.09.290627, https://www.biorxiv.org/content/early/2020/09/10/2020.09.09.290627.full.pdf
- Spencer et al (2020) Spencer AJ, Smith AL, de St Groth BF (2020) Antigen-specific competitive inhibition of cd4+ t cell recruitment into the primary immune response. bioRxiv
- Tomura et al (2014) Tomura M, Hata A, Matsuoka S, Shand FH, Nakanishi Y, Ikebuchi R, Ueha S, Tsutsui H, Inaba K, Matsushima K, et al (2014) Tracking and quantification of dendritic cell migration and antigen trafficking between the skin and lymph nodes. Sci Rep 4:6030
- Van de Velde and Murray (2016) Van de Velde LA, Murray PJ (2016) Proliferating helper t cells require rictor/mtorc2 complex to integrate signals from limiting environmental amino acids. J Biol Chem 291(50):25,815–25,822
- Villarino et al (2007) Villarino AV, Tato CM, Stumhofer JS, Yao Z, Cui YK, Hennighausen L, O’Shea JJ, Hunter CA (2007) Helper t cell il-2 production is limited by negative feedback and stat-dependent cytokine signals. J Exp Med 204(1):65–71
- Yamamoto et al (2007) Yamamoto T, Hattori M, Yoshida T (2007) Induction of t-cell activation or anergy determined by the combination of intensity and duration of t-cell receptor stimulation, and sequential induction in an individual cell. Immunology 121(3):383–391
- Yarke et al (2008) Yarke CA, Dalheimer SL, Zhang N, Catron DM, Jenkins MK, Mueller DL (2008) Proliferating cd4+ t cells undergo immediate growth arrest upon cessation of tcr signaling in vivo. J Immunol 180(1):156–162