A Cough-based deep learning framework for detecting COVID-19
Abstract
This paper presents a deep learning framework for detecting COVID-19 positive subjects from their cough sounds.
In particular, the proposed approach comprises two main steps. In the first step, we generate a feature representing the cough sound by combining an embedding extracted from a pre-trained model and handcrafted features extracted from draw audio recording, referred to as the front-end feature extraction. Then, the combined features are fed into different back-end classification models for detecting COVID-19 positive subjects in the second step.
Our experiments on the Track-2 dataset of the Second 2021 DiCOVA Challenge achieved the second top ranking with an AUC score of 81.21 and the top F1 score of 53.21 on a Blind Test set, improving the challenge baseline by 8.43% and 23.4% respectively and showing deployability, robustness and competitiveness with the state-of-the-art systems.
Clinical relevance— COVID-19, deep learning, feature extraction, embedding, handcrafted feature.
I INTRODUCTION
The COVID-19 pandemic has deeply impacted the global health systems with a rising number of 231 million cases and a high death toll of 4.7 million [1]. It is now spanning across 200 countries quickly, and the number of COVID-19 infections per day is consistently reported at an alarming rate without a sign of going down. Therefore, effective solutions for COVID-19 testing on a massive scale is vital for control and mitigate the enormous impacts of the current epidemic. Indeed, if COVID-19 positive subjects can be early detected, it is very useful for self-observation, isolation, and effective treatment methods.
The use of rapid antigen test (ART) and polymerase chain reaction (PCR) tests in popularity has been proven as effective, however, costly and time consuming. With advancement of artificial intelligence, it is promising to alleviate the burden of health care systems through predictable provision at hand for the population. As a result, DiCOVA Challenges are designed to find scientific and engineering insights to the question - Can COVID-19 be detected from the cough, breathing, or speech sound signals of an individual? In particular, while the First 2021 DiCOVA Challenge [2] provides a dataset of cough sound only, the Second 2021 DiCOVA Challenge [3] provides different sound signals of cough, speech, and breathing. The audio recordings are gathered from both COVID-19 positive and COVID-19 negative individuals. Given the cough, speech, and breath recordings, research community can propose systems for COVID-19 detection, which is potentially deployable on edge devices.
There have been multiple studies [4, 5] gathering insights on the possibility of acoustics based COVID-19 diagnosis. Focusing on the cough sound, recent researchers show that it potential to detect COVID-19 through evaluating coughing. For an example, a machine learning-based framework proposed in [6] utilized handcrafted features and Support Vector Machine (SVM) model, achieved the AUC score of 85.02 on the First DiCOVA dataset [2]. Further exploration on this dataset proposed a deep learning framework in [7], which use the ConvNet model incorporated with Data Augmentation, achieved the best AUC score of 87.07 and presented the top-1 position in the First DiCOVA Challenge. Focusing on feature extraction, Madhu et al. [8] combined the Mel-frequency cepstral coefficients (MFCC) with the delta features (i.e. The delta features are extracted from a complicated framework using Long Short-Term Memory (LSTM), Gabor filter bank, and the Teager energy operator (TEO) in the order). By using the combined features and the back-end LightGBM model, the authors can achieve the AUC score of 76.31 with the First DiCOVA dataset [2]. Similarly, Vincent et al. [9] conducted extensive experiments to evaluate the role of the feature extraction. In particular, they proposed to use three types of features: (1) Handcrafted features extracted by openSMILE toolkit [10], (2) the deep features extracted from different pre-trained VGGish networks which are trained with AudioSet [11], and (3) the deep features extracted from different standard pre-trained models (ResNet50, DenseNet121, MobileNetV1, etc.) trained with Imagenet dataset. They then obtained the best AUC score of 72.8 on the First 2021 DiCOVA dataset [2] by using the deep features extracted from the pre-trained VGG16 (i.e. The pre-trained VGG16 was trained with AudioSet) and the back-end LSTM-based classification. Recently, a benchmark dataset of cough sound for detecting COVID-19 [12, 13], which was recorded on mobile phone, has been published.
In this paper, we also aim to explore cough sounds, then propose a framework for detecting COVID-19. We mainly contribute: (1) discriminative features by combining handcrafted feature and embedding based feature for COVID detection by analysing cough sound, and (2) a robust framework which can be further developed on edge devices for an application of COVID-19 testing. Our experiments are conducted on the Track-2 dataset in the Second 2021 DiCOVA Challenge (i.e. only contains cough sounds).
II The Track-2 dataset of cough sounds in The Second 2021 DiCOVA Challenge
The Second 2021 DiCOVA Challenge uses a subset of the Coswara dataset [3] collected between April 2020 and July 2021 from the age group of 15 to 90. The challenge provides a dataset of different sound signals: cough, speech, and breathing gathered from both COVID-19 positive and non-COVID-19 individuals. Given cough, speech, and breath sounds, the Second 2021 DiCOVA Challenge proposes four tracks that aim to detect COVID-19 positive subjects by exploring only breathing (Track-1), only cough (Track-2), only speech (Track-3), or all sound signals (Track-4).
As we aim to focus on cough sounds, which is also the First 2021 DICOVA Challenge [2], only Track-2 dataset in the Second 2021 DiCOVA is explored in this paper. The Track-2 dataset provides a Development set of 965 audio recordings and a Blind Test set of 471 audio recordings. All audio recordings of cough sounds are not less than 500 milliseconds and recorded with different sample rates. While Development set is used for training, and then obtaining the best model, Blind Test set is used for evaluating and comparing the systems’ performance submitted. In Development set, there are a total of 793 negative labels and 172 positive labels, which shows a significantly imbalanced dataset [14].
The ‘Area under the ROC curve’ (AUC) is used as the primary evaluation metric in the Second 2021 DiCOVA Challenge. Additionally, the Sensitivity (Sens.) and the Specificity (Spec.) are used as the secondary evaluation metrics (Note that Spec. is required to be equal or greater than 95%). The Leaderboard provides the evaluation of the submitted systems on Blind Test set as well as the average performance on five-fold cross validation from Development set (Avg. AUC) [3].
III Deep Learning Framework proposed
III-A High-level architecture of deep learning framework
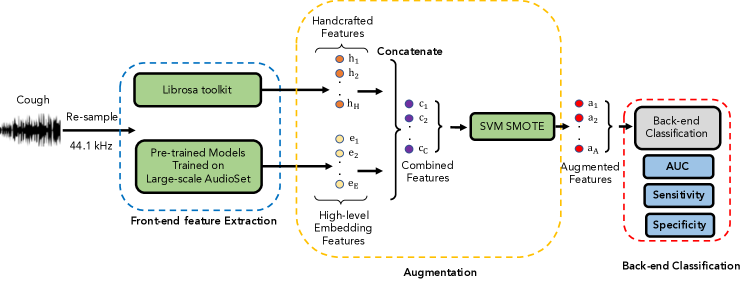
The overall framework architecture is described as Fig. 1. As the audio recordings show different sample rates, they are firstly re-sampled to 44.1 kHz using a mono channel. Then, the re-sampled recordings are inputted into the front-end feature extraction, where embedding-based features and handcrafted features are extracted and concatenated to obtain the combined features. To deal with the issue of imbalanced dataset mentioned in Section II, SVM-based SMOTE method, a variant of SMOTE algorithm which uses SVM algorithm to detect neighbor samples [15], is applied on the combined features to make sure the equal number of positive and negative samples. Finally, the combined features after augmentation are fed into different back-end classification models for detecting COVID-19 positive cases.
III-B The front-end feature extraction
In this step, we propose a method to create combined features by combining handcrafted features and embedding-based features extracted from pre-trained models for COVID detection. Regarding handcrafted features, 64 Mel-frequency cepstral coefficients (MFCCs), 12 Chromatic (Chroma), 128 Mel Spectrogram (Mel), 1 Zero-Crossing rate, 1 Gender, and 1 Duration are utilized in this paper. These handcrafted features are used as they are popularly adopted in speech processing and show robustness in the First 2021 DiCOVA Challenge [8, 9, 6]. To extract these handcrafted features, Librosa Toolkits [16], a powerful library of audio signal processing, is used in this paper with the window size, FFT number, hop size set to 2048, 2048, 512.
As regards the embedding features, we evaluate different embedding features which are extracted from a wide range of pre-trained models: YAMNet [17], Wave2Vec [18], TRILL [19], and the COMPARE 2016 feature sets [20] using OpenSMILE [10] toolkit. As using these pre-trained models shows effective for a wide range of down-stream classification tasks (i.e. The pre-trained TRILL model with AudioSet [11] proves robust for various classification tasks on non-semantic speech signal such as speaker identity, language, and emotional state in [19]), these embeddings are expected to work well with the Track-2 dataset of cough sounds in the Second 2021 DiCOVA Challenge. By using the pre-trained models, when we feed a cough recording into the pre-trained models, 2-dimensional embeddings are extracted. We then compute mean and standard deviation across the time dimension, concatenating mean and standard deviation to obtain one 1-dimensional embedding which represents for one input audio sample. The embedding-based feature is then concatenated with the handcrafted feature mentioned above to create a combined feature. Finally, the combined feature is scaled into a range of [0:1] before conducting data augmentation and fed into the back-end classification models.
III-C The back-end classification models
In this paper, we evaluate different back-end classification models: Light Gradient Boosting Machine (LightGBM), Random Forrest (RF), Support Vector Machine (SVM), Multi-layer Perceptron (MLP), and Extra Tree Classifier (ETC). To obtain the hyper-parameters used for optimizing these back-end classifiers, we apply the Grid Search algorithm from the Optuna framework [21]. Settings of these back-end classification models are described in Table I and all these models are implemented by using Scikit-Learn toolkit [22].
| Models | Setting Parameters |
|---|---|
| Support Vector Machine (SVM) | C=1.0 |
| Kernel=‘RBF’ | |
| gamma=‘scale’ | |
| Random Forest (RF) | Max Depth of Tree = 20, |
| Number of Trees = 100 | |
| Two hidden layer (4096 nodes), | |
| Multilayer Perceptron (MLP) | Adam optimization, |
| Max iter = 200 | |
| Learning rate = 0.001, | |
| Entropy Loss | |
| ExtraTreesClassifier (ETC) | Max Depth of Tree = 20 |
| learning rate = 0.03 | |
| LightGBM [23] | objective = ‘binary’ |
| metric = ‘auc’ | |
| subsample = 0.68 | |
| colsample_bytree = 0.28 | |
| early_stopping_rounds = 100 | |
| num_iterations = 10000 | |
| subsample_freq = 1 |
To obtain results, each classification model is run with 10 seeds numbered from 0 to 9. The output of the cross-validation session will calculated by using an average of 10 seeds. The GTX 1080 Titan GPU environment is used for running classification experiments.
IV Experimental results and discussion
IV-A Performance comparison across different features
To evaluate different features extracted, we keep the back-end classification model of LightGBM unchanged while replacing different input features: Handcrafted feature, YAMNet based embedding, COMPARE 2016 based embedding, Wave2Vec based embedding, TRILL based embedding, handcrafted & YAMNet, handcrafted & COMPARE 2016, handcrafted & Wave2Vec, and handcrafted & TRILL features. As the results are shown in Table II, it can be seen that TRILL-based embedding outperforms the other single features, reporting an Avg. AUC score of 73.77 and 80.57 on Development set and Blind Test set, respectively.
When we combine the handcrafted feature with different embedding-based features of YAMNet, COMPARE 2016, and TRILL, it is effective to improve the performance, reporting Avg. AUC scores of 77.33, 77.19, and 77.18, respectively compared with 72.62 of using handcrafted feature only. The best performance is obtained from the combination of the handcrafted feature and TRILL-based embedding feature, achieving the AUC, Sens., and Spec. scores of 81.21, 48.33, and 95.13 respectively on Blind Test set.
IV-B Performance comparison across different classification models
As we obtained the best handcrafted & TRILL-based embedding feature from the experiments above, we now evaluate how back-end classification models affect the performance. To this end, we keep the handcrafted & TRILL-based embedding feature unchanged while replacing LightGBM by different back-end classification models of Support Vector Machine (SVM), Random Forest (RF), Extra Trees Classifier (ETC), and Multi-layer perceptron (MLP). As the results are shown in Table III, the LightGBM model still achieves the best scores. Meanwhile, the other models show competitive results, reporting Avg. AUC/Blind Test AUC scores of 75.54/76.27, 74.04/78.72, 72.50/76.34, and 74.87/77.51 for SVM, RF, MLP, and ETC respectively.
| Extracted Features | AUC | Sens. | Spec. | Avg. AUC |
|---|---|---|---|---|
| (Blind Test) | (Blind Test) | (Blind Test) | (Development) | |
| Handcraft | 76.36 | 36.66 | 95.13 | 72.62 |
| YAMNet [17] | 67.24 | 21.51 | 95.13 | 67.31 |
| COMPARE 2016 [20] | 63.18 | 15.00 | 95.13 | 71.00 |
| Wave2Vec [18] | 58.86 | 06.66 | 95.13 | 58.75 |
| TRILL [19] | 80.57 | 43.33 | 95.13 | 73.77 |
| Handcraft + YAMNet | 77.27 | 41.67 | 95.13 | 77.33 |
| Handcraft + COMPARE 2016 | 69.14 | 25.00 | 95.13 | 77.19 |
| Handcraft + Wave2Vec | 71.00 | 25.00 | 95.13 | 71.47 |
| Handcraft + TRILL | 81.21 | 48.33 | 95.13 | 77.18 |
| Back-end | AUC | Sens. | Spec. | Avg. AUC |
|---|---|---|---|---|
| Classification | (Blind Test) | (Blind Test) | (Blind Test) | (Development) |
| SVM | 76.27 | 36.66 | 95.13 | 75.54 |
| RandomForest | 78.72 | 36.66 | 95.13 | 74.04 |
| Multi-layer Perceptron | 76.34 | 31.66 | 95.13 | 72.50 |
| ExtraTreesClassifier | 77.51 | 38.33 | 95.13 | 74.87 |
| LightGBM | 81.21 | 48.33 | 95.13 | 77.18 |
To make sure the best score is from the combination of the handcrafted feature and TRILL-based embedding feature for the front-end feature extraction and LightGBM for back-end classification, we conducted 10 times of running the experiments on five folds of Development set. We achieve an average confidence interval (CI) of (0.76610763001, 0.77752917589), which matches the AUC score of 77.18 from Table III.
IV-C Performance comparison across the top-10 systems submitted for the Track-2 dataset of the Second 2021 DiCOVA Challenge
To compare the state-of-the-art systems, we joined in Track-2 of the Second 2021 DiCOVA Challenge, submitted our proposed system, and compare with the other submissions. The Table IV presents the performance comparison across the top-10 systems submitted for the Track-2 of the Second 2021 DiCOVA Challenge. As shown in Table IV, our best results from handcrafted & TRILL-based embedding features and LightGBM model achieved the top-2 AUC score of 81.21, only after the top-1 AUC score of 81.97. Nevertheless, we achieved a sensitivity score of 48.33, precision of 59.18 and F1 score of 53.21, which has significant improvements of 31.8%, 12.99% and 23.4% respectively from both baseline and the top-1 submission. Despite the sense of high AUC, it is important to to evaluate the suitably calibrated probabilities due to the nature of COVID-19 screening and imbalanced dataset. These results demonstrate that our proposed system is deployable, robust, competitive, and has the potential to be further applied on edge devices for detecting COVID-19.
| Systems | AUC | Sens. | Spec. | Prec. | F1 Score |
|---|---|---|---|---|---|
| 1st system | 81.97 | 36.67 | 95.13 | 52.38 | 43.14 |
| 2nd (Our system) | 81.21 | 48.33 | 95.13 | 59.18 | 53.21 |
| 3rd system | 80.12 | 35.00 | 95.13 | 51.22 | 41.58 |
| 4th system | 79.06 | 35.00 | 95.13 | 51.22 | 41.58 |
| 5th system | 77.85 | 46.67 | 95.13 | 58.33 | 51.85 |
| 6th system | 77.60 | 33.33 | 95.13 | 50.00 | 40.00 |
| 7th system | 76.98 | 40.00 | 95.13 | 54.55 | 46.15 |
| 8th system | 76.36 | 30.00 | 95.13 | 47.37 | 36.73 |
| 9th system | 75.95 | 40.00 | 95.13 | 54.55 | 46.15 |
| 10th system | 75.71 | 35.00 | 95.13 | 51.22 | 41.58 |
| Challenge baseline | 74.89 | 36.67 | 95.13 | 52.38 | 43.14 |
V Conclusion and Future Work
This paper has presented a robust deep learning framework for detecting COVID-19 positive subjects by exploring cough sound inputs. By conducting extensive experiments on the Track-2 of the Second 2021 DiCOVA Challenge, our proposed framework with a discriminative combined feature (handcrafted feature & embedding based feature from pre-trained TRILL model) and LightGBM model achieved the high performance in a stable manner, showing a potential for a real-life application.
Our further research are to deeply analyse roles of input features and focus on different sound representations such as Chroma Feature, Spectral Contrast, Tonnetz, etc [24], as well as to explore breathing, speech sounds provided by the Second 2021 DiCOVA Challenge.
References
- [1] “WHO Coronavirus Disease (COVID-19) Dashboard,” https://covid19.who.int/, 2020, [Online; accessed 28-09-2021].
- [2] A. Muguli and et al., “Dicova challenge: Dataset, task, and baseline system for covid-19 diagnosis using acoustics,” in Proc. INTERSPEECH, 2021, pp. 901–905.
- [3] N. K. Sharma, S. R. Chetupalli, D. Bhattacharya, D. Dutta, P. Mote, and S. Ganapathy, “The second dicova challenge: Dataset, task, and baseline system for covid-19 diagnosis using acoustics,” arXiv:2110.01177, 2021.
- [4] J. Han, C. Brown, J. Chauhan, A. Grammenos, A. Hasthanasombat, D. Spathis, T. Xia, P. Cicuta, and C. Mascolo, “Exploring automatic covid-19 diagnosis via voice and symptoms from crowdsourced data,” in Proc. ICASSP, 2021, pp. 8328–8332.
- [5] T. Xia, J. Han, L. Qendro, T. Dang, and C. Mascolo, “Uncertainty-Aware COVID-19 Detection from Imbalanced Sound Data,” in Proc. INTERSPEECH, 2021, pp. 2951–2955.
- [6] I. Södergren, M. P. Nodeh, P. C. Chhipa, K. Nikolaidou, and G. Kovács, “Detecting covid-19 from audio recording of coughs using random forests and support vector machines,” in Proc. INTERSPEECH, 2021, pp. 916–920.
- [7] S. K. Mahanta, D. Kaushik, S. Jain, H. Van Truong, and K. Guha, “Covid-19 diagnosis from cough acoustics using convnets and data augmentation,” arXiv preprint arXiv:2110.06123, 2021.
- [8] M. R. Kamble, J. A. Gonzalez-Lopez, T. Grau, J. M. Espin, L. Cascioli, Y. Huang, A. Gomez-Alanis, J. Patino, R. Font, A. M. Peinado et al., “Panacea cough sound-based diagnosis of covid-19 for the dicova 2021 challenge,” in Proc. INTERSPEECH, 2021, pp. 906–910.
- [9] V. Karas and B. W. Schuller, “Recognising covid-19 from coughing using ensembles of svms and lstms with handcrafted and deep audio features,” in Proc. INTERSPEECH, 2021, pp. 911–915.
- [10] F. Eyben, M. Wöllmer, and B. Schuller, “opensmile - the munich versatile and fast open-source audio feature extractor,” in Proceedings of the ACM Multimedia International Conference, 2010, pp. 1459–1462.
- [11] J. F. Gemmeke, D. P. W. Ellis, D. Freedman, A. Jansen, W. Lawrence, R. C. Moore, M. Plakal, and M. Ritter, “Audio set: An ontology and human-labeled dataset for audio events,” in Proc. ICASSP, 2017, pp. 776–780.
- [12] J. Chu, “Artificial intelligence model detects asymptomatic covid-19 infections through cellphone-recorded coughs,” MIT News, pp. 4811–4815, 10 2020.
- [13] J. Laguarta, F. Hueto, and B. Subirana, “Covid-19 artificial intelligence diagnosis using only cough recordings,” IEEE Open Journal of Engineering in Medicine and Biology, vol. 1, pp. 275–281, 2020.
- [14] A. Fernández, S. García, M. Galar, R. C. Prati, B. Krawczyk, and F. Herrera, “Learning from imbalanced data sets,” Springer, vol. 10, pp. 275–281, 2018.
- [15] H. M. Nguyen, E. W. Cooper, and K. Kamei, “Borderline over-sampling for imbalanced data classification,” Int. J. Knowl. Eng. Soft Data Paradigm., vol. 3, no. 1, p. 4–21, Apr 2011.
- [16] B. McFee, C. Raffel, D. Liang, D. P. Ellis, M. McVicar, E. Battenberg, and O. Nieto, “librosa: Audio and music signal analysis in python,” in Proceedings of the 14th python in science conference, vol. 8, 2015, pp. 18–25.
- [17] M. Plakal and D. Ellis, “Sound classification with yamnet,” https://github.com/tensorflow/models/tree/master/research/audioset/yamnet, 2020, [Online; accessed 05-Oct-2021].
- [18] A. Baevski, H. Zhou, A. Mohamed, and M. Auli, “wav2vec 2.0: A framework for self-supervised learning of speech representations,” CoRR, vol. abs/2006.11477, 2020.
- [19] J. Shor and et al., “Towards learning a universal non-semantic representation of speech,” ArXiv e-prints, 2020.
- [20] B. Schuller, S. Steidl, A. Batliner, J. Hirschberg, J. K. Burgoon, A. Baird, A. C. Elkins, Y. Zhang, E. Coutinho, and K. Evanini, “The interspeech 2016 computational paralinguistics challenge: Deception, sincerity & native language,” in Proc. INTERSPEECH, 2016, pp. 2001–2005.
- [21] T. Akiba, S. Sano, T. Yanase, T. Ohta, and M. Koyama, “Optuna: A next-generation hyperparameter optimization framework,” in Proceedings of the 25rd ACM SIGKDD International Conference on Knowledge Discovery and Data Mining, 2019.
- [22] F. Pedregosa and et al., “Scikit-learn: Machine learning in Python,” Journal of Machine Learning Research, vol. 12, pp. 2825–2830, 2011.
- [23] G. Ke and et al., “Lightgbm: A highly efficient gradient boosting decision tree,” in Advances in Neural Information Processing Systems, vol. 30, 2017, pp. 3149–3157.
- [24] H. V. Truong, N. C. Hieu, P. N. Giao, and N. X. Phong, “Unsupervised detection of anomalous sound for machine condition monitoring using fully connected u-net,” Journal of ICT Research and Applications, vol. 15, pp. 41–55, 2021.