Is An Image Worth Five Sentences?
A New Look into Semantics for Image-Text Matching
Abstract
The task of image-text matching aims to map representations from different modalities into a common joint visual-textual embedding. However, the most widely used datasets for this task, MSCOCO and Flickr30K, are actually image captioning datasets that offer a very limited set of relationships between images and sentences in their ground-truth annotations. This limited ground truth information forces us to use evaluation metrics based on binary relevance: given a sentence query we consider only one image as relevant. However, many other relevant images or captions may be present in the dataset. In this work, we propose two metrics that evaluate the degree of semantic relevance of retrieved items, independently of their annotated binary relevance. Additionally, we incorporate a novel strategy that uses an image captioning metric, CIDEr, to define a Semantic Adaptive Margin (SAM) to be optimized in a standard triplet loss. By incorporating our formulation to existing models, a large improvement is obtained in scenarios where available training data is limited. We also demonstrate that the performance on the annotated image-caption pairs is maintained while improving on other non-annotated relevant items when employing the full training set. Code with our metrics and adaptive margin formulation will be made public.
1 Introduction
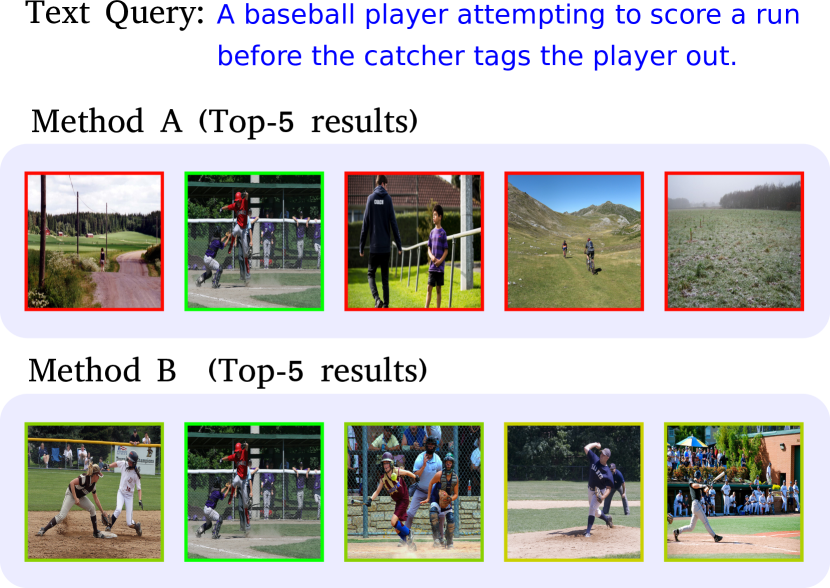
Language provides a medium to explain our perceptual experience while being discretely infinite. “Discrete infinity” is referred as a property in which language is constructed by using few discrete elements albeit giving infinite variety of interpretations [4, 36]. In other words, the language’s discrete infinity property dictates that a potentially infinite number of semantically correct sentences can be used to express the same idea, for example, at describing an image. Framing the previous notion into consideration, we explore the task of Image-Text Matching (ITM) in a cross-modal retrieval scenario. Image-text matching refers to the problem of retrieving a ranked list of relevant representations of the query portrayed by a different modality. Yet, somehow contrary to the notion of discrete infinity, commonly used datasets for the image-text matching (ITM) task lack exhaustive annotations of many-to-many mappings between images and captions. These datasets are designed originally for the image captioning task. Nonetheless, the assumption in ITM is that only 5 sentences correctly describe a single image, labeling it in a binary manner as relevant or irrelevant. Consequently, the lack of many-to-many annotations causes a direct effect on the way the ITM task is evaluated. Sentences that are not relevant according to the ground-truth can describe an image in various degrees of correctness and coverage, thus making the way we evaluate current models on ITM incomplete. We can see an example of such problem in Figure 1. The widely adopted metric employed to evaluate the performance of a model in the ITM task is Recall@K [9, 20, 21, 22, 25, 27]. The Recall@K as it is used in IMT is binary by definition: it returns if at least one of the relevant items according to the ground truth is retrieved within the top-k positions for a given query, otherwise it returns . Due to this binary definition, the metric can not fully assess the degree of accuracy and coverage of the retrieved sentences given an image or the other way around.
Additionally, the to-go strategy from standard approaches for ITM, firstly introduced by [9], relies on hard-negative mining at the moment of constructing samples to be used in a Triplet loss function to be optimized. Current state-of-the art methods rely heavily on such formulation, which requires a carefully handcrafted fixed margin [9, 20, 21, 25, 28, 44]. In this work, we propose solutions to the aforementioned problems by introducing the usage of image captioning metrics such as SPICE [1] and CIDEr [39] as a part of an additional metric formulation into the evaluation of the ITM task. Image captioning metrics have been widely studied and accepted as automatic tools to evaluate the similarity of sentence meanings that closely correlate with human judgement. We utilize such metrics that allows a transition from a traditional recall to a Normalized Cumulative Semantic (NCS) Recall by incorporating the continuum of language into the evaluation. Secondly, considering the continuous nature of language, we re-formulate a triplet loss by introducing a Semantic Adaptive Margin (SAM). We calculate a SAM according to image captioning metrics, which does not rely on a hard-negative mining approach (see Figure 2). Our formulation employed in scenarios with limited data achieves state of the art by a significant retrieval improvement.
Our contributions are as follows: (1) We identify shortcomings from the commonly used Recall in the ITM task. By adopting image captioning metrics we model the many-to-many semantic relationships between images and captions. (2) We propose a novel Semantic Adaptive Margin (SAM) that takes into consideration image captioning metrics to define the similarity among samples. (3) We show that by relying on image captioning metrics and incorporating them into our proposed adaptive margin, a substantial boost is achieved in scenarios with reduced training data. (4) We provide exhaustive experiments on two benchmark datasets, which show that by incorporating our adaptive margin formulation an increase in performance is achieved across a variety of state-of-the-art pipelines.
2 Related Work
Cross-modal retrieval. Our proposed work focuses on the task of cross-modal retrieval, particularly on image-text matching. The task aims to map the images and sentences in such a way that a suitable space for retrieval is learned, where the query and the search data come from distinct modalities.
Initial approaches [9, 10] learned to align the global visual and textual features by applying a learned non-linear transformation to project both modalities into a common space. A similar pipeline is proposed by [30] with the incorporation of an attention mechanism. However, the main drawback of such approaches is that semantic concepts fall short at capturing fine-grained semantic interactions between visual regions and sentences. In the work presented by [2], several visual regions that describe an image in a more detailed manner are used for the task of Visual Question Answering (VQA) and Image Captioning. Initial works [31] incorporated visual regions along with a hierarchical Long Short-Term Memory (LSTM) [13] module. Following up, [20] proposed a stacked cross attention network to model the latent alignments between image regions and words. Additional models have explored the roll of attention mechanisms [24, 35, 44, 45, 47], and Graph Convolutional Neural Networks (GCN) [7, 19, 21, 25]. External modules have been explored to improve retrieval results such as the usage of an iterative recurrent attention module [3] and an external consensus knowledge base [41]. More recently, Transformers [38] have been used to learn intra and inter-modality attention maps for a wide range of visual and language tasks [22, 16, 27, 26], often achieving state of the art. However, these approaches require an additional order of magnitude of training samples, giving rise to a large increase in computational costs. In our work, we focus on task-specific architectures that directly employ the joint embedding space at retrieval time and surpasses by a huge margin current state-of-the-art approaches while using significantly less training samples.
Semantics and Metric Learning. Closely related to our work, [29] highlights the main flaws of current metric learning approaches, in which shows that metrics are not consistent for the task at hand. Also it is shown that the gap between methods is less significant when evaluation is properly done. In this work we refer to the problem of captions that can correctly describe an image that is not annotated in the GT, as semantic gap. Trying to overcome the existing semantic gap in current datasets, [15] employs a network to predict the semantic concepts from an image, however they rely to a binary annotation of relevance. Other works [11, 12] propose a model to learn a visual embedding where the image similarity is correlated with paired text. Similarly [37] proposes a novel within-modality loss that leverages semantic coherency between text and images, which do not necessarily align with visually similar images. In order to address non-paired relevant images and captions, [46] proposes to build denotation graphs to link between these two modalities. Trying to overcome the non-exhaustive annotation in datasets, [5] models the probability of an image belonging to a set of specific contexts. A newly introduced CrissCrossed [32] dataset, is an extension of MS-COCO that collects human judgements on the degree of how an image and a sentence matches. Closely related to our approach, [48] proposes the usage of a ladder loss among samples based on BERT [6] to define similarities. However, calculating BERT for every sample is very expensive computationally, thus they rely on a threshold given by a CBOW [40] to refine the comparison. Another drawback is that the similarity is computed among two captions alone, thus not all information is leveraged.
In our work, we present several metrics that show the limitations of current cross-modal retrieval methods. We also solve previously defined limitations by employing captions to compute a richer semantic similarity while still being a very cheap computationally alternative. Consequently, we incorporate a Semantic Adaptive Margin (SAM) based on automatic image captioning metrics.
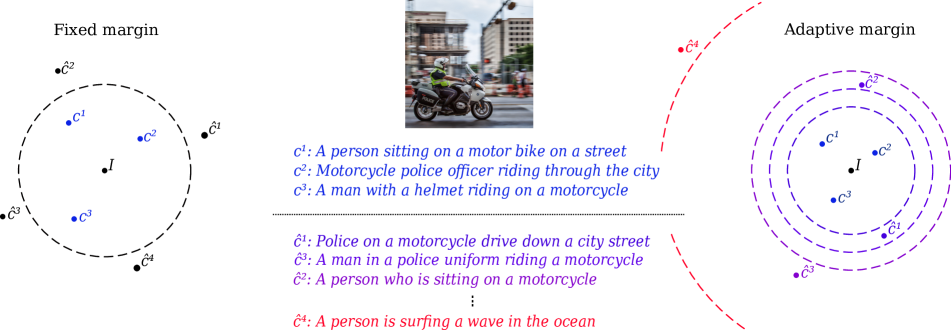
Image Captioning evaluation metrics. Image captioning is the task of transcribing an image into natural language. There are metrics proposed specifically for image captioning models, specifically, CIDEr [39] and SPICE [1]. These recently proposed metrics not only have been widely accepted to evaluate the captioning models, but also they have been shown to correlate better with human judgments across different datasets [1, 39] when compared to machine translation metrics. CIDEr proposes tf-idf [17] to weight the importance of each n-gram. Moreover, CIDEr employs cosine distance between tf-idf values of reference and hypothesis instead of using direct match, which accounts for both precision and recall. SPICE is the first captioning metric that does not follow the classic n-gram matching. The SPICE score is an F-score calculated by direct matching between the semantic scene graphs of reference and hypothesis. Despite their strengths, CIDEr and SPICE still have certain limitations regarding synonyms, word order, style and sentence grammar among others [8, 18]. Aside from the limitations, they remain as good automatic metrics to measure semantic similarity, specially when data comes from a similar distribution. Hence we employ the aforementioned metrics into a classical retrieval scenario. In the following section, we will describe our motivation and the need of new insights by proposing a new metric and explain each of the variants.
3 Metrics
In this section, we present our proposed metrics which aim to offer additional insights on the performance amongst models designed to tackle the ITM task. Before we move with our formulation, we introduce the reader the nomenclature used in the rest of this work. First, the image and caption sets will be referred to as and , while the respective test set will be represented by , . We refer as to all the ground truth captions corresponding to an image . We use to indicate an evaluation metric function such as CIDEr or SPICE. Finally, represents the retrieved items for a given query at a top- cut-off threshold.
3.1 Is an image worth 5 sentences?
Both of the most commonly used datasets in ITM, namely Flickr30k [33] and MSCOCO [23], contain 5 ground truth sentences per image. A direct outcome is that current evaluation solely considers those 5 sentences as relevant to a single image for the ITM task. However, it is a known fact that in MSCOCO or Flickr30k there are many sentences that can perfectly describe a non paired image [32, 42, 43]. In other words, there are sentences (images) that are relevant to images (sentences) even though they are not defined as such in the retrieval ground truth. We refer to these samples as non ground truth (non-GT) relevant items. Specifically, ITM models are tested on 5k images and 25k sentences in MSCOCO. In the case of image-to-text retrieval, recall completely ignores the retrieved order of the remaining 24995 sentences (99.98% of the test set). Nevertheless, it is crucial to consider all semantically relevant items (including non-GT) to properly evaluate a models’ capability.
Aside from the aforementioned problems, Recall@K (R@K) as used in the ITM task is a binary metric, i.e. it is a hard metric that does not take into account the semantic continuum of language. When it comes to language, even ground truth paired sentences do not explain a given image in the same degree as they are not paraphrases from each other.
Another identified drawback is that the recall formulation used in ITM is different than the original recall employed in information retrieval. The recall metric used in ITM, referred as , takes the definition from [14]. In the image-to-text scenario, the only cares about the first GT annotated caption retrieved in the top- relevant results. This formulation discards the remaining annotated samples in the GT. On the other hand, recall defined by [34], referred as , considers all other relevant items in the formulation. It is important to note that both formulations agree on the text-to-image scenario due to the existence of only relevant image in the GT. Both recall formulations can be appreciated better in Equation 1 and 2.
| (1) |
| (2) |
When formulating our metrics in the following sections, we use instead of , as it includes the remaining items at evaluation. Nevertheless, it is important to note here that both and completely disregard the possible semantic relevance of non-GT samples. The existent limitations of employing solely recall as a metric lie in the fact that it misses to evaluate those non-GT relevant items.
3.2 Semantic Recall (SR)
Our metrics rely on the evaluations of captions with CIDEr and SPICE (for more details refer to Section 2) to decide which images are semantically similar to other sentences in the test set. Concretely, for a given image and sentence such that , we construct a matrix where:
| (3) |
where is one of the aforementioned captioning metrics (CIDEr or SPICE). Once the similarity matrix is defined, we can easily extend the ground truth relevant items for each possible query. Formally, we define as the extension of ground truth relevant items for a query image as the most similar sentences from . Now we define the Semantic Recall (SR) metric as follows:
| (4) |
This metric allows a transition from the classic recall to a metric that considers semantic relevance. However, the limitation on binary scoring associated with recall still persists. Another drawback is how to select a threshold that captures how many non-GT images or sentences are relevant in the whole data corpus.
3.3 Normalized Cumulative Semantic (NCS) Score
The Normalized Cumulative Semantic Score (NCS) aims at addressing the limitations of the Semantic Recall (SR) described in previous section. The NCS score is calculated as the division between the image captioning similarity of the retrieved samples and the maximum image captioning similarity score at a cut-off point K. Formally, we define our metric as:
| (5) |
For illustrative purposes, method A and B from Figure 1, both equally good at recall (), will score very differently at NCS. Method A will achieve a maximum score of . On the contrary, Method B will achieve a higher score since the retrieved samples contain a closer degree of semantics compared to the query.
With this formulation, we specify a solution to the binary nature of Recall@K (R@K) when it addresses the semantics of language. Moreover, NCS can properly take into account the non-GT items when evaluating a model without the need of selecting a threshold . In Section 5 we use these metrics to provide us with additional insights about current model’s performance.
3.4 Correlation with Human Judgements
Related to our work, the recently introduced CrissCrossed [32] dataset, is an extension of MS-COCO that comprises human judgements on the degree of similarity between captions and images. In this dataset, each annotator assesses how well an image and a sentence match on a 5-point likert scale on MSCOCO. They collect these judgements not only for the predefined ground truth pairs but also for other pairs. Despite the extensive annotation process required, the test set contains 44k judgement pairs, of which 25k are ground truth pairs.
We utilize these human judgments to calculate Pearson-R correlation coefficient for Recall and NCS. As it can be seen in Table 1, when all the pairs are considered, our metric has a better correlation with human judgments [1] with both SPICE and CIDEr. We observe that CIDEr has a better correlation when we take into account the 44k pairs, nonetheless SPICE is better on Non-GT, Which is why we always evaluate our models with SPICE. Furthermore, this also extends to the case of non-ground truth relevant pairs. In non-GT relevant pairs the classic recall is uninformative due to the metric definition, while the NCS provides an acceptable estimation that correlates well with human judgement.
| All | Non-GT | |
|---|---|---|
| Binary relevance (GT) | 0.711 | 0.00 |
| NCS with SPICE | 0.729 | 0.536 |
| NCS with CIDEr | 0.734 | 0.453 |
4 Methodology
In this section we introduce our Semantic Adaptive Margin (SAM) formulation, which aims to alleviate common problems of the usage of a triplet loss on non-exhaustive many-to-many data mappings. Before we elaborate on the details, we present the reader with the original triplet formulation along with a formal definition of the ITM task.
Let be the training set of image and caption pairs. These pairs are further divided into positive and negative samples where are considered as positive samples while as negative samples. Then, the embedded images and captions are represented as and where are embedding functions for captions and images respectively. Given a similarity function , the classic formulation of the triplet loss in ITM [9], , is defined as:
| (6) | ||||
where is known as the margin. The intuition behind the triplet formulation is that given an n-sphere with radius , positive samples should be projected inside and negative samples on the external region of the n-sphere. This can be observed in the left section of Figure 2. It is important to remark that the margin employed in the triplet loss is fixed despite the relatedness of hard-negative pairs.
4.1 Semantic Adaptive Margin (SAM)
Even though a fixed margin might be acceptable in image-to-image metric learning tasks, a fixed margin can not capture the continuum of language properly. Looking at the right on Figure 2, we can acknowledge that even the non-GT items can properly explain the provided image. Therefore, using a fixed margin and treating every negative as equal is unfeasible if the semantics is to be modelled properly. Due to this fact, creating an adaptive margin is imperative to teach our models the continuous nature of language.
Consequently, we formulate the Semantic Adaptive Margin (SAM) to dynamically calculate the similarity between images and sentences. More formally, given a positive pair with negative samples , we use the ground truth caption set to calculate the triplet loss by incorporating a SAM ():
| (7) |
where is a similarity function such as cosine similarity, stands for an aforementioned captioning metric (SPICE or CIDEr) and is a temperature parameter to be controlled on how wide or small the margin is desired. In other words, is used as a scaling factor. As it can be appreciated by Equation 7, we incorporate a SAM into the original triplet formulation, which assigns a unique margin value specific to each sampled pair. SAM still can be optimized jointly with the original triplet formulation.
5 Experiments
| Method | Recall | Normalized Cumulative Semantic Score | |||||||||||||
| I2T | T2I | I2T | T2I | ||||||||||||
| R@1 | R@5 | R@10 | R@1 | R@5 | R@10 | Rsum | N@1 | N@5 | N@10 | N@1 | N@5 | N@10 | Nsum | ||
| F-10% | CVSE [41] | 13.0 | 16.2 | 23.9 | 12.5 | 30.9 | 42.2 | 138.7 | 19.0 | 24.4 | 28.3 | 25.7 | 34.0 | 36.3 | 167.6 |
| CVSE+SAM | 34.6 | 60.4 | 70.9 | 23.9 | 50.6 | 62.8 | 303.2 | 37.4 | 40.2 | 44.1 | 38.6 | 46.3 | 47.1 | 253.6 | |
| SGR [7] | 0.3 | 0.7 | 1.3 | 0.2 | 0.6 | 1.1 | 4.2 | 2.8 | 4.2 | 5.7 | 5.7 | 9.7 | 11.7 | 39.8 | |
| SGR+SAM | 37.9 | 64.8 | 77.5 | 26.6 | 53.4 | 64.4 | 324.6 | 40.1 | 41.0 | 44.6 | 41.4 | 48.1 | 48.5 | 263.7 | |
| F-25% | CVSE [41] | 30.4 | 47.5 | 59.6 | 28.8 | 58.1 | 69.7 | 294.1 | 30.8 | 39.9 | 43.7 | 42.4 | 48.0 | 47.7 | 252.5 |
| CVSE+SAM | 48.7 | 73.2 | 81.8 | 37.9 | 66.2 | 76.0 | 383.8 | 46.2 | 49.7 | 52.4 | 51.0 | 52.7 | 50.9 | 302.8 | |
| SGR [7] | 11.0 | 29.3 | 40.0 | 7.3 | 21.4 | 31.6 | 140.6 | 20.3 | 24.1 | 29.7 | 22.7 | 33.4 | 37.3 | 167.6 | |
| SGR+SAM | 54.0 | 81.4 | 87.8 | 41.3 | 68.0 | 77.5 | 410.0 | 52.7 | 52.5 | 53.8 | 54.2 | 53.9 | 51.9 | 319.0 | |
| C-3% | CVSE [41] | 28.2 | 49.0 | 63.6 | 24.9 | 58.5 | 74.4 | 298.6 | 34.9 | 40.6 | 43.3 | 44.6 | 57.5 | 59.8 | 280.9 |
| CVSE+SAM | 41.1 | 71.8 | 82.1 | 32.2 | 65.4 | 77.2 | 369.8 | 47.2 | 49.5 | 51.6 | 50.6 | 59.8 | 59.8 | 318.5 | |
| SGR [7] | 0.2 | 1.1 | 2.1 | 0.1 | 0.6 | 1.2 | 5.3 | 4.1 | 5.1 | 5.9 | 4.2 | 6.7 | 8.1 | 34.2 | |
| SGR+SAM | 23.7 | 59.0 | 74.3 | 24.9 | 56.4 | 72.3 | 310.6 | 33.8 | 39.2 | 43.5 | 45.3 | 58.6 | 61.7 | 282.1 | |
| C-5% | CVSE [41] | 48.5 | 77.8 | 85.7 | 36.2 | 69.7 | 81.6 | 399.5 | 51.4 | 53.8 | 54.8 | 54.5 | 62.7 | 62.3 | 339.7 |
| CVSE+SAM | 48.6 | 77.3 | 86.5 | 37.9 | 71.1 | 82.6 | 404.0 | 50.7 | 54.2 | 55.4 | 55.9 | 62.9 | 62.3 | 341.5 | |
| SGR [7] | 1.0 | 3.0 | 5.3 | 0.2 | 0.5 | 1.3 | 11.3 | 6.9 | 7.9 | 9.0 | 2.9 | 4.2 | 5.7 | 36.6 | |
| SGR+SAM | 30.4 | 62.6 | 79.1 | 29.4 | 63.1 | 77.6 | 342.2 | 39.2 | 42.6 | 46.9 | 49.6 | 61.3 | 63.6 | 303.3 | |
In this section we present the results obtained by evaluating state-of-the-art models with and without the adoption of the proposed SAM.
Section 5.1 shows the performance of state-of-the-art methods evaluated on the introduced Semantic Recall metric. In Section 5.2 we present the significantly better performance achieved at retrieval when using considerably less training data compared to current state-of-the-art models. Section 5.3 showcases several state-of-the-art models with and without the adoption of our adaptive margin formulation. Finally, Section 5.4 presents the effects of employing the original triplet formulation, different values of a temperature parameter and different sampling strategies.
In all our experiments, we employ publicly available code from the authors and train the models from scratch according to the original strategy and hyper-parameters. In order to perform a fair comparison, we do not use ensembles in our experiments. We employed CIDEr to assess the similarity between samples at training time (). With the purpose of avoid training and evaluating on similar metrics, we employ SPICE when NSC is used as an evaluation metric. For the implementation details of each of our adaptive margin formulation we kindly ask the reader to refer to the supplementary material section.
5.1 Insights on State-of-the-Art Retrieval
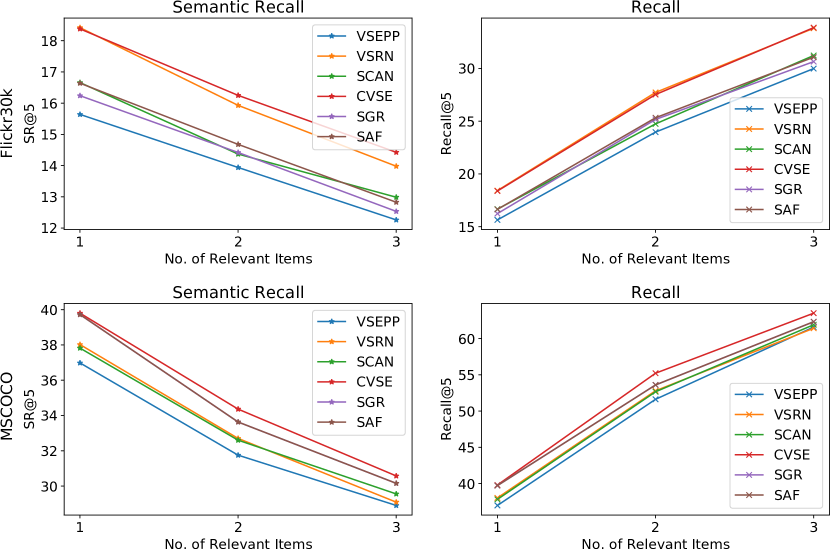
In this section, we compare the behaviour of existing systems by evaluating them on the newly proposed metrics. We evaluate the following state-of-the-art models: VSE++ [9], SCAN [20], VSRN [21], CVSE [41], SGR and SAF [7]. The experiment depicting the top- text-to-image retrieval scores for non-ground truth relevant items is shown in Figure 3. The scores shown are in terms of Recall and Semantic Recall at a cut-off point . Figures showcasing the remaining scenarios can be found in the supplementary material.
It is worth noting in Figure 3 that according to the recall (R@5), the models have a steady raise in recall scores as the number of relevant images increase. However, the opposite effect is found when the models are evaluated with the previously introduced Semantic Recall (SR) formulation. The behaviour of the models according to these two metrics seems to have an inversely proportional relation. The reason is due to the different definition between and . Merely evaluating the models on the first correctly retrieved item does not provide a complete landscape of its performance. Instead, our formulation shows that the models tend to have a decreasing score when more relevant items are considered. Furthermore, we observe that the big difference in numbers between models seems to diminish when we increase the relevant items for both metrics. Our conclusion is that the performance boost we obtain in the literature is not reflected well on the non-GT relevant items, suggesting that the generalization power of the models is overestimated.
5.2 Reduced Data Scenario
| Flickr30K | ||||||||||||||
| Recall | Normalized Cumulative Semantic Score | |||||||||||||
| Method | I2T | T2I | I2T | T2I | ||||||||||
| R@1 | R@5 | R@10 | R@1 | R@5 | R@10 | Rsum | N@1 | N@5 | N@10 | N@1 | N@5 | N@10 | Nsum | |
| VSRN[21] | 68.1 | 88.4 | 93.9 | 51.6 | 78.3 | 85.8 | 466.1 | 60.3 | 62.9 | 62.9 | 63.2 | 58.8 | 55.0 | 363.4 |
| VSRN+SAM | 68.4 | 89.7 | 94.8 | 52.4 | 78.7 | 86.6 | 470.6 | 60.2 | 62.7 | 63.1 | 64.1 | 59.4 | 55.7 | 365.2 |
| CVSE [41] | 68.6 | 87.7 | 92.7 | 53.2 | 81.1 | 88.3 | 471.6 | 59.0 | 63.5 | 63.1 | 64.1 | 59.6 | 55.5 | 364.9 |
| CVSE + SAM | 70.0 | 89.2 | 93.1 | 55.0 | 82.6 | 89.0 | 478.9 | 59.6 | 64.6 | 64.2 | 65.5 | 59.8 | 55.3 | 387.9 |
| SGR[7] | 74.4 | 92.9 | 96.3 | 55.8 | 81.1 | 87.9 | 488.4 | 68.1 | 65.6 | 63.8 | 66.0 | 58.6 | 54.5 | 376.7 |
| SGR+SAM | 75.9 | 92.4 | 96.6 | 57.6 | 83.1 | 89.7 | 495.3 | 69.4 | 66.2 | 64.0 | 67.5 | 59.2 | 55.0 | 381.4 |
| MSCOCO 1K | ||||||||||||||
| Recall | Normalized Cumulative Semantic Score | |||||||||||||
| Method | I2T | T2I | I2T | T2I | ||||||||||
| R@1 | R@5 | R@10 | R@1 | R@5 | R@10 | Rsum | N@1 | N@5 | N@10 | N@1 | N@5 | N@10 | Nsum | |
| VSRN[21] | 72.4 | 94.7 | 97.8 | 61.2 | 89.3 | 94.9 | 510.3 | 68.3 | 72.1 | 68.2 | 74.4 | 71.1 | 66.4 | 420.6 |
| VSRN+SAM | 74.6 | 93.6 | 97.5 | 61.5 | 89.6 | 94.9 | 511.7 | 69.3 | 72.2 | 68.1 | 74.5 | 70.9 | 66.5 | 421.5 |
| CVSE[41] | 77.0 | 94.2 | 97.3 | 64.3 | 91.1 | 95.9 | 519.8 | 69.7 | 73.3 | 69.3 | 76.2 | 71.4 | 67.1 | 427.2 |
| CVSE+SAM | 79.8 | 95.1 | 97.7 | 67.0 | 93.0 | 97.3 | 529.9 | 71.8 | 76.3 | 71.0 | 78.6 | 72.9 | 69.1 | 439.6 |
| SGR[7] | 79.9 | 97.4 | 98.3 | 63.2 | 90.5 | 95.4 | 524.7 | 74.7 | 73.1 | 67.9 | 76.1 | 70.7 | 67.2 | 429.9 |
| SGR+SAM | 80.7 | 97.2 | 98.6 | 63.8 | 90.5 | 95.9 | 526.7 | 73.2 | 72.9 | 67.8 | 76.2 | 70.9 | 67.4 | 428.5 |
| MSCOCO 5K | ||||||||||||||
| Recall | Normalized Cumulative Semantic Score | |||||||||||||
| Method | I2T | T2I | I2T | T2I | ||||||||||
| R@1 | R@5 | R@10 | R@1 | R@5 | R@10 | Rsum | N@1 | N@5 | N@10 | N@1 | N@5 | N@10 | Nsum | |
| VSRN[21] | 48.4 | 78.9 | 87.9 | 37.2 | 67.9 | 79.6 | 399.9 | 55.8 | 58.6 | 61.2 | 60.2 | 63.4 | 62.8 | 362.2 |
| VSRN+SAM | 49.1 | 79.0 | 87.4 | 37.5 | 68.1 | 79.5 | 400.6 | 56.4 | 58.8 | 61.7 | 60.6 | 63.5 | 62.9 | 363.9 |
| CVSE[41] | 53.1 | 79.6 | 88.0 | 40.5 | 72.2 | 83.1 | 416.5 | 57.1 | 61.1 | 63.2 | 62.2 | 64.4 | 63.4 | 371.4 |
| CVSE+SAM | 56.4 | 82.4 | 90.1 | 42.3 | 73.9 | 84.5 | 429.6 | 59.2 | 63.0 | 64.5 | 63.8 | 65.3 | 64.4 | 380.2 |
| SGR[7] | 56.0 | 83.3 | 90.7 | 40.1 | 69.3 | 80.2 | 419.6 | 60.4 | 59.1 | 60.4 | 61.7 | 62.5 | 61.6 | 366.0 |
| SGR+SAM | 55.7 | 83.2 | 91.2 | 40.5 | 69.7 | 80.5 | 420.8 | 59.5 | 59.3 | 60.4 | 62.0 | 62.4 | 61.4 | 365.0 |
We hypothesize that our adaptive margin formulation based on CIDEr is better equipped to deal with scarce training data scenarios, as it can better exploit the semantics over the whole data. More explicitly, we set aside a similar proportion of training samples from Flickr30k () and MSCOCO (). In Flickr30K we employed 10% and 25% of the training set, resulting in and samples respectively. In the case of MSCOCO we employed 3% and 5% of the training set, thus yielding and data points. We evaluate all the models on the standard K test set split of each dataset. We employ two state-of-the-art methods, CVSE [41] and SGR[7] for experimentation. Similar to the previous section, all the experiments are performed with public available code as described by the authors disregarding the adoption or not of our formulation. The results these experiments can be found in Table 2.
In the 10% data scenario of Flickr30k, CVSE with SAM achieves almost times the performance when compared to the original model. It is paramount to note that by the adoption of our formulation SGR achieves an enormous improvement. On the other hand, the original SGR model is barely capable to learn useful information due to the bigger number of parameters compared to CVSE.
As more data is used on each scenario, the original models tend to improve in performance and the retrieval gap decreases. Results in Flickr30k tend to be stronger when the adopting the proposed SAM. This is due to the significantly higher descriptive nature of captions found in Flickr30K training dataset compared to the less granular ones found in MSCOCO.
The significant improvement in scarce training data, also translates into an increased rate of convergence. By employing an adaptive margin with CIDEr, a model exploits a strong guiding cue about the semantic space to be learned according to weighted n-gram statistics.
5.3 Comparison with State-of-the-Art
The results obtained by comparing state-of-the-art methods with and without our formulated SAM are shown in Table 3. First, by incorporating SAM, calculated from an image captioning metric into a state-of-the-art pipeline, a boost in recall is obtained. A similar effect is achieved in most of the models when they are also evaluated with the proposed NCS metric.
Second, both depicted metrics have a strong degree of correlation, however, obtaining an improvement in recall does not necessarily translate in an increase in NCS. This effect can be observed in particular with the MSCOCO dataset with the SGR model.
This is due to the fact that Recall and NCS are inherently different metrics that provide complementary information. Recall shows how well a model ranks a single image or sentence labeled as relevant. Whereas, the NCS shows what is the degree of semantics captured by a model at a cut-off point k. Therefore, an increase in Recall or NCS should not necessarily be treated as equally significant.
Third, it is evident that a greater improvement is achieved on Flickr30k than in MSCOCO. All of our models on Flickr30k perform better than the baselines on every metric, while in MSCOCO, the boost attained is more conservative. The reason is that captions of Flickr30k are more detailed and longer compared to the ones in MSCOCO, which are shorter and less specific. This difference in the nature of the captions allows CIDEr to provide a more precise and discriminative margin per sample in intricate captions, due to the CIDEr formulation which relies on a weighted tf-idf n-gram matching.
Finally, it is important to note that while the Recall score increases as the cut-off point increases, in our proposed NCS metric this behaviour is not present. The NCS shows the normalized capability of a model to capture the greatest amount of semantic similarity on a specific cut-off point.
5.4 Effect of Temperature and Sampling
In this section, we study the effect of: the temperature parameter , sampling techniques, and whether the original triplet is kept or only a SAM is employed. Several sampling techniques are explored to find the negative items in our SAM formulation, namely random (RS), hard negative (HN) and soft negative(SN). In HN, the negative item in each triplet is selected as the closest to the anchor in a batch [9]. We refer to random sampling when a negative item is randomly picked in a batch. SN refers to picking the furthest negative item to the anchor within the batch. We investigate the effect of these parameters employing CVSE [41] model as a baseline. The majority of the best performing models obtained were employing a Soft Negative (SN) sampling, thus we provide the results on both datasets in Table 4. The results of the effect of Random Sampling (RS) and Hard Negative (HN) sampling in Flickr30k are shown in Table 5. In both tables, we provide the sum of the Recall and NCS metrics at the top , and in image-to-text and text-to-image scenarios. When the NCS is employed, we show two variations. One, by preserving the GT images labeled as relevant and the second one by removing only the GT images, denoted with the acronym N in Table 4 and 5. We ask the reader to refer to the supplementary material section for more details.
| S | T | F30K | MSCOCO-1K | |||||
|---|---|---|---|---|---|---|---|---|
| Nsum | Nsum(N) | Rsum | Nsum | Nsum(N) | Rsum | |||
| 3 | SN | ✓ | 371.29 | 257.42 | 479.1 | 429.41 | 312.2 | 517.9 |
| 3 | SN | ✗ | 369.73 | 258.12 | 476.5 | 427.32 | 313.06 | 515 |
| 5 | SN | ✓ | 369.97 | 257.21 | 477.5 | 429.74 | 311.53 | 520.5 |
| 5 | SN | ✗ | 371.31 | 258.75 | 478.2 | 428.2 | 312.89 | 518 |
| 10 | SN | ✓ | 369.74 | 257.64 | 477.2 | 429.09 | 306.51 | 521.3 |
| 10 | SN | ✗ | 370.17 | 257.85 | 475.8 | 429.88 | 309.27 | 520.6 |
| S | T | F30K | |||
|---|---|---|---|---|---|
| Nsum | Nsum(N) | Rsum | |||
| 3 | RS | ✓ | 355.87 | 257.93 | 460.1 |
| 3 | RS | ✗ | 344.44 | 257.67 | 441.7 |
| 5 | RS | ✓ | 367.02 | 258.25 | 473.4 |
| 5 | RS | ✗ | 363.27 | 259.83 | 468.3 |
| 10 | RS | ✓ | 370.09 | 257.42 | 478.7 |
| 10 | RS | ✗ | 365.72 | 258.82 | 471.2 |
| 3 | HN | ✓ | 338.94 | 249.04 | 435.1 |
| 3 | HN | ✗ | 344.19 | 258.27 | 439.5 |
| 5 | HN | ✓ | 369.94 | 257.97 | 478.8 |
| 5 | HN | ✗ | 351.68 | 257.64 | 450.4 |
| 10 | HN | ✓ | 369.04 | 256.85 | 477.2 |
| 10 | HN | ✗ | 351.18 | 257.83 | 448.6 |
Initially it is important to notice that improvements on the recall score do not necessarily go in hand with better scores at NCS. This can be seen in the MSCOCO-1K results between fifth row and first row in Table 4. In these experiments, we obtain a score of on Rsum and on NCS sum in the fifth row. Comparing it to the first row, there is a 4% drop on recall, however the score of remains on NCS. Although NCS and Recall are correlated, they provide different information of our models.
In general, we obtain our best NCS scores when the temperature parameter is increased to . The smaller margin gives the model more freedom in shaping the space on where to project the data points. By increasing the margin, we restrict the models on where to project the positive and negative samples, resulting in a drop in NCS and Recall. However, a trade-off between NCS scores on GT and non-GT items exists. The increase in the margin (lower values in ) seems to improve the results on non-GT items, this is especially evident on MSCOCO. We discover that on average, we obtain the best results with SN. Regarding the usage of the original triplet formulation, we notice that it is complementary to SAM since each one focuses on learning a different task. The hard negative focuses solely on GT samples, while SAM learns to measure the degree of similarity.
6 Conclusion
In this work, we highlight the challenges stemming from the lack of annotations in the task of image-text matching. Inspired by image captioning metrics, we present a formulation that addresses the many-to-many mapping problem between images and captions. The introduced metric, namely Normalized Cumulative Semantic Score (NCS), shows higher degree of semantic correlation to human judgement compared to the standard Recall. Additionally, we show a comprehensive set of experiments that considers the usage of IC metrics to learn an adaptive margin. The incorporation of such margin yields a big improvement in scenarios when training data is scarce (eg semi-supervised learning), as well as increasing the semantics of the retrieved non-GT items.
References
- [1] Peter Anderson, Basura Fernando, Mark Johnson, and Stephen Gould. Spice: Semantic propositional image caption evaluation. In European Conference on Computer Vision, 2016.
- [2] Peter Anderson, Xiaodong He, Chris Buehler, Damien Teney, Mark Johnson, Stephen Gould, and Lei Zhang. Bottom-up and top-down attention for image captioning and visual question answering. In Proceedings of the IEEE conference on computer vision and pattern recognition, pages 6077–6086, 2018.
- [3] Hui Chen, Guiguang Ding, Xudong Liu, Zijia Lin, Ji Liu, and Jungong Han. Imram: Iterative matching with recurrent attention memory for cross-modal image-text retrieval. In Proceedings of the IEEE/CVF Conference on Computer Vision and Pattern Recognition, pages 12655–12663, 2020.
- [4] Noam Chomsky. The architecture of language. OUP India, 2006.
- [5] Sanghyuk Chun, Seong Joon Oh, Rafael Sampaio de Rezende, Yannis Kalantidis, and Diane Larlus. Probabilistic embeddings for cross-modal retrieval. arXiv preprint arXiv:2101.05068, 2021.
- [6] Jacob Devlin, Ming-Wei Chang, Kenton Lee, and Kristina Toutanova. Bert: Pre-training of deep bidirectional transformers for language understanding. arXiv preprint arXiv:1810.04805, 2018.
- [7] Haiwen Diao, Ying Zhang, Lin Ma, and Huchuan Lu. Similarity reasoning and filtration for image-text matching. arXiv preprint arXiv:2101.01368, 2021.
- [8] Desmond Elliott and Frank Keller. Comparing automatic evaluation measures for image description. In Annual Meeting of the Association for Computational Linguistics, 2014.
- [9] Fartash Faghri, David J Fleet, Jamie Ryan Kiros, and Sanja Fidler. Vse++: Improving visual-semantic embeddings with hard negatives. arXiv preprint arXiv:1707.05612, 2017.
- [10] Andrea Frome, Greg Corrado, Jonathon Shlens, Samy Bengio, Jeffrey Dean, Marc’Aurelio Ranzato, and Tomas Mikolov. Devise: A deep visual-semantic embedding model. 2013.
- [11] Lluis Gomez, Yash Patel, Marçal Rusiñol, Dimosthenis Karatzas, and CV Jawahar. Self-supervised learning of visual features through embedding images into text topic spaces. In Proceedings of the IEEE Conference on Computer Vision and Pattern Recognition, pages 4230–4239, 2017.
- [12] Albert Gordo and Diane Larlus. Beyond instance-level image retrieval: Leveraging captions to learn a global visual representation for semantic retrieval. In Proceedings of the IEEE conference on computer vision and pattern recognition, pages 6589–6598, 2017.
- [13] Sepp Hochreiter and Jürgen Schmidhuber. Long short-term memory. Neural Computation, 9(8):1735–1780, 1997.
- [14] Micah Hodosh, Peter Young, and Julia Hockenmaier. Framing image description as a ranking task: Data, models and evaluation metrics. Journal of Artificial Intelligence Research, 47:853–899, 2013.
- [15] Yan Huang, Qi Wu, Chunfeng Song, and Liang Wang. Learning semantic concepts and order for image and sentence matching. In Proceedings of the IEEE Conference on Computer Vision and Pattern Recognition, pages 6163–6171, 2018.
- [16] Chao Jia, Yinfei Yang, Ye Xia, Yi-Ting Chen, Zarana Parekh, Hieu Pham, Quoc V Le, Yunhsuan Sung, Zhen Li, and Tom Duerig. Scaling up visual and vision-language representation learning with noisy text supervision. arXiv preprint arXiv:2102.05918, 2021.
- [17] Karen Sparck Jones. A statistical interpretation of term specificity and its application in retrieval. Journal of documentation, 1972.
- [18] Mert Kilickaya, Aykut Erdem, Nazli Ikizler-Cinbis, and Erkut Erdem. Re-evaluating Automatic Metrics for Image Captioning. 2016.
- [19] Thomas N Kipf and Max Welling. Semi-supervised classification with graph convolutional networks. arXiv preprint arXiv:1609.02907, 2016.
- [20] Kuang-Huei Lee, Xi Chen, Gang Hua, Houdong Hu, and Xiaodong He. Stacked cross attention for image-text matching. 2018.
- [21] Kunpeng Li, Yulun Zhang, Kai Li, Yuanyuan Li, and Yun Fu. Visual semantic reasoning for image-text matching. In Proceedings of the IEEE International Conference on Computer Vision, pages 4654–4662, 2019.
- [22] Xiujun Li, Xi Yin, Chunyuan Li, Pengchuan Zhang, Xiaowei Hu, Lei Zhang, Lijuan Wang, Houdong Hu, Li Dong, Furu Wei, et al. Oscar: Object-semantics aligned pre-training for vision-language tasks. In European Conference on Computer Vision, pages 121–137. Springer, 2020.
- [23] Tsung-Yi Lin, Michael Maire, Serge Belongie, James Hays, Pietro Perona, Deva Ramanan, Piotr Dollár, and C Lawrence Zitnick. Microsoft coco: Common objects in context. 2014.
- [24] Chunxiao Liu, Zhendong Mao, An-An Liu, Tianzhu Zhang, Bin Wang, and Yongdong Zhang. Focus your attention: A bidirectional focal attention network for image-text matching. In Proceedings of the 27th ACM International Conference on Multimedia, pages 3–11, 2019.
- [25] Chunxiao Liu, Zhendong Mao, Tianzhu Zhang, Hongtao Xie, Bin Wang, and Yongdong Zhang. Graph structured network for image-text matching. In Proceedings of the IEEE/CVF Conference on Computer Vision and Pattern Recognition, pages 10921–10930, 2020.
- [26] Jiasen Lu, Dhruv Batra, Devi Parikh, and Stefan Lee. Vilbert: Pretraining task-agnostic visiolinguistic representations for vision-and-language tasks. arXiv preprint arXiv:1908.02265, 2019.
- [27] Jiasen Lu, Vedanuj Goswami, Marcus Rohrbach, Devi Parikh, and Stefan Lee. 12-in-1: Multi-task vision and language representation learning. In Proceedings of the IEEE/CVF Conference on Computer Vision and Pattern Recognition, pages 10437–10446, 2020.
- [28] Andrés Mafla, Rafael S Rezende, Lluis Gomez, Diane Larlus, and Dimosthenis Karatzas. Stacmr: Scene-text aware cross-modal retrieval. In Proceedings of the IEEE/CVF Winter Conference on Applications of Computer Vision, pages 2220–2230, 2021.
- [29] Kevin Musgrave, Serge Belongie, and Ser-Nam Lim. A metric learning reality check. In European Conference on Computer Vision, pages 681–699. Springer, 2020.
- [30] Hyeonseob Nam, Jung-Woo Ha, and Jeonghee Kim. Dual attention networks for multimodal reasoning and matching. In Proceedings of the IEEE Conference on Computer Vision and Pattern Recognition, pages 299–307, 2017.
- [31] Zhenxing Niu, Mo Zhou, Le Wang, Xinbo Gao, and Gang Hua. Hierarchical multimodal lstm for dense visual-semantic embedding. In Proceedings of the IEEE international conference on computer vision, pages 1881–1889, 2017.
- [32] Zarana Parekh, Jason Baldridge, Daniel Cer, Austin Waters, and Yinfei Yang. Crisscrossed captions: Extended intramodal and intermodal semantic similarity judgments for ms-coco. arXiv preprint arXiv:2004.15020, 2020.
- [33] Bryan A Plummer, Liwei Wang, Chris M Cervantes, Juan C Caicedo, Julia Hockenmaier, and Svetlana Lazebnik. Flickr30k entities: Collecting region-to-phrase correspondences for richer image-to-sentence models. In IEEE International Conference on Computer Vision, 2015.
- [34] Hinrich Schütze, Christopher D Manning, and Prabhakar Raghavan. Introduction to information retrieval, volume 39. Cambridge University Press Cambridge, 2008.
- [35] Yale Song and Mohammad Soleymani. Polysemous visual-semantic embedding for cross-modal retrieval. In Proceedings of the IEEE Conference on Computer Vision and Pattern Recognition, pages 1979–1988, 2019.
- [36] Michael Studdert-Kennedy and Louis Goldstein. Launching language: The gestural origin of discrete infinity. Studies in the Evolution of Language, 3:235–254, 2003.
- [37] Christopher Thomas and Adriana Kovashka. Preserving semantic neighborhoods for robust cross-modal retrieval. In European Conference on Computer Vision, pages 317–335. Springer, 2020.
- [38] Ashish Vaswani, Noam Shazeer, Niki Parmar, Jakob Uszkoreit, Llion Jones, Aidan N Gomez, Łukasz Kaiser, and Illia Polosukhin. Attention is all you need. In Advances in Neural Information Processing Systems, pages 5998–6008, 2017.
- [39] Ramakrishna Vedantam, C Lawrence Zitnick, and Devi Parikh. Cider: Consensus-based image description evaluation. In IEEE Conference on Computer Vision and Pattern Recognition, 2015.
- [40] Alex Wang, Amanpreet Singh, Julian Michael, Felix Hill, Omer Levy, and Samuel R Bowman. Glue: A multi-task benchmark and analysis platform for natural language understanding. arXiv preprint arXiv:1804.07461, 2018.
- [41] Haoran Wang, Ying Zhang, Zhong Ji, Yanwei Pang, and Lin Ma. Consensus-aware visual-semantic embedding for image-text matching. arXiv preprint arXiv:2007.08883, 2020.
- [42] Jiuniu Wang, Wenjia Xu, Qingzhong Wang, and Antoni B Chan. Compare and reweight: Distinctive image captioning using similar images sets. In European Conference on Computer Vision, pages 370–386. Springer, 2020.
- [43] Zeyu Wang, Berthy Feng, Karthik Narasimhan, and Olga Russakovsky. Towards unique and informative captioning of images. arXiv preprint arXiv:2009.03949, 2020.
- [44] Zihao Wang, Xihui Liu, Hongsheng Li, Lu Sheng, Junjie Yan, Xiaogang Wang, and Jing Shao. Camp: Cross-modal adaptive message passing for text-image retrieval. 2019.
- [45] Xi Wei, Tianzhu Zhang, Yan Li, Yongdong Zhang, and Feng Wu. Multi-modality cross attention network for image and sentence matching. In Proceedings of the IEEE/CVF Conference on Computer Vision and Pattern Recognition, pages 10941–10950, 2020.
- [46] Bowen Zhang, Hexiang Hu, Vihan Jain, Eugene Ie, and Fei Sha. Learning to represent image and text with denotation graph. arXiv preprint arXiv:2010.02949, 2020.
- [47] Qi Zhang, Zhen Lei, Zhaoxiang Zhang, and Stan Z Li. Context-aware attention network for image-text retrieval. In Proceedings of the IEEE/CVF Conference on Computer Vision and Pattern Recognition, pages 3536–3545, 2020.
- [48] Mo Zhou, Zhenxing Niu, Le Wang, Zhanning Gao, Qilin Zhang, and Gang Hua. Ladder loss for coherent visual-semantic embedding. In Proceedings of the AAAI Conference on Artificial Intelligence, volume 34, pages 13050–13057, 2020.