Anomalously small superconducting gap in the strong spin-orbit coupled superconductor: Tungsten
Abstract
Thin films of tungsten host superconductivity in the presence of strong spin-orbit coupling. This non-equilibrium crystalline phase of tungsten has attracted considerable attention in recent years due to its giant spin Hall effect and the potential promise of exotic superconductivity. However, more than 60 years after its discovery, superconductivity in this material is still not well understood. Using time-domain THz spectroscopy, we measure the frequency response of the complex optical conductivity of tungsten thin film with a Tc of 3.7 K in its superconducting state. At temperatures down to 1.6 K, we find that both the superconducting gap and the superfluid spectral weight are much smaller than that expected for a weakly coupled superconductor given the Tc. The conclusion of a small gap holds up even when accounting for possible inhomogeneities in the system, which could come from other crystalline forms of tungsten (that are not superconducting at these temperatures) or surface states on tungsten grains. Using detailed X-ray diffraction measurements, we preclude the possibility of significant amount of other tungsten allotropes, strongly suggesting the topological surface states of tungsten play the role of inhomogeneity in these films. Our observations pose a challenge and opportunity for a theory of strongly anisotropic normal metals with strong spin-orbit coupling to describe.
Bulk crystalline tungsten (W) in the most stable W bcc form has a very low superconducting Tc of 11 mK Gibson and Hein (1964). However, thin films of W can have Tc’s as large as 5 K e.g. two orders of magnitude higher than the bulk. This has been attributed to the presence of a metastable A15 phase structure that can be stabilized in thin films Basavaiah and Pollack (1968); Hofer and Haberkorn (2019). Such W has very distinctive mechanical, electrical and optical properties. Its room temperature resistivity () is much higher than that of W () Hao et al. (2015). Due to strong spin orbit coupling (SOC), W exhibits a giant spin Hall effect with large spin Hall angle (), making it potentially useful in spintronic applicationsMondal et al. (2017); Demasius et al. (2016). DFT calculations show that W may be a Dirac system that hosts massive Dirac fermions and may host surface arc states with novel spin textures reminiscent of those in topological insulators Li et al. (2019); Xie et al. (2018). The helical spin-polarized electrons in topological insulators can host exotic excitations like Majorana fermions if their topological surface states become superconducting by proximity effect Mellnik et al. (2014). These facts prompt us to investigate the possibility of exotic bulk and surface superconductivity in W.
The study of superconductivity in W thin films has proven to be challenging. There have been only a few experimental and theoretical investigations Gibson and Hein (1964); Bond et al. (1965); Basavaiah and Pollack (1968) that have given understanding of its superconducting state and order parameter. This is mainly because of the difficulty in growing clean W thin films without impurity phases like W and the instability of this metastable phase at room temperature where it can spontaneously transform into the W phase Xiao et al. (2013). However, there has been a long-term (and now renewed) interest in both the metallic state and the superconductivity of W. The superconductivity exhibits a number of unusual aspects. Using tunneling, Basavaiah et al showed that the temperature dependence of the superconducting energy gap follows the Bardeen-Cooper-Schrieffer (BCS) dependence Basavaiah and Pollack (1968), but with a reduced ratio T, (where is the superconducting energy gap) as opposed to the universal weak coupling BCS value of Basavaiah and Pollack (1968); Bardeen et al. (1957). It was suggested that the reduced gap could be related to the presence of W phase Basavaiah and Pollack (1968). We shall revisit this possibillity below.
In general, the Tc ratio provides important insight into the physics. In a clean system, the coupling strength of superconductivity can be defined relative to , with for a weakly coupled superconductor and somewhat greater than for a strongly coupled superconductor. In disordered systems, pair breaking tends to decrease Tc faster than it does the , which increases the ratio above Khasanov and Mazin (2021). Thus, in general we expect Khasanov and Mazin (2021), which is in contrast to observations in W Basavaiah and Pollack (1968). However, in such considerations, there is an implicit assumption that the order parameter is uniform both in space and in momentum. The order parameter can be anisotropic in momentum space and the gap on the Fermi surface can be at points smaller than Khasanov and Mazin (2021). Due to a complicated and non-uniform Fermi surface Li et al. (2019), we expect W to possesses an anisotropic superconducting gap Carbotte (1977). However, the question is to what degree? Real space inhomogeneity can of course create regions where the gap is suppressed and this may also be an effect.
Here we use high precision time-domain THz spectroscopy (TDTS) to measure the low-energy complex optical conductivity of tungsten films as a function of temperature. We systematically study and track the superconducting gap, , as a function of temperature. We find that the superconducting energy gap and the superfluid density can be described phenomenologically in terms of BCS theory, however, with a small energy gap parameter. This confirms a value of much smaller than the 1.76 than expected for a weakly coupled BCS superconductor. The conclusion of a small gap holds up even when using extant effective medium models that account for inhomogeneity in the form of normal metal inclusions. Such inclusions could come from other crystalline forms of tungsten (not superconducting at these temperatures) or surface states on Tungsten grains. Our observations pose a challenge and opportunity for a theory of strongly anisotropic normal metals with strong spin-orbit coupling to describe.
Thin films of the Tungsten (A15 structure) were grown on 0.5 mm thin Si(001) with nm thick thermal oxide and 0.5 mm MgO(100) substrates using sputtering in presence of N2:Ar gas mixture at room temperature. The Ar sputtering pressure was kept at mTorr during the deposition. The fact that W thin films require N2:Ar or O2:Ar mixture assisted growth has made it difficult to tune the quality and Tc of the superconducting film. TDTS measurements were performed in transmission geometry on thin films of varying thicknesses ranging from 70 - 130 nm. The 70 nm W thin-films had the highest Tc’s of K. The samples on both Si and MgO substrates gave similar results (See Supplementary MaterialSup ; Garnett (1904); Xi et al. (2013); Carr et al. (1985); Granqvist and Hunderi (1977); Sihvola (2007) (SM)). Both real and imaginary parts of the complex conductance, , were extracted from the c omplex transmission measured in TDTS measurements, performed down to 1.6 K Chauhan et al. (2019).
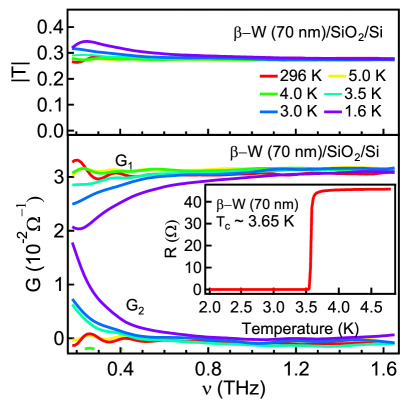
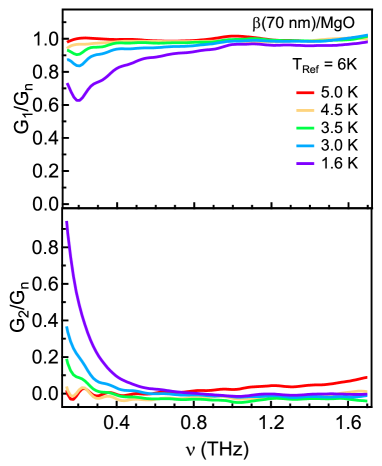
Fig. 1 shows the frequency dependent transmission and complex conductivity of a 70 nm W film, between THz in zero magnetic field at a few different temperatures above and below Tc. For TTc, the real part of the conductance, is constant in both this frequency and temperature range with RRR . In the normal state, is zero in correspondence with the large scattering rate (10 THz). The THz conductance in the normal state matches well with DC conductance measurement, . Below Tc both and shows features indicative of the opening of a superconducting energy gap. As the temperature falls below Tc, a depletion develops in at low , corresponding to shift of superconducting carrier spectral weight to the zero frequency delta function Palmer and Tinkham (1968). However, the depletion is not large and even at the lowest temperatures of 1.6 K, the conductance remains of the normal state at THz. For a weak coupling BCS superconductor with T K, one expects an optical gap of about 0.27 THz at this temperature. shows a small upturn below 0.2 THz. As , shows -like dependence at the lowest temperatures, characteristic of the superconducting state.
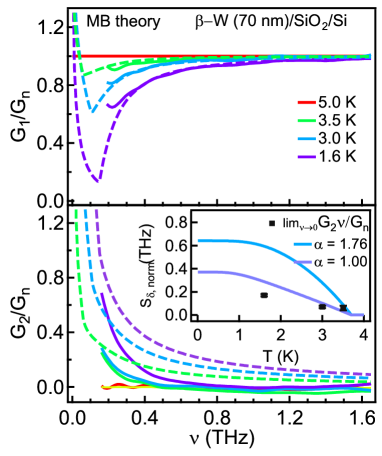
To understand the superconducting state better and determine the energy gap , we simultaneously fit the normalized for all temperatures to the Mattis-Bardeen (MB) theory Mattis and Bardeen (1958); Chauhan et al. (2019); Tinkham (2004). Normalizing the low temperature conductance with the normal state conductance, eliminates a number of the systematic errors in the transmission data and reduces the number of fitting parameters. For the fitting procedure, the only free parameter is the zero temperature superconducting gap, . The result of the fits as well as the normalized conductance data are shown as dashed and solid lines in Fig. 2. The upturn in at 0.2 THz becomes more apparent after normalizing the data. The global fit to the real part of the normalized conductance for all temperatures gives meV, which is similar to values obtained from tunneling spectroscopy (0.31 - 0.52 meV for films with Tc ranging from 3.1 K to 3.3 K) Basavaiah and Pollack (1968). There is close agreement between the MB fits and . In contrast, the correspondence with the imaginary part using the same parameters as the real part gives poor agreement at low frequencies [Fig. 2]. Nevertheless, the temperature evolution of the superconducting gap , follows standard BCS tanh, given for a weakly coupled BCS superconductor. However the extracted gap THz (0.64 meV) or T is much less than the weak coupling limit of 1.76 for a fully gapped BCS superconductor.
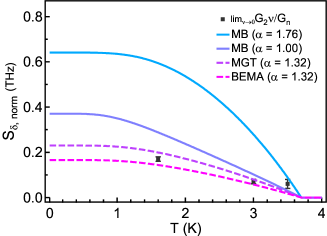
To get further insight into the superconducting gap and confirm the Mattis-Bardeen fits, we study the temperature dependence of the superfluid spectral weight, , as a measure of superfluid density . We calculate which is a measure of superfluid spectral weight determined directly from the TDTS experimental data. We can compare it to the value calculated for and using the approximation for a fully gapped BCS superconductor given by Tinkham (2004). The normalization constant is given by the Ferrell-Glover-Tinkham (FGT) sum rule, , where is the total spectral weight in normal state and is the above gap spectral weight at as given by the MB theory Chauhan et al. (2019). In Fig. 2(inset) we compare the temperature evolution of with both for and . Near Tc, the curve for is close to the experimental value, but over estimates the spectral weight found in the delta function. Thus we conclude that the Mattis-Bardeen fits below 0.2 THz do not match the actual conductance and at low temperatures. It is likely that there is a subgap conductance coming from a contribution other than the ones considered in MB theory. Hence, as compared to a weakly coupled BCS superconductor, W has a much lower superfluid density.
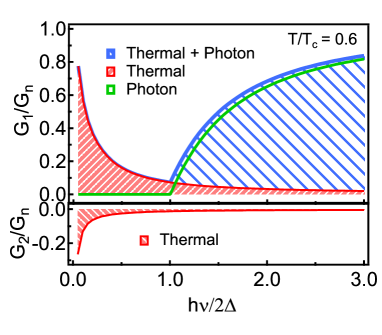
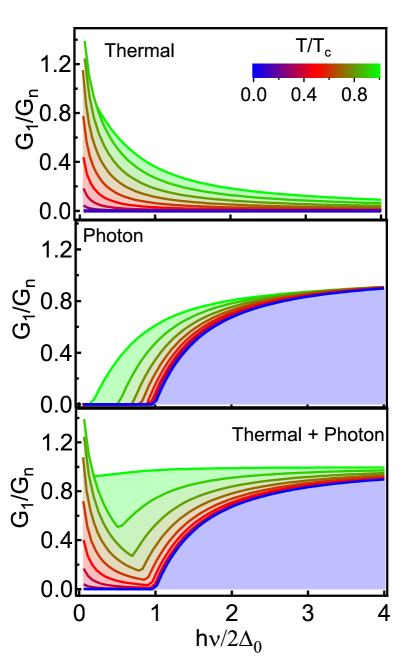
In order to qualitatively understand the origin of the low superfluid spectral weight in comparison to the MB theory prediction, we compare the experimental data phenomenologically with the individual components of the MB response function Mattis and Bardeen (1958); Zimmermann et al. (1991); Dressel (2013). There are both thermally and photon excited contributions to the total optical response in superconductors as shown in Fig. 3. Within the BCS framework, the low energy response of ) is only from the thermal excitations, whereas the higher energy response above is dominated by the photoexcitations (breaking of Cooper pairs due to photon absorption). For , most of the response in our spectral range is from the superfluid with a small negative contribution coming from the thermal and photon excitations, which decrease with increasing energy. On comparing the measured conductance of W in Fig. 2 with the individual components contributing to the optical response shown in Fig. 3, we find that the negative thermal contribution to cannot account for the smaller than expected . It is both too small in magnitude and of course disappears in the limit of low temperature. It appears that there must be some residual low frequency metal-like conduction that has the effect of giving a smaller contribution to the lowest frequency than the same spectral weight in the superconducting delta function would.
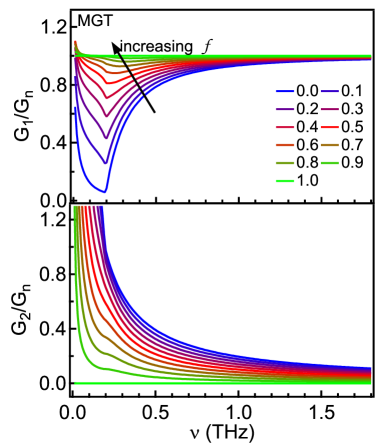
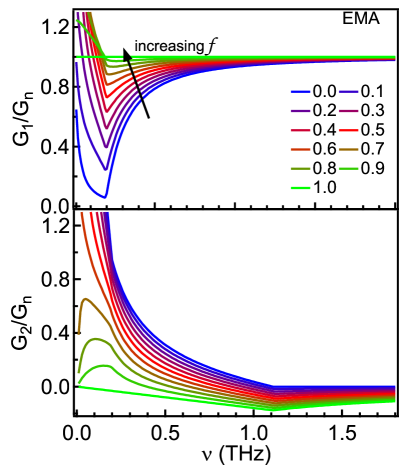
One explanation for this low , a larger than expected response in , smaller fitted gap, and anomalous sub gap absorption could be that the superconductor is inhomogeneous and that there are parts of the film which are not superconducting even at the lowest measured temperature. This would have the effect of making the apparent Tc ratio from the MB fits smaller than 1.76. Such inhomogeneity could stem from the presence of W, which only becomes superconducting at much lower T. W can either form directly during deposition or transform from W due to its unstable nature Basavaiah and Pollack (1968); Xiao et al. (2013). Another and surely more exciting possibility is the presence of topological surface states on the exterior of grains, which could act as sources of dissipation even when the bulk of the grains becomes superconducting Li et al. (2019). In order to confirm the presence of inhomogeneity, we analyze the system in terms of effective medium models. We compare the conductivity with calculations based on two different effective medium models, namely the Bruggeman-effective-medium-approximation (BEMA) Bruggeman (1935) and Maxwell-Garnett theory (MGT) Garnett (1904), for the collective response of a mixture of two materials Chauhan et al. (2019); Xi et al. (2013); Stroud (1975). See SMSup for details of these models. The BEMA treats all constituents equivalently, and is thus appropriate for mixtures with connected grains. In contrast, the MGT treats one constituent as the host and others as embedded media making it more suitable for mixtures with isolated inclusions Xi et al. (2013).
For the BEMA model, we consider an inhomogeneous two component medium of normal Drude-metal and superconductor that have volume fractions and . Similar to the analysis above, we fit the normalized using the MB theory for the superconducting fraction and the normalized for the normal fraction. Here the free parameters are , and . We obtain reasonable fits for with a slightly larger energy gap than in the MB homogeneous case of meV (0.10 THz) and normal volume fraction as shown in Fig. 4(a-b). The spectral gap fit in this fashion increases only by 33 giving which is somewhat closer to, but still less than the weakly coupled BCS superconductor value of 1.76. The BEMA fits for match even better to the data as compared to MB theory fits in Fig. 2(b). Although there are still discrepancies, they appear to be converging towards the data at frequencies below 0.2 THz. In order to confirm the fits we determine the superfluid spectral weights of from BEMA using FGT sum rule and compare it to in Fig. 5. Unlike the overestimated superfluid spectral weights obtained from MB theory, falls only slightly below the BCS prediction and .
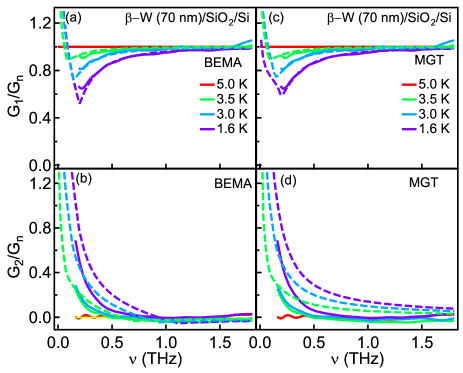
For the MGT model the superconducting component is taken as the host medium and the normal volume fraction is taken as the embedded media. We fit using MB theory for the superconducting medium, taking the energy gap and normal volume fraction as the only free parameters. Fig. 4(c-d) shows that the MGT fits are consistent with for and energy gap meV (0.1 THz), or () to within errors giving the same parameters as BEMA fits. As shown in Fig. 5, the superfluid spectral weight extracted from MGT is now just slightly below the experimental . This indicates that the MGT also converges to near the experimental data at frequencies lower than 0.2 THz.
These fits with effective medium models show that although there can be a low frequency absorption coming from inhomogeneity, this does not completely explain the extracted small gaps in these systems. Therefore one can take this as an intrinsic feature of the superconducting state of W. One possibility is that the gap is strongly anisotropic in momentum space. Although gap anisotropy in s-wave superconductors is believed to largely depends on phonon spectrum anistoropy and not on Fermi surface anisotropies Bennett (1965); Tomlinson and Carbotte (1976); Crabtree et al. (1987), this issue has not been investigated for the strongly anisotropic Fermi surface of tungsten. Moreover, calculations taking into account strong-spin orbit coupling in a system like tungsten with its strongly anisotropic Fermi surface Mattheiss (1965) have not been done. This is an area for future investigation.
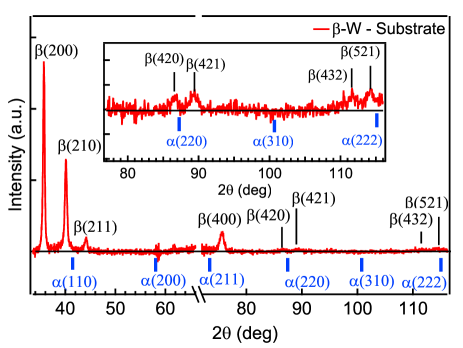
What is the source of these metallic regions in the film? First, we would like to discuss the possibility that the other tungsten allotrope W could be acting as normal metal inclusions embedded in the superconducting W. It is generally known that depending on the growth conditions and thickness of the thin films, tungsten grows in bcc phase, A15 phase, mixed phases or in amorphous phase Shen et al. (2000); Basavaiah and Pollack (1968); Hofer and Haberkorn (2019). X-ray diffraction measurements on our W thin films (see Fig. 6) indicates a pure W phase with no W peaks observed within our instrumental uncertainty. We believe that, even if present must be much less than implying that the normal volume fraction of obtained from the effective medium models cannot be explained by normal metal inclusions of bcc W phase. Further, all the W peaks are sharp () indicating absence or negligiible amount of the amorphous phase Adelfar et al. (2019); Abrosimova et al. (2020). To confirm this, we performed XRD measurements on W thin films grown on MgO substrate and obtained results similar to that on Si substrate (see SMSup ).
All the above, suggests that the nontrivial surface states of topological Dirac metal of W Li et al. (2019) are a likely source for the inhomogeneity found in the effective medium models. We estimate the grain size of W crystals to be nm using Scherrer equationPatterson (1939); Hao et al. (2015) (see SMSup ). This implies that the grains of W are nanocrystalline and the surface to volume ratio of the entire thin film is large. Thus, in the superconducting state of nano-crystalline W thin films, the topological surface states on the exterior of the grains would act as sources of dissipation explaining the anomalous subgap absorption observed in our films.
Acknowledgements.
PC and NPA at JHU was supported through NSF grant DMR-1905519. RB at Morgan State University was supported through Air Force Office of Scientific Research, Grant No. FA9550-19-1-0082. We would like to thank T. McQueen for access to his x-ray diffractometers, and E. A. Pogue for help in performing these experiments.References
- Gibson and Hein (1964) J. W. Gibson and R. A. Hein, Phys. Rev. Lett. 12, 688 (1964).
- Basavaiah and Pollack (1968) S. Basavaiah and S. R. Pollack, Journal of Applied Physics 39, 5548 (1968), https://doi.org/10.1063/1.1656012 .
- Hofer and Haberkorn (2019) J. Hofer and N. Haberkorn, Thin Solid Films 685, 117 (2019).
- Hao et al. (2015) Q. Hao, W. Chen, and G. Xiao, Applied Physics Letters 106, 182403 (2015), https://doi.org/10.1063/1.4919867 .
- Mondal et al. (2017) S. Mondal, S. Choudhury, N. Jha, A. Ganguly, J. Sinha, and A. Barman, Phys. Rev. B 96, 054414 (2017).
- Demasius et al. (2016) K.-U. Demasius, T. Phung, W. Zhang, B. P. Hughes, S.-H. Yang, A. Kellock, W. Han, A. Pushp, and S. S. P. Parkin, Nature Communications 7, 10644 (2016).
- Li et al. (2019) J. Li, S. Ullah, R. Li, M. Liu, H. Cao, D. Li, Y. Li, and X.-Q. Chen, Phys. Rev. B 99, 165110 (2019).
- Xie et al. (2018) T. Xie, M. Dreyer, D. Bowen, D. Hinkel, R. E. Butera, C. Krafft, and I. Mayergoyz, IEEE Transactions on Nanotechnology 17, 914 (2018).
- Mellnik et al. (2014) A. R. Mellnik, J. S. Lee, A. Richardella, J. L. Grab, P. J. Mintun, M. H. Fischer, A. Vaezi, A. Manchon, E.-A. Kim, N. Samarth, and D. C. Ralph, Nature 511, 449 (2014).
- Bond et al. (1965) W. L. Bond, A. S. Cooper, K. Andres, G. W. Hull, T. H. Geballe, and B. T. Matthias, Phys. Rev. Lett. 15, 260 (1965).
- Xiao et al. (2013) J. Xiao, P. Liu, Y. Liang, H. B. Li, and G. W. Yang, Nanoscale 5, 899 (2013).
- Bardeen et al. (1957) J. Bardeen, L. N. Cooper, and J. R. Schrieffer, Phys. Rev. 106, 162 (1957).
- Khasanov and Mazin (2021) R. Khasanov and I. I. Mazin, Phys. Rev. B 103, L060502 (2021).
- Carbotte (1977) J. Carbotte, in Anisotropy Effects in Superconductors (Springer, 1977) pp. 183–212.
- (15) See Supplementary materials [url] which include Refs. [16-20], for details about the THz measurement, Effective medium approximation and XRD characterization.
- Garnett (1904) J. C. M. Garnett, Philosophical Transactions of the Royal Society of London A: Mathematical, Physical and Engineering Sciences 203, 385 (1904).
- Xi et al. (2013) X. Xi, J.-H. Park, D. Graf, G. L. Carr, and D. B. Tanner, Phys. Rev. B 87, 184503 (2013).
- Carr et al. (1985) G. L. Carr, S. Perkowitz, and D. B. Tanner, Infrared and Millimeter Waves (Academic Press, Inc. New York, 1985) pp. 171–263.
- Granqvist and Hunderi (1977) C. G. Granqvist and O. Hunderi, Phys. Rev. B 16, 3513 (1977).
- Sihvola (2007) A. Sihvola, Journal of Nanomaterials 2007, 1 (2007).
- Chauhan et al. (2019) P. Chauhan, F. Mahmood, D. Yue, P.-C. Xu, X. Jin, and N. P. Armitage, Phys. Rev. Lett. 122, 017002 (2019).
- Palmer and Tinkham (1968) L. H. Palmer and M. Tinkham, Phys. Rev. 165, 588 (1968).
- Mattis and Bardeen (1958) D. C. Mattis and J. Bardeen, Phys. Rev. 111, 412 (1958).
- Tinkham (2004) M. Tinkham, Introduction to Superconductivity: Second Edition (Dover Publications, 2004) pp. 99,103.
- Zimmermann et al. (1991) W. Zimmermann, E. Brandt, M. Bauer, E. Seider, and L. Genzel, Physica C: Superconductivity 183, 99 (1991).
- Dressel (2013) M. Dressel, Advances in Condensed Matter Physics 2013, 104379 (2013).
- Bruggeman (1935) D. A. G. Bruggeman, Annalen der Physik 416, 636 (1935).
- Stroud (1975) D. Stroud, Phys. Rev. B 12, 3368 (1975).
- Bennett (1965) A. J. Bennett, Physical Review 140, A1902 (1965).
- Tomlinson and Carbotte (1976) P. Tomlinson and J. Carbotte, Physical Review B 13, 4738 (1976).
- Crabtree et al. (1987) G. Crabtree, D. Dye, D. Karim, S. Campbell, and J. Ketterson, Physical Review B 35, 1728 (1987).
- Mattheiss (1965) L. Mattheiss, Physical review 139, A1893 (1965).
- Shen et al. (2000) Y. G. Shen, Y. W. Mai, Q. C. Zhang, D. R. McKenzie, W. D. McFall, and W. E. McBride, Journal of Applied Physics 87, 177 (2000), https://doi.org/10.1063/1.371841 .
- Adelfar et al. (2019) R. Adelfar, H. Mirzadeh, A. Ataie, and M. Malekan, Journal of Non-Crystalline Solids 520, 119466 (2019).
- Abrosimova et al. (2020) G. Abrosimova, B. Gnesin, D. Gunderov, A. Drozdenko, D. Matveev, B. Mironchuk, E. Pershina, I. Sholin, and A. Aronin, Metals 10 (2020), 10.3390/met10101329.
- Patterson (1939) A. L. Patterson, Phys. Rev. 56, 978 (1939).
Prashant Chauhan1, Ramesh Budhani2, and N. P. Armitage1
1 The Institute for Quantum Matter, Department of Physics and Astronomy
The Johns Hopkins University, Baltimore, Maryland 21218, USA
2 Department of Physics, Morgan State University, 1700E Cold Spring Lane, Baltimore, Maryland 21251, USA
I Time-domain THz measurement
The complex optical conductance was obtained using time-domain THz spectroscopy. A femtosecond IR laser pulse is split along two paths to excite a pair of photoconductive ‘Auston’-switch antennae grown on LT-GaAs wafers. A broadband THz range pulse is emitted by one antenna and measured at the other antenna. By varying the length-difference of the two paths, we map out electric field of the pulse as a function of time, both through the W sample on a Si substrate and through a bare reference Si substrate. The electric fields are converted to the frequency domain by taking a Fast Fourier Transform (FFT). By dividing the complex FFTs of the sample and reference scans, we obtain the complex transmission of the sample. We then invert the transmission to obtain the complex conductance via the standard formula for thin films on a substrate: where is the phase accumulated from the small difference in thickness between the sample and reference substrates and is the substrate index of refraction. By measuring both the magnitude and phase of the transmission, both the real and imaginary conductance are obtained directly and no Kramers-Kronig transformation is required. The complex conductance, , is then obtained from the complex transmission in the thin-film limit as , where is the refractive index of the substrate and is the thickness difference between sample and reference substrates.
II Maxwell-Garnett Theory
Maxwell-Garnett theory (MGT) can be used to describe the effective optical conductance, , of an inhomogeneous superconductor. The thin-film can be treated as an inhomogeneous medium with two components, a with volume fraction embedded in a surrounding medium with volume fraction Garnett (1904); Xi et al. (2013). By assuming that the separation between the grains is large enough for an individual grain to scatter light and that the medium remains unaffected by grains, MGT gives an effective dielectric function for oriented ellipsoidal grains as Xi et al. (2013); Carr et al. (1985); Granqvist and Hunderi (1977)
| (1) |
where is the depolarization factor that corresponds to the the shape of the ellipsoid inclusions. Taking the inclusions as cylindrical tubes with a normal core, we set Sihvola (2007). Using, , we obtain the effective optical conductance as
| (2) |
where is the volume fraction of the normal metal cores, and are the conductances of the normal and superconducting fractions respectively.
III Bruggeman effective medium approximation
In MGT, due to the presence of the grains with properties different from the host medium, the electric field in the region surrounding the grain gets modified causing deviation of electric flux in the host. Bruggeman suggested that for an adequate choice of self-consistent local field the average flux deviation should be zero. Thus we can consider an effective medium in which all inclusions are treated equally e.g. there is no host media, giving average flux deviation as zero. According to Bruggeman effective medium approximation an inhomogeneous medium of two components with fraction and with fraction , the effective dielectric function for oriented ellipsoid grains as the solution of the equation
| (3) |
Taking inclusions as cylindrical particles, we set . The solution for the above equation is
| (4) |
We obtain the conductance by substituting, . Figure S2 shows the real and imaginary part of conductance at different fractions of non-superconducting parts of the film. With increasing fraction of the normal part both the components of the conductance approach . From the deviations in one can notice that, the EMA starts to fail after , which was also noted in a similar analysis by Xi et. al. Xi et al. (2013).
IV Mattis-Bardeen theory: Photon and Thermal excitation
Mattis-Bardeen theory describes the complex electromagnetic response of cooper pairs. It accounts for both the thermally and photon excited quasiparticles that accounts for the total optical response in a superconductor. Fig. S3 shows the individual thermal and photon excited contributions for varying temperature. The low energy response below is mainly occupied by the thermally excited quasiparticles and it increases with temperature. Similarly, the response above is mainly occupied by photon excitations across the gap.
V Optical conductance W on MgO substrate
We measure the optical conductance of tungsten on MgO grown along with the samples on Si substarate. Both the real () and imaginary () parts of complex conductance show similar results as the films grown on Si substrate shown in the main text.
VI X-ray Diffraction characterization
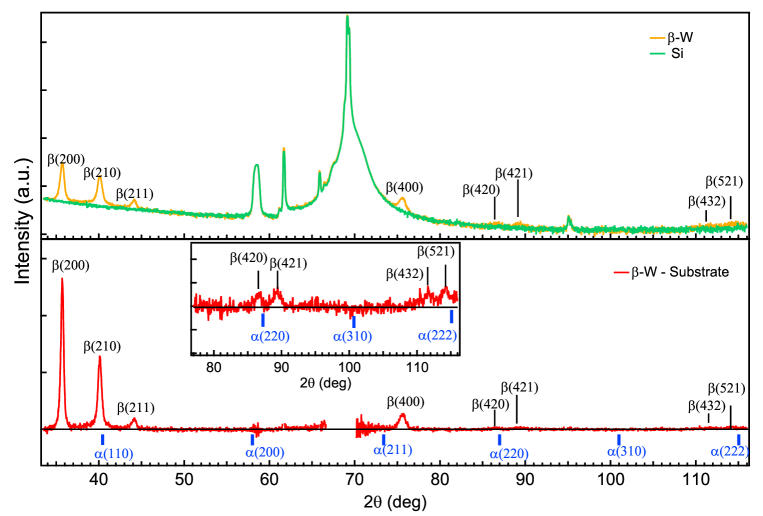
The samples were characterized using Bruker D8 advance X-ray diffractometer in mode between . Fig. S5 shows the XRD pattern of both the W thin film grown on Si(001)+SiO2 substrate measured in exact same conditions. The Si peaks match exactly in both the sample and the Si substrate. After subtracting the substrate XRD pattern from the sample we identify only W peaks. No W peaks are observed. XRD data can also provide us with an estimate on the grain size. The broadening of the diffraction peak can be related to the size of the grain, using Scherrer equation given by where is the shape factor whose value is approximately 0.9, is the X-ray wavelength, is the peak width or FWHM and is the Bragg angle Patterson (1939); Hao et al. (2015). For most of our thin films grown on both Si and MgO substrates the Bragg angle for the first W peak is 35.6(3)∘ with width of . Thus the grain size for our thin films range between nm.
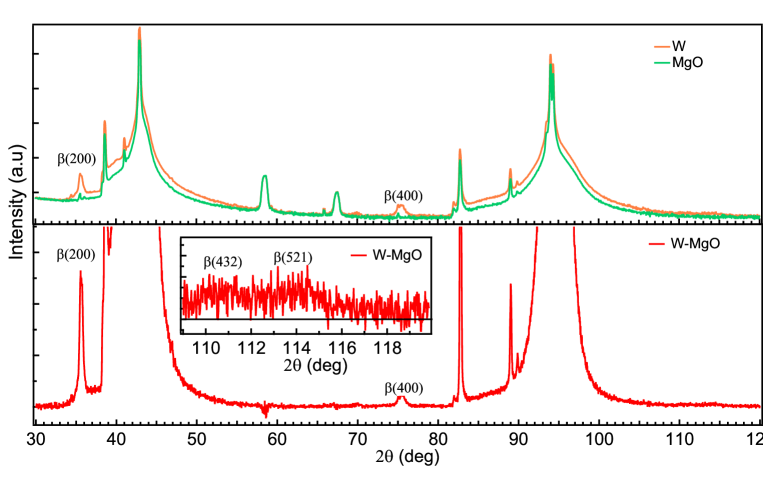
Fig. S5 shows the XRD pattern of both W/MgO and MgO measured in exact same conditions. We again only identify W peaks and no W peaks are observed. At the peak positions we do not see any large broadening which is indicative of amorphous W. Thus concluding that our W thin films are pure A15 phase within our instrumental uncertainty. In order to get an approximate estimate of A15:bcc phases we take ratio of W at to background after the peak (from Fig. S5(b)) which might have hidden W peak. we find that the amount of W phase is .
References
- Garnett (1904) J. C. M. Garnett, Philosophical Transactions of the Royal Society of London A: Mathematical, Physical and Engineering Sciences 203, 385 (1904).
- Xi et al. (2013) X. Xi, J.-H. Park, D. Graf, G. L. Carr, and D. B. Tanner, Phys. Rev. B 87, 184503 (2013).
- Carr et al. (1985) G. L. Carr, S. Perkowitz, and D. B. Tanner, Infrared and Millimeter Waves (Academic Press, Inc. New York, 1985) pp. 171–263.
- Granqvist and Hunderi (1977) C. G. Granqvist and O. Hunderi, Phys. Rev. B 16, 3513 (1977).
- Sihvola (2007) A. Sihvola, Journal of Nanomaterials 2007, 1 (2007).
- Patterson (1939) A. L. Patterson, Phys. Rev. 56, 978 (1939).
- Hao et al. (2015) Q. Hao, W. Chen, and G. Xiao, Applied Physics Letters 106, 182403 (2015), https://doi.org/10.1063/1.4919867 .