The 3D dust and opacity distribution of protoplanets in multi-fluid global simulations
Abstract
The abundance and distribution of solids inside the Hill sphere are central to our understanding of the giant planet dichotomy. Here, we present a three-dimensional characterization of the dust density, mass flux, and mean opacities in the envelope of sub-thermal and super-thermal mass planets. We simulate the dynamics of multiple dust species in a global protoplanetary disk model accounting for dust feedback. We find that the meridional flows do not effectively stir dust grains at scales of the Bondi sphere. Thus the dust-settling driven by the stellar gravitational potential sets the latitudinal dust density gradient within the planet envelope. Not only does the planet’s potential enhance this gradient, but also the spiral wakes serve as another source of asymmetry. These asymmetries substantially alter the inferred mean Rosseland and Planck opacities. In cases with the moderate-to-strong dust settling, the opacity gradient can range from a few percent to more than two orders of magnitude between the mid-plane and the polar regions of the Bondi sphere. Finally, we show that this strong latitudinal opacity gradient can introduce a transition between optically thick and thin regimes at the scales of the planet envelope. We suggest that this transition is likely to occur when the equilibrium scale height of hundred-micron-sized particles is smaller than the Hill radius of the forming planet. This work calls into question the adoption of a constant opacity derived from well-mixed distributions and demonstrates the need for global radiation hydrodynamics models of giant planet formation which account for dust dynamics.
1 Introduction
The core accretion model for giant planet formation relies on the complex interplay of gas and solids in a protoplanetary disk (Pollack et al., 1996; Youdin & Kenyon, 2013). Despite a mass fraction of only 1% relative to the gas, the solids control much of the planet formation process. Both planetesimals and pebbles impact the growth rate of the solid core and final metallicity (Ormel & Klahr, 2010; Lambrechts & Johansen, 2012; Alibert et al., 2018). Small grains dominate the envelope opacity (Pollack et al., 1994; Piso et al., 2015) and thus the gas cooling rate in the radiative zones (e.g., Podolak, 2003; Hubickyj et al., 2005). In turn, the gas cooling rate controls the growth timescale of the planetary envelope throughout the onset of runaway growth, when the envelope starts to dominate the planet mass (Piso & Youdin, 2014). Eventually the envelope separates from the disk and hydrodynamic accretion is no longer limited by cooling, but by the supply of gas that becomes depleted by gap opening and disk dispersal (Lissauer et al., 2009; Ginzburg & Chiang, 2019). We emphasize that, in core accretion theory, envelope cooling, and therefore dust opacities, are essential for a planet’s transition to a gas giant.
In this work we present a three-dimensional multi-species characterization of the dust density, dust mass flux, and mean opacities in the envelope of embedded protoplanets. The distribution of solids in the vicinity of a protoplanet is set by complex dynamical processes, including the gravity of the central star and of the planet, and drag forces with the disk and envelope gas, which are affected by flows triggered by the planet. Three-dimensional simulations have elucidated the hydrodynamic flows that couple the planet envelope and surrounding disk gas (Tanigawa et al., 2012). While local shearing-box simulations can more readily achieve high resolution within the Bondi sphere (e.g., Kuwahara & Kurokawa, 2020), global simulations model planet disk interactions more accurately, e.g. by capturing the full orbits in the horseshoe region. Global models have become increasingly sophisticated, moving from pure hydrodynamics (e.g., Wang et al., 2014; Fung et al., 2015), to radiation hydrodynamics (e.g., Ayliffe & Bate, 2009; D’Angelo & Bodenheimer, 2013; Lambrechts et al., 2016; Szulágyi et al., 2016; Kurokawa & Tanigawa, 2018; Schulik et al., 2019) and magnetohydrodynamics Gressel et al. (2013).
These simulations have altered the standard picture of 1D core accretion models, where low mass gas envelopes grow hydrostatically around a core as they cool (Pollack et al., 1996; Piso & Youdin, 2014). In particular, three-dimensional simulations have shown that hydrodynamic flows penetrate within the Hill and Bondi radii, which limits the ability of this gas to cool (Ormel et al., 2015; Moldenhauer et al., 2021). However, the gas that is deeper in the envelope is more slowly recycled and can still cool, if at a reduced rate (Cimerman et al., 2017). Furthermore, radiation hydrodynamics calculations show that the strength of dust opacities111Note that we refer to “dust opacity” as the opacity of the gas which main source are small dust grains. Molecular opacity is usually negligible at the outer envelope for temperatures below (Freedman et al., 2008). has a significant effect on the nature of recycling flows and on envelope convection (Zhu et al., 2021). Thus a hydrodynamic determination of 3D distributions of dust opacities – an issue explored in this paper – is a crucial step to a fuller understanding of how 3D flows affect the accretion of planetary envelopes.
In this work, we move towards a self-consistent treatment of thermal physics at the planet-disk interface by exploring the size-dependent particle distribution at scales of the Bondi sphere in global, three-dimensional models. We use novel multi-fluid 3D simulations including dust feedback, to model the non-uniform dust distribution in the vicinity of the planet. We study the implications for envelope opacity and thus the thermal physics of the cooling and an accreting planet. Our simulations allow us to explore how the interplay between vertical settling and planet-disk interaction impacts the distribution of solids and mean opacities at the scale of the Bondi sphere of sub-thermal mass planets. Thus, our simulations are complementary to previous studies that have focused on the large scale meridional circulation of solids affected by gap-opening planets (Fouchet et al., 2007; Bi et al., 2021; Binkert et al., 2021). In addition, these numerical simulations may inform updated boundary conditions for long-timescale, one-dimensional core accretion models (e.g., Lee & Chiang, 2015).
This work is organized as follows:
Model setup and description of the three-dimensional flow:
In Section 2 we present the equations, numerical method, and disk model that we adopt in this work. In Section LABEL:sec:results we describe the gas and dust flows at the scale of the Bondi sphere, which are consistent with previous models that neglect feedback. Focusing on the dust density distribution, in Section LABEL:sec:dust_density we investigate the deviations from the initial settling equilibrium introduced by the planet potential, highlighting the dust-to-gas ratio anisotropies due to settling induced latitudinal variations, and spiral density wave induced azimuthal ones.
Opacities calculation at the Bondi sphere and Conclusions:
In Section LABEL:sec:opacity we estimate how departures from spherical symmetry affect the Rosseland and Planck mean opacity at the Bondi radius. In Section LABEL:sec:results_opacity we show the existence of an anisotropic opacity distribution driven by dust settling. We moreover calculate the photon mean-free path and describe a latitudinal transition between optically thick and thin regimes at the Bondi sphere of a sub-thermal mass planet in Section LABEL:sec:discussion. We therefore identify the disk locations and conditions in which this transition may develop. Finally, in Section 5 we summarize the main conclusions and emphasize the need for multi-species self-consistent radiative transfer disk models for future work.
2 Numerical Method
The numerical simulations in this work are carried out using the multi-fluid code FARGO3D (Benítez-Llambay & Masset, 2016; Benítez-Llambay et al., 2019). We first introduce the equations in Section 2.1, then continue with a summary of the key features of the numerical method in Section 2.2. We defer discussion of the post-processing analysis required to produce realistic opacity maps to Section LABEL:sec-opacmethod.
2.1 Equations
Our multi-fluid hydrodynamic simulations solve the following set of equations. First, the continuity equations are
| (1) |
where , , and correspond to the gas and dust densities and velocities, respectively. The dust diffusion flux is given by
| (2) |
where is the diffusion coefficient. The momentum equations for the gas and dust-species are
| (3) |
for . The gas pressure is defined as , with the sound speed. The terms and denote the accelerations due to the drag force between gas and dust-species, respectively, and are defined as
| (4) |
where corresponds to the Stokes number of the -th dust species and is the orbital frequency (e.g., Epstein, 1924; Whipple, 1972). In this work we assume a constant Stokes number and neglect the momentum and mass transfer between dust species.
The gravitational potential includes the contributions from the central star and the planet and neglects the indirect term, thus
| (5) |
where is a softening length used to avoid a divergence at the planet location, and and correspond to planet mass and radial vector position. The viscous stress tensor, , is given by
| (6) |
with the gas viscosity.
| Run | ||||||||
|---|---|---|---|---|---|---|---|---|
| SUB-d4 | 0.01 | |||||||
| SUB-d5 | 0.01 | |||||||
| SUB-d6 | 0.01 | |||||||
| SUP-d5 | 0.01 | |||||||
| SUB-d5-half-sig0 | 0.01 | |||||||
| SUB-d5-e1 | 0.1 | |||||||
| SUB-d5-half | 0.01 | |||||||
| SUB-d5-half-cnv | 0.01 | |||||||
| SUB-d5-half-adia | 0.01 | |||||||
| SUP-nd | – | – | – | |||||
| SUB-nd | – | – | – |
2.2 numerical simulations
We solve equations 1 and 3 using an improved version of the code FARGO3D with a more efficient velocity update method, which also allows for effective parallelization of multiple fluids (Krapp & Benítez-Llambay, 2020). We perform global three-dimensional simulations on a spherical mesh centered at the star, with coordinates . The numerical domain comprises only half of the disk in the vertical direction, with and . Results will also be described as a function of spherical coordinates centered at the planet defined as , which is a coordinate transformation rather than the simulated domain.
We use a non-uniform static mesh in and , defined to provide adequate resolution at the Hill sphere and close to the mid-plane where dust settles. The grid is obtained using the grid density function (Benítez-Llambay & Pessah, 2018). For the radial coordinate , , and , whereas for the vertical polar coordinate we set , , and . This configuration provides about cells at the Bondi radius for the runs in the radial and vertical direction with .
Unlike and , the grid is uniform in the azimuthal direction, which is required for this implementation of the FARGO scheme for orbital advection (Masset, 2000). To achieve a resolution at the Bondi radius comparable to that of the radial and vertical direction we set . In all the runs the softening length is set to approximately two cells in the azimuthal direction. A numerical convergence study of our simulations is presented in Appendix A.
2.2.1 Boundary conditions
At the inner and outer disk radius we employ reflecting boundary conditions for and . The gas density and azimuthal velocity are extrapolated to match the initial conditions, whereas for the dust, the radial derivatives of the density and dust azimuthal velocity are set to zero. We additionally include wave-damping buffer zones that restore the density to the initial value while preventing undesired reflections that may perturb the flow (de Val-Borro et al., 2006).
At the upper boundary, the gas density and azimuthal velocity are extrapolated to match the initial conditions, while for the dust . A reflecting boundary is adopted for and . Since we simulate only one disk hemisphere, we also adopt reflecting boundary conditions at the disk equator for and , otherwise, the latitudinal derivative is set to zero. The initial conditions and parameters of all simulations are described in Section 2.3 and Table 2.1.
2.3 Disk Model
Our base disk model is adapted from Appendix A of Masset & Benítez-Llambay (2016). We adopt as a reference distance to the central star the planet semi-major axis, and typically quote time in units of the inverse of the orbital frequency . The gas sound speed and disk aspect ratio are defined as
| (7) |
where is the Keplerian velocity. We set to simulate a disk with constant aspect ratio, that is a gas scale-height . We fix the disk aspect ratio to in all our runs. The gas density is given by
| (8) |
with and the surface density , which corresponds to at . The radial and vertical velocity are set to zero, wheres the azimuthal velocity is
| (9) |
The gas viscosity corresponds to , with the orbital Keplerian frequency. The values of adopted for each run are shown in Table 2.1.
The dust azimuthal velocity is initialized with a Keplerian rotation profile; although this neglects the size-dependent impact of gas drag, the velocities quickly re-adjust under the influence of the sub-Keplerian gas. The dust density of the -th species is given by
| (10) |
where
| (11) |
where is the total dust-to-gas mass ratio in the simulated domain. We fix and consider dust-species with , which corresponds to nearly -size particles at the Hill radius assuming in the adopted disk model. The aspect-ratio of the th dust-species, , is obtained from the settling and diffusion equilibrium of dust particles (e.g., Dubrulle et al., 1995),
| (12) |
where is a free parameter that sets the scale-height of the dust, , from the balance between settling (due to vertical stellar gravitational acceleration) and the diffusion flux defined in Eq. 2. The diffusion coefficient ; the value of is shown in (see Table 2.1) for each run.
Note that in absence of a self-consistent mechanism that sustains particles above the mid-plane, the choice of is unconstrained. However, in viscous disk models meant to approximate isotropic turbulent diffusion, it is usually assumed that is of the order of the effective viscosity parameter . Moreover, since the diffusion coefficient satisfies for , we safely neglect the size dependency of the diffusion coefficient(e.g., Youdin & Lithwick, 2007). Therefore, the adopted initial settling equilibrium may slightly deviate from that obtained with self-consistent stirring at scales (see e.g., Fromang & Nelson, 2009). The dust distributions are fixed for each run and do not account for coagulation, collisions, or evaporation of larger solids, which would also alter the opacity and size distributions.
2.4 Planet Model
Most of our analysis focuses on the gas and dust dynamics at the Hill and Bondi spheres, with radius and , respectively. We refer to the gas on these scales as part of the planet’s envelope, regardless of whether the gas is bound to the planet or cycling through. Because our simulations are locally isothermal, these definitions are fixed throughout each run. We consider only two planet masses (see Table 2.1), and denote our simulations with the prefix SUB (sub-thermal) when , where is the disk thermal mass. Equivalently, the prefix SUP is used accordingly for runs with (super-thermal). The planet is implemented as a potential only, meaning that the initial conditions within the Hill sphere are identical to that in the disk. We do not consider any accretion sink for the planet, that is we do not remove mass and momentum inside the smoothing length. The resolution of our 3D global simulations is adequate to capture the dynamics at the interface between the planet envelope and the protoplanetary disk. This interface is traditionally defined as , although it is a reference location, not a sharp barrier.
![[Uncaptioned image]](/html/2110.02428/assets/fig10c.png)
![[Uncaptioned image]](/html/2110.02428/assets/fig10d.png)
We adopt a criterion for transition between optically thick and thin regimes when . Note that this is consistent with a criterion given by (e.g., Rafikov, 2006) for planets with nearly one thermal mass.
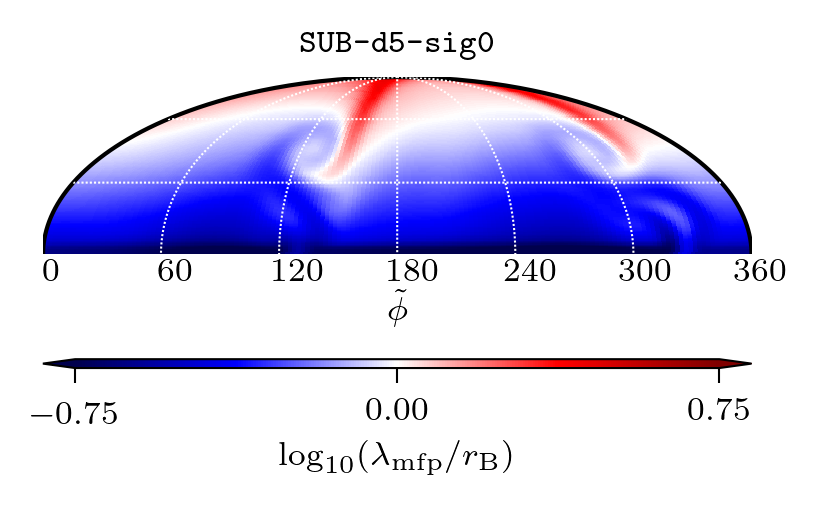
In Fig. 2.1 we show for different disk models, with variable gas surface density, diffusion parameters, and dust properties, assuming the opacity gradient is set soley by dust settling. The top left panel corresponds to a case similar to SUB-d5-sig0, while the others were obtained for a Minimum Mass Solar Nebula (MMSN) disk model (Hayashi, 1981). Note that the MMSN models are flared, rather than constant aspect ratio. For all disk models, the well-mixed distribution of solids has a transition between optically thin and optically thick regimes that is mainly a function of the radial distance to the central star for .
On the other hand, when accounting for settling, we find a shallower transition between the two regimes as a function of radius. Therefore the envelopes of sub-thermal mass planets may be optically thick near the mid-plane and optically thin near the polar regions. This transition is confirmed for our run SUB-d5-sigma0 (see Fig. 11) where the planet is assumed to be at from the central star.
As can be appreciated from Fig. 2.1, the transition near is more likely to occur at intermediate regions of PPDs, whereas inner regions are optically thick and outer regions are optically thin. At a distance from the star , such a transition would likely occur in nearly laminar and/or gas depleted disks, as the required settling-diffusion equilibrium parameter should be .
We emphasize that the estimates of strongly depend on the size distribution and the adopted disk model. In particular, the gas surface density and the diffusion parameter will set the equilibrium scale height of dust grains. In addition, the maximum grain size and the slope of particle-size distribution also impact the mean free path transition as they set the mass load towards the micron sizes grains for a fixed dust-to-gas ratio.
The results obtained in Fig. 2.1 and Fig. 11 suggest that some planets may occupy a regime not captured by 1D models that are either purely thick () or thin regimes (), as studied in Rafikov (2006); Future 1D models may benefit from seeking an approximation that captures the transition of reported in this work.
Similar axisymmetric dust opacity calculations have been used to study thermal relaxation in PPDs including the exchange of energy between gas and dust via collisions (Malygin et al., 2017; Barranco et al., 2018; Bae et al., 2021), and self-consistent coagulation models (Sengupta et al., 2019; Chachan et al., 2021). Ultimately, whether the observed latitudinal gradient plays a significant role in the thermodynamic evolution of planets requires properly coupling the planet radiation, dust distribution, and disk hydrodynamics.
5 Conclusions
In this work, we have performed three-dimensional multi-fluid simulations of nearly thermal mass planets embedded in a protoplanetary disk. Our simulations, applied to a standard disk model with a planet at 5.2(30) AU, allowed us to characterize a dust-distribution with particle sizes spanning from () to () at the Bondi sphere of a Earth-mass planet and at the Hill sphere of a Earth-mass planet 555Since we assume a constant aspect ratio in our simulated disks, the planet thermal masses considered at and AU are the same.. While we have included dust feedback in all our runs, a comparison with gas-only simulations confirmed the overall planet atmospheric structure is insensitive to the dust drag-force, at least for dust-to-gas mass ratios of .
We found that the dust equilibrium scale-height plays a primordial role in setting the much stronger latitudinal gradient of the (azimuthally averaged) opacities. The planet’s gravitational force only modestly steepens the latitudinal gradient at the scales of the Bondi and Hill semi-spheres.
Our numerical simulations revealed the presence of a persistent anisotropy in the dust opacities on the relevant scales of and . The anisotropy is established after two planetary orbits and remains in a steady-state up to orbits. While smaller grains have even longer settling times, they are more well-mixed and do not significantly participate in the anisotropy. We find that spiral wakes from the planet generically introduce azimuthal dust asymmetries near the mid-plane.
Our results indicate that planetary envelopes may have a latitudinal transition between optically thin and optically thick regimes, which may limit the applicability of 1D models where such a transition cannot be captured. This transition is likely to occur when the scale-height of grains that set the peak wavelength of a black body radiation is smaller than the planet Bondi radius. At temperatures between K to K, the peak wavelength correspond to grains with sizes smaller than . Hence we expect that disks with lower surface densities and/or weaker gas stirring will show this transition. We found that for standard MMSN surface density and settling parameters the transition between optically thick and thin regimes occurs for nearly thermal mass planets at .
A latitudinal transition in the mean-free-path differs from the traditional, symmetric case where envelopes are either optically thick or thin (see e.g., Rafikov, 2006; Lee & Chiang, 2015). Moreover, the three-dimensional dust-dynamics produces an opacity that can deviate from opacity calculations based on the results from Bell & Lin (1994) and Semenov et al. (2003). The integrated opacity, and consequently the cooling time, is reduced in comparison with that obtained from a well-mixed size distribution (see for example cases with ), which could favor the faster growth of massive planets (Hubickyj et al., 2005; Movshovitz et al., 2010). Note that our opacity calculations for a planet at show even larger opacity gradients, and smaller integrated opacities, implying a greater impact on planets forming in the outer regions of PPDs.
To better understand the scope of our results, future simulations should include turbulence and/or winds as a mechanism of stirring dust, rather than a standard diffusion flux. We, however, stress that the assumed dust equilibrium scale-height are in reasonable agreement with regimes dominated by Magneto Rotational Instability (MRI) turbulence (Flock et al., 2017) and MHD winds at (e.g., Riols & Lesur, 2018). Moderate-to-strong settling of dust grains in outer regions of PPD has been also inferred from observations of HL Tau (Pinte et al., 2016). Note that this is not necessarily the case for self-consistent stirring driven by turbulence as a byproduct of the Vertical Shear Instability (VSI) (see e.g, Stoll & Kley, 2016; Picogna et al., 2018; Flock et al., 2017).
Ultimately, three dimensional multi-fluid simulations coupled with self-consistent radiative transfer are required to fully address the scope of our results. In addition to impacts on cooling and accretion rates, we anticipate that our results may also have implications for thermal physics of the heating torque (Benítez-Llambay et al., 2015), the evolution of eccentricity and inclination of hot protoplanets (e.g., Eklund & Masset, 2017; Chrenko et al., 2017) and the excitation of buoyancy resonances (e.g., Zhu et al., 2012; Lubow & Zhu, 2014; McNally et al., 2020; Bae et al., 2021).
6 Software and third party data repository citations
All the data was generated with a modified version of the open-source software FARGO3D available at https://bitbucket.org/fargo3d/public.git. The data underlying this article will be shared on reasonable request to the corresponding author.
Appendix A Convergence with numerical resolution
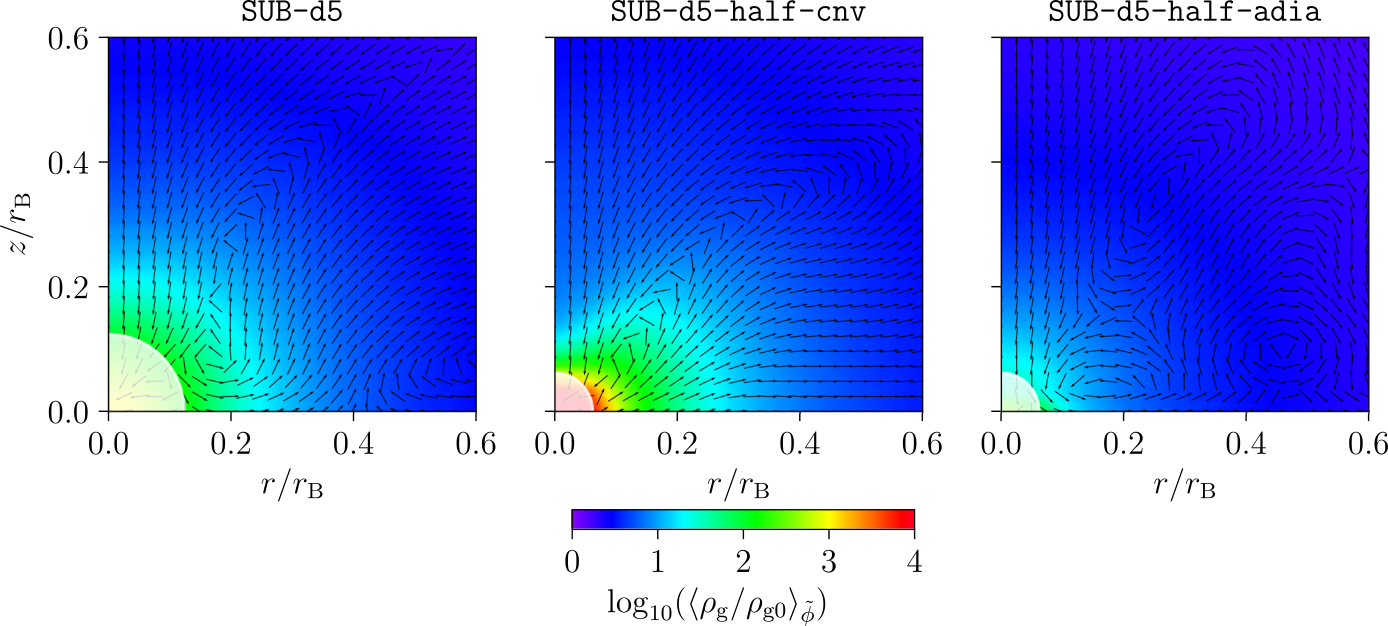
To validate our results, we perform a resolution study varying the number of grid cells across the Bondi radius and the extent of the azimuthal domain. We also benchmark our results against both isothermal and adiabatic simulations from the literature with planet mass . Referencing table 2.1, we utilize runs SUB-d5, SUB-d5-half, SUB-d5-half-cnv and SUB-d5-half-adia.
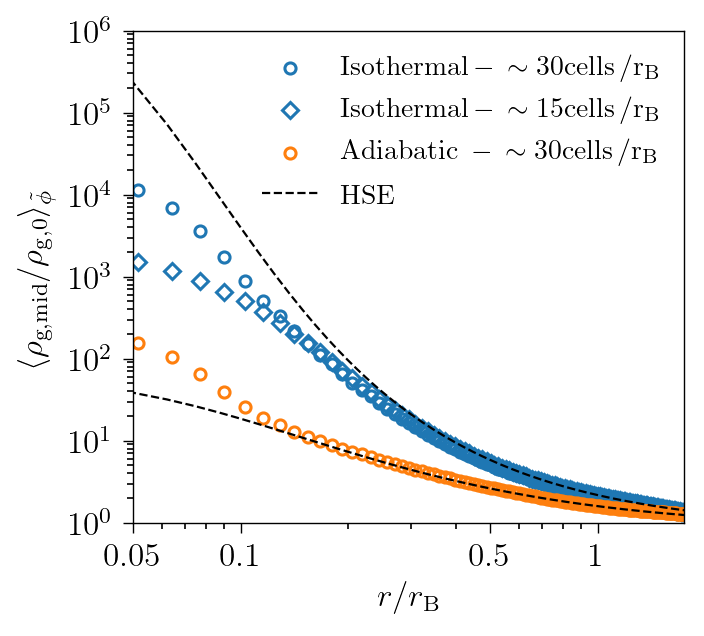
We focus our literature comparisons on Fung et al. (2019), who performed 3D global simulations to study the formation of circumplanetary disks, employing an isothermal and an adiabatic equation of state. They found that envelopes of sub-thermal mass planets are nearly in hydrostatic equilibrium with little rotational support at the scales of the Bondi radius. Neglecting the stellar potential, the hydrostatic equilibrium around the planet gives a density profile that follows as
| (A1) |
for the isothermal case, whereas for the adiabatic equation of state (assuming an isentropic process) the density profile is
| (A2) |
where is the adiabatic index and is the smoothing length (for the runs SUB-d5-half-cnv and SUB-d5-half-adia is about six percent of the Bondi radius).
In the left panel of Fig. 12 we compare the radial profile for the runs SUB-d5, SUB-d5-half-cnv and SUB-d5-half-adia with the solutions given in Eqs. A1 and A2. In all cases the numerical solutions are in good agreement with the hydrostatic equilibrium solution at . The differences between the density profiles at are driven by the choice of smoothing length, which is set to 2 cells in azimuth, 2.3 cells in radius and 3 cells in latitude.
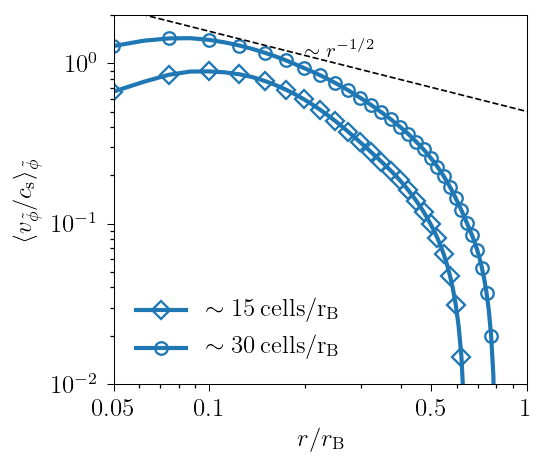
In the middle panels of Fig. 12, we show the radial profile of the azimuthal velocity in a cylindrical coordinate system centered on the planet. The profiles were calculated in the mid-plane after taking the azimuthal average on a cylindrical mesh centered on the planet. Pressure support dominates from the outermost regions of the Bondi sphere down to . These results are in agreement with previous work showing increasing rotational support closer to the planet, where circumplanetary disks can for (Fung et al., 2019). Our resolution is insufficient to identify any Keplerian rotation below .
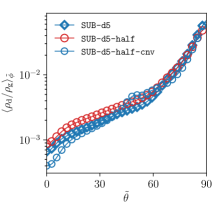
In the rightmost panel of Fig. 12 we show the azimuthal average of the total dust-to-gas density ratio at the Bondi sphere for the runs SUB-d5 (full azimuthal domain), SUB-d5-half and SUB-half-cnv (half azimuthal domain). The mean dust-to-gas density ratio is in good agreement for the runs SUB-d5 and SUB-d5-half, indicating that the choice of a half-domain in azimuth may not affect the overall dust-density and therefore opacity distribution at the scales of the Bondi sphere.
At scales of , the runs have not entirely converged in the polar regions. We found that the dust-to-gas density ratio is more depleted at regions for the case SUB-half-cnv. This has an impact on the opacity gradient as mentioned in Section LABEL:sec:results_opacity. More precisely, we found that the integrated inverse opacity is smaller than the well-mixed case for the run SUB-d5, whereas the largest resolution gives a discrepancy of . Thus we expect that our results are conservative, in that we have likely underestimated the magnitude of the opacity gradient.
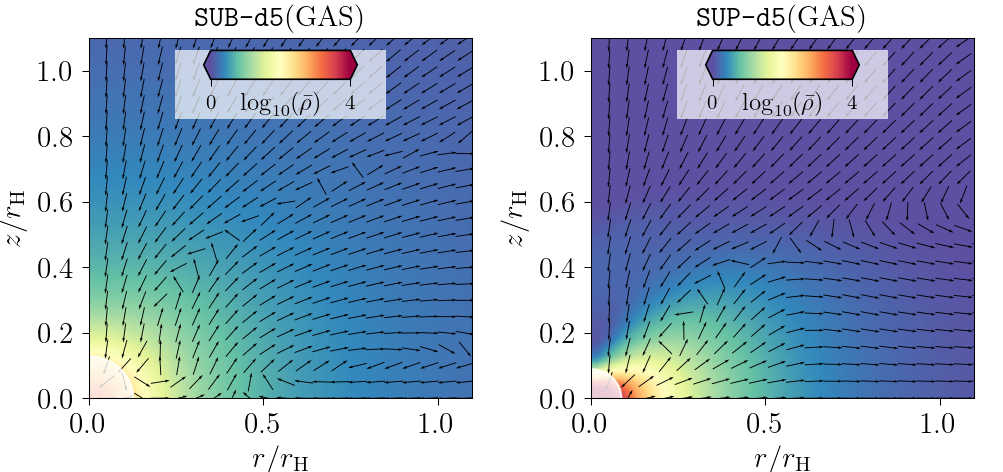
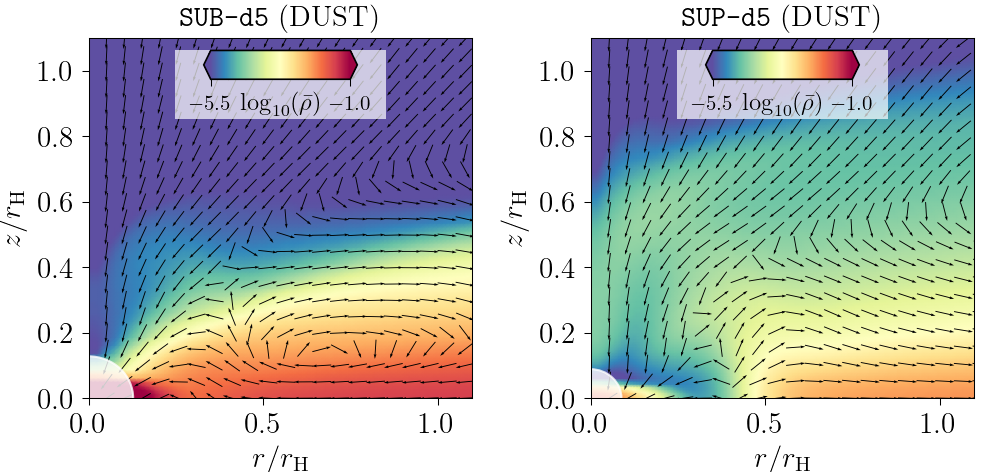
Finally, in Fig. 13, we show the azimuthal average of the density along with the meridional velocity field for the same runs displayed in Fig. 12. Our results are in good agreement with those described in (Fung et al., 2019). Note that the detailed behavior of the flow at may not be accurate given the simulations typically have cells at that radius, except for runs and where we have cells at half of the Bondi radius. Our comparison suggest that a minimum of is required to characterize the meridional circulation pattern and dust density distribution below half of the Bondi radius. Moreover, for the explored parameters and timescales (less than 100 orbits) we found that simulations with reduced azimuthal domain may help to expedite the calculations without significantly affecting the dynamics near the planet.
References
- Alibert et al. (2018) Alibert, Y., Venturini, J., Helled, R., et al. 2018, Nature Astronomy, 2, 873, doi: 10.1038/s41550-018-0557-2
- Ayliffe & Bate (2009) Ayliffe, B. A., & Bate, M. R. 2009, MNRAS, 393, 49, doi: 10.1111/j.1365-2966.2008.14184.x
- Bae et al. (2021) Bae, J., Teague, R., & Zhu, Z. 2021, ApJ, 912, 56, doi: 10.3847/1538-4357/abe45e
- Barranco et al. (2018) Barranco, J. A., Pei, S., & Marcus, P. S. 2018, ApJ, 869, 127, doi: 10.3847/1538-4357/aaec80
- Bate et al. (2003) Bate, M. R., Lubow, S. H., Ogilvie, G. I., & Miller, K. A. 2003, MNRAS, 341, 213, doi: 10.1046/j.1365-8711.2003.06406.x
- Bell & Lin (1994) Bell, K. R., & Lin, D. N. C. 1994, ApJ, 427, 987, doi: 10.1086/174206
- Benítez-Llambay et al. (2019) Benítez-Llambay, P., Krapp, L., & Pessah, M. E. 2019, ApJS, 241, 25, doi: 10.3847/1538-4365/ab0a0e
- Benítez-Llambay et al. (2015) Benítez-Llambay, P., Masset, F., Koenigsberger, G., & Szulágyi, J. 2015, Nature, 520, 63, doi: 10.1038/nature14277
- Benítez-Llambay & Masset (2016) Benítez-Llambay, P., & Masset, F. S. 2016, ApJS, 223, 11, doi: 10.3847/0067-0049/223/1/11
- Benítez-Llambay & Pessah (2018) Benítez-Llambay, P., & Pessah, M. E. 2018, ApJ, 855, L28, doi: 10.3847/2041-8213/aab2ae
- Béthune & Rafikov (2019) Béthune, W., & Rafikov, R. R. 2019, MNRAS, 488, 2365, doi: 10.1093/mnras/stz1870
- Bi et al. (2021) Bi, J., Lin, M.-K., & Dong, R. 2021, ApJ, 912, 107, doi: 10.3847/1538-4357/abef6b
- Binkert et al. (2021) Binkert, F., Szulágyi, J., & Birnstiel, T. 2021, arXiv e-prints, arXiv:2103.10177. https://arxiv.org/abs/2103.10177
- Birnstiel et al. (2018) Birnstiel, T., Dullemond, C. P., Zhu, Z., et al. 2018, The Astrophysical Journal, 869, L45, doi: 10.3847/2041-8213/aaf743
- Chachan et al. (2021) Chachan, Y., Lee, E. J., & Knutson, H. A. 2021, arXiv e-prints, arXiv:2101.10333. https://arxiv.org/abs/2101.10333
- Chrenko et al. (2017) Chrenko, O., Brož, M., & Lambrechts, M. 2017, A&A, 606, A114, doi: 10.1051/0004-6361/201731033
- Cimerman et al. (2017) Cimerman, N. P., Kuiper, R., & Ormel, C. W. 2017, MNRAS, 471, 4662, doi: 10.1093/mnras/stx1924
- D’Angelo & Bodenheimer (2013) D’Angelo, G., & Bodenheimer, P. 2013, ApJ, 778, 77, doi: 10.1088/0004-637X/778/1/77
- de Val-Borro et al. (2006) de Val-Borro, M., Edgar, R. G., Artymowicz, P., et al. 2006, MNRAS, 370, 529, doi: 10.1111/j.1365-2966.2006.10488.x
- Dipierro et al. (2018) Dipierro, G., Laibe, G., Alexander, R., & Hutchison, M. 2018, MNRAS, 479, 4187, doi: 10.1093/mnras/sty1701
- Dubrulle et al. (1995) Dubrulle, B., Morfill, G., & Sterzik, M. 1995, Icarus, 114, 237, doi: 10.1006/icar.1995.1058
- Eklund & Masset (2017) Eklund, H., & Masset, F. S. 2017, MNRAS, 469, 206, doi: 10.1093/mnras/stx856
- Epstein (1924) Epstein, P. S. 1924, Phys. Rev., 23, 710, doi: 10.1103/PhysRev.23.710
- Flock et al. (2017) Flock, M., Nelson, R. P., Turner, N. J., et al. 2017, ApJ, 850, 131, doi: 10.3847/1538-4357/aa943f
- Fouchet et al. (2007) Fouchet, L., Maddison, S. T., Gonzalez, J. F., & Murray, J. R. 2007, A&A, 474, 1037, doi: 10.1051/0004-6361:20077586
- Freedman et al. (2008) Freedman, R. S., Marley, M. S., & Lodders, K. 2008, ApJS, 174, 504, doi: 10.1086/521793
- Fromang & Nelson (2009) Fromang, S., & Nelson, R. P. 2009, A&A, 496, 597, doi: 10.1051/0004-6361/200811220
- Fung et al. (2015) Fung, J., Artymowicz, P., & Wu, Y. 2015, ApJ, 811, 101, doi: 10.1088/0004-637X/811/2/101
- Fung et al. (2019) Fung, J., Zhu, Z., & Chiang, E. 2019, ApJ, 887, 152, doi: 10.3847/1538-4357/ab53da
- Ginzburg & Chiang (2019) Ginzburg, S., & Chiang, E. 2019, MNRAS, 487, 681
- Gressel et al. (2013) Gressel, O., Nelson, R. P., Turner, N. J., & Ziegler, U. 2013, ApJ, 779, 59, doi: 10.1088/0004-637X/779/1/59
- Hayashi (1981) Hayashi, C. 1981, Progress of Theoretical Physics Supplement, 70, 35, doi: 10.1143/PTPS.70.35
- Hubickyj et al. (2005) Hubickyj, O., Bodenheimer, P., & Lissauer, J. J. 2005, Icarus, 179, 415, doi: 10.1016/j.icarus.2005.06.021
- Krapp & Benítez-Llambay (2020) Krapp, L., & Benítez-Llambay, P. 2020, Research Notes of the American Astronomical Society, 4, 198, doi: 10.3847/2515-5172/abc7be
- Kurokawa & Tanigawa (2018) Kurokawa, H., & Tanigawa, T. 2018, MNRAS, 479, 635, doi: 10.1093/mnras/sty1498
- Kuwahara & Kurokawa (2020) Kuwahara, A., & Kurokawa, H. 2020, A&A, 633, A81, doi: 10.1051/0004-6361/201936842
- Lambrechts & Johansen (2012) Lambrechts, M., & Johansen, A. 2012, A&A, 544, A32, doi: 10.1051/0004-6361/201219127
- Lambrechts et al. (2016) Lambrechts, M., Johansen, A., Capelo, H. L., Blum, J., & Bodenschatz, E. 2016, A&A, 591, A133, doi: 10.1051/0004-6361/201526272
- Lee & Chiang (2015) Lee, E. J., & Chiang, E. 2015, ApJ, 811, 41, doi: 10.1088/0004-637X/811/1/41
- Lissauer et al. (2009) Lissauer, J. J., Hubickyj, O., D’Angelo, G., & Bodenheimer, P. 2009, Icarus, 199, 338, doi: 10.1016/j.icarus.2008.10.004
- Lubow & Zhu (2014) Lubow, S. H., & Zhu, Z. 2014, ApJ, 785, 32, doi: 10.1088/0004-637X/785/1/32
- Malygin et al. (2017) Malygin, M. G., Klahr, H., Semenov, D., Henning, T., & Dullemond, C. P. 2017, A&A, 605, A30, doi: 10.1051/0004-6361/201629933
- Masset (2000) Masset, F. 2000, A&AS, 141, 165, doi: 10.1051/aas:2000116
- Masset & Benítez-Llambay (2016) Masset, F. S., & Benítez-Llambay, P. 2016, The Astrophysical Journal, 817, 19, doi: 10.3847/0004-637x/817/1/19
- McNally et al. (2020) McNally, C. P., Nelson, R. P., Paardekooper, S.-J., Benítez-Llambay, P., & Gressel, O. 2020, MNRAS, 493, 4382, doi: 10.1093/mnras/staa576
- Moldenhauer et al. (2021) Moldenhauer, T. W., Kuiper, R., Kley, W., & Ormel, C. W. 2021, A&A, 646, L11, doi: 10.1051/0004-6361/202040220
- Movshovitz et al. (2010) Movshovitz, N., Bodenheimer, P., Podolak, M., & Lissauer, J. J. 2010, Icarus, 209, 616, doi: https://doi.org/10.1016/j.icarus.2010.06.009
- Ormel & Klahr (2010) Ormel, C. W., & Klahr, H. H. 2010, A&A, 520, A43, doi: 10.1051/0004-6361/201014903
- Ormel et al. (2015) Ormel, C. W., Shi, J.-M., & Kuiper, R. 2015, MNRAS, 447, 3512, doi: 10.1093/mnras/stu2704
- Picogna et al. (2018) Picogna, G., Stoll, M. H. R., & Kley, W. 2018, A&A, 616, A116, doi: 10.1051/0004-6361/201732523
- Pinte et al. (2016) Pinte, C., Dent, W. R. F., Ménard, F., et al. 2016, ApJ, 816, 25, doi: 10.3847/0004-637X/816/1/25
- Piso & Youdin (2014) Piso, A.-M. A., & Youdin, A. N. 2014, ApJ, 786, 21, doi: 10.1088/0004-637X/786/1/21
- Piso et al. (2015) Piso, A.-M. A., Youdin, A. N., & Murray-Clay, R. A. 2015, ApJ, 800, 82, doi: 10.1088/0004-637X/800/2/82
- Podolak (2003) Podolak, M. 2003, Icarus, 165, 428, doi: 10.1016/S0019-1035(03)00207-0
- Pollack et al. (1994) Pollack, J. B., Hollenbach, D., Beckwith, S., et al. 1994, ApJ, 421, 615, doi: 10.1086/173677
- Pollack et al. (1996) Pollack, J. B., Hubickyj, O., Bodenheimer, P., et al. 1996, Icarus, 124, 62, doi: 10.1006/icar.1996.0190
- Rafikov (2006) Rafikov, R. R. 2006, ApJ, 648, 666, doi: 10.1086/505695
- Riols & Lesur (2018) Riols, A., & Lesur, G. 2018, A&A, 617, A117, doi: 10.1051/0004-6361/201833212
- Schulik et al. (2019) Schulik, M., Johansen, A., Bitsch, B., & Lega, E. 2019, A&A, 632, A118, doi: 10.1051/0004-6361/201935473
- Semenov et al. (2003) Semenov, D., Henning, T., Helling, C., Ilgner, M., & Sedlmayr, E. 2003, A&A, 410, 611, doi: 10.1051/0004-6361:20031279
- Sengupta et al. (2019) Sengupta, D., Dodson-Robinson, S. E., Hasegawa, Y., & Turner, N. J. 2019, ApJ, 874, 26, doi: 10.3847/1538-4357/aafc36
- Stoll & Kley (2016) Stoll, M. H. R., & Kley, W. 2016, A&A, 594, A57, doi: 10.1051/0004-6361/201527716
- Szulágyi et al. (2016) Szulágyi, J., Masset, F., Lega, E., et al. 2016, MNRAS, 460, 2853, doi: 10.1093/mnras/stw1160
- Tanigawa et al. (2012) Tanigawa, T., Ohtsuki, K., & Machida, M. N. 2012, ApJ, 747, 47, doi: 10.1088/0004-637X/747/1/47
- Wang et al. (2014) Wang, H.-H., Bu, D., Shang, H., & Gu, P.-G. 2014, ApJ, 790, 32, doi: 10.1088/0004-637X/790/1/32
- Weber et al. (2018) Weber, P., Benítez-Llambay, P., Gressel, O., Krapp, L., & Pessah, M. 2018, ApJ, 854, 153, doi: 10.3847/1538-4357/aaab63
- Whipple (1972) Whipple, F. L. 1972, in From Plasma to Planet, ed. A. Elvius, 211
- Youdin & Kenyon (2013) Youdin, A. N., & Kenyon, S. J. 2013, From Disks to Planets, ed. T. D. Oswalt, L. M. French, & P. Kalas, 1, doi: 10.1007/978-94-007-5606-9_1
- Youdin & Lithwick (2007) Youdin, A. N., & Lithwick, Y. 2007, Icarus, 192, 588, doi: 10.1016/j.icarus.2007.07.012
- Zhu et al. (2021) Zhu, Z., Jiang, Y.-F., Baehr, H., et al. 2021, arXiv e-prints, arXiv:2106.12003. https://arxiv.org/abs/2106.12003
- Zhu et al. (2012) Zhu, Z., Nelson, R. P., Dong, R., Espaillat, C., & Hartmann, L. 2012, ApJ, 755, 6, doi: 10.1088/0004-637X/755/1/6