Unveiling the coupling of single metallic nanoparticles to whispering-gallery microcavities
2 Max Plank Institute for Biophysical Chemistry, 37077 Göttingen, Germany
3 IV. Physical Institute, University of Göttingen, 37077 Göttingen, Germany
4ICFO-Institut de Ciencies Fotoniques, The Barcelona Institute of Science and Technology, 08860 Castelldefels (Barcelona), Spain
5ICREA-Institució Catalana de Recerca i Estudis Avançats, Passeig Lluís Companys 23, 08010 Barcelona, Spain )
Abstract
Whispering-gallery mode resonators host multiple trapped narrowband circulating optical resonances that find applications in quantum electrodynamics, optomechanics, and sensing. However, the spherical symmetry and low field leakage of dielectric microspheres make it difficult to probe their high-quality optical modes using far-field radiation. Even so, local field enhancement from metallic nanoparticles (MNPs) coupled to the resonators can interface the optical far-field and the bounded cavity modes. In this work, we study the interaction between whispering-gallery modes and MNP surface plasmons with nanometric spatial resolution by using electron-beam spectroscopies in a scanning transmission electron microscope. We show that gallery modes are induced over a selective spectral range of the nanoparticle plasmons, and additionally, their polarization can be controlled by the induced dipole moment of the MNP. Our study demonstrates a viable mechanism to effectively excite high-quality-factor whispering-gallery modes and holds potential for applications in optical sensing and light manipulation.
keywords:
electron microscopy; electron energy-loss spectroscopy; cathodoluminescence; whispering-gallery modes; metallic nanoparticlesIV. Physical Institute, University of Göttingen, 37077 Göttingen, Germany \alsoaffiliationICREA-Institució Catalana de Recerca i Estudis Avançats, Passeig Lluís Companys 23, 08010 Barcelona, Spain
The past few years have witnessed unprecedented advances in photonic technologies. In particular, plasmonics has attained the precise engineering of absorption and scattering properties of metallic nanoparticles due to improvements in synthesis methods 1, 2, 3, 4. At the same time, fabrication techniques have allowed the widespread use of whispering-gallery mode resonators (WGMRs), which have attracted strong interest in the context of quantum electrodynamics, 5, 6 optomechanics, 7, 8 and sensing applications 9, 10. The tuning capability of both technologies makes the study of coupled systems particularly interesting as we discuss throughout this work.
A physical description of WGMs was first proposed by Lord Rayleigh using acoustic waves circulating the dome of St. Paul’s Cathedral 11, while the electromagnetic-wave analog can be found in circular or spherical microstructures. Resonances are characterized by their transverse electric (TE) or magnetic (TM) polarization and a set of angular, radial, and azimuthal mode numbers (, , and ). Besides, WGMRs made from materials with low intrinsic loss, such as silica, can sustain modes that have exceptionally high quality factors 5 (Q factors).
Due to their high Q factor, coupling light to a WGMR is a challenging task. Efficient methods almost always rely on evanescent fields using gratings, prisms, or tapered fibers 12, 13, 14, 15. In particular, fiber tapering can reach coupling efficiencies as high as 99%, but requires active positioning to maintain this level of performance over long time periods. Free-space light is an alternative to evanescent coupling, but it has only encountered partial success with spheres 16, 17 and asymmetric cavities 18, 19 having high radiative losses due to the bounded nature of the gallery modes.
A practical solution to the problem is to couple an intermediate (e.g., plasmonic) nanoparticle to the gallery modes and to employ it as an evanescent light coupler into the WGM microresonator 20, 21, 22, 23. This approach has been successfully used to detect and characterize the nanoparticle using mode energy shifting 24, 25, 26, splitting, 27, 28 or broadening 29, 30 of the unperturbed resonances. Single-metallic-nanoparticle and gallery-mode coupling using far-field light has been studied for applications in photocatalysis, 31 as well as for engineering ultranarrow plasmonic resonances 32, 33. Selective coupling into TE and TM modes depending on the incident free-space light polarization has also been observed 34, finding interesting applications in sensing thanks to the clearer mode identification enabled by this method 10. However, a sufficient degree of spatial resolution to study the induced near electric field is still lacking on all of the mentioned studies.
An alternative to study nanoparticles with high spatial resolution is to use a scanning transmission electron microscope (STEM). Electron energy-loss spectroscopy (EELS) and cathodoluminescence (CL) spectroscopy are techniques that can be performed inside the STEM and can combine the sub-nm probe size with high spectral resolution (30 meV) when monochromatic electron sources are used. EELS and CL have been extensively explored to study small (radius 150 nm) spherical particles 35, 36, 37, including the observation of low-order optical modes in SiO2 spheres by Hyun et al. 38. Large spheres (radius 1.5 m) have been studied with electron beams using photon induced near-field electron microscopy 39, in which a few gallery modes have been observed due to the interaction of an externally applied optical field with the free electrons 40. More recently, Müller et al. have measured broadband light emission from high-Q WGMRs using fast electrons 41, but without the complementary information obtained from EELS. Most of these examples, however, could not resolve a large number of modes. Besides, the bare resonators did not offer much to be spatially explored due to their spherical symmetry.
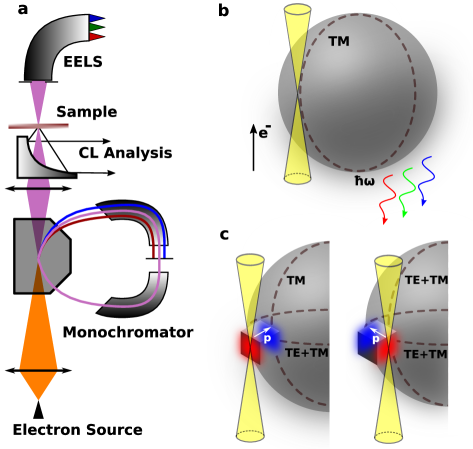
In this work, we study the coupling of an electron beam to large SiO2 spheres, in which the narrow-band resonances observed by EELS and CL are attributed to circulating gallery modes in the plane containing the electron trajectory. We explore the coupling of a single silver nanocube with the WGMR through the modulation of the low-Q resonances of the nanocube surface plasmons by the higher-Q gallery modes, as well as by a dependence of the gallery-mode polarization on the orientation of the electron-induced nanoparticle dipole moment, which can be achieved by changing the electron probe position 42, 43. Figure 1 presents a scheme of the experimental setup, as well as illustrations of the influence of the electron beam position on the excitation of modes with different polarizations.
The analytical solution of the energy loss probability of a fast electron upon interaction with a spherical dielectric body can be written as 44, 45, 46
| (1) |
where is a modified Bessel function of order , is the electron impact parameter with respect to the sphere center, and are the Mie scattering coefficients 47, 48, 49, which depend exclusively on the sphere radius and its dielectric function, and and are coupling coefficients that depend on the ratio of electron to light velocities . The photon emission probability can be written similarly by making the substitution 44. These simple results show that EELS (CL) is a well-fitted tool to study extinction (scattering) spectroscopy at the nanometer scale, as it is the case in smaller systems50.
We have used non-functionalized SiO2 spheres from BangsLabs Inc 51 ranging from 1.50 m to 2.00 m in radius for the experiments. We used a modified Nion Hermes 200 fitted with an Attolight Mönch CL system. The monochromatization scheme of the Hermes allows us to reach down to 5 meV spectral resolution and access to energies 40 meV at a nominal incident acceleration of 60 kV. This has enabled multiple works in the infrared regime, especially on phonons 52, 53, 54 and plasmons 55, 56. However, at higher acceleration energies and when focusing on relatively high energy losses and broader energy scales as explored in this work, a spectral resolution of 20 - 30 meV is more appropriate. Experimental results were interpreted by energy-loss simulations done by using a 3D finite-difference time-domain (FDTD) method available in Ansys Lumerical 57 and based on the work from Cao et al 58. Mie scattering calculations were used to estimate the sphere radius 49, 59. The dispersion values for the SiO2 response were taken from Malitson’s work 60.
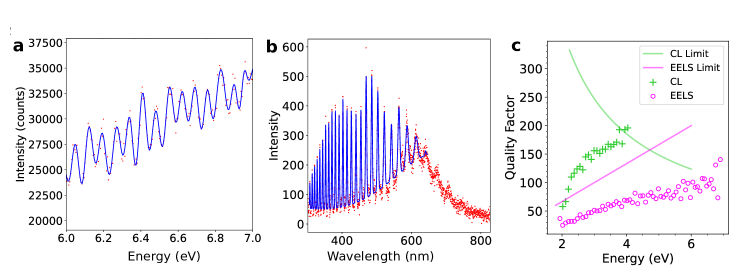
Figure 2 shows the combined results of EELS and CL using acceleration voltages of 200 kV and 100 kV for one bare sphere suspended on a carbon membrane of 20 nm thickness. More than 80 resonances were observed in the broadband excitation using 200 keV electrons in EELS, while no energy loss was observed for 100 keV due to the reduced coupling for slower electrons. In both the experimental results and the FDTD simulations, TE polarization is poorly excited by the fast electron, also as a consequence of eq 1 due to the smaller coupling terms of TE in comparison with TM for these electron energies.
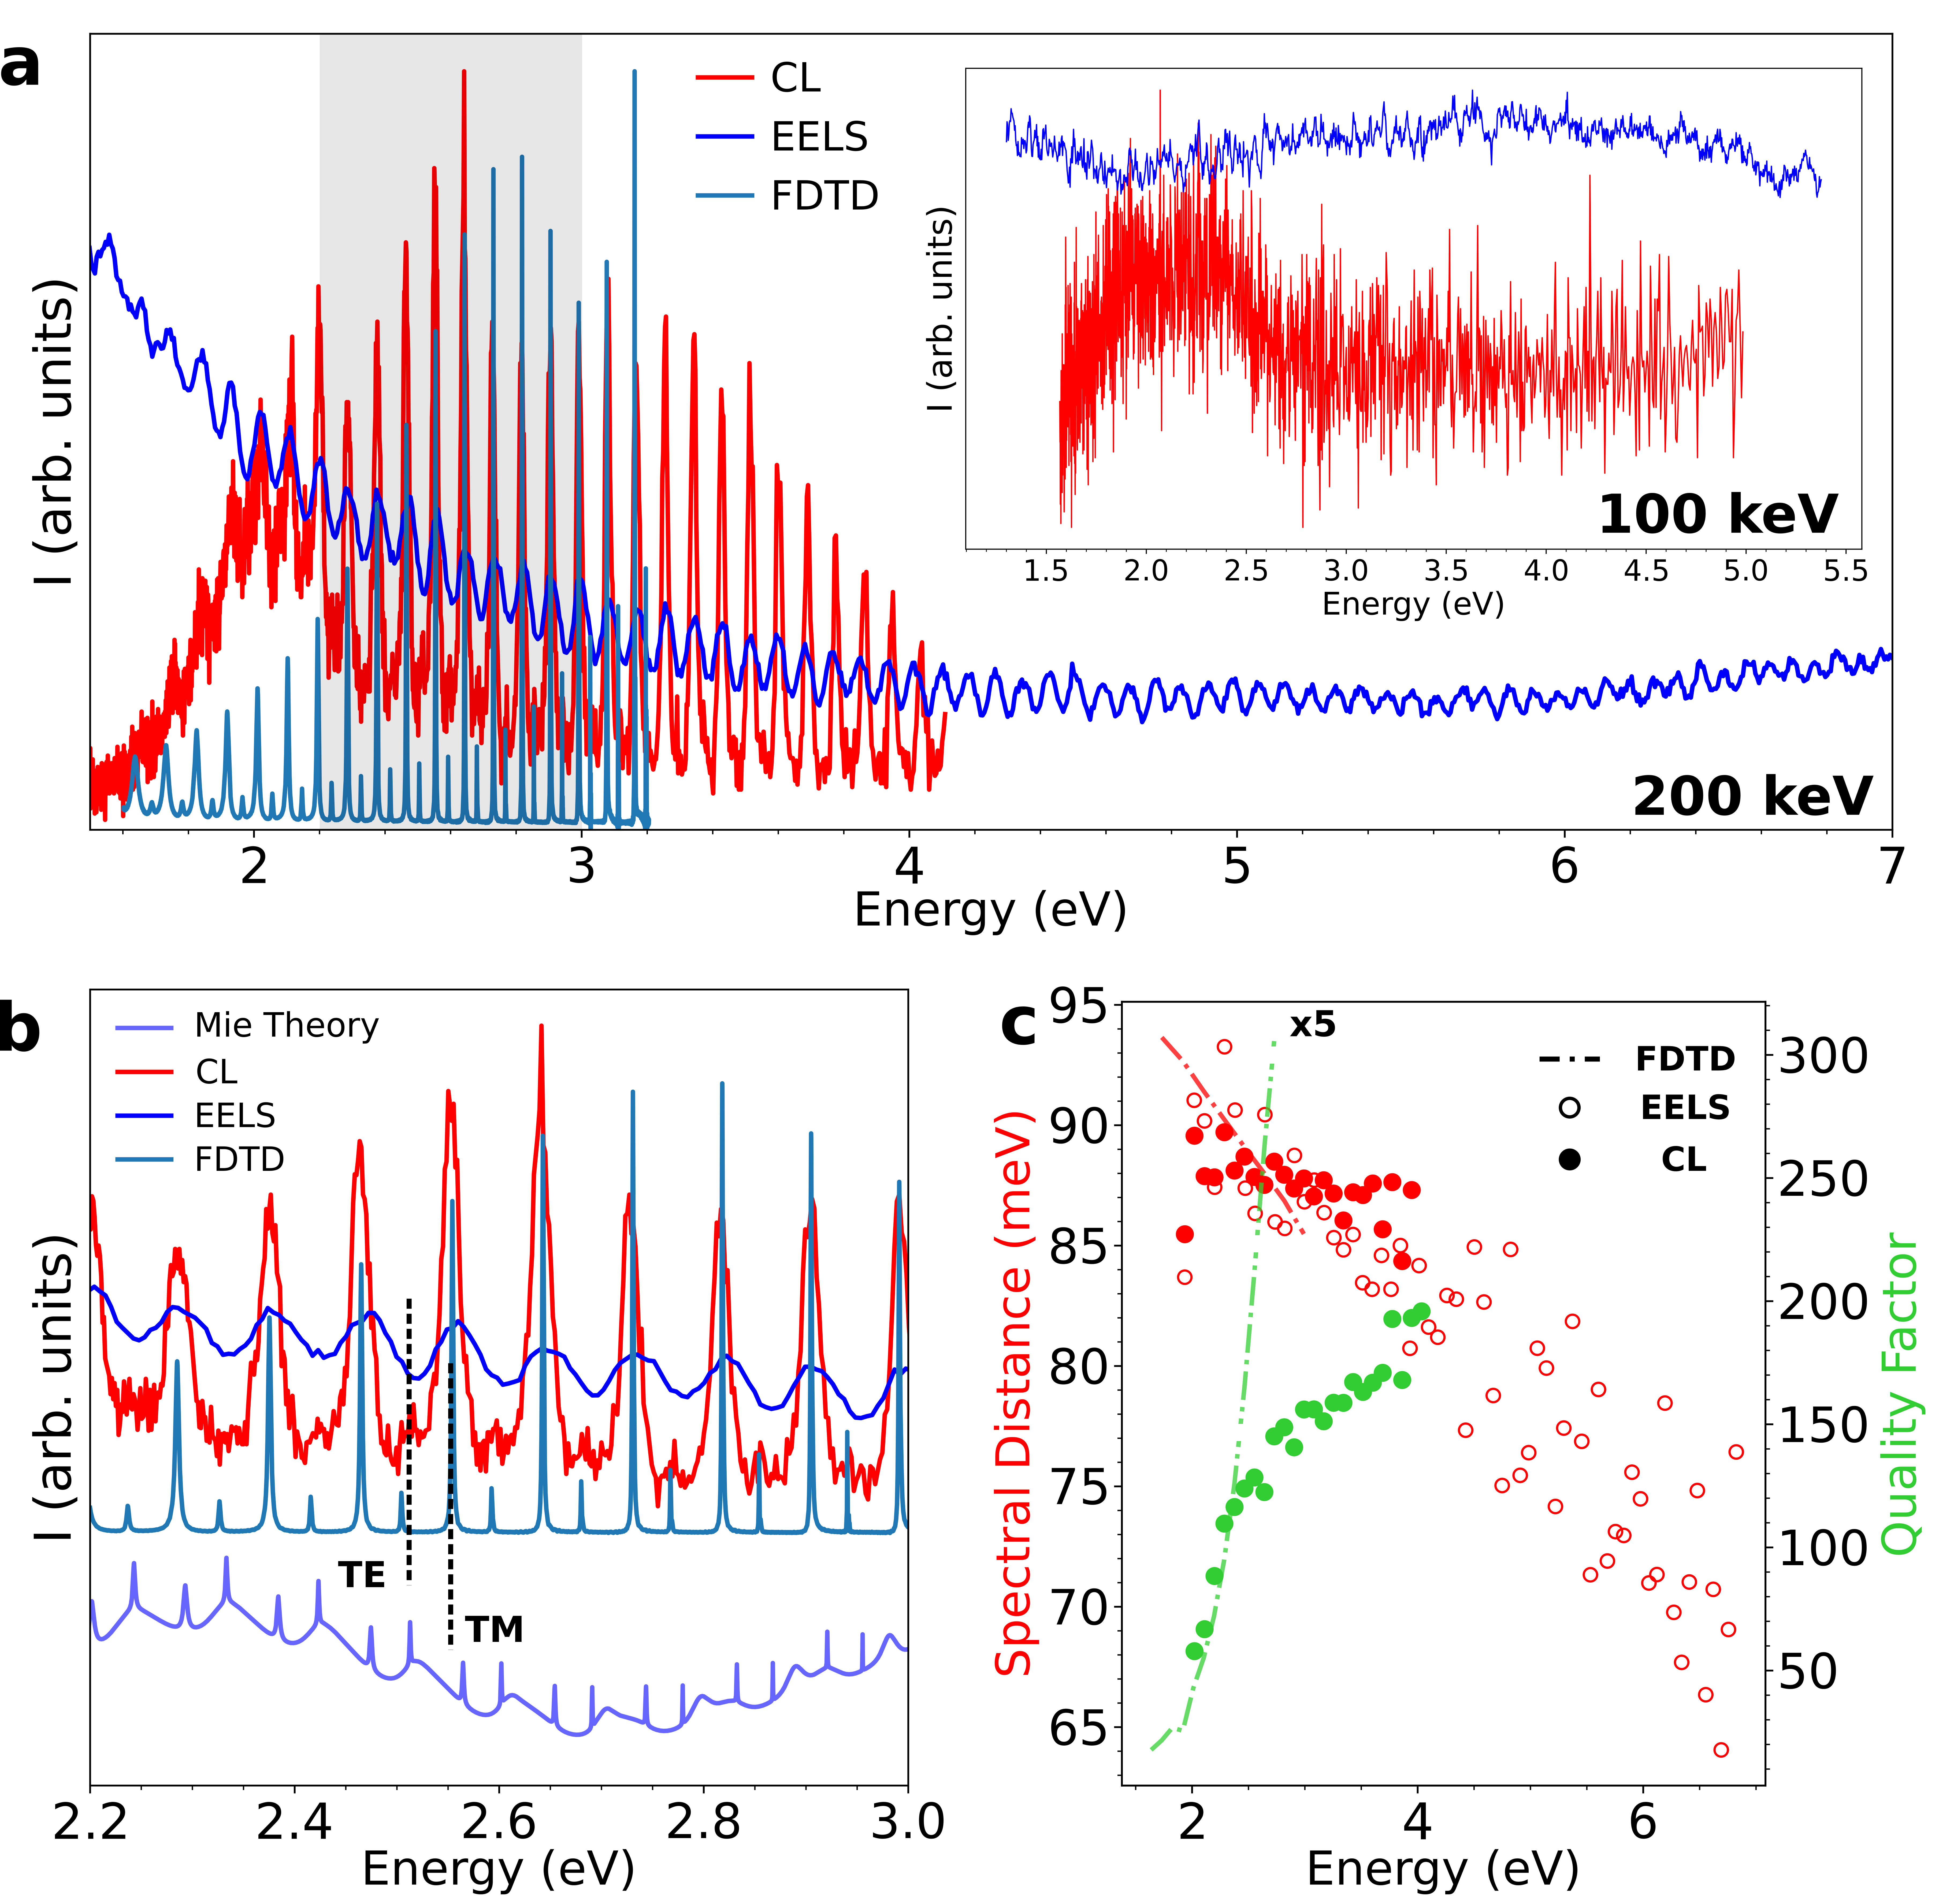
Each resonance in EELS and CL was fitted and the obtained center subtracted from the adjacent mode to form a spectral distance curve, which was subsequently compared with the theoretical free spectral range (FSR)61, 62. These values were used for modes from 2.0 eV to 3.0 eV to extract the effective index of refraction. The index was calculated to be 1.398 at 2.0 eV and 1.409 at 3.0 eV, which are values that agree within 95% with reference values 60. Beyond 3.0 eV, modes have Q factors exceeding from Mie Theory, which would be easily washed out by losses and finite energy resolution of our experimental setup. This is specially important for the far-UV resonances observed in EELS, as multiple sets of radial orders combined with the limited spectral resolution of the electron beam undermine mode order identification and the estimative of the index of refraction (see Supplementary Material (SM) for further details). The Q factors from FDTD follow an exponential-like profile as radiation leakage is the only source of loss in the simulation. The inflexion point near 2.8 eV in the experimental Q factor from CL can be attributed to a combination of experimentally induced losses, such as the effect of the carbon membrane and surface inhomogeneities, 61, 63 as well as the expected quality factor reduction from the increased radial order.
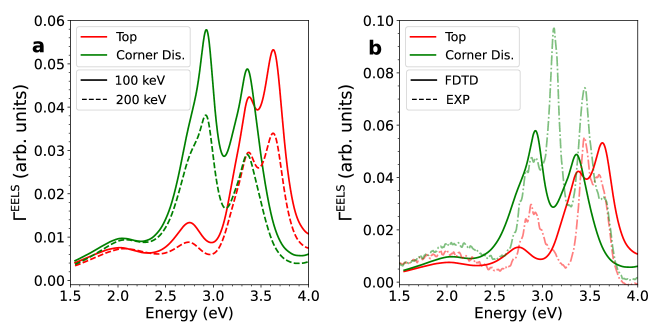
To study the coupling of nanoparticles with WGMRs, we have drop-casted silver nanocubes of 100 - 120 nm side length, synthesized by seed mediated growth, 64, 65 in the sample grid containing the SiO2 spheres. To mitigate the direct coupling of the electron beam with the WGMR, the electron acceleration is kept at 100 keV, where the coupling terms for angular modes are reduced by two orders of magnitude (see SM). In theory (for a lossless Drude Metal), bare nanocubes are known to support an infinity number of optical modes 66, 67, which are conventionally divided into corner (C), edge (E), and face (F) modes 68, 69, 70, 71. The presence of the SiO2 sphere, as a substrate, induces mode hybridization for each of the C, E, and F modes, leading to the so-called proximal and distal splitting in reference to the induced fields concentrated close or opposite to the substrate 72, 73, respectively. Figure 3 shows the most notable of these modes identified simultaneously by EELS and FDTD simulations, done by placing a 100 nm Ag nanocube on a 500 nm thick SiO2 plane substrate in order to observe the cube-substrate hybridization. Weak coupling between the gallery modes circulating in the sphere and the cube surface plasmons is observed in the spectral range of the dipolar mode (Dip) and, to a lower extent, in the first observed distal corner (DC1) resonance, as shown in Figure 3a.
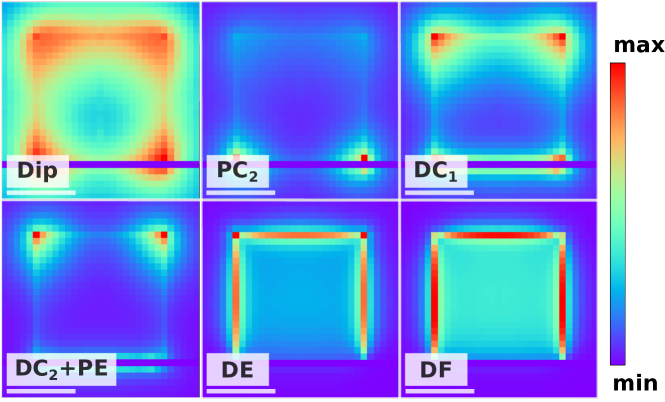
Loss spectra were studied with the electron probe positioned at the cube top (opposite edge from the substrate), side (lateral edge), distal corner (opposite corner from substrate), and proximal corner (closer corner to substrate) positions, which contain all possible symmetries of the problem. No gallery modes were observed in the proximal corner mode PC2, the second distal corner DC2, the proximal and distal edge modes (PE and DE, respectively), and the distal face mode DF, even though similar bare resonators exhibited detectable modes up to 7 eV under 200 keV electron excitation. This behavior can be attributed to the near-zero net dipole moment of these higher-order modes, and thus, the resulting electric field is not enough to be observed in the EELS spectrum. Figure 3c shows filtered spectral maps of the cube modes, which match the already-known tomographic reconstructions of this system 73 and were also observed in the FDTD simulations. The absolute value of the electric field obtained from FDTD for each of the cube modes is shown in the respective experimental cube map. Finally, we have performed FDTD simulations of an entire spectral image that confirm the observed spatial and spectral features of the nanocube (see SM).
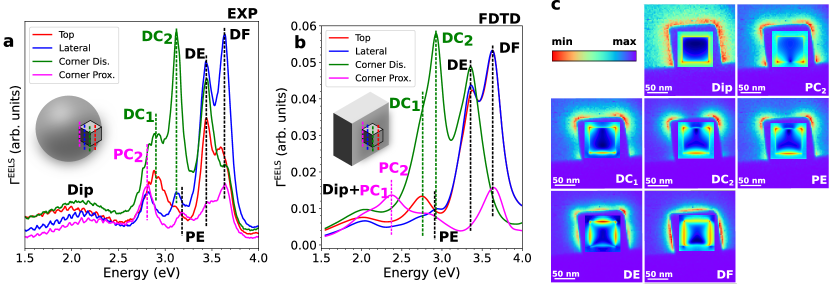
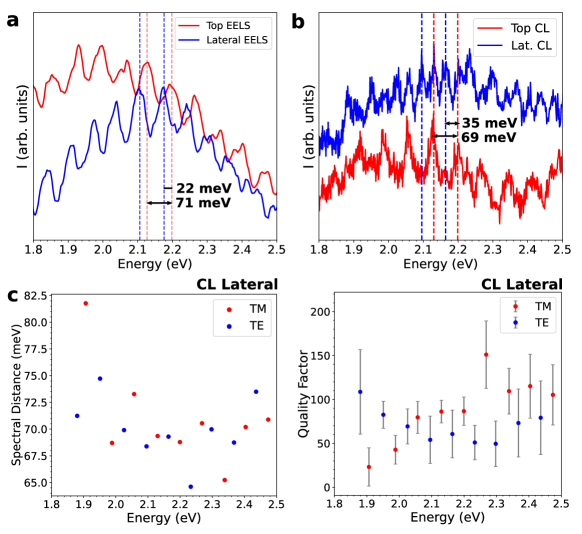
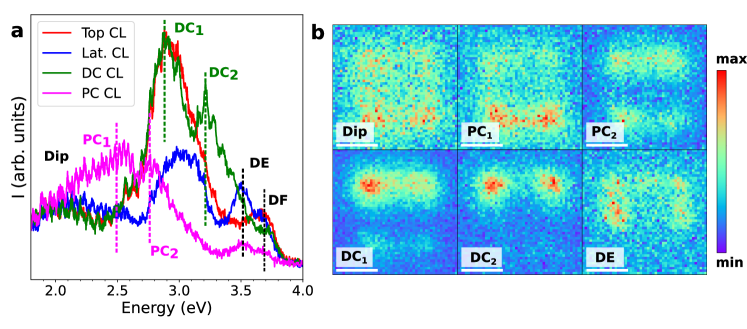
Due to the much more complex distribution of the local electric field associated with these higher-order modes, we have focused our analysis on the dipolar mode (Dip) of the cube, which is characterized by dipole moments along the three main symmetry directions. Within the dipolar picture, we suggest that different probe positions induce different gallery-mode polarizations that translate into net dipolar moment directions. As TE modes have no radial electric fields (), the top probe position primarily excites TM modes. If the probe is placed laterally to the cube, the resulting electric field is mostly tangential to the sphere surface and can thus excite both TE and TM modes 74, 34. The experimental results from EELS show resonances that are equally spaced by 71 meV for each top and lateral probe positions, but shifted 22 meV between each other, as shown in Figure 4. This value is smaller to the fwhm derived from the EELS spectra and therefore limits the resolution of possible neighboring TE and TM resonances. CL offers a simple solution to further explore the problem thanks to its superior spectral resolution.
The employed CL system is angle-selective and can only detect gallery modes that circulate close to the plane containing the electron trajectory due to the mirror position relative to the sample and the electron beam direction. Experimental CL results are shown in Figure 4b. For the top probe position, which induces a strong radial electric field, TM polarization is more clearly resolved, while for a lateral probe both sets of TM and TE resonances can be observed. The measured FSR is 69 meV and the TE-TM spectral distance can be directly determined with the lateral probe spectrum as 35 meV.
We have fitted the resonances measured in the lateral probe position and divided them into two different sets. Consecutive modes were subtracted to obtain a spectral distance curve and the standard deviation was used to estimate Q factors. We have also included error bars for the Q factors due to the non-negligible fitting uncertainties. The spectral distance curve shows no notable difference between polarizations, as expected from its definition. The Q factor for TE modes has a minimum value centered in the cube dipole resonance, which is expected because cube-induced losses are then maximal. For the TM modes, we observed a steady Q factor decrease down to the lowest energy resonance at 1.9 eV, but not a clear minimum. Unfortunately, the low emitted light intensity and the impossibility of easily changing the electron acceleration preclude further exploration of the coupled system.
It is worth mentioning that CL results outside the dipolar energy range were also obtained. While induced gallery modes were not observed in EELS for DC2 (Figure 3a), CL clearly displays a coupling component (Figure S5 in SM). This observation reinforces the argument that the coupling strength is dependent on the net dipole moment. Since CL measures the radiative component of the coupled plasmon-WGM mode, induced gallery modes can be observed. In addition, EELS is a combination of radiative and non-radiative losses and, because the non-radiative contribution only contains plasmonic losses and dominates over the radiative component, gallery modes are difficult to resolve in the EELS spectra.
To obtain further insight into the physics of the nanocube-sphere system, we have developed a semi-analytical model that captures the main elements of the experiment. In this model, the MNP is described as a dipolar scatterer of polarizability whose dielectric environment is modified by the presence of the dielectric sphere. The latter enters through a Green tensor that transforms the effective particle polarizability into , and whose components are obtained from the electric field induced at the position of a unit dipole placed at the nanocube center. We calculate from a finite-difference method (see Figure S6 in SM) and using the boundary-element method 46 in the presence of the sphere.
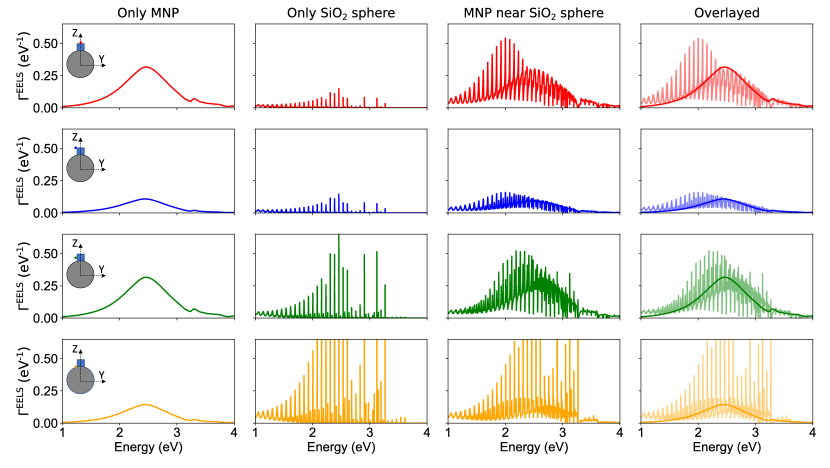
These elements are represented in Figure 5b, where is found to change its sign around 2.5 eV, indicating the emergence of a prominent particle plasmon, whereas displays sharp oscillations revealing the effect of coupling to the Mie modes of the sphere. For comparison, we show for a planar silica surface, which shows a featureless profile. From these considerations, we understand that we are in the weak-coupling regime because the lifetime of the MNP dipole is much smaller than that of the whispering-gallery modes, so that the imaginary part in the denominator of remains relatively large and dominated by the nanocube component. Then, the optical response of the MNP-sphere hybrid system is enhanced at the points in which the real part of the denominator is cancelled, as indicated by the crossings between and in Figure 5b. The effective dipole induced on the particle receives contributions associated with different scattering paths, as schematically shown in Figure 5a. Namely, it is contributed by the direct field produced by the electron (), as well as by the scattering of this field at the sphere () and the scattering of the dipole field at the sphere acting back on the dipole (); these contributions are all captured in , from which a scattering series can directly be constructed by Taylor expanding it in powers of .
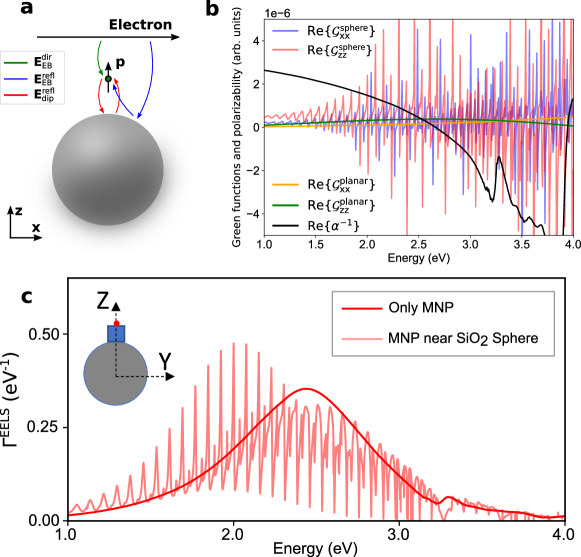
To calculate EELS in this analytical model, we use the multiple-elastic-scattering of multipole expansions (MESME) method 75 with the sphere and the MNP acting as scattering centers. In particular, the sphere is described by multipoles up to order and the MNP through the electric dipolar components of the scattering matrix. This method captures all scattering paths schematically represented in Figure 5a. The results presented in Figure 5c confirm the analysis based on : the EELS probability with the MNP alone exhibits a prominent plasmon, but it is modulated through coupling to Mie resonances of the sphere in a way similar to that observed in experiment. Note that the model successfully describes the sphere and MNP coupling within the dipolar picture, but it does not account for higher-order plasmon modes. In this sense, although Figure 5 shows gallery modes along the entire displayed energy range, they are not observed in Figure 3a because higher-order modes mask the tail of the dipolar resonance. Further discussion of the analytical model can be found in the SM.
In conclusion, we have described, with high spatial resolution, the coupling of MNPs to WGMRs using fast electrons, observed from both energy absorption (EELS) and light emission (CL) measurements. While CL can be used to improve the experiment spectral resolution, EELS provides rich and complete absorption information over a large spectral range: a compelling example on how EELS and CL can be used together to provide self-complementary information. The combined EELS-CL measurements would be even more relevant if the electron energy could be changed without causing major microscope misalignment. Beyond its remarkable agreement with experiments, FDTD-simulated energy-loss spectroscopy provides us with a deep physical insight into the coupling mechanism. Finally, the plasmon resonance excitation by the electron probe allows for the manipulation of the gallery-mode polarization by either coupling to TM or to both TM and TE resonances. With the advent of a new generation of monochromated STEMs, experiments requiring such high spectral and spatial resolution are now possible. With this work, we help to open the path for the high quality-factor and small modal volume photonic devices to be scrutinized in a STEM.
1 Supporting Information
The supporting information contains details on the electron coupling probability for bare WGMRs; fitting results for bare SiO2 spheres; FDTD simulations for the hybridization of cube modes on a flat SiO2 substrate; CL results for non-dipolar modes in the WGM-plasmon coupled system; theoretical details of the metallic nanoparticle polarizability; and additional results from the analytical model.
The present project has been funded partially by the National Agency for Research under the program of future investment TEMPOS-CHROMATEM (reference no. ANR-10-EQPX-50), from the European Union’s Horizon 2020 research and innovation programme undergrant agreement No 823717 (ESTEEM3) and 101017720 (EBEAM) and from the French National Research Agency (QUENOT ANR-20-CE30-0033). VM and FJGA acknowledge support from European Research Council (Advanced Grant No. 789104eNANO), Spanish MCINN (PID2020-112625GB-I00 and CEX2019-000910-S), Generalitat de Catalunya (CERCA and AGAUR), and Fundaciós Cellex and Mir-Puig.
2 Notes
MK patented and licensed technologies concerning the Attolight Mönch CL system and is a part-time consultant for the company. All other authors declare no competing financial interests.
References
- Link and El-Sayed 2000 Link, S.; El-Sayed, M. Shape and Size Dependence of Radiative, Non-Radiative and Photothermal Properties of Gold Nanocrystals. International Reviews in Physical Chemistry 2000, 19, 409 – 453
- Tian et al. 2002 Tian, Z.; Ren, B.; Wu, D. Surface-Enhanced Raman Scattering: From Noble to Transition Metals and from Rough Surfaces to Ordered Nanostructures. Journ. of Phys. Chem. B 2002, 106, 9463–9483
- Sun and Xia 2003 Sun, Y.; Xia, Y. Gold and silver nanoparticles: A class of chromophores with colors tunable in the range from 400 to 750 nm. The Analyst 2003, 128, 686–691
- Liz-Marzán 2004 Liz-Marzán, L. Nanometals: Formation and color. Materials Today 2004, 7, 26–31
- Vahala 2003 Vahala, K. Optical Microcavities. Nat. 2003, 424, 839–846
- Vernooy et al. 1998 Vernooy, D.; Furusawa, A.; Georgiades, N.; Ilchenko, V.; Kimble, H. Cavity QED with high-Q whispering gallery modes. Phys. Rev. A 1998, 57, 2293
- Wiederhecker et al. 2009 Wiederhecker, G.; Chen, L.; Gondarenko, A.; Lipson, M. Controlling photonic structures using optical forces. Nature 2009, 462, 633–636
- Kippenberg et al. 2005 Kippenberg, T.; Rokhsari, H.; Carmon, T.; Scherer, A.; Vahala, K. Analysis of Radiation-Pressure Induced Mechanical Oscillation of an Optical Microcavity. Phys. Rev. Lett. 2005, 95, 033901
- Zhu et al. 2010 Zhu, J.; Ozdemir, S.; Xiao, Y.; li, L.; He, L.; Chen, D.; Yang, L. On-chip single nanoparticle detection and sizing by mode splitting in an ultrahigh-Q microresonator. Nat. Photon. 2010, 4, 46–49
- Zheng et al. 2018 Zheng, Y.; Wu, Z.; Shum, P.; Xu, Z.; Humbert, G.; Zhang, H.; Zeng, S.; Dinh, X. Sensing and lasing applications of whispering gallery mode microresonators. Opto-Electronic Adv. 2018, 1, 1–15
- Rayleigh 1912 Rayleigh, L. CXII. The problem of the whispering gallery. Philosoph. Magaz. Ser. 6 1912, 20, 1001–1004
- Knight et al. 1997 Knight, J.; Cheung, G.; Jacques, F.; Birks, T. Phase-Matched Excitation of Whispering-Gallery-Mode Resonances by a Fiber Taper. Opt. Lett. 1997, 22, 1129–1131
- Braginsky et al. 1989 Braginsky, V.; Gorodetsky, M.; Ilchenko, V. Quality-factor and nonlinear properties of optical whispering-gallery modes. Phys. Lett. A 1989, 137, 393–397
- Cai et al. 2000 Cai, M.; Painter, O.; Vahala, K. Observation of Critical Coupling in a Fiber Taper to a Silica-Microsphere Whispering-Gallery Mode System. Phys. Rev. Lett. 2000, 85, 74
- Nussenzveig 1992 Nussenzveig, H. M. Diffraction Effects in Semiclassical Scattering; Montroll Memorial Lecture Series in Mathematical Physics; Cambridge University Press, 1992
- Matsko and Ilchenko 2006 Matsko, A.; Ilchenko, V. Optical Resonators With Whispering-Gallery Mode-Part I. Selected Topics in Quantum Electronics, IEEE Journal of 2006, 12, 3–14
- Miri and Mohammadzaheri 2014 Miri, N.; Mohammadzaheri, M. Optical Sensing Using Microspheres With Different Size and Material. Sens. Journ. 2014, 14, 3593–3598
- Liu et al. 2013 Liu, C.; Di Falco, A.; Molinari, D.; Khan, Y.; Ooi, B.; Krauss, T.; Fratalocchi, A. Enhanced energy storage in chaotic optical resonators. Nature Photonics 2013, 7, 473–478
- Lacey and Wang 2002 Lacey, S.; Wang, H. Directional emission from whispering-gallery modes in deformed fused-silica microspheres. Opt. Lett. 2002, 26, 1943–1945
- Kippenberg et al. 2009 Kippenberg, T.; Tchebotareva, A.; Kalkman, J.; Polman, A.; Vahala, K. Purcell-Factor-Enhanced Scattering from Si Nanocrystals in an Optical Microcavity. Phys. Rev. Lett. 2009, 103, 027406
- Motsch et al. 2009 Motsch, M.; Zeppenfeld, M.; Pinkse, P.; Rempe, G. Cavity-Enhanced Rayleigh Scattering. New Journ. of Phys. 2009, 12, 063022
- Mazzei et al. 2007 Mazzei, A.; Götzinger, S.; Menezes, L.; Zumofen, G.; Benson, O.; Sandoghdar, V. Controlled Coupling of Counterpropagating Whispering-Gallery Modes by a Single Rayleigh Scatterer: A Classical Problem in a Quantum Optical Light. Phys. Rev. Lett. 2007, 99, 173603
- Zhi et al. 2013 Zhi, Y.; Valenta, J.; Meldrum, A. Structure of whispering gallery mode spectrum of microspheres coated with fluorescent silicon quantum dots. Journ. Opt. Soc. Am. B 2013, 30, 3079–3085
- Vollmer et al. 2002 Vollmer, F.; Braun, D.; Libchaber, A.; Khoshsima, M.; Teraoka, I.; Arnold, S. Protein Detection by Optical Shift of a Resonant Microcavity. Appl. Phys. Lett. 2002, 80, 4057–4059
- Zhi et al. 2017 Zhi, Y.; Yu, X.; Gong, Q.; Yang, L.; Xiao, Y. Single Nanoparticle Detection Using Optical Microcavities. Adv. Mat. 2017, 29, 1604920
- Vollmer et al. 2009 Vollmer, F.; Arnold, S.; Keng, D. Single virus detection from the reactive shift of a whispering-gallery mode. Proceedings of the National Academy of Sciences of the United States of America 2009, 105, 20701–20704
- Weiss et al. 1995 Weiss, D.; Sandoghdar, V.; Hare, J.; Lefèvre-Seguin, V.; Raimond, J.; Haroche, S. Splitting of high-Q Mie modes induced by light backscattering in silica microspheres. Optics Lett. 1995, 20, 1835–1837
- Ozdemir et al. 2011 Ozdemir, S.; Zhu, J.; He, L.; Yang, L. Estimation of Purcell factor from mode-splitting spectra in an optical microcavity. Phys. Rev. A 2011, 83, 033817
- Shen et al. 2016 Shen, B.; Yu, X.; Zhi, Y.; Wang, L.; Kim, D.; Gong, Q.; Xiao, Y. Detection of single nanoparticles using the dissipative interaction in a high-Q microcavity. Phys. Rev. Appl. 2016, 5, 024011
- Shao et al. 2013 Shao, L.; Jiang, X.; Yu, X.; Li, B.; Clements, W.; Vollmer, F.; Wang, W.; Xiao, Y.; Gong, Q. Detection of Single Nanoparticles and Lentiviruses Using Microcavity Resonance Broadening. Adv. Mat. 2013, 25, 5616–5620
- Zhang et al. 2016 Zhang, J.; Jin, X.; Morales-Guzman, P.; Liu, H.; Zhang, H.; Razzari, L.; Claverie, J. Engineering the Absorption and Field Enhancement Properties of Au-TiO2 Nanohybrids via Whispering Gallery Mode Resonances for Photocatalytic Water Splitting. ACS Nano 2016, 10, 4496–4503
- Tong et al. 2015 Tong, L.; Wang, P.; Wang, Y.; Yang, Z.; Guo, X.; Lin, X.; Yu, X.; Xiao, Y.; Fang, W.; Zhang, L.; Lu, G.; Gong, Q. Single-Band 2-nm-Line-Width Plasmon Resonance in a Strongly Coupled Au Nanorod. Nano Lett. 2015, 15, 7581–7586
- Ai et al. 2018 Ai, Q.; Gui, L.; Paone, D.; Metzger, B.; Mayer, M.; Weber, K.; Fery, A.; Giessen, H. Ultranarrow Second-Harmonic Resonances in Hybrid Plasmon-Fiber Cavities. Nano Lett. 2018, 18, 5576–5582
- Gu et al. 2015 Gu, F.; Zhang, L.; Zhu, Y.; Zeng, H. Free-space coupling of nanoantennas and whispering-gallery microcavities with narrowed linewidth and enhanced sensitivity. Laser & Photonics Review 2015, 9, 682–688
- Kociak and Stéphan 2014 Kociak, M.; Stéphan, O. Mapping Plasmons at the Nanometer Scale in an Electron Microscope. Chem. Soc. Rev. 2014, 43, 3865–3883
- Yamamoto et al. 2001 Yamamoto, N.; Araya, K.; García de Abajo, F. J. Photon emission from silver particles induced by a high-energy electron beam. Phys. Rev. B 2001, 64, 205419
- Kociak and Zagonel 2017 Kociak, M.; Zagonel, L. Cathodoluminescence in the scanning transmission electron microscope. Ultramicroscopy 2017, 176, 112–131
- Hyun et al. 2008 Hyun, J.; Couillard, M.; Rajendran, P.; Liddell, C.; Muller, D. Measuring far-ultraviolet whispering gallery modes with high energy electrons. Appl. Phys. Lett. 2008, 93, 243106–243106
- Barwick et al. 2009 Barwick, B.; Flannigan, D.; Zewail, A. Photon-induced near-field electron microscopy. Nature 2009, 462, 902–906
- Kfir et al. 2020 Kfir, O.; Lourenço-Martins, H.; Storeck, G.; Sivis, M.; Harvey, T.; Kippenberg, T.; Feist, A.; Ropers, C. Controlling free electrons with optical whispering-gallery modes. Nature 2020, 582, 46–49
- Müller et al. 2021 Müller, N.; Hock, V.; Koch, H.; Bach, N.; Rathje, C.; Schäfer, S. Broadband Coupling of Fast Electrons to High-Q Whispering-Gallery Mode Resonators. ACS Phot. 2021, 8, 1569–1575
- Rossouw et al. 2011 Rossouw, D.; Couillard, M.; Vickery, J.; Kumacheva, E.; Botton, G. Multipolar Plasmonic Resonances in Silver Nanowire Antennas Imaged with a Subnanometer Electron Probe. Nano Lett. 2011, 11, 1499–1504
- Kociak et al. 2008 Kociak, M.; Nelayah, J.; Stéphan, O.; Mazzucco, S.; García de Abajo, F. J.; Bernard, R.; Colliex, C. Mapping Surface Plasmons on a Single Metallic Nanoparticle. Nat. Phys. 2008, 3, 3865–3883
- García de Abajo 1999 García de Abajo, F. J. Relativistic energy loss and induced photon emission in the interaction of a dielectric sphere with an external electron beam. Phys. Rev. B 1999, 59, 3095
- García de Abajo 1999 García de Abajo, F. J. Multiple scattering of radiation in clusters of dielectrics. Phys. Rev. B 1999, 60, 6086
- García de Abajo 2009 García de Abajo, F. J. Optical excitations in electron microscopy. Rev. of Mod. Phy. 2009, 82, 209–275
- Hulst 1946 Hulst, H. Optics of Spherical Particles. Recherches Astronomiques de l’Observatoire d’Utrecht 1946, 11, 1
- Stratton 1941 Stratton, J. Electromagnetic Theory; McGraw-Hill, 1941
- Mie 1908 Mie, G. Beiträge zur Optik Trüber Medien, Speziell Kolloidaler Metallösungen. Ann. Phys. 1908, 25, 377
- Losquin et al. 2015 Losquin, A.; Zagonel, L. F.; Myroshnychenko, V.; Rodríguez-González, B.; Tencé, M.; Scarabelli, L.; Förstner, J.; Liz-Marzán, L. M.; García De Abajo, F. J.; Stéphan, O.; Kociak, M. Unveiling nanometer scale extinction and scattering phenomena through combined electron energy loss spectroscopy and cathodoluminescence measurements. Nano Lett. 2015, 15, 1229–1237
- Laboratories 2020 Laboratories, B. Non-functionalized Silica. 2020; https://bangslabs.com, Accessed on 08.12.2021
- Krivanek et al. 2014 Krivanek, O. L.; Lovejoy, T. C.; Dellby, N.; Aoki, T.; Carpenter, R. W.; Rez, P.; Soignard, E.; Zhu, J.; Batson, P. E.; Lagos, M. J.; Egerton, R. F.; Crozier, P. A. Vibrational spectroscopy in the electron microscope. Nature 2014, 514, 209–212
- Hachtel et al. 2019 Hachtel, J. A.; Huang, J.; Popovs, I.; Jansone-Popova, S.; Keum, J. K.; Jakowski, J.; Lovejoy, T. C.; Dellby, N.; Krivanek, O. L.; Idrobo, J. C. Identification of site-specific isotopic labels by vibrational spectroscopy in the electron microscope. Science 2019, 363, 525–528
- Hage et al. 2020 Hage, F. S.; Radtke, G.; Kepaptsoglou, D. M.; Lazzeri, M.; Ramasse, Q. M. Single-atom vibrational spectroscopy in the scanning transmission electron microscope. Science 2020, 367, 1124–1127
- Tizei et al. 2020 Tizei, L. H. G. et al. Tailored Nanoscale Plasmon-Enhanced Vibrational Electron Spectroscopy. Nano Let. 2020, 20, 2973–2979
- Mkhitaryan et al. 2021 Mkhitaryan, V.; March, K.; Tseng, E. N.; Li, X.; Scarabelli, L.; Liz-Marzán, L. M.; Chen, S.-Y.; Tizei, L. H. G.; Stéphan, O.; Song, J.-M.; Kociak, M.; García de Abajo, F. J.; Gloter, A. Can Copper Nanostructures Sustain High-Quality Plasmons? Nano Lett. 2021, 21, 2444–2452
- Inc. 2020 Inc., A. Lumerical 2020 R2. 2020; https://lumerical.com, Accessed on 08.12.2021
- Cao et al. 2015 Cao, Y.; Manjavacas, A.; Large, N.; Nordlander, P. Electron Energy-Loss Spectroscopy Calculation in Finite-Difference Time-Domain Package. ACS Phot. 2015, 2, 369–375
- Sumlin 2020 Sumlin, B. PyMieScatt: Release v1.8.1. 2020; https://pymiescatt.readthedocs.io, Accessed on 08.12.2021
- Malitson 1965 Malitson, I. Interspecimen Comparison of the Refractive Index of Fused Silica. JOSA 1965, 55, 1205–1208
- Righini et al. 2011 Righini, G.; Dumeige, Y.; Feron, P.; Ferrari, M.; Nunzi Conti, G.; Ristić, D.; Soria, S. Whispering Gallery Mode microresonators: Fundamentals and applications. La Rivista del Nuovo Cimento 2011, 34, 435
- Schunk et al. 2014 Schunk, G.; Fürst, J.; Förtsch, M.; Strekalov, D.; Vogl, U.; Sedlmeir, F.; Schwefel, H.; Leuchs, G.; Marquardt, C. Identifying modes of large whispering-gallery mode resonators from the spectrum and emission pattern. Opt. Expr. 2014, 22, 30795–30806
- Buck and Kimble 2002 Buck, J.; Kimble, H. Optimal Sizes of Dielectric Microspheres for Cavity QED with Strong Coupling. Phys. Review A 2002, 67, 033806
- Zheng et al. 2014 Zheng, Y.; Zhong, X.; Li, Z.; Xia, Y. Successive, Seed‐Mediated Growth for the Synthesis of Single‐Crystal Gold Nanospheres with Uniform Diameters Controlled in the Range of 5–150 nm. Part. & Part. Systems Charact. 2014, 31, 266–273
- Mayer et al. 2015 Mayer, M.; Scarabelli, L.; March, K.; Altantzis, T.; Tebbe, M.; Kociak, M.; Bals, S.; García de Abajo, F. J.; Fery, A.; Liz-Marzán, L. Controlled Living Nanowire Growth: Precise Control over the Morphology and Optical Properties of AgAuAg Bimetallic Nanowires. Nano Lett. 2015, 15, 5427–5437
- Fuchs 1975 Fuchs, R. Theory of the optical properties of ionic crystal cubes. Phys. Rev. B. 1975, 11, 1732
- Langbein 1976 Langbein, D. Normal modes at small cubes and rectangular particles. Journ. of Phys. A 1976, 9, 627
- Sherry et al. 2005 Sherry, L.; Chang, S.; Schatz, G.; Duyne, R.; Wiley, B.; Xia, Y. Localized Surface Plasmon Resonance Spectroscopy of Single Silver Nanocubes. Nano Lett. 2005, 5, 2034–2038
- Mazzucco et al. 2012 Mazzucco, S.; Geuquet, N.; Ye, J.; Stéphan, O.; Roy, W.; Van Dorpe, P.; Henrard, L.; Kociak, M. Ultralocal Modification of Surface Plasmons Properties in Silver Nanocubes. Nano Lett. 2012, 12, 1288–1294
- Li et al. 2021 Li, X.; Haberfehlner, G.; Hohenester, U.; Stéphan, O.; Kothleitner, G.; Kociak, M. Three-dimensional vectorial imaging of surface phonon polaritons. Science 2021, 371, 1364–1367
- Lourenço-Martins and Kociak 2017 Lourenço-Martins, H.; Kociak, M. Vibrational surface electron-energy-loss spectroscopy probes confined surface-phonon modes. Phys. Rev. X 2017, 7, 1–11
- Zhang et al. 2011 Zhang, S.; Bao, K.; Halas, N.; Xu, H.; Nordlander, P. Substrate-Induced Fano Resonances of a Plasmonic: Nanocube: A Route to Increased-Sensitivity Localized Surface Plasmon Resonance Sensors Revealed. Nano Lett. 2011, 11, 1657–1663
- Nicoletti et al. 2013 Nicoletti, O.; Peña, F.; Leary, R.; Holland, D.; Ducati, C.; Midgley, P. Three-dimensional imaging of localized surface plasmon resonances of metal nanoparticles. Nature 2013, 502, 80–84
- Hall et al. 2014 Hall, J.; Afshar, S.; Henderson, M.; Francois, A.; Reynolds, T.; Riesen, N.; Monro, T. Method for predicting whispering gallery mode spectra of spherical microresonators. Opt. Expr. 2014, 23, 9924–9937
- García de Abajo 1999 García de Abajo, F. J. Relativistic description of valence energy losses in the interaction of fast electrons with clusters of dielectrics: multiple-scattering approach. Phys. Rev. B. 1999, 60, 6103–6112
- Grainger et al. 2004 Grainger, R.; Lucas, J.; Thomas, G.; Ewen, G. Calculation of Mie Derivatives. Appl. Opt. 2004, 43, 5386–93
- de la Peña et al. 2021 de la Peña, F. et al. hyperspy/hyperspy: Release v1.6.2. 2021; https://doi.org/10.5281/zenodo.4683076
- Losquin and Kociak 2015 Losquin, A.; Kociak, M. Link between Cathodoluminescence and Electron Energy Loss Spectroscopy and the Radiative and Full Electromagnetic Local Density of States. ACS Phot. 2015, 2, 1619–1627
- Sihvola et al. 2004 Sihvola, A.; Yla-Oijala, P.; Jarvenpaa, S.; Avelin, J. Polarizabilities of Platonic Solids. Ant. and Prop., IEEE Trans. 2004, 52, 2226 – 2233
- Johnson and Christy 1972 Johnson, P. B.; Christy, R. W. Optical constants of the noble metals. Phys. Rev. B. 1972, 6, 4370–4379
- Yurkin and Hoekstra 2007 Yurkin, M. A.; Hoekstra, A. G. The discrete dipole approximation: an overview and recent developments. Jour. of Quant. Spec. and Rad. Transf, 2007, 106, 558–559
Supplementary Material for Unveiling the coupling of single metallic nanoparticles to whispering-gallery microcavities
2.1 A - Electron coupling probability for bare WGMRs
As discussed in the main text, eq 1 provides an analytical solution for the EELS probability of a fast electron interacting with a spherical particle. While the Mie coefficients ( and ) depend exclusively on the sphere radius and its dielectric function, the coupling coefficients ( and ) depend on the ratio of the electron and light speeds . Inspection of the coupling terms shows that, for small spheres, only low angular momentum orders contribute significantly to the energy loss. Moreover, the contribution from magnetic modes (TE) is only comparable to that from electric modes (TM) when approaches 44, 45. Additionally, for lossless materials (i.e., with real dielectric functions), Mie scattering terms satisfy 76 and hence eq 1 predicts identical results for EELS and CL.
Although intricate, the analytical solution for an arbitrary number of angular modes for a single sphere is possible computationally 44. A convenient way of studying the electron velocity dependence in EELS is by performing finite-difference-time-domain (FDTD) simulations. To calculate the energy-loss probability, one simply applies the following equation to the obtained induced electric field:
| (2) |
where is the position of the calculated field, is the dipole charge position, and is the amplitude of the dipole used to mimic the components of the electron as an external source. Simulations were performed using the Ansys Lumerical software 57. Further details on how to perform FDTD for EELS can be found in the work of Cao et al 58. Note that the electron velocity only appears on the cosine term, independent from the induced fields along the electron trajectory, which means that the EELS probability for any electron velocity can be calculated by post-processing the same induced fields.
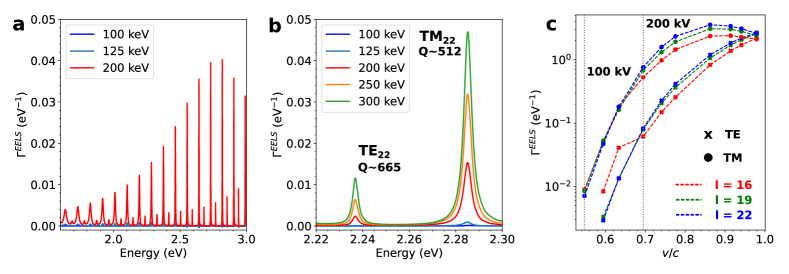
The EELS probability for a bare resonator was calculated for several ratios, as shown in Figure S1. We have inspected a few angular order peaks close to the visible range for a sphere of 1.60 m. For the TM22 mode, for example, the EELS probability increases approximately two orders of magnitude as the electron energy is increased from 100 keV to 200 keV. Also, the loss probability for the TE modes approaches the TM ones only when , as expected. Finally, note that the quality factor for the TM polarization is slightly smaller than the TE one, which is an expected result when only radiation losses are taken into account 61.
2.2 B - Fitting results for SiO2 bare spheres
Due to the large amount of spectrally close resonances in bare resonators for EELS / CL, here we describe how the fitting procedure was performed, along with the limitations from both types of measurements. All data sets were fitted using Gaussians for each observed resonance and a power law for the background signal. Each Gaussian was allowed to shift 2 nm for CL and 30 meV for EELS from the initial guess, and standard deviations were free to be determined as long as they remained less than 15 nm wide in CL and 100 meV in EELS. Data modeling was entirely carried out in Hyperspy 77. The quality factor was calculated as , where is the resonance FWHM, determined from the Gaussian standard deviation as . The Q-factor presented in the main text was obtained for CL measurements due to its improved spectral resolution with respect to EELS and because only the last few points started to approach our instrument point spread function (PSF), determined as 0.7 nm. The PSF limits the maximum observable standard deviation, and thus, if , the maximum observable quality factor is inversely proportional to the photon energy. For EELS, in contrast, the PSF can be roughly approximated by the FWHM of the zero-loss peak, and likewise, , which has a linear dependence on the photon energy. Figure S2c shows the observed quality factors for both techniques, along with the estimate Q-factor limit as a function of energy. The clear linear dependence of the Q-factor as a function of energy for EELS suggests that the measurements are indeed limited by the electron spectrometer resolution. The fact that the experimental curve is below the EELS limit curve is probably due to deviations of the actual system from the model assumptions, since the zero-loss peak is not a perfect Gaussian and the spectral distance between resonances ( 80 meV) is comparable to the zero-loss FWHM. Finally, Table 1 details the fitting results for CL at 200 keV.
| I (cts) | Center (nm) | (nm) | Q | I (cts) | Center (nm) | (nm) | Q |
|---|---|---|---|---|---|---|---|
| 3452.5 | 613.42 | 4.50 | 57.87 | 3062.4 | 402.57 | 1.10 | 156.06 |
| 4190.9 | 587.39 | 3.73 | 66.8 | 2634.2 | 391.5 | 1.10 | 151.23 |
| 4652.5 | 563.92 | 2.71 | 88.38 | 2562.1 | 380.95 | 1.02 | 158.74 |
| 3002.5 | 542.26 | 2.10 | 109.66 | 2490.4 | 371.02 | 0.99 | 158.71 |
| 3620.5 | 521.79 | 1.90 | 116.41 | 2044.4 | 361.71 | 0.92 | 167.15 |
| 4418.9 | 503.13 | 1.72 | 123.93 | 1984.5 | 352.73 | 0.92 | 163.14 |
| 4926.6 | 485.65 | 1.61 | 128.40 | 1554.0 | 344.20 | 0.88 | 166.89 |
| 5146.7 | 469.50 | 1.63 | 122.47 | 1287.1 | 336.04 | 0.83 | 170.90 |
| 3141.1 | 454.44 | 1.38 | 145.11 | 924.1 | 328.41 | 0.72 | 192.77 |
| 2900.0 | 440.16 | 1.26 | 148.79 | 888.9 | 320.96 | 0.81 | 167.98 |
| 3143.1 | 426.84 | 1.29 | 140.66 | 634.5 | 314.10 | 0.69 | 193.19 |
| 2829.2 | 414.38 | 1.13 | 156.01 | 438.8 | 307.31 | 0.67 | 195.87 |
2.3 C - FDTD-simulated cube mode hybridization on a flat SiO2 substrate
For the cube-SiO2 substrate system, the FDTD-simulated loss probability was obtained using a 1.25 nm mesh size with electric dipoles evenly spaced by 8 nm. The SiO2 substrate was 500 nm thick and the silver nanocube had 100 nm in side length. Figure S3a shows the results for the obtained spectra for the probe at the top edge (opposite from the interface Ag - SiO2) and top corner positions for 200 keV and 100 keV electrons, in which the loss probability changes by less than a relative factor of two (compared to the factor of 100 for the bare resonator). In Figure S3b, we compare the simulated and the experimental results. The simulated modes are redshifted with respect to the experimental results in all observed modes (except for the distal face), presumably due to variations in the effective index of refraction between experiment and simulations.
Although redshifted, all experimental observed resonances were also observed in FDTD. In order to make a correspondence between them, the absolute value of the near electric field was obtained (shown in Figure 3c . This correspondence can also be done through simulating a full spectral image by rastering the electron probe position in a square mesh containing the cube and part of the substrate. For this, the mesh size was increased to 2.50 nm while dipoles were evenly spaced by 25 nm intervals in order to reduce the simulation time. The electron impact position grid was 150 nm wide in both the x-y plane (z being the electron propagation direction) and the impact distance step size was 5 nm. Only minor changes were found in the spectral maps with respect to each single loss spectrum at the corresponding probe positions despite the alleviated simulation conditions, thus pointing to good simulation convergence. Figure S4 shows the simulated spectral image under the above conditions for the resonances listed in the main text (Figure 3c), with a remarkable resemblances between them. Note that simulations have rendered the proximal edge mode (PE) as very faint and close to the second distal corner mode (DC2), similarly to experiment. Figure S4 for DC2 + PE clearly shows a proximal edge component, although much less strong than the distal corner.
Finally, note that a smaller order proximal order mode PC1 has not been observed in EELS, despite being predicted in the FDTD simulations (Figure 3). This mode is known to be close to the global dipole and very diffuse, which makes it very challenging to detect experimentally 73. It is also important to note that unequivocally characterizing the entire cube-substrate modes requires an extreme degree of electron beam monochromaticity. Experimentally, mode PC2 is centered at 2.813 eV and mode is centered at 2.898 eV. The 85 meV distance is smaller than the 250 meV mode FWHM, and thus, mode overlap is expected in our spectral maps.
2.4 D - CL results for higher-order modes in the coupled WGM-plasmon system
The CL lateral and top probe positions presented in the main text relied on spectra obtained by a spectral image of the cube-SiO2 system. For each of the eigenmodes, CL measures the radiative component of the electromagnetic density of states along the electron propagation direction 78. For high-net dipole-moment modes, such as the first dipolar mode (Dip), CL is expected to be intense with respect to the total absorption (performed by EELS in Figure 3) . For the higher-order modes, in which the net dipole moment approaches zero, the electron energy absorbed is dissipiated mostly in the form of ohmic losses. However, cube-substrate hybridization and retardation affect the radiation emitted from these modes, as can be seen in Figure S5. In this case, they tend to be more probe-position-dependent as the noted deviations are also spatially dependent. We have identified most of the modes revealed by EELS, including the first-order proximal mode PC1 that was difficult to resolve in EELS because of its closeness to the dipolar mode (Dip) and the tail of the much stronger PC2. Additionally, PC1 and PC2 can be better spatially resolved due to the fact that thick regions of the sample can be probed in CL, differently from EELS, in which penetrating trajectories in such a thick sample are very challenging. Note that PC2 radiates less than PC1 due to its higher order (the same happens to DC2 with respect to DC1). Finally, it is worth mentioning that DC2, although with a small radiative contribution, showed coupling to gallery-modes, which reinforces the argument that this coupling is dependent on the net dipole moment.
2.5 E - MNP polarizability
In the analytic model, the nanocube is described through as a dipolar point scatterer of isotropic polarizability placed at the particle center. In order to estimate , we adopt the model of Fuchs and Sihvola 66, 79 for the quasistatic polarizability of the cube,
| (3) |
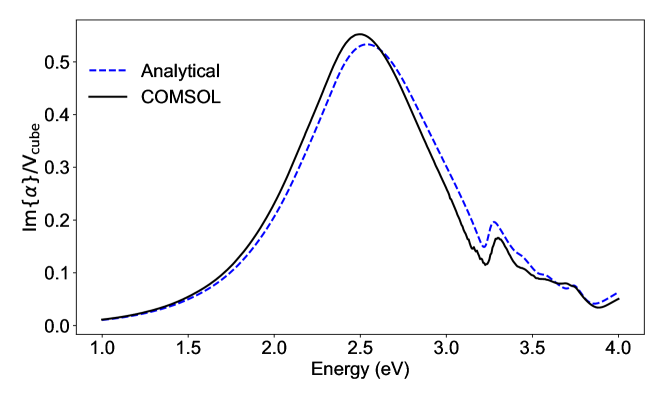
where is the cube volume, is its dielectric function (taken from tabulated data 80 for silver), is the host permittivity (1 for vacuum in the present case), is a mode index, and and are tabulated in Ref. 66. We have further obtained the cube polarizabitily using a finite-difference numerical method (COMSOL). Comparison of the quasistatic polarizability and the numerical simulation reveals large discrepencies, which can be attributed to retardation effects. The latter can be incorporated in the analytical model through the precription 81
| (4) |
where , , and is the cube edge length. This prescription brings the model polarizability in close agreement with the numerical simulation, as shown in Figure S6. This analysis confirms the robustness of the polarizability here used for the analytical model of the MNP-sphere system, although of course it does not account for higher-order particle plasmons.
2.6 F - Additional results from the analytical model
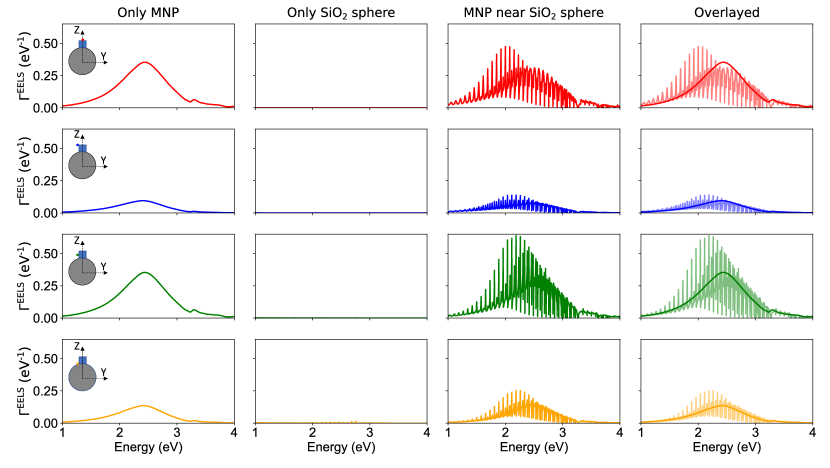
We show in Figures S7 and S8 additional results obtained from the analytical model discussed in the main text for electrons moving with energies of 200 keV and 100 keV, respectively.
For 200 keV, Figure S7 shows that the coupling is also sensitive to the electron beam position, even in the sphere without a MNP, because the Mie resonances under consideration become more evanescent outside the dielectric for higher orbital angular momentum. For 100 keV electrons (Figure S8), excitation of Mie resonances in the sphere without the MNP is negligible because of the mismatch between the electron velocity and the orbital group velocity of the whispering-gallery modes; however, the presence of a MNP acts as a mediator in the coupling to Mie modes, which leave sizable signatures in EELS for the hybrid system.