Wolfgang Bietenholz
The Evolution of Lattice Field Theory: a Statistical Study
Abstract
Researchers working in lattice field theory constitute an established community since the early 1990s, and around the same time the online open-access e-print repository arXiv was created. The fact that this field has a specific arXiv section, hep-lat, provides a unique opportunity for a statistical study of its evolution over the last three decades. We present data for the number of entries, , published papers, , and citations, , in total and separated by nations. We compare them to 6 other arXiv sections, and to socio-economic indices of the nations involved, namely the Gross Domestic Product (GDP) and the Education Index (EI). We present rankings, which are based either on the Hirsch Index , or on the linear combination . We consider both extensive and intensive national statistics, i.e. absolute and relative to the population or to the GDP.
1 Outline
The conceptual basis of lattice field theory was elaborated in the 1970s and 1980s, and since the early 1990s physicists working in this field are a well-established, intercontinental community. The latter is related to the fact that around the same time computational resources became accessible more easily — computing was “democratized” — and they attained a level which allows for precise non-perturbative studies of some quantum field theoretic models, by means of Monte Carlo simulations in the lattice regularization.
It happened around the same time, more precisely in 1991/2, that the online e-print repository arXiv [1] became operational. Ever since it has contributed very significantly to the scientific communication. In particular, since 1992 its hep-lat section captures practically the entire activity of the lattice community.111Also since 1992, the annual Lattice Conference (or Symposium) attained an extent of contributions. Lattice researchers use it comprehensively, which is not the case to the same extent in other branches of physics, like condensed matter and optics.
The hep-lat section provides a perfect opportunity to statistically monitor the evolution of lattice field theory over the last three decades. In contrast, a similar study in other specific lines of physical research would require a tedious and less reliable search for keywords in titles and abstracts.
Taking advantage of this opportunity, we study the number of articles which were submitted to the arXiv with hep-lat as the “primary archive”, primarch (we do not consider articles which are cross-listed to hep-lat; usually they only have an indirect link to lattice field theory). We used the open access digital library INSPIRE [2] to count the following quantities:
| Entries, all article submitted to the arXiv with primary archive hep-lat | |
|---|---|
| The subset of , which was later published as regular papers (this excludes proceeding | |
| contributions and unpublished preprints) | |
| Citations to all articles in , which were registered by INSPIRE until summer 2020 | |
| Hirsch Index [3] of a set of articles which appear in , considering all the citations to them | |
| included in . |
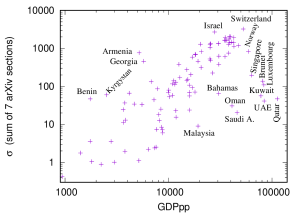
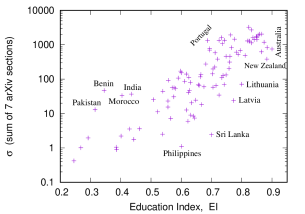
In order to compare lattice field theory to other fields of physical research, we considered the same quantities in 6 other arXiv sections, which are thematically somewhat related, namely hep-ph (high-energy physics, phenomenology), hep-th (high-energy physics, theory), gr-qc (general relativity and quantum cosmology), nucl-th (nuclear theory), quant-ph (quantum physics), and cond-mat (condensed matter; the symbol indicated the sum over all subsections).
In the national statistics, an article counts for a nation if at least one author has a working address there (we are not concerned with the authors’ nationalities). Hence it can count for several countries. The data were taken in July 2020 from the “old” INSPIRE version, https://old.inspirehep.net, which is deactivated now, unfortunately.222The new INSPIRE version [2] is not useful for such a study: if we fix e.g. “date”, much larger numbers appear than in the old version, due to multiple counting. The command “de” (data earliest) is supposed to overcome this effect, but it returns weird results, which are much too low (e.g. just one hep-lat entry in 2019). Moreover, the new version does not have the option “country code”, hence it does not provide data for national statistics.
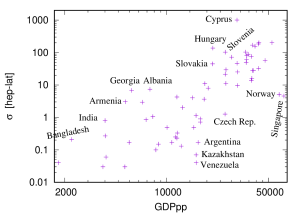
We are going to present data for global and for national statistics, first from an extensive and then from an intensive perspective, i.e. absolute and relative to the population, respectively. (We do not count contributions by specific authors or collaborations.) In the special case of Switzerland, we exclude CERN as an affiliation. As a single parameter, the Hirsch Index [3] can be applied in extensive rankings, but not in intensive ones. As another single parameter for the scientific activity and achievement, we define
| (1) |
where the coefficients (“weights”) are motivated by the statistical trends to be presented below, see in particular Table 1. The index does have an intensive counterpart, see Section 3.
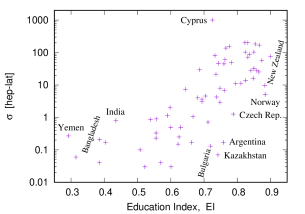
We compare these data with two socio-economic parameters: as an economic index, we consider the Gross Domestic Product (GPD), given in US dollars (more precisely: the value of its purchasing parity in 2011). Its intensive version is the GPDpp (per capita). As another intensive quantity, which seems likely to be related to the scientific performance, we consider the Education Index (EI),333In another statistical study, which deals with High Energy Physics in Latin America [4], we considered separately the EI and the Human Development Index (HDI). The HDI is the geometric mean of indices of income (in purchasing parity), health and the EI. However, the EI and HDI tend to be similar in most countries, so here we refrain from a separate consideration. which is defined as
| (2) |
EYS means “expected years of schooling” for children (normalized by the duration for a Master’s degree), while MYS are the “mean years of schooling” of adults (normalized to the projected maximum in 2025). For each nation and year one obtains . Our source for the annual GDP, GPDpp and EI is the United Nations Development Programme [5]; we average over the years from 1992 to 2019. The population is averaged over the same period; it is expressed in millions of inhabitants (we do not include tiny countries with less than inhabitants). We also intended to include the percentage of “skilled labor force”, but the data for different countries do not seem to be based on consistent criteria.444For instance, Japan reports 99.9% “skilled labor force”, but Italy and Portugal only 69.6% and 54.1%, respectively.
2 Extensive Statistics
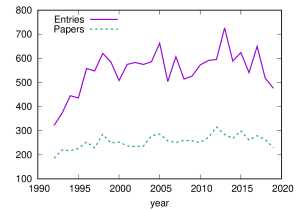
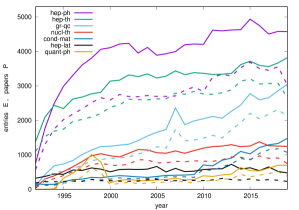
Figure 1 shows global data for the annual evolution from 1992 to 2019 in the hep-lat, and in all the 7 arXiv sections under consideration (in 1991 there were only a few sporadic entries and 2020 we could only capture the first half). The total statistics, summed up from 1991 to July 2020, for each of the 7 arXiv sections is displayed in Table 1.
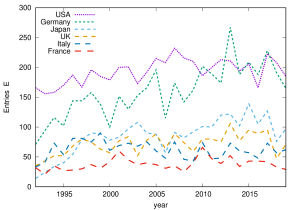
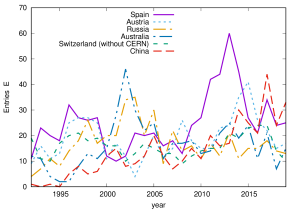
Figure 2 shows the individual time evolutions of hep-lat-entries for the 12 leading nations in this respect, with . Table 2 contains the national sums of , and from 1991 to July 2020, along with the population in millions and the GDP (both averaged from 1992 to 2019). For comparison, we add the European Union (with 28 nations, still including the UK) and CERN, but the ranking only refers to nations. It is based on the Hirsch Index, -rank, but we also show the -rank, which is very similar. This confirms that the definition of of eq. (1) is sensible.
| hep-ph | hep-th | gr-qc | nucl-th | cond-mat | hep-lat | quant-ph | |
| 111515 | 89279 | 48927 | 28522 | 16969 | 15610 | 11602 | |
| 76520 | 70561 | 35703 | 20215 | 13677 | 7165 | 7484 | |
| 3960720 | 2857462 | 1043823 | 682874 | 247734 | 402121 | 106901 | |
| 0.69 | 0.79 | 0.71 | 0.71 | 0.81 | 0.46 | 0.65 | |
| 35.5 | 32.0 | 21.3 | 23.9 | 14.6 | 25.8 | 9.21 |
| -rank | population | GDP | ||||||
|---|---|---|---|---|---|---|---|---|
| European Union | 495.0 | 15900.4 | 9020 | 4265 | 249236 | 25746.8 | 182 | |
| 1. USA | 1 | 294.3 | 14050.1 | 5472 | 2565 | 175639 | 16818.9 | 167 |
| 2. Germany | 2 | 81.3 | 3167.4 | 4523 | 2107 | 143667 | 13813.3 | 155 |
| 3. UK | 3 | 61.4 | 2136.2 | 2026 | 950 | 67386 | 6345.3 | 121 |
| 4. Japan | 4 | 127.6 | 4458.1 | 2419 | 1078 | 55729 | 6283.5 | 103 |
| 5. France | 6 | 61.1 | 2232.9 | 1070 | 540 | 42060 | 3713.0 | 101 |
| 6. Italy | 5 | 58.5 | 2066.6 | 1765 | 877 | 41252 | 4704.6 | 89 |
| CERN | 615 | 306 | 27553 | 2298.7 | 79 | |||
| 7. Switzerland | 8 | 7.5 | 400.7 | 451 | 228 | 16744 | 1516.2 | 75 |
| 8. Spain | 7 | 43.6 | 1326.8 | 708 | 370 | 19310 | 2043.5 | 71 |
| 9. Australia | 9 | 18.9 | 801.9 | 471 | 250 | 14208 | 1431.4 | 64 |
| 10. Hungary | 10 | 10.1 | 208.5 | 292 | 151 | 18824 | 1384.2 | 61 |
| 11. Cyprus | 14 | 1.0 | 23.1 | 389 | 193 | 8794 | 1021.7 | 54 |
| 12. Austria | 11 | 8.3 | 333.8 | 534 | 254 | 10300 | 1303.0 | 51 |
| 13. China | 13 | 1326.5 | 9638.8 | 415 | 223 | 9708 | 1123.4 | 50 |
| 14. Denmark | 15 | 5.4 | 233.1 | 322 | 174 | 10188 | 1005.4 | 50 |
| 15. Russia | 12 | 145.5 | 2822.8 | 475 | 252 | 8608 | 1157.4 | 48 |
| 16. Canada | 17 | 32.5 | 1269.4 | 325 | 164 | 8387 | 908.3 | 46 |
| 17. India | 16 | 1142.0 | 4509.3 | 316 | 183 | 8198 | 908.9 | 45 |
| 18. Ireland | 18 | 4.2 | 183.7 | 292 | 117 | 8565 | 837.3 | 45 |
| 19. Taiwan | 20 | 22.5 | 702.2 | 196 | 100 | 5491 | 570.6 | 40 |
| 20. Finland | 23 | 5.3 | 191.6 | 165 | 81 | 4460 | 469.0 | 36 |
| 21. Netherlands | 19 | 16.3 | 696.5 | 203 | 98 | 4544 | 528.2 | 35 |
| 22. Israel | 22 | 6.6 | 197.8 | 149 | 96 | 4622 | 476.1 | 35 |
| 23. South Korea | 21 | 48.3 | 1242.6 | 238 | 82 | 4448 | 542.4 | 34 |
| 24. Poland | 24 | 38.3 | 696.8 | 181 | 82 | 3192 | 422.6 | 30 |
| 25. Brazil | 25 | 184.4 | 2397.1 | 117 | 58 | 3939 | 372.0 | 29 |
| 26. Sweden | 27 | 9.2 | 365.9 | 99 | 50 | 2162 | 257.1 | 27 |
| 27. Slovenia | 30 | 2.0 | 51.1 | 67 | 33 | 2174 | 208.7 | 26 |
| 28. Portugal | 26 | 10.4 | 264.0 | 138 | 55 | 2252 | 305.6 | 25 |
| 29. Slovakia | 28 | 5.4 | 111.5 | 82 | 42 | 2354 | 241.7 | 25 |
| 30. Greece | 29 | 10.9 | 273.9 | 96 | 49 | 1756 | 232.8 | 22 |
| 31. Belgium | 31 | 10.7 | 409.5 | 54 | 28 | 1792 | 171.6 | 20 |
| 32. Mexico | 33 | 106.6 | 1710.8 | 58 | 26 | 760 | 122.0 | 15 |
| 33. Ukraine | 32 | 47.5 | 319.9 | 85 | 34 | 417 | 139.9 | 11 |
| 34. Turkey | 34 | 68.2 | 1192.0 | 25 | 19 | 347 | 61.3 | 10 |
| 35. New Zealand | 36 | 4.1 | 127.7 | 11 | 8 | 420 | 40.0 | 8 |
| 36. Bangladesh | 39 | 137.0 | 317.0 | 10 | 6 | 267 | 29.4 | 7 |
| 37. Belarus | 35 | 9.7 | 113.6 | 9 | 6 | 527 | 41.3 | 6 |
| 38. Iran | 37 | 69.9 | 1088.1 | 17 | 11 | 126 | 34.3 | 6 |
| 39. Georgia | 38 | 4.4 | 22.6 | 11 | 7 | 236 | 29.8 | 5 |
| 40. Norway | 40 | 4.7 | 280.4 | 14 | 6 | 83 | 24.2 | 5 |
| 41. Albania | 41 | 3.0 | 22.9 | 15 | 2 | 107 | 22.4 | 5 |
| 42. Singapore | 43 | 4.5 | 297.6 | 10 | 5 | 113 | 20.7 | 4 |
| -rank | ||||||
|---|---|---|---|---|---|---|
| 1. USA | 1 | 85601 | 63422 | 4006414 | 349343.7 | 583 |
| European Union | 147464 | 106804 | 4961069 | 502321.4 | 548 | |
| 2. France | 3 | 28598 | 21090 | 1368170 | 118096.5 | 394 |
| 3. Germany | 2 | 45242 | 35533 | 1713406 | 166445.3 | 390 |
| 4. UK | 4 | 26174 | 19927 | 1089933 | 100597.7 | 339 |
| CERN | 9836 | 7253 | 682730 | 51225.5 | 333 | |
| 5. Italy | 5 | 27034 | 19875 | 949801 | 94399.1 | 309 |
| 6. Spain | 9 | 16466 | 12223 | 601111 | 58744.6 | 267 |
| 7. Russia | 7 | 22429 | 15260 | 586236 | 67000.8 | 257 |
| 8. Canada | 10 | 12364 | 9696 | 469849 | 45552.5 | 250 |
| 9. Japan | 6 | 24611 | 18620 | 690235 | 77742.8 | 249 |
| 10. Switzerland | 14 | 5734 | 4142 | 290056 | 24378.8 | 227 |
| 11. Netherlands | 16 | 5634 | 4307 | 262786 | 23080.3 | 207 |
| 12. Poland | 13 | 8205 | 5660 | 245108 | 26120.4 | 191 |
| 13. China | 8 | 20475 | 16372 | 444642 | 59079.1 | 186 |
| 14. India | 11 | 14374 | 10925 | 332859 | 41942.0 | 186 |
| 15. Sweden | 18 | 4973 | 3753 | 198321 | 18642.1 | 178 |
| 16. Belgium | 17 | 4955 | 3798 | 201122 | 18809.1 | 171 |
| 17. Israel | 19 | 5085 | 3943 | 176081 | 17832.1 | 166 |
| 18. Brazil | 12 | 11460 | 8961 | 222670 | 31554.5 | 146 |
| 19. South Korea | 15 | 7627 | 6096 | 196954 | 23570.7 | 142 |
| 20. Portugal | 22 | 4166 | 3087 | 128890 | 13697.5 | 139 |
| 21. Austria | 23 | 3885 | 2563 | 112541 | 12075.1 | 137 |
| 22. Greece | 24 | 3505 | 2748 | 107266 | 11616.3 | 134 |
| 23. Australia | 20 | 4185 | 3219 | 136125 | 14210.3 | 133 |
| 24. Denmark | 27 | 3006 | 2248 | 103328 | 10420.4 | 133 |
| 25. Taiwan | 21 | 4110 | 3186 | 134243 | 14008.2 | 129 |
| 26. Finland | 29 | 2460 | 1818 | 86101 | 8583.1 | 128 |
| 27. Hungary | 30 | 2274 | 1586 | 88347 | 8277.4 | 121 |
| 28. Chile | 28 | 3089 | 2567 | 77183 | 9515.2 | 108 |
| 29. Argentina | 31 | 2576 | 2179 | 63899 | 7950.0 | 104 |
| 30. Mexico | 25 | 4450 | 3232 | 75687 | 11466.4 | 101 |
| 31. Ireland | 36 | 1476 | 1078 | 43298 | 4718.9 | 97 |
| 32. Iran | 26 | 4054 | 3398 | 64526 | 10678.3 | 89 |
| 33. South Africa | 34 | 1903 | 1483 | 44556 | 5613.8 | 85 |
| 34. Slovenia | 41 | 718 | 484 | 28219 | 2613.0 | 85 |
| 35. Norway | 37 | 1242 | 923 | 35198 | 3924.9 | 84 |
| 36. Ukraine | 33 | 2508 | 1674 | 42411 | 6302.6 | 82 |
| 37. Czech Rep. | 35 | 2106 | 1501 | 37754 | 5494.7 | 78 |
| 38. Bulgaria | 40 | 1040 | 684 | 24849 | 2966.5 | 73 |
| 39. Croatia | 38 | 1035 | 778 | 25216 | 3073.8 | 71 |
| 40. Estonia | 47 | 425 | 336 | 20056 | 1763.8 | 71 |
| 41. Turkey | 32 | 2571 | 2112 | 32563 | 6311.2 | 62 |
| 42. Georgia | 45 | 693 | 512 | 16033 | 2006.7 | 62 |
| 43. Armenia | 42 | 835 | 635 | 17331 | 2336.6 | 61 |
| 44. Slovakia | 48 | 642 | 394 | 13173 | 1694.7 | 61 |
| 45. New Zealand | 49 | 495 | 362 | 14576 | 1585.8 | 60 |
3 Intensive Statistics
Figure 3 shows scatter plots for (pop: population in millions of inhabitants) vs. GPDpp and vs. EI. We include the 101 nations with . The symbols for the 45 dominant nations in these plots can be identified from Tables 4 and 5 for the intensive hep-lat statistics and summed over the 7 arXiv sections, respectively. These tables for intensive quantities further include the GDPpp, the EI and . Here the ranking is based on the parameter , but we also display the economic rank (e-rank) based on .
This work was supported by UNAM-DGAPA through PAPIIT project IG100219.
References
- [1] https://arxiv.org/
- [2] https://inspirehep.net/
- [3] J. E. Hirsch, PNAS 102 (2005) 16569-72.
- [4] G. Urrutia Sánchez, L. Prado and W. Bietenholz, Scientometrics 116 (2018) 125-146.
- [5] http://hdr.undp.org/
| e-rank | GDPpp | EI | /GDP | |||||
|---|---|---|---|---|---|---|---|---|
| 1. Cyprus | 1 | 30386 | 0.725 | 383.32 | 190.18 | 8665.6 | 44.17 | 1006.78 |
| 2. Switzerland | 8 | 52698 | 0.823 | 60.13 | 30.40 | 2232.5 | 3.78 | 202.16 |
| 3. Ireland | 3 | 42903 | 0.832 | 70.27 | 28.16 | 2061.1 | 4.56 | 201.48 |
| 4. Denmark | 5 | 42671 | 0.854 | 59.22 | 32.00 | 1873.8 | 4.31 | 184.02 |
| 5. Germany | 4 | 38719 | 0.866 | 55.60 | 25.90 | 1766.1 | 4.36 | 169.81 |
| 6. Austria | 7 | 40348 | 0.776 | 64.31 | 30.59 | 1240.4 | 3.90 | 156.92 |
| 7. Hungary | 2 | 20738 | 0.766 | 29.04 | 15.02 | 1872.0 | 6.64 | 137.66 |
| 8. UK | 9 | 34770 | 0.850 | 32.99 | 15.47 | 1097.4 | 2.97 | 103.33 |
| 9. Slovenia | 6 | 25235 | 0.824 | 33.01 | 16.26 | 1071.1 | 4.08 | 102.83 |
| 10. Finland | 10 | 36205 | 0.837 | 31.18 | 15.30 | 842.7 | 2.45 | 88.61 |
| 11. Italy | 12 | 35411 | 0.733 | 30.19 | 15.00 | 705.6 | 2.28 | 80.47 |
| 12. Australia | 14 | 38067 | 0.900 | 24.95 | 13.25 | 752.8 | 1.79 | 75.84 |
| 13. Israel | 11 | 27906 | 0.832 | 22.58 | 14.55 | 700.3 | 2.41 | 72.14 |
| 14. France | 15 | 35303 | 0.763 | 17.52 | 8.42 | 688.8 | 1.66 | 60.80 |
| 15. USA | 19 | 47324 | 0.874 | 18.59 | 8.72 | 596.9 | 1.20 | 57.15 |
| European Union | 31966 | 0.792 | 18.22 | 8.62 | 503.5 | 1.62 | 52.01 | |
| 16. Japan | 17 | 35125 | 0.782 | 18.96 | 8.45 | 436.8 | 1.41 | 49.25 |
| 17. Spain | 16 | 30406 | 0.743 | 16.24 | 8.48 | 442.8 | 1.54 | 46.86 |
| 18. Slovakia | 13 | 20657 | 0.760 | 15.19 | 7.78 | 435.9 | 2.17 | 44.76 |
| 19. Netherlands | 24 | 42689 | 0.850 | 12.48 | 6.02 | 279.3 | 0.76 | 32.46 |
| 20. Portugal | 20 | 25515 | 0.687 | 13.33 | 5.31 | 217.5 | 1.16 | 29.52 |
| 21. Canada | 25 | 38828 | 0.841 | 10.01 | 5.05 | 258.4 | 0.72 | 27.98 |
| 22. Sweden | 26 | 39526 | 0.859 | 10.77 | 5.44 | 235.3 | 0.70 | 27.98 |
| 23. Taiwan | 23 | 30654 | 0.865 | 8.70 | 4.44 | 243.7 | 0.81 | 25.33 |
| 24. Greece | 22 | 25240 | 0.736 | 8.84 | 4.51 | 161.7 | 0.85 | 21.43 |
| 25. Belgium | 31 | 38398 | 0.848 | 5.07 | 2.63 | 168.1 | 0.42 | 16.10 |
| 26. Iceland | 34 | 38087 | 0.825 | 3.33 | 3.33 | 143.3 | 0.36 | 13.83 |
| 27. South Korea | 30 | 25473 | 0.811 | 4.93 | 1.70 | 92.1 | 0.44 | 11.24 |
| 28. Poland | 27 | 18267 | 0.795 | 4.72 | 2.14 | 83.3 | 0.61 | 11.02 |
| 29. New Zealand | 35 | 30601 | 0.883 | 2.66 | 1.93 | 101.4 | 0.31 | 9.66 |
| 30. Russia | 32 | 19274 | 0.748 | 3.27 | 1.73 | 59.2 | 0.41 | 7.96 |
| 31. Albania | 21 | 7683 | 0.644 | 4.96 | 0.66 | 35.4 | 0.98 | 7.39 |
| 32. Georgia | 18 | 5752 | 0.761 | 2.52 | 1.60 | 54.0 | 1.32 | 6.82 |
| 33. Norway | 43 | 59066 | 0.884 | 2.96 | 1.27 | 17.6 | 0.09 | 5.11 |
| 34. Singapore | 46 | 63641 | 0.705 | 2.22 | 1.11 | 25.0 | 0.07 | 4.58 |
| 35. Belarus | 33 | 11763 | 0.738 | 0.93 | 0.62 | 54.4 | 0.36 | 4.27 |
| 36. Uruguay | 36 | 15032 | 0.681 | 2.11 | 1.51 | 8.1 | 0.27 | 4.03 |
| 37. Croatia | 37 | 18091 | 0.694 | 2.05 | 0.91 | 13.9 | 0.20 | 3.65 |
| 38. Armenia | 28 | 5207 | 0.694 | 2.30 | 0.66 | 1.6 | 0.60 | 3.05 |
| 39. Ukraine | 29 | 6806 | 0.748 | 1.79 | 0.72 | 8.8 | 0.44 | 2.95 |
| 40. Brazil | 39 | 12856 | 0.598 | 0.63 | 0.31 | 21.4 | 0.16 | 2.02 |
| 41. Czech Rep. | 48 | 25149 | 0.788 | 0.48 | 0.48 | 6.3 | 0.05 | 1.27 |
| 42. Mexico | 45 | 15910 | 0.590 | 0.54 | 0.24 | 7.1 | 0.07 | 1.14 |
| 43. Jordan | 40 | 8043 | 0.667 | 0.46 | 0.46 | 2.6 | 0.13 | 1.06 |
| 44. Turkey | 47 | 16994 | 0.557 | 0.37 | 0.28 | 5.1 | 0.05 | 0.90 |
| 45. China | 41 | 7231 | 0.539 | 0.31 | 0.17 | 7.3 | 0.12 | 0.85 |
| e-rank | /GDP | |||||
|---|---|---|---|---|---|---|
| 1. Switzerland | 5 | 760.78 | 549.55 | 38484.1 | 60.84 | 3234.53 |
| 2. Israel | 2 | 770.45 | 597.42 | 26678.9 | 90.16 | 2701.83 |
| 3. Germany | 8 | 556.15 | 436.80 | 21062.6 | 52.55 | 2046.09 |
| 4. Sweden | 11 | 541.20 | 408.43 | 21582.7 | 50.95 | 2028.76 |
| 5. France | 7 | 468.31 | 345.36 | 22404.5 | 52.89 | 1933.89 |
| 6. Denmark | 16 | 552.87 | 413.46 | 19004.5 | 44.70 | 1916.56 |
| 7. Belgium | 13 | 464.85 | 356.31 | 18868.3 | 45.93 | 1764.58 |
| 8. United Kingdom | 12 | 426.24 | 324.50 | 17749.2 | 47.09 | 1638.20 |
| 9. Finland | 15 | 464.80 | 343.50 | 16268.2 | 44.79 | 1621.71 |
| 10. Italy | 14 | 462.38 | 399.94 | 16245.2 | 45.68 | 1614.58 |
| 11. Austria | 27 | 467.86 | 308.66 | 13553.1 | 30.09 | 1454.18 |
| 12. Netherlands | 24 | 346.27 | 264.71 | 16151.2 | 33.14 | 1418.55 |
| 13. Canada | 22 | 380.91 | 298.71 | 14475.0 | 35.89 | 1403.37 |
| 14. Spain | 17 | 377.60 | 280.30 | 13784.6 | 44.28 | 1347.12 |
| 15. Cyprus | 6 | 489.74 | 267.04 | 11504.6 | 58.43 | 1332.02 |
| 16. Portugal | 9 | 402.44 | 298.21 | 12450.9 | 51.88 | 1323.19 |
| 17. Estonia | 4 | 310.98 | 245.85 | 14675.1 | 64.03 | 1290.59 |
| 18. Slovenia | 10 | 353.76 | 238.47 | 13903.5 | 51.14 | 1287.40 |
| 19. Iceland | 25 | 476.67 | 380.00 | 8336.7 | 33.02 | 1273.50 |
| 20. United States | 30 | 290.89 | 215.52 | 13614.6 | 24.86 | 1187.14 |
| 21. Ireland | 29 | 355.19 | 259.41 | 10419.3 | 25.69 | 1135.56 |
| 22. Greece | 18 | 322.66 | 252.97 | 9874.5 | 42.41 | 1069.35 |
| European Union | 297.91 | 215.77 | 10022.5 | 31.59 | 1014.81 | |
| 23. Norway | 42 | 262.81 | 195.31 | 7447.9 | 14.00 | 830.50 |
| 24. Hungary | 19 | 226.14 | 157.72 | 8785.9 | 39.70 | 823.16 |
| 25. Armenia | 1 | 274.94 | 209.09 | 5706.5 | 150.46 | 769.35 |
| 26. Australia | 39 | 221.73 | 170.55 | 7212.3 | 17.72 | 752.90 |
| 27. Croatia | 20 | 235.43 | 176.97 | 5735.7 | 39.12 | 699.18 |
| 28. Poland | 21 | 214.02 | 147.64 | 6393.5 | 37.49 | 681.34 |
| 29. Taiwan | 34 | 182.44 | 141.43 | 5959.0 | 19.95 | 621.82 |
| 30. Japan | 40 | 192.89 | 145.94 | 5409.8 | 17.44 | 609.32 |
| 31. Chile | 23 | 190.64 | 158.42 | 4763.3 | 33.86 | 587.22 |
| 32. Czech Rep. | 33 | 201.85 | 143.87 | 3618.6 | 21.02 | 526.65 |
| 33. South Korea | 36 | 158.01 | 126.29 | 4080.2 | 18.97 | 488.31 |
| 34. Russia | 31 | 154.18 | 104.90 | 4029.9 | 23.74 | 460.58 |
| 35. Georgia | 3 | 158.70 | 117.25 | 3671.7 | 88.78 | 459.54 |
| 36. New Zealand | 46 | 119.54 | 87.42 | 3520.1 | 12.42 | 382.98 |
| 37. Bulgaria | 26 | 134.16 | 88.24 | 3205.6 | 30.90 | 382.68 |
| 38. Slovakia | 41 | 118.89 | 72.96 | 2439.4 | 15.20 | 313.82 |
| 39. Uruguay | 38 | 92.61 | 76.32 | 2119.0 | 18.14 | 274.89 |
| 40. Malta | 54 | 82.50 | 72.50 | 1405.0 | 8.18 | 225.25 |
| 41. Argentina | 44 | 66.17 | 55.97 | 1641.4 | 12.29 | 204.21 |
| 42. Singapore | 69 | 82.24 | 62.29 | 1055.8 | 2.99 | 197.32 |
| 43. Brazil | 43 | 62.14 | 48.59 | 1207.4 | 13.16 | 171.11 |
| 44. Iran | 50 | 58.02 | 48.63 | 923.5 | 9.81 | 152.83 |
| 45. Romania | 51 | 58.77 | 42.72 | 823.5 | 9.69 | 142.67 |