Multiple Mg ii Absorption Systems in the Lines of Sight to Quadruply Lensed Quasar H1413+1143
Abstract
We find multiple Mg ii absorption systems at redshift , , and in the spatially resolved spectra of the quadruply gravitationally lensed quasar H1413+1143 utilizing the Kyoto tridimensional spectrograph ii (Kyoto 3D ii) spectrograph on board the Subaru telescope. Here we present the first measurement of differences in Mg ii absorption strength of the multiple intervening absorbers, which include ones identified as damped Lyman (DLA) absorption systems. Our detection of the significant Mg ii absorptions in the spatially resolved spectra reveals the inhomogeneous chemical enrichment on scales of about kpc within the separation of the four sightlines. For the DLA system at , the rest equivalent widths of the Mg ii absorption lines between the four spatially resolved lines of sight change by factors of up to , which trace the variations in the H i absorption strength. This suggests that inhomogeneous cold absorbers that give rise to the strong H i/Mg ii absorptions dwell on a scale of about kpc between the four lines of sight. We also investigate the degree of variation in the equivalent width of the absorption lines between the lines of sight. We find that the systems giving rise to strong absorptions in the spectra of the quadruply lensed quasars tend to have a high degree of variation in absorption strength between the lines of sight toward the lensed quasars.
1 Introduction
The absorption line systems found in quasar spectra, the so-called ‘quasar absorption systems’, provide us with a unique probe of galaxy formation and evolution processes. The systems offer valuable opportunities to explore the physical and chemical conditions of intergalactic media and/or intervening galaxies (e.g., the amounts of neutral gas and metals, the gas dynamics). In particular, metal absorption systems have been studied extensively to place stringent constraints on the galaxy formation and evolution processes because the absorption feature provides the basic information about the abundance of absorbing gas and its metal content.
The gravitationally lensed quasars have been given much attention, since the quasars show the multiple spectra toward the background images, which provides us with valuable information on the intervening absorption systems. The variations of dynamical and chemical structures in the intervening absorbers produce a variety of absorption features in the spectra, such as the absorption strength and the velocity width of the absorption lines. Focusing on triply or quadruply lensed quasars, several quasars have multiple spectra of the separate images where hydrogen and/or metal absorptions at the same redshift are identified at the same redshift (e.g., APM08279+5255, J1004+4112). The multiple absorption line features is a unique probe of the detailed spatial structures of the absorbing gas and metals on scales of the separation of the sightlines (e.g., tens of parsecs to a few tens of kiloparsecs).
The quasar H1413+1143 at emission redshift is one of the quasars given much attention due to a quadruple gravitational lens, which is often referred to as the Cloverleaf (e.g. Hazard et al., 1984; Drew & Boksenberg, 1984; Magain et al., 1988). The spectrum of quasar H1413+1143 shows a variety of absorption lines together with a presence of the broad absorption lines (BALs). In the previous studies, however, the images separated by the gravitationally lensing were not available due to low spatial resolution. The spectroscopy contained all the four absorbing components in a composite spectrum that is not spatially-resolved . In the composite spectrum, Hazard et al. (1984) and Drew & Boksenberg (1984) identified the BALs and metal absorption lines (e.g., Al iii, C iv) at absorption redshifts and . Turnshek et al. (1988) subsequently presented a detailed study of the spectrum including the BALs and metal absorption lines at , and . Utilizing the New Technology Telescope, Magain et al. (1988) first identified quasar H1413+1143 as a gravitationally lensed system where four image-components all lie within about arcsec of the image center. Furthermore, the medium-resolution Faint Object Spectrograph (FOS) spectra on board the Hubble space telescope (HST) successfully separated the four individual images of quasar H1413+1143. In the multiple spectra of the four individual images, the intervening absorbers give rise to neutral hydrogen absorption lines at including a damped Lyman (DLA) system (the H i column densities cm-2 ) at and a sub-DLA ( cm-2 cm-2) at (Monier et al., 1998). The subsequent study of absorbers in the near-UV spectra, utilizing the Space Telescope Imaging Spectrograph (STIS) on board the HST, revealed (sub-)DLA systems at and in addition to the DLA at (Monier et al., 2009). The multiple lines of sight toward the quadruply lensed quasar can probe the properties of the intervening absorption systems not only along the sightlines but along the transverse direction toward the sightlines. Over the sightline separations about within arcsec (corresponding to the transverse size of about kpc at ), the H i column densities in the three (sub-)DLA systems typically change by factors of (Monier et al., 2009), indicating a presence of the variations in H i gas density on the scales within ten kilo-parsecs of the sightline separations.
In the spatially resolved spectra toward four image-components (A, B, C, and D), the variation of metal absorption strengths in the four spectra has also been given much attention. Monier et al. (1998) found a strong Fe ii absorption system at in the HST-FOS spectrum toward component B, while the Fe ii absorption line is absent toward the other C component. Furthermore, the authors also presented a detailed study of metal absorption systems at , and , which show the presence of various metal absorptions, e.g., Si ii , Si iv , C ii , C iv , Al ii , Al iii , and several Fe ii transitions except for Mg ii . Similar to the H i absorption systems, the metal absorption systems provide clear evidence for differences in absorption strength in the four individual spectra. Specifically, a significantly strong absorption is detected in a spectrum toward one of the lensed image-components but the others. This suggests that chemical enrichment differs at least on scales within the separations of the sightlines similarly to the variation in H i absorption strength. The results are based mainly on the metal absorption lines due to the ion-transitions within the wavelength coverage of the HST-FOS spectra. However, the studies have not been able to measure metal transition lines like the Mg ii doublet lines.
The Mg ii absorption system is one of the most studied tracers of chemical enrichment in cold gas since the ionization potential ( Ryd) is close to that of neutral hydrogen (e.g. Bergeron & Stasiska, 1986). Furthermore, the Mg ii absorption is ideal for investigating metal-enriched cold gas, which is optically thick against the photo ionizing radiation, where it arises in H i absorption systems with a wide range of H i column densities, cm-2 (e.g. Steidel Sargent, 1992; Churchill et al., 2000; Rigby, Charlton, & Churchill,, 2002; Rao, Turnshek, & Nestor, 2006; Rao et al., 2017; Mnard & Chelouche, 2009). For example, DLA systems often give rise to strong Mg ii absorption lines. The number fraction of Mg ii systems that are also identified as (sub-)DLA systems increases toward large equivalent widths of the Mg ii absorption lines. For 70 DLA systems at , or more Mg ii systems with the rest equivalent width are also identified as DLA systems (Rao et al., 2017). In addition, at high redshift , there is also a trend that Mg ii systems with () are likely associated with DLA systems (e.g. Matejek et al., 2013). The results suggest that strong Mg ii systems originate primarily from gas systems with high neutral hydrogen column densities in the circumgalactic medium (CGM) around galaxies, particularly at high redshift. Previous studies revealed that Mg ii systems trace the dynamical and chemical structure of the CGM such as gas-flows (e.g. Tremonti et al., 2007; Rubin et al., 2010; Kacprzak et al., 2011; Nestor et al., 2011; Bouch et al., 2012; Martin et al., 2012, 2019; Bordoloi et al., 2014; Rubin et al., 2014, 2018a; Schroetter et al., 2016, 2019). Constraining the properties of CGM through the Mg ii absorption has been based statistically on the studies using a Mg ii absorption line in a spectrum along a line of single sight toward a background quasar or galaxy. Utilizing the single Mg ii absorptions, there has been growing statistical evidence for metal enrichment in the CGM.
Here we focus on metal distribution based on the spatial extent of individual Mg ii absorption lines in the spectra toward multiple background quasars (e.g., quadruply or triply lensed quasars). The current sample of multiple Mg ii absorption systems is quite limited, since there are only a handful of quadruply or triply lensed quasars giving rise to Mg ii absorption lines in the spectra with high resolution (e.g. Rauch et al., 2002; Ellison et al., 2004; Chen et al., 2014; Rubin et al., 2018b). For example, Rubin et al. (2018b) focused on a quadruply lensed quasar J014710+463040 at . The authors measured Mg ii absorption strengths in the four separate spectra toward the quadruply lensed images and investigated a degree of spatial coherence for the multiple Mg ii absorbers over scales of up to kpc at . At , quadruply or triply lensed quasars (e.g., J1004+4112, APM08279+5255) provide the multiple Mg ii absorption lines (e.g. Oguri et al., 2004; Ellison et al., 2004). However, there is still a quite limited sample to evaluate the variation in Mg ii absorption strength due to small incidence rates of the absorption lines and/or small separations of the sightlines. For the quadruply lensed quasar H1413+1143, there have not been identified Mg ii absorption lines individually in the four spatially resolved spectra.
Here, utilizing the Kyoto tridimensional spectrograph ii (Kyoto 3D ii) spectrograph on board the Subaru telescope, we find multiple Mg ii absorption systems at , , and with high incidence rates on scales of up to kpc in the spatially resolved spectra of quasar H1413+1143. The high signal-to-noise (S/N) spectroscopy covers the wavelengths of and also achieved the S/N necessary to assess the Mg ii absorption equivalent widths associated with the systems previously identified in hydrogen and the other metal absorptions. The measurements of equivalent widths in the separate components for the Mg ii doublet absorption lines at offer a probe of a presence of variations in Mg ii absorption strength like that of H i absorption lines due to the transition with the ionization energy similar to that of Mg ii. For the Mg ii absorption systems in the spectra of the quadruply lensed quasar H1413+1143, we here focus on the followings. Does the variation in Mg ii absorption strength between the multiple lines of sight trace that of neutral hydrogen with the H i column densities changing by factors of up to at (e.g. Monier et al., 2009)? Is the variation in Mg ii absorption strength consistent with those in high-/low-ion absorption strength? Focusing on the Mg ii absorption lines in the gravitationally lensed quasar, does the variation in absorption strength depend on separations between the absorbers or equivalent widths of the absorbers?
In Section 2, we describe our observations in detail. The results are presented in Section 3. Several implications from our results are derived in Section 4. Finally, we draw our conclusions in Section 5. In this paper, we adopt a standard CDM cosmological model with parameters, , , and the Hubble constant km s-1 Mpc-1.
2 Observations
The quasar H1413+1143 at has four image components A/B/C/D by gravitational lensing which all lie within arcsec of the center (Figure 1). We observed the H1413+1143 on 2017 February 8 with the Kyoto 3D ii optical integral field units (IFU) at a Nasmyth focus of the Subaru telescope. In combination with a 188-element adaptive optics (AO) system, Subaru AO188 (Hayano et al., 2008; Minowa et al., 2010), the Kyoto 3D ii can provide the AO-assisted optical integral-field spectroscopy with (Matsubayashi et al., 2016). The Kyoto 3D ii is installed with a Hamamatsu fully depleted charge-coupled device (CCD; Mitsuda et al. (2016)). The observed wavelength band was No.5 (Matsubayashi et al., 2016) which can cover the range of the wavelength (a wavelength sampling rate of pixel-1) with high sensitivity at . The spectral resolution is . The field of view (FoV) is about .
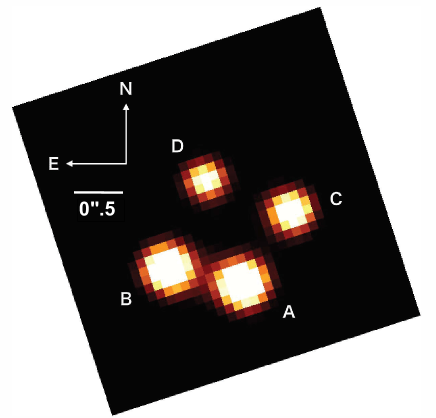
We used a laser guide star AO (LGS-AO) mode of AO188 (Hayano et al., 2008, 2010). Utilizing component A ( mag) of the H1413+1143 image as a tip-tilt guide star (TTGS), we obtained the AO-corrected FWHM of arcsec. The total on-source exposure time is sec ( sec frames).
We used the custom-made IRAF scripts (Sugai et al., 2010) which are adapted for the installed deep depletion CCD. The bias subtraction, the spectrum extraction, and the flat-fielding are included in the reduction process. We used the L.A.Cosmic for removing cosmic rays (van Dokkum, 2001). After the wavelength calibration, sky subtraction was performed on the sky aperture spectra. Based on the Kyoto 3D ii spectroscopy, we simultaneously obtained the spectra of the object and sky, which is about away from the object field. The flux was calibrated using a standard star. Here, using the normalized spectrum of the standard star Feige 67, we corrected the atmospheric absorption features in the spectra. After the flux calibration, we combined the frames and carried out the spectral fitting in the obtained spectra. The individual spectrum was extracted from the data cube for each lensed object. We used an aperture size of arcsec around the center of each object. The continuum fitting was performed by fitting a third-order polynomial function to the spectrum for each object in a wavelength range between and , except the range where the absorption lines are located.
3 Results
In Figure 2, we show the extracted spectra within the limited wavelength ranges around detected absorption lines: (left panel) and (right panel). In the spectra, we find seven absorption features (Nos.1-7) in the lines of sight toward components A/B/C/D of the gravitationally lensed image (hereafter, the A/B/C/D spectra, respectively). The spectra shown in the left panel of Figure 2 clearly present a strong Mg ii absorption line at . The absorption line No.1 appears to suffer from a self-blending effect; blue and red lines of the doublet caused by two transitions, , are blended due to the spectral resolution (). We find that the line is well fitted by a two-component Gaussian profile with different central wavelengths and widths; the bluer and stronger component No.1a and the other No.1b. To fit the two components simultaneously, we adopt two double-Gaussian functions (for the rest wavelengths of and ), for which two redshifts are treated as free parameters. The relative central wavelengths of the Mg ii double lines are fixed. Two independent velocity widths are assumed for the two components at different redshifts. The amplitudes of all the four lines are treated as free parameters. The best-fit parameters of the profiles are determined using a minimization method. The resultant errors account for the effect of degeneracy between the parameters for fitting the line by the two components.
In Figure 3, we present the A/B/C/D spectra in which the absorption line (No.1) is fitted by the doublet lines of the two components: one (No.1a) at giving rise to a doublet at (red) and (blue) in the rest frame and another (No.1b) at with a doublet at (green) and (magenta) . In Table 1, we present both the total rest equivalent widths of the blended absorption line (No.1), , and the rest equivalent widths of the doublets for the two components (No.1a and 1b) in the four A/B/C/D spectra. In addition to the Mg ii absorption lines, two Mg i absorption lines are identified at and (Nos.2-3). The rest equivalent widths are also presented in Table 1. Furthermore, we identify a Mg ii absorption doublet (Nos.4-5) at in the A/B/C spectra and one (Nos.6-7) at in the B spectrum.

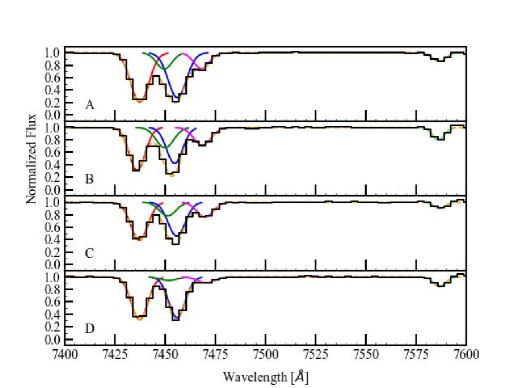
In summary, the four spectra toward the spatially resolved four images present the Mg ii doublet line (), which is composed of two components are identified at absorption redshift (No.1), the Mg ii doublet lines at (Nos.4-5) and (Nos.6-7), and the two Mg i absorption lines at (No.2) and (No.3). In Table 1, the rest equivalent widths of the absorption lines are summarized. For undetected absorption lines in the spectra, we include upper limits on the rest equivalent widths based on our detection limit.
The presence of the multiple Mg ii/Mg i absorption lines in the spectra toward the separate four-images are reported for the first time while a composite Mg ii absorption line at is previously identified in a spectrum in the unseparated line of sight toward the composite image using the Keck Low Resolution Imaging Spectrometer (LRIS) (e.g. Drew & Boksenberg, 1984). The HST-FOS provided the separate spectra in the lines of sight toward the resolved images. However, the FOS does not extend the wavelengths of Mg ii absorption lines at in the A/B/C/D spectra (e.g., Monier et al. 1998; Table 3 in Monier et al. 2009). The wavelength coverage of the Kyoto 3D ii spectra allows the first measurement of equivalent widths in the separate spectra for the Mg ii absorption line at together with the Mg i absorption lines and other Mg ii absorption lines at and .
The gravitationally lensed images provide the multiple lines of sight that offer a unique and valuable probe of the spatial structure of the intervening absorbers by mapping the transverse dimension. Here we compute the physical distance in the transverse direction to use the following equations (e.g. Smette et al., 1992; Cooke et al., 2010). The physical distance, , in the transverse direction between different lines of sight depends on the redshifts of the absorber and the lens . In the case that , where is the angular separation and is the angular diameter distance from the observer to the absorber. When , where , , and are the angular diameter distances from the observer to the lens, the source to the absorber, and the source to the lens, respectively. For the absorbers in lines of sight to the lensed quasar H1413+1143 at source redshift , the lens object has not been precisely identified. The measurements of the time delays between the lensed images provide estimations of possible redshifts of the lensing galaxy, (e.g. Goicoechea & Shalyapin, 2010; Akhunov et al., 2017). Here we adopt the redshift of lens . The observed angular separations between the four spatially resolved lines of sight A/B/C/D are ((), (), (), (), (), ()) = (, , , , , ) arcsec (e.g. Monier et al., 2009). For the system at , the angular separations give the proper distance in the transverse direction between the four spatially resolved lines of sight A/B/C/D; ((), (), (), (), (), ()) = (, , , , , ) kpc. For the system at , ((), (), (), (), (), ()) = (, , , , , ) kpc. It should be noted that the uncertainty in the redshift of the lens may affect the estimation of the physical distance in the transverse direction between the lines of sight at . The possible lensing galaxy may belong to a galaxy cluster/group, which implies the lens redshift (e.g. Kneib et al., 1998a; Kneib, Alloin, & Pello, 1998b; MacLeod, Kochanek, & Kochnek, 2009). If the lens redshift is adopted, for the systems with , the distance would decrease by a factor of . For the system at , the largest distance between the line of sight to image B and that to image C is kpc, and the smallest one between the lines of sight to images A and B is kpc.
3.1 Mg ii/Mg i System at
The spectra shown in the left panels (from top to bottom) of Figure 2 clearly present a strong Mg ii absorption line (No.1) at in all four A/B/C/D spectra. In Table 1, we present the rest equivalent widths of the Mg ii absorption line. The rest equivalent width in the A spectrum is the largest in the four A-D spectra whereas that in the D spectrum is the smallest. Comparing the rest equivalent widths in the four spectra to each other, the rest equivalent widths change as A B C D by factors of up to . Due to the blending effect on line No.1, two components (No.1a 1b) are needed to fit the line profile. In Table 1, the rest equivalent widths of the Mg ii doublet absorption lines in the two components (No.1a 1b) are also presented separately. For the No.1a component, the rest equivalent widths are clearly larger than those in the No.1b component. For example, line No.1a in the A spectrum has a rest equivalent widths of , which is about three times larger than those of line No.1b. The rest equivalent width of line No.1a in the A spectrum is the largest in the A-D spectra whereas that in the C spectrum is smallest. The rest equivalent widths changes by factors of up to . For example, the rest equivalent width of the Mg ii absorption line, , changes as A D B C. The second component of No.1b shows moderate absorption strengths with rest equivalent widths or less. By contrast to line No.1a, the rest equivalent widths of line No.1b clearly change by factors of up to about : B A C D. The No.1b line at shows large differences in equivalent width between the lines of sight rather than the No.1a line at . The result indicates a presence of the variation in Mg ii absorption strength on scales within arcsec of the separation between the four lines of sight, which corresponds to the transverse proper size of about kpc.
In the spectra, the Mg ii doublet absorption lines nearly fall at the wavelength corresponding to that of the H i absorption line at , which was previously identified in the HST-FOS observation (Monier et al., 2009). In Table 1, we also present the H i column densities of the H i absorption lines for the individual components in the four A/B/C/D spectra. Monier et al. (2009) found that the H i column densities typically change by factors of : B A C D. The H i absorption system at shown in the FOS spectrum toward component B is a typical DLA system with the highest H i column density, cm-2, while the H i column density in the spectrum toward component D is the lowest, cm-2. The variation in H i column density is likely similar to that in Mg ii absorption strength, which also exhibits the equivalent widths changing as B A C D. In Section 4, we will draw a detailed comparison of the variations between the lines of sight toward quasar H1413+1143.
For the Mg ii absorption line No.1a, we obtain doublet ratios (DRs) of the equivalent width of the absorption line at to that at , DR () , and in the A, B, C, and D spectra, respectively. For the line No.1b, DR, and in the A, B, C, and D spectra, respectively. In Section 4, we will discuss the implications from the DRs between the Mg ii systems in the four lines of sight.
We also identify two possible Mg i absorption lines at (No.2) and (No.3) in all the four separate spectra. The rest equivalent widths of Mg i absorption lines are shown in Table 1. The equivalent widths of line No.2 change by factors of : B A D C, while for line No.3, the equivalent widths change by factors of : C D A B. It should be noted that line No.2 is properly aligned with the corresponding Mg ii system at . However, line No.3 could be due to a different transition arising from a system at a different redshift, since it has a relatively large velocity difference ( km s-1) from the Mg ii system at . The high-resolution spectra will be required to determine the origin of the velocity difference more correctly.
3.2 Mg ii System at
In Figure 2 (right panels), we find strong Mg ii absorption doublets (No.4 5) at in the A/B/C spectra. By contrast, no Mg ii absorption line is detected in the D spectrum. The rest equivalent width of the Mg ii line in the A spectrum, , is the largest in the three absorption lines. The rest equivalent widths change by factors of up to ; A C B. Similar to the Mg ii systems at , a presence of the variation in Mg ii absorption strength is found for the system at . In the A, B, and C spectra, the Mg ii doublets exhibit the ratios DRs of , , and , respectively. In Section 4, we will make a detailed comparison of the variations in absorption strength between the lines of sight and address the difference in DR of the Mg ii doublets.
3.3 Mg ii System at
In Figure 2 (right panels), we also find a Mg ii absorption doublet (No.6 7) at in the B spectrum, while no Mg ii absorption line is detected in the other A/C/D spectra. The Mg ii absorption line presents the rest equivalent width of in the B spectrum. It should be noted that this system at is also identified as a sub-DLA system with H i column density cm-2 which rise a strong Ly absorption line with the rest equivalent width of in the B spectrum (Monier et al., 1998). In the other A, C, and D spectra, the strong H i absorptions are also identified with the rest equivalent widths , , and , respectively. The sub-DLA system shows little difference in the H i column densities between the three A/C/D spectra. This suggests that the system at in the B spectrum shows the strongest H i absorptions in the four spectra, which is consistent with our result that the Mg ii absorption line is identified only in the B spectrum. For this system in the B spectrum, we obtain a doublet ratio DR of . In Section 4, we further investigate the differences in absorption strength of the lines including the Mg ii absorption line.
4 Discussion
The multiple and coincident absorption lines offer valuable information about the chemical and dynamical structures of the intervening system along the sightlines toward background radiation sources. In particular, the quadruply gravitationally lensed quasar H1413+1143 provides the four separate spectra which produce several absorption lines on scales of ten kilo-parsecs between the lines of sight. In this section, we discuss the variation of Mg ii absorption lines in the spatially resolved four spectra obtained by the Kyoto 3D ii in comparison to those of the other absorption lines identified in the previous observations.
4.1 Mg ii systems at
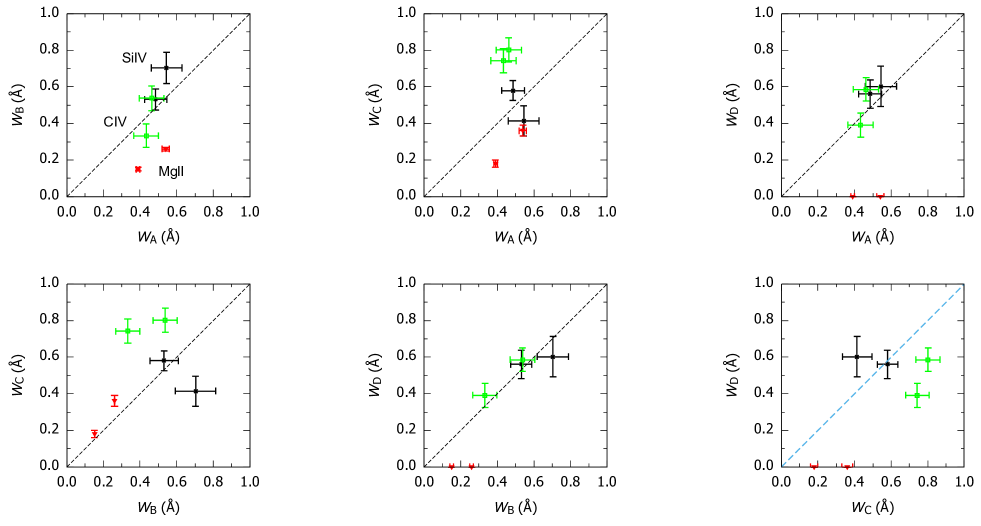
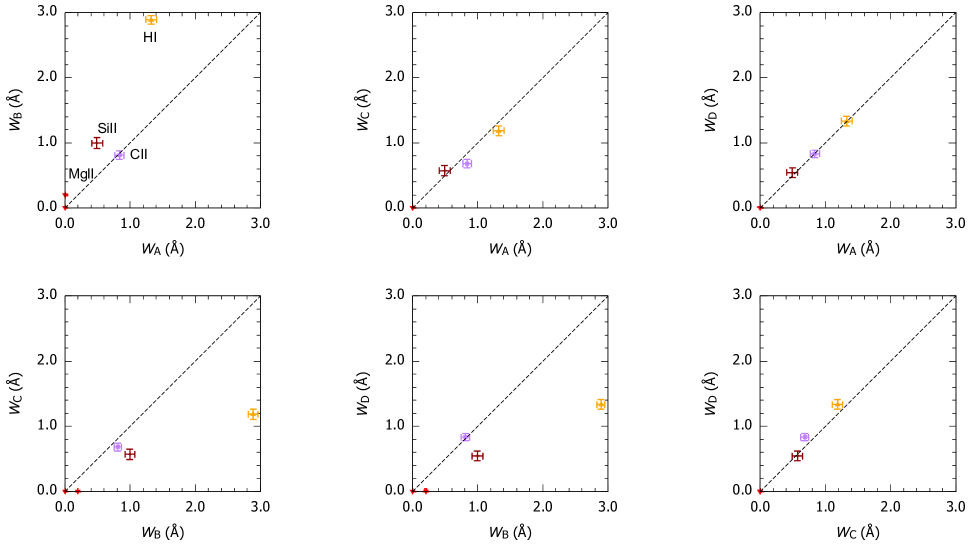
In Figure 4, we show the rest equivalent widths (EWs) of the Mg ii absorption lines in the A and B spectra for comparing to those of the other metal absorption lines at . We plot the rest EWs of a Mg ii absorption line (No.1) at together with those of the Mg ii doublets (No.1a 1b) for the two components (red). For the rest EW of line No.1, we plot a half of the total EW () due to the blending of the doublet. Focusing on our result for the Mg ii absorption lines (No.1, No1a, and No.1b), we find that the variation of the rest EWs in the A and B spectra changes within factors between (dotted lines). For example, the No.1a line at exhibits the ratio of EWs between the A and B spectra, , of . The No.1b line at gives the ratio of .
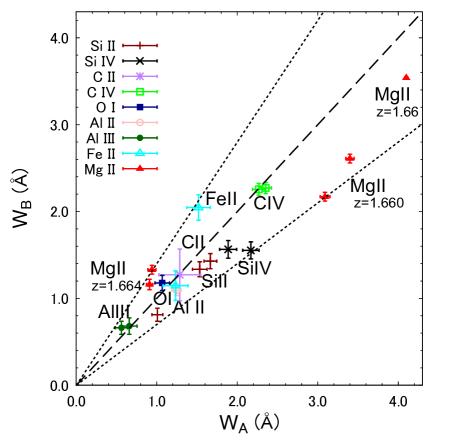
The spectra in the previous observations provided various metal absorption lines at : O i , C ii , Si iv , Si ii , C iv , Al ii , Al iii , and Fe ii transitions (e.g. Hazard et al., 1984; Drew & Boksenberg, 1984). In the spatially resolved spectra toward four components of the H1413+1143 images, Monier et al. (1998) investigated the difference in metal absorption strength between the sightlines using the HST-FOS. The observation allowed the precise measurement of EWs of the metal absorptions (but Mg ii doublets). For example, in the A and B spectra, there is little difference between the EWs of the metal absorption lines. In Figure 4, we also show the EWs of the metal absorption lines in the A and B spectra. The result indicates that the EWs of low (e.g., C ii, Si ii) and high (e.g., C iv, Si iv) ions do not significantly differ from each other between the lines of sight to the images A/B. The EWs of the metal absorptions, including our measurements of the Mg ii EWs, change by factors between and . We find that the degree of the variation of Mg ii EWs between the A and B spectra is not significantly different from those of the other metal EWs.
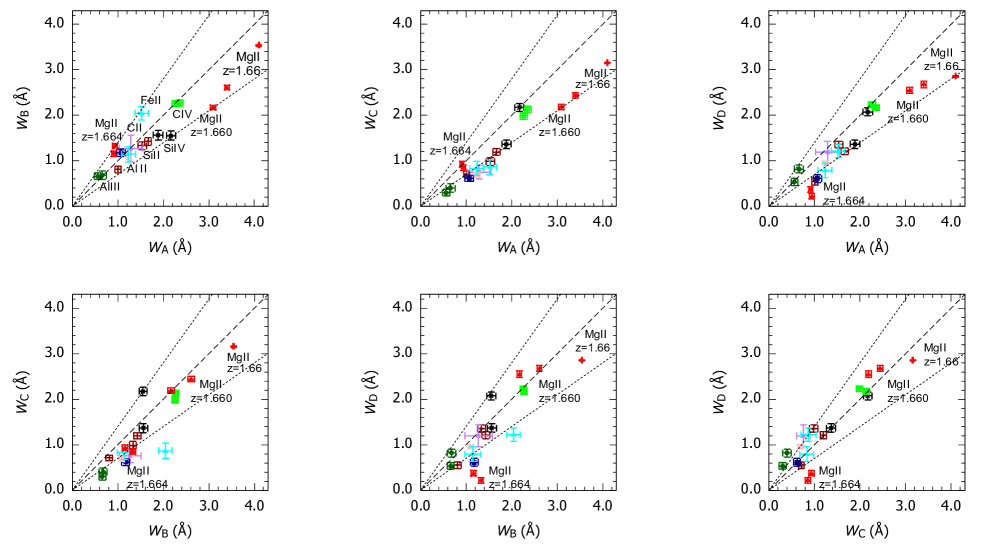
In Figure 5, we summarize the EWs of various metal absorption lines, including our measurements of Mg ii absorption lines (red), in the pair-lines of sight toward four images A/B/C/D. For the metal absorptions but Mg ii, Monier et al. (1998) noted that the A spectrum shows the strongest absorption lines in the four spectra. Our result also shows that the strongest Mg ii absorption line (No.1) at is detected in the A spectrum (Table 1). Similar to the results for the variation of the EWs between the A and B spectra in Figure 4, the EW variations of metal absorptions do not significantly differ from that of the Mg ii absorption line (No.1) at (red) between the A/B/C/D spectra. Furthermore, the rest EWs of the Mg ii doublet in line No.1a at (red) are also plotted. We find the variation in EW of the Mg ii absorption line (No.1a) is similar to that of the blended line (No.1). For example, the absorption line No.1a in the A spectrum also shows the largest EW (Table 1). This indicates that Mg ii absorption line (No.1a) at likely arises from the absorber, which also gives rise to the other metal absorption lines previously identified at (Monier et al., 1998). By contrast, for the No.1b line at , the B spectrum shows the strongest absorption, while the D spectrum shows the weakest, as mentioned in the previous section. In Figure 5, the EWs of the Mg ii doublets at (red) are also shown, together with those of the other metal lines at . We find that, for line No.1b, the EW differences between the lines of sight to the images A/B/C are similar to those of metal lines at . However, the difference between the D spectrum and the other A/B/C spectra appears to be large due to the small EWs of the Mg ii doublets No.1b at in the D spectrum.
Here we also focus on a degree of the variation in EW between the two spectra in the four lines of sight toward components A/B/C/D more precisely. In Figure 6, we show the ratios between the Mg ii EWs in the pair-sightlines toward four images A/B/C/D, together with those of the other metal absorption lines. Our measurements of Mg ii absorption No.1, No.1a, and No.1b are denoted as Mg ii1, Mg ii1a, and Mg ii1b, respectively. The ratios between the EWs of the Mg ii absorption lines (No.1) at in the pair of lines of sight toward the four images A/B/C/D change by factors between and , while those of the other metal absorption lines change by factors between and .
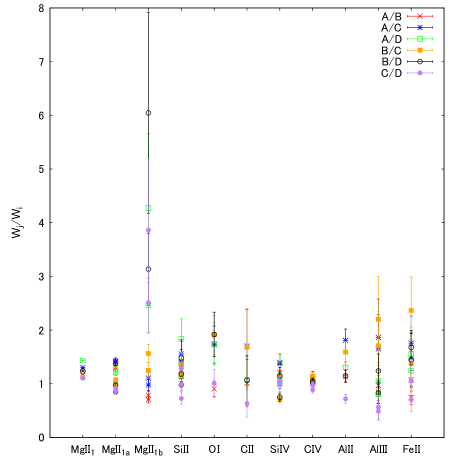
For the No.1b line at , we find that the EW ratios change by factors of up to , which obviously differs from those of Mg ii and the other metal absorption lines at . The Mg ii-EW in the D spectrum is obviously smaller than those in the A/B/C spectra. This mainly causes the large ratios of Mg ii-EWs shown in Figure 6. The large ratios suggest that the physical properties of component No.1b is not likely similar to those of component No.1a. The No.1b component at may not be associated with the absorbers at since the comoving distance between the two systems is Mpc along the line of sight assuming only the Hubble expansion.
In the four A/B/C/D spectra, the column densities of H i absorption lines change by factors of up to between the B and D spectra (Table 1). The high degree of the variation in H i absorption strength is similar to those of the Mg ii absorptions (No.1b) at . Furthermore, for the system at , the EWs of Mg ii absorption change as B A C D, which is qualitatively equivalent to the decreasing order in the H i absorption strength (Table 1). Although it is still unclear that the DLA system arises which Mg ii absorptions at or , the results indicate an inhomogeneous spatial distribution of Mg ii and H i absorbers at on scales of the separation in the transverse direction between the multiple background images A/B/C/D within arcsec corresponding to the physical scale of kpc. The spatial distribution of the multiple and coincident absorptions indicates that Mg ii absorbers trace inhomogeneous H i absorbers (DLA systems) on scales within kpc in the CGM if a galaxy is embedded in the halos with CGM, clouds, or galactic flows. For example, recent studies of the CGM have focused on the galactic feedback process through a relationship between H i absorbers and metal ones. They often provided strong evidence that low-ionization metal absorption systems, in particular, strong Mg ii systems with large equivalent width , originate from galactic outflows (e.g. Nestor et al., 2011; Bouch et al., 2012; Turner et al., 2014). Moreover, the Mg ii-selected DLAs at show a correlation between the H i column density and the rest EWs of Mg ii, (Mnard & Chelouche, 2009) . Specifically, the high- systems likely exhibit strong Mg ii absorptions. This is consistent with the variations in H i and Mg ii absorption strengths in the spectra of quasar H1413+1143. In the four lines of sight to the H1413+1143 images, the inhomogeneous metal-enrich H i gas gives rise to the DLA absorption lines, together with the Mg ii absorptions.
4.2 Mg ii system at
In Figure 7,
we show the EWs of metal absorption lines including our measurement of the low-ion doublet Mg ii (No.4 5) at (red) in the pair of sightlines toward four images A/B/C/D. Monier et al. (1998) identified the high-ions doublets Si iv (black) and C iv (green) at and made comparisons of the rest EWs between the four lines of sight. For the C iv doublet, the absorption line is strongest in the C spectrum and approximately the same strength in the A, B, and D spectra. Our result reveals that the absorption strengths of the low-ion Mg ii doublet lines changes as A C B, with no detection in D. This clearly differs from the variations of the high-ion absorption strength.
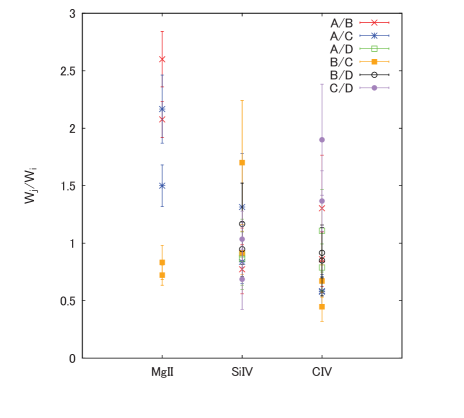
For a detailed comparison of the EWs between the four lines of sight, in Figure 8, we show the ratios of the EWs for the Mg ii, C iv, and Si iv doublets in the pair-sightlines. We find that the ratios of the Mg ii EWs in the pair-lines of sight A/B/C change by factors between and , which do not significantly differ from those of the high-ion doublets of C iv and Si iv between and . However, in the D spectrum, the Mg ii doublet has not been detected, whereas the C iv and Si iv doublets are detected with rest EWs of , which might be due to partly blending with the other lines associated with quasar H1413+1143 (Monier et al., 1998). The difference in the Mg ii EW indicates that, in the system at , either (1) the cross section and/or filling factor of the absorbers is small, or (2) the absorber in the line of sight toward component D is highly ionized in the radiation field, which is different from that ionizing the absorbers in lines of sight toward components A/B/C. Due to the small number statistics, it is still not clear what causes the variation of the EWs between the four lines of sight. Further investigation for the system at requires more samples of the other high-/low-ion absorption lines to put constraints on the ionization structure.
4.3 Mg ii systems at
In Figure 9, we show the EWs of metal absorption lines, including our measurement of the Mg ii doublet (No.6 7) at , in the pair-sightlines toward four images A/B/C/D. The Mg ii doublet (No.6 7) at is identified in the B spectrum while no Mg ii absorption line is detected in the other A/C/D spectra (Table 1). The rest EW of the Mg ii doublet is plotted (red). This system also gives rise to the low-ion absorption lines, Si ii and C ii , in the four lines of sight. Similar to the variation in H i absorption strength in the four sightlines that is addressed in Section 3, the Si ii line is the strongest in the B spectrum, , while , , and in the A, C, and D spectra, respectively (Monier et al., 1998). The line of sight to the image B intersects the absorber giving rise to the strongest H i and Si ii absorption lines. This is consistent with our result for the Mg ii absorption line clearly detected in the B spectrum but not in the other spectra. The low-ion Mg ii/Si ii absorption lines in the B spectrum are likely associated with the sub-DLA system at . Similar to the system at , more samples of the other metal absorption lines (e.g., high-ion) are required to investigate the ionization structure of the sub-DLA system at .
4.4 Multiple Mg ii Absorption in Lines of Sight Toward Quadruply and Triply Lensed Quasars
Multiple lines of sight toward background quasars offer a unique and valuable probe of the spatial structure of the intervening absorbers by mapping the transverse dimension. In particular, the gravitational lensing produces the quadruply or triply lensed images that provide the multiple lines of sight. Utilizing the advantage of the multiple sightlines given by the quadruply or triply lensed images, the scale of variations in absorption strength has been investigated in the previous studies (e.g. Rauch et al., 2002; Ellison et al., 2004; Oguri et al., 2004; Chen et al., 2014; Rubin et al., 2018b). In Table 2, we present a compilation of the multiple Mg ii absorption EWs at in lines of sight toward quadruply and triply lensed quasars that we have used for comparing to our measurements here. The transverse distances and present the largest and smallest proper separations at the absorption redshifts between the lines of sight toward the images, respectively. For quasar H1413+1143, is the largest separation in the transverse direction between the line of sight to image B and that to image C, and is the smallest one between the lines of sight to images A and B.
4.4.1 Fractional difference versus Transverse separation
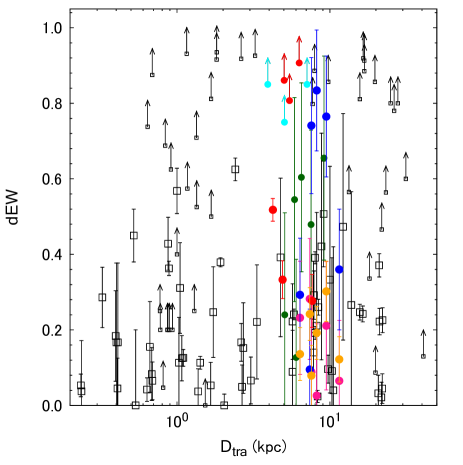
In Figure 10, we present the fractional difference, , in Mg ii EW for each pair of the sightlines as a function of physical separation in the transverse direction ,
where and are the rest EWs at in the lines of sight toward the separate images and , respectively, in a case that . For the quadruply lensed quasar, the four sight lines give six pairs of sightlines that provide six measurements of . The left panel of Figure 10 shows our measurements of (filled circles) for the Mg ii absorption lines in the spectra of the quadruply lensed quasar H1413+1143 at (No.1) (orange), (red), and (cyan), together with the previous measurement of at (green) (Monier et al., 1998). For the Mg ii systems at (orange), we find that the fractional differences are small, or less () with the transverse separations between the lines of sight of kpc kpc. For the systems that include no detection yielding lower limits at (red) and (cyan), and , respectively. The system at (green) exhibits . For the two components of line No.1 at , we also plot the measurements of of the lines No.1a (pink) and No.1b (blue): for the system at (pink) and for one at (blue). For component No.1a at (pink), the fractional differences are small, or less, which are similar to those of the blended line No.1. By contrast, the fractional differences for component No.1b at (blue) have large scatters, which are previously shown for the ratios of EWs in the pair lines of sight in Figure 6.
In Figure 10, we include the previous measurements for the other pairs of Mg ii absorption systems in the spectra of the doubly, triply, and quadruply lensed quasars and pair quasars (black open squares) in the literature 111 The studies used different cosmological parameters in order to estimate the physical separations of the quasar images for each absorption system. Several studies adopted a cosmological model with the deceleration parameter , and km s-1 Mpc-1(e.g., Crotts et al., 1994; Lopez, Hagan, & Reimers., 2000; Rauch et al., 2002). For these samples, we calculate the physical separations of the quasar images by adopting the standard CDM cosmological model (, , and km s-1 Mpc-1). (e.g. Crotts et al., 1994; Smette et al., 1995; Lopez, Hagan, & Reimers., 2000; Rauch et al., 2002; Churchill et al., 2003; Ellison et al., 2004; Oguri et al., 2004, 2008; Chen et al., 2014; Koyamada et al., 2017; Rubin et al., 2018b). The lower limits on indicate the fractional difference for systems ( of the total sample) with no detection in one line of sight. The total sample including our measurements, which include ones for lines No.1a 1b instead of the composite line No.1 has the transverse separations with a mean of kpc and a median of kpc. We compare the distributions between two subsamples that have a transverse separation smaller than kpc and larger than kpc. To assess the significance of the differences in the distributions between the two subsamples, we perform a survival analysis. A log-rank test that compares the survival distributions between the two subsamples yields a -value of , ruling out the null hypothesis that the samples are drawn from the same parent population. The subsamples having the separations of kpc and kpc give the medians (survival) of and , respectively. The absorbers with large likely have large fractional differences . Similarly, Rubin et al. (2018b) investigated the fractional differences for the multiple Mg ii systems in the lensed quasar, including the quadruply lensed quasar J014710+463040. The authors found a trend that the fractional differences depend on the transverse distance (particularly kpc) since the incident rate of smaller than decreases as the physical separation increases. Although the different detection limits in the literature make it difficult to compare the data with lower limits, the difference in the distributions may be attributed to the reason that nondetection systems yielding lower limits on likely have relatively large . Indeed, the total sample including the lower limits gives a median (survival) of which is twice as large as the one of for the subsample excluding the lower limits. The following are possible causes for the nondetection of absorption: (1) in a case where the absorber has a steep EW gradient, the large difference in EW between the separation between the lines of sight causes the no-detection of absorption in a line of sight due to the EW smaller than the detection limit, and (2) the line of sight does not penetrate the absorber, while the other line does. For example, the separations of the sightlines are much larger than the typical size of the absorbing system (e.g., single cloud or numerous small clouds), or the pairs of sightlines are not along with the absorber which structure is elongated or disklike. In this case, the samples with the lower limits could increase the values of (particularly for large ). This could cause the difference in the median of between the samples including the lower limits and those without the lower limits.
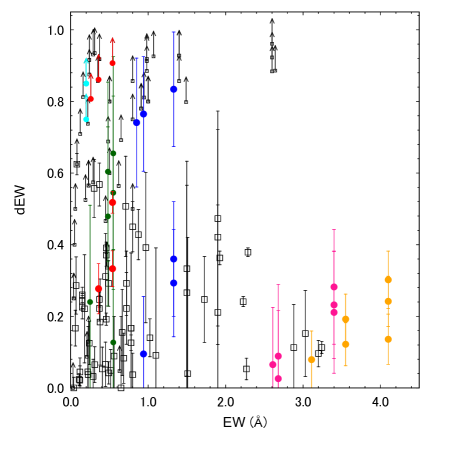
4.4.2 Fractional Difference versus Equivalent Width
Next, we focus on a relationship between the fractional difference and equivalent width EW of the Mg ii absorption lines. In Figure 11, we present the fractional difference as a function of the rest EW of Mg ii absorption lines at which is a larger one in the pair of Mg ii absorption lines. Similar to Figure 10, we present our measurements of for the Mg ii absorption lines in the spectra of the quadruply lensed quasar H1413+1143 at (No.1) (orange) (the two components (pink) (blue)), (red), and (cyan) together with the previous measurement of at (green) (Monier et al., 1998). The result shows that the systems with small EWs () have the fractional differences with large scatters. By contrast, the systems with large EWs have small scatters, which is likely due to the small sample size at . The total sample including our measurements, which include ones for lines No.1a 1b instead of the composite line No.1, has the rest EWs with a mean of and a median of . We make two subsamples divided by the rest EW of . To assess the significance of the differences in the distributions between the two subsamples, we perform a survival analysis. A log-rank test comparing the survival distributions of the subsamples yields a -value of , which thus does not rule out the null hypothesis that the samples are drawn from the same parent population. Thus, we do not find evidence for a relationship between and , which is consistent with the result in Rubin et al. (2018b).
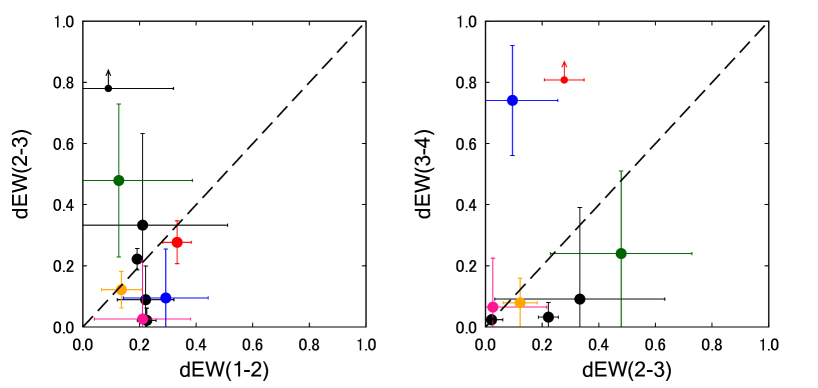
4.4.3 Fractional Differences of Multiple Mg ii absorption systems in the spectra of quadruply lensed quasars
Here we focus on multiple Mg ii absorption systems in the spectra of only quadruply lensed quasars. The spectra toward quadruply lensed quasars have the advantage of providing more than two measurements of in each single absorption system at the same redshift through three or more lines of sight toward the lensed quasars. For the quadruply lensed quasar H1413+1143, the four separate spectra provide six measurements of for the six pairs of the Mg ii absorption lines at since all four lines of sight exhibit the Mg ii absorption lines at . In Figure 12, we compare the fractional differences from the largest equivalent width in descending order of EW in the three or four lines of sight toward the quadruply lensed quasars. For example, if a quadruply lensed quasar provides four EWs of the absorption lines in the four lines of sight, , , , and (), we compare the fractional differences between and to between and . In the left panel, we show the relationship between and for the absorption lines in the three or four lines of sight toward the quadruply lensed quasars. In the right panel, we also present the fractional differences between and in comparison to between and in the four lines of sight toward quadruply lensed quasars. The median survival values of , , and are estimated to be , , and , respectively. Here the uncertainties denote the upper and lower () confidence limits for the medians. We thus find that is likely to be larger for systems with larger s, with the median of being more than twice as large as that of . The same trend is also seen in the gradient of , , per unit separation, , between the absorption lines in the same pairs of absorbers. The median survival values of , , and with () confidence limits are estimated to be kpc-1, kpc-1, and kpc-1, respectively.
These results suggest that, in a system composed of multiple absorbers, the absorbers giving rise to absorption lines with large s tend to have a relatively high degree of variation in absorption strength compared to those with small s. In the case where the absorbing systems are composed of numerous small clouds, the clouds exhibiting large s tend to have small covering factors and show a relatively high degree of incoherence producing the large gradients. It should be noted, however, that the magnitude correlations of the median survival values of both and cannot be confirmed with the current statistics due to the small sample size of the multiple Mg ii systems. Further observations of the multiple Mg ii systems are essential to achieve a conclusive statement about the spatial structure of gas and/or metals.
4.5 Doublet Ratio
The doublet ratio DR has been used as an alternative probe of the physical conditions of the absorbers giving rise to the Mg ii absorption lines. Here we draw a detailed comparison of DRs for each absorber in the separate sightlines. The doublet ratio reflects the degree of saturation in the Mg ii doublet lines, which varies from 2 for unsaturated lines to for lines on the saturated part of the curve of growth (e.g. Strmgren, 1948).
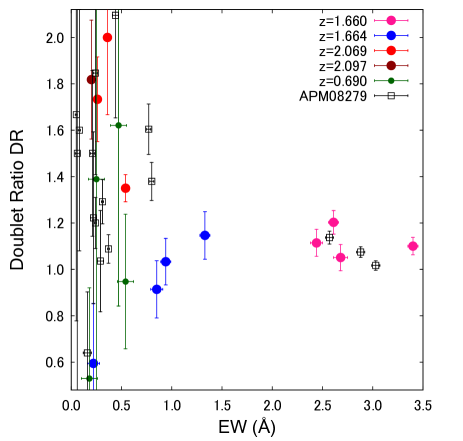
In Table 3, we show DRs of the Mg ii doublets at (No.1a), (No.1b), (Nos.4-5), and (Nos.6-7) in the A/B/C/D spectra toward quasar H1413+1143. In Figure 13, we present the DRs as a function of rest EW at for the Mg ii doublets at (pink), (blue), (red), (dark red), and (green) (Monier et al., 1998). To make a comparison to the DRs of Mg ii doublets that have redshifts similar to the ones () in our measurements, the of Mg ii doublets at in the spectra of the triply lensed quasar APM08279+5255 (black open-squares)(Ellison et al., 2004) are also plotted. It is obvious that values of the doublets at and (No.1a No.1b) are relatively small () rather than the DR values of for the two doublets at and (Nos.4-5 6-7). The rest EWs of the former doublets at and (No.1a 1b), , are relatively larger than those of the latter at and , . This suggests that the strong Mg ii doublets likely exhibit the small DRs. The results are in good agreement with the values of DRs from a sample of Mg ii doublets in the spectra of a triply lensed quasar APM08279+5255 (black open-squares)(Ellison et al., 2004).
Our DR measurements for the Mg ii doublets in the multiple lines of sight toward quadruply/triply lensed quasars are likely to exhibit an anticorrelation between DR and , which is also shown for the Mg ii doublets in lines of sight toward single quasars (e.g. Lanzetta et al., 1987; Steidel Sargent, 1992; Zhu & Mnard, 2013). We calculated the Spearman rank coefficient between the DR and for the sample presented in Figure 13. The sample gives the coefficient and the -value, , which does not rule out the null hypothesis that there is no correlation between the two quantities. However, for the samples with DR , the coefficient and , ruling out the null hypothesis. Since the sample size is still small, more DR measurements using Mg ii doublets in the spectra of quadruply/triply lensed quasars are required to reveal the correlation between the two quantities of the Mg ii doublets at in the spectra of the quadruply/triply lensed quasar.
Previously, detections of Mg ii doublets indicate that strong Mg ii systems likely give rise to Mg i absorption lines (e.g. Steidel Sargent, 1992). In our sample, for the two strong Mg ii systems at and , Mg i absorption lines (No.2 3) at and are detected in all the four separate spectra, which tends to occur in the Mg ii systems giving rise to saturated doublets with small (). By contrast, no Mg i absorption is detected in the two weak Mg ii systems at and which exhibit the large (). This suggests that the physical properties of the absorbers with saturated Mg ii doublets are probably similar to each other between the separation of sightlines on the scales of kpc.
4.6 Gravitationally lensing galaxy
Gravitational lensing provides valuable opportunities for investigating the mass distribution of the lens and the structure of the light source. The gravitationally lensed quasar H1413+1143 (e.g. Magain et al., 1988) offers the four lensed images that display an almost symmetric configuration within arcsec of the image center. The clear images are expected to be a probe of the properties of the lensing body, but the nature, such as the lens redshift , remains unclear. Detailed studies of the optical/infrared/radio images and the spectra have revealed the properties of the possible lensing galaxies, which are diffuse and faint and may belong to a galaxy cluster/group at (e.g. Turnshek et al., 1997; Kneib et al., 1998a; Kneib, Alloin, & Pello, 1998b; MacLeod, Kochanek, & Kochnek, 2009).
The time delay between the lensed images, which depends on the gravitational potential of the lensing bodies and the geometrical properties of the universe at large distances, is well known to be an important feature of the gravitational lensing as a diagnostic for the properties of the lensing body (e.g. Refsdal, 1964a, b). For the lensed quasar H1413+1143, long-term photometric observations have been carried out to measure the time delays between the four lensed images (e.g. Kayser et al., 1990; Goicoechea & Shalyapin, 2010; Akhunov et al., 2017). The measurements of the time delays with the Sloan Digital-Sky Survey improved the lens model for quasar H1413+1143 and provided estimations of possible redshifts of the lensing galaxy: (Goicoechea & Shalyapin, 2010) and (Akhunov et al., 2017). The time-delay measurements imply a possible redshift of the lensing galaxy: . In an assumption that the lensing galaxies have galactic halos and/or the CGM where the gas clouds or galactic flows give rise to absorption signatures in the spectra of the lensed quasar (e.g. Zahedy et al., 2016), Mg ii absorption lines are expected to be detected at the possible redshift of the lensing galaxy, , where the wavelength coverage of the Kyoto 3D ii allows the detection of the Mg ii absorption doublets. We find no signature of the Mg ii absorption lines at in the spatially resolved four spectra with the Kyoto 3D ii (Figure 2). It should be noted that, for the lensing galaxy at , we place a upper limit on the rest EW as , assuming its line with of km s-1, as we did for the other undetected Mg ii absorption lines in Section 3. Under our detection limit, this leads to an implication that the multiple lines of sight do not intersect with Mg ii absorbers embedded in the halo and/or the CGM of the possible lensing galaxy at which redshifts are estimated on the basis of the measurements of the time delays.
5 Conclusions
We have investigated the properties of multiple and coincident Mg ii absorption systems
in the spatially resolved four spectra toward the four images A/B/C/D of the quadruply gravitationally lensed quasar H1413+1143 on the basis of the high spatial resolution and high-S/N spectroscopy with an optical multi-mode spectrograph, the Kyoto 3D ii, on board the Subaru telescope.
For the quadruply gravitationally lensed quasar H1413+1143, there have been the previous measurements of H i and metal absorption strengths, except for Mg ii.
We find multiple Mg ii absorption systems at redshifts , , and in the spatially resolved Kyoto 3D ii spectra.
Here we present the first measurement of differences in the Mg ii absorption strength of the multiple intervening absorbers.
The main conclusions are summarized as follows.
1. The Mg ii absorption systems at give rise to a strong Mg ii absorption line, which consists of two components at and , in all four spatially resolved spectra toward images A/B/C/D (the A/B/C/D spectra) of quasar H1413+1143.
In the four spectra, for the Mg ii absorption lines at , the rest equivalent width of the strong (blended) Mg ii absorption line in the A spectrum is the largest, whereas that in the D spectrum is the smallest.
The rest equivalent widths change by factors of up to .
For the Mg ii absorption component at , the rest equivalent widths in the four spectra change by factors of up to : A D B C.
By contrast, for the Mg ii absorption component at , the rest equivalent widths change by factors of up to , B A C D which is consistent with the variation of H i column density, B A C D, in a DLA system identified
at in the HST observation.
The variations in the equivalent width of the Mg ii lines at in the spectra are also in agreement with those of the other metal absorption lines (e.g., C ii, Si ii, Al ii, Fe ii, C iv, Si iv) in the previous observations (Monier et al., 1998), except for the small equivalent widths of the Mg ii lines at in the D spectrum.
2. The absorption systems at give rise to strong Mg ii absorption lines in the three A/B/C spectra,
whereas no Mg ii absorption is detected in the D spectrum.
The rest equivalent widths in the three spectra change by factors of up to : A C B.
The ratios between the equivalent widths of the Mg ii lines in the three spectra are in agreement with those between the equivalent widths of the other metal lines (Si iv and C iv).
3. The absorption systems at give rise to a Mg ii absorption line in the B spectrum,
whereas no Mg ii absorption is detected in the other three A/C/D spectra.
This system is also identified as a sub-DLA system (Monier et al., 2009).
In the four spectra, the sub-DLA system gives rise to the strongest H i absorption lines with H i column density cm-2 in the B spectrum.
This suggests that the sub-DLA system is associated with the Mg ii absorption system.
4. The multiple Mg ii systems in the separate spectra toward the lensed or pair quasars, including our measurements for those in the spectra of the lensed quasar H1413+1143 tend to exhibit large fractional difference for the systems with large separations between lines of sight.
There is no evidence for a relationship between the fractional difference in equivalent width and the equivalent widths of the absorption lines.
Focusing on the multiple Mg ii systems in the spectra of quadruply gravitationally lensed quasars,
for the individual system that is composed of the multiple absorbers, the absorbers giving rise to absorption lines with large equivalent widths tend to have relatively large fractional differences in equivalent width, which is suggestive of a high degree of variation in absorption strength, rather than the absorbers with small equivalent widths.
5. The doublet ratios (DRs) of the equivalent width of the Mg ii absorption line at to that at (= ) are close to
for the strong doublets, with at and in the spectra of quasar H1413+1143.
The weak doublets with at and have the ratios DRs of .
The DRs of the multiple Mg ii systems in the spectra of the quasar H1413+1143 likely exhibit an anticorrelation
between the DR and .
The DR values of the Mg ii doublets in our measurements are in good agreement with those of the Mg ii doublets at in the previous measurements.
Mg i absorption lines at and are also identified in all four separate spectra, which tends to occur in the strong Mg ii systems with the small DRs () at .
By contrast, no Mg i absorption is detected in the two weak Mg ii systems with the large DRs () at and .
6. We find no signature of the Mg ii absorption lines at where the possible lensing galaxy is expected to be detected on the basis of the measurements of the time delays between the lensed images.
References
- Akhunov et al. (2017) Akhunov, T. A., Wertz, O., Elyiv, A., Gaisin, R., Artamonov, B. P., Dudinov, V. N., Nuritdinov, S. N., Delvaux, C., Sergeyev, A. V., Gusev, A. S., Bruevich, V. V., Burkhonov, O., Zheleznyak, A. P., Ezhkova, O., Surdej, J., 2017, MNRAS, 465, 3607
- Bergeron & Stasiska (1986) Bergeron, J., & Stasiska, G., 1986, A&A, 169, 1
- Bordoloi et al. (2014) Bordoloi, R., Lilly, S.J., Hardmeier, E., et al. , 2014, ApJ, 794, 130
- Bouch et al. (2012) Bouch, N., Hohensee, W., Vargas, R., Kacprzak, G.G., Martin, C.L., Cooke, J., Churchill, C.W., 2012, MNRAS, 426, 801
- Chen et al. (2014) Chen, H-W., Gauthier, J-R., Sharon, K., Johnson, S.D., Nair, P., Liang, C.J., 2014, MNRAS, 438, 1435
- Churchill et al. (2000) Churchill, C.W., Mellon, R. R., Charlton, J. C., Jannuzi, B.T., Kirhakos, S., Steidel, C. C., Schneider, D. P., 2000, ApJS, 130, 91
- Churchill et al. (2003) Churchill, C. W., Mellon. R.R., Charlton, J. C. & Vogt, S.S. 2003, ApJ, 593, 203
- Cooke et al. (2010) Cooke, R., Pettini, M., Steidel, C. C., et al. 2010, MNRAS, 409, 679
- Crotts et al. (1994) Crotts, A. P. S., Bechtold, J., Fang, Y., & Duncan, R. C. 1994, ApJL, 437, L79
- Drew & Boksenberg (1984) Drew, J.E., & Boksenberg, A., 1984, MNRAS, 211, 813
- Ellison et al. (2004) Ellison, S. L., Ibata, R., Pettini, M., Lewis, G. F., Aracil, B., Petitjean, P., Srianand, R., 2004, A&A, 414, 79
- Goicoechea & Shalyapin (2010) Goicoechea, L. J.; Shalyapin, V. N., 2010, ApJ, 708, 995
- Hayano et al. (2008) Hayano, Y., Takami, H., Guyon, O., et al. 2008, Proc. SPIE, Vol.7015, Adaptive Optics Systems,701510
- Hayano et al. (2010) Hayano, Y., Takami, H., Oya, S., et al. 2010, Proc. SPIE, Vol.7736, Adaptive Optics Systems II, 77360N, ADS
- Hazard et al. (1984) Harzard, C., Morton, D.C., Terlevich, R., McMahon, R., 1984, ApJ, 282, 33
- Kacprzak et al. (2011) Kacprzak, G.G., Churchill, C.W., Evans, J.L., Murphy, M.T., Steidel, C. C., 2011, MNRAS, 416, 3118
- Kayser et al. (1990) Kayser, R., Surdej, J., Condon, J. J., Kellermann, K. I., Magain, P., Remy, M., Smette, A., 1990, ApJ, 364, 15
- Kneib et al. (1998a) Kneib J.-P., Alloin D., Mellier Y., Guilloteau S., Barvainis R., Antonucci, R., 1998a, A&A, 329, 827
- Kneib, Alloin, & Pello (1998b) Kneib, J.P., Alloin, D., Pello, R., 1998b, A&A, 339, L65
- Koyamada et al. (2017) Koyamada, S., Misawa, T., Inada, N., Oguri, M., Kashikawa, N., Okoshi, K., 2017, ApJ, 851, 88
- Lanzetta et al. (1987) Lanzetta, K.M., Turnshek, D.A., & Wolfe, A.M. 1987, ApJ, 322, 739
- Lopez, Hagan, & Reimers. (2000) Lopez, S., Hagan, H. J., & Reimers, D. 2000, A&A, 357, 37
- MacLeod, Kochanek, & Kochnek (2009) MacLeod, C.L., Kochanek, C.S., Agol, E., 2009, ApJ, 699, 1578
- Magain et al. (1988) Magain, P., Surdej, J.,Swings, J.P., Borgeest, U., Kayser, R., 1988, Nat, 334, 325
- Martin et al. (2012) Martin, C. L., Shapley, A. E., Coil, A. L., Kornei, K. A., Bundy, K., Weiner, B. J., Noeske, K. G., Schiminovich, D., 2012, ApJ, 760, 127
- Martin et al. (2019) Martin, C. L., Ho, S.H., Kacprzak, G.G., Churchill, C.W., 2019, ApJ, 878, 84
- Matejek et al. (2013) Matejek, M. S., Simcoe, R. A., Cooksey, K. L., Seyffert, E. N. 2013, ApJ, 764, 9
- Matsubayashi et al. (2016) Matsubayashi, K., Sugai, H., Shimono, A., et al. 2016, PASP, 128, 095003
- Mnard & Chelouche (2009) Mnard, B. & Chelouche, D., 2009, MNRAS, 393, 808
- Minowa et al. (2010) Minowa, Y., Hayano, Y., Oya, S., et al. 2010, Proc. SPIE, Vol.7736, Adaptive Optics Systems II, 77363N
- Mitsuda et al. (2016) Mitsuda, K., Hashiba, Y., Minowa, Y., et al. 2016, Proc. SPIE, Vol. 9908, Society of Photo-Optical Instrumentation Engineers (SPIE) Conference Series, 99082M
- Monier et al. (1998) Monier, E.M., Turnshek, D.A., Lupie, O.L., 1998, ApJ, 496, 177
- Monier et al. (2009) Monier, E.M., Turnshek, D.A., Rao, S., 2009, MNRAS, 397, 943
- Nestor et al. (2011) Nestor, D. B., Johnson, B. D., Wild, V., Mnard, B., Turnshek, D. A., Rao, S., Pettini, M., 2011, MNRAS, 412, 1559
- Oguri et al. (2004) Oguri, M., Inada, N., Keeton., C.R., et al., 2004, ApJ, 605, 78
- Oguri et al. (2008) Oguri, M., Ofek, E., Inada, N., et al., 2008, ApJL, 676, L1
- Rao, Turnshek, & Nestor (2006) Rao, S.M., Turnshek, D.A., & Nestor, D.B., 2006, ApJ, 636, 610
- Rao et al. (2017) Rao, S.M., Turnshek, D.A., Sardane, G.M., Monier, E.M., 2017, MNRAS, 472, 891
- Rauch et al. (2002) Rauch, M., Sargent, W. L. W., Barlow, T. A., Simcoe, R. A., 2002, ApJ, 576, 45
- Refsdal (1964a) Refsdal, S., 1964a, MNRAS, 128, 295
- Refsdal (1964b) Refsdal, S., 1964b, MNRAS, 128, 307
- Rigby, Charlton, & Churchill, (2002) Rigby, J.R., Charlton, J. C., & Churchill, C. W., 2002, ApJ, 565, 743
- Rubin et al. (2010) Rubin, K. H. R., Weiner, B. J., Koo, D. C., Martin, C. L., Prochaska, J. X., Coil, A. L., Newman, J. A., 2010, ApJ, 719, 1503
- Rubin et al. (2014) Rubin, K. H. R., Prochaska, J. X., Koo, D. C., Phillips, A. C., Martin, C. L., Winstrom, L. O., 2014, ApJ, 794, 156
- Rubin et al. (2018a) Rubin, K. H. R., Diamnond-Stanic, A.M., Coil, A.L., Crighton, N.H.M., Moustakas, J. 2018a, ApJ, 853, 95
- Rubin et al. (2018b) Rubin, K. H. R., O’Meara, J.M., Cooksey, K.L., Matuszewski, M., Rizzi, L.,Doppmann, G.W., Kwok, S.H., Martin, D.C., Moore, A.M., Morrissey, P., Neill, J.D., 2018b, ApJ, 859, 146
- Schroetter et al. (2016) Schroetter, I, Bouch, N., Wendt, M., Contini, T., Finley, H., Pell, R., Bacon, R., Cantalupo, S., Marino, R. A., Richard, J., Lilly, S. J., Schaye, J., Soto, K,; Steinmetz, M., Straka, L. A., Wisotzki, L., 2016, ApJ, 833, 39
- Schroetter et al. (2019) Schroetter, I, Bouch, N., Zabl, J., Contini, T., Wendt, M., Schaye, J., Mitchell, P., Muzahid, S., Mario, R.A., Bacon, R., Lilly, S. J., Richard, J., Wisotzki, L., 2019, MNRAS, 490, 4368
- Smette et al. (1992) Smette, A., Surdej, J., Shaver, P. A., et al. 1992, ApJ, 389, 39
- Smette et al. (1995) Smette, A., Robertson, J.G., Shaver, P.A., Reimers, D., Wisotzki, L., & Kohler, T., 1995, A&AS, 113, 199
- Steidel Sargent (1992) Steidel, C.C., & Sargent, W.L.W., 1992, ApJS, 80, 1
- Strmgren (1948) Strmgren, B., 1948, ApJ, 108, 242
- Sugai et al. (2010) Sugai, H., Hattori, T., Kawai, A., et al., 2010, PASP, 122, 103
- Tremonti et al. (2007) Tremonti, C.A., Moustakas, J., Diamond-Stanic, A.M. 2007, ApJL, 663, 77
- Turner et al. (2014) Turner, M.L., Schaye, J., Steidel, C.C., Rudie, G. C., Strom, A, L. 2014, MNRAS, 445, 794
- Turnshek et al. (1988) Turnshek, D.A., Foltz, C.B., Grillmair, C.J., Weymann, R.J., 1988, ApJ, 325, 651
- Turnshek et al. (1997) Turnshek, D.A., Lupie, O.L., Rao, S.M., Espey, B.R., Sirola, C.J., 1997, ApJ, 485, 100
- van Dokkum (2001) van Dokkum, P.G., 2001, PASP, 113. 1420
- Zahedy et al. (2016) Zahedy, F.S., Chen, H-W., Rauch, M., Wilson, M.L., Zabludoff, A. 2016, MNRAS, 458, 2423
- Zhu & Mnard (2013) Zhu, G., & Mnard, B., 2013, ApJ, 770, 130
| A | B | C | D | ||||||
| No | ion | [Å] | [Å] | [Å] | [Å] | ||||
| 1 | Mg ii2796,2803 | 1.66 | 8.210.02 | 1.66 | 7.090.02 | 1.66 | 6.230.02 | 1.66 | 5.730.03 |
| 1a | Mg ii2796 | 1.660 | 3.400.05 | 1.660 | 2.610.05 | 1.660 | 2.440.06 | 1.660 | 2.680.07 |
| Mg ii2803 | 3.090.06 | 2.170.05 | 2.190.06 | 2.550.07 | |||||
| 1b | Mg ii2796 | 1.664 | 0.940.05 | 1.664 | 1.330.05 | 1.665 | 0.850.06 | 1.665 | 0.220.06 |
| Mg ii2803 | 0.910.04 | 1.160.06 | 0.930.06 | 0.370.06 | |||||
| 2 | Mg i2853 | 1.659 | 0.440.05 | 1.659 | 0.560.06 | 1.659 | 0.270.05 | 1.659 | 0.430.06 |
| 3 | Mg i2853 | 1.667 | 0.250.02 | 1.668 | 0.190.02 | 1.667 | 0.320.03 | 1.668 | 0.260.02 |
| 4 | Mg ii2796 | 2.069 | 0.540.01 | 2.069 | 0.260.01 | 2.069 | 0.360.02 | — | 0.05b |
| 5 | Mg ii2803 | 0.400.01 | 0.150.01 | 0.180.02 | 0.05b | ||||
| 6 | Mg ii2796 | — | 0.03b | 2.097 | 0.200.01 | — | 0.03b | — | 0.05b |
| 7 | Mg ii2803 | 0.03b | 0.110.01 | 0.03b | 0.05b | ||||
| [cm-2] | [cm-2] | [cm-2] | [cm-2] | ||||||
| H i1216a | 1.662 | 1.50.45 | 1.662 | 6.01.8 | 1.662 | 0.600.18 | 1.662 | 0.300.09 |
| QSO | A [] | B [] | C [] | D [] | /kpc a | /kpc a | |
|---|---|---|---|---|---|---|---|
| H1413+1143 b | 0.6089 | 0.250.09 | 0.190.09 | 0.550.09 | 0.480.08 | 9.1 | 5.1 |
| 1.660 | 3.400.05 | 2.610.05 | 2.440.06 | 2.680.07 | 11.5 | 6.4 | |
| 1.664 | 0.940.05 | 1.330.05 | 0.850.06 | 0.220.06 | 11.5 | 6.4 | |
| 2.069 | 0.540.01 | 0.260.01 | 0.360.03 | 0.05 | 7.6 | 4.2 | |
| 2.097 | 0.03 | 0.200.01 | 0.03 | 0.05 | 7.1 | 3.9 | |
| HE0435-1223 c | 0.4188 | 1.10.1 | 1.90.1 | 1.50.1 | 1.00.1 | 13.8 | 8.2 |
| 0.7818 | 0.510.03 | — | 0.720.03 | 0.560.04 | 7.8 | 5.7 | |
| J014710+463040 d | 0.577 | 0.11110.0052 | 0.11380.0053 | 0.15020.0078 | 0.11630.0171 | 22.1 | 8.3 |
| 0.576 | — | — | — | 0.12520.0170 | |||
| 0.607 | 0.46210.0050 | 0.28140.0063 | 0.37360.0072 | 0.29070.0208 | 21.1 | 8.0 | |
| 0.758 | 0.0849 | 0.0792 | 0.1128 | 0.98310.0246 | 16.8 | 6.4 | |
| Q2237+0305 e | 0.566 | 0.650.07 | 0.650.06 | 0.780.07 | — | 0.5 | 0.4 |
| 0.827 | 0.050.06 | 0.070.01 | — | — | 0.3 | 0.3 | |
| J1004+4112 f | 0.676 | 0.910.03 | 0.2 | 0.2 | 1.00.1 | 103.0 | 26.3 |
| 0.726 | 0.1 | 0.2 | 0.3 | 2.60.1 | 94.7 | 24.2 | |
| 0.749 | 0.1 | 0.1 | 0.2 | 1.40.1 | 90.7 | 23.2 | |
| 0.833 | 0.1 | 0.80.1 | 0.2 | 0.4 | 77.1 | 19.7 | |
| 1.022 | 0.1 | 0.230.03 | 0.1 | 0.2 | 52.2 | 13.3 | |
| 1.083 | 0.1 | 0.2 | 0.2 | 1.50.1 | 45.5 | 11.6 | |
| 1.226 | 0.1 | 0.1 | 0.2 | 0.50.1 | 31.9 | 8.1 | |
| 1.258 | 0.1 | 0.1 | 0.2 | 0.90.1 | 29.2 | 7.5 | |
| APM08279+5255 g | 1.181 | 2.570.04 | 3.030.04 | 2.280.04 | — | 2.7 | 1.0 |
| 1.209 | 0.050.01 | 0.060.02 | 0.03 | — | 2.6 | 1.0 | |
| 1.211 | 0.370.01 | 0.03 | 0.160.04 | — | 2.6 | 1.0 | |
| 1.291 | 0.080.01 | 0.030.01 | 0.03 | — | 2.4 | 0.9 | |
| 1.444 | 0.040.01 | 0.040.01 | 0.03 | — | 2.0 | 0.8 | |
| 1.550 | 0.310.01 | 0.02 | 0.290.03 | — | 1.8 | 0.7 | |
| 1.552 | 0.240.01 | 0.02 | 0.03 | — | 1.8 | 0.7 | |
| 1.813 | 0.800.02 | 0.770.02 | 0.440.03 | — | 1.4 | 0.5 | |
| 2.041 | 0.210.02 | 0.240.02 | 0.220.03 | — | 1.1 | 0.4 | |
| 2.066 | 0.310.04 | 0.450.04 | 0.380.04 | — | 1.0 | 0.4 |
| A | B | C | D | |||||
|---|---|---|---|---|---|---|---|---|
| No | [Å] | [Å] | [Å] | [Å] | ||||
| 1a | 3.400.05 | 1.100.04 | 2.610.05 | 1.200.05 | 2.440.06 | 1.110.06 | 2.680.07 | 1.050.06 |
| 1b | 0.940.05 | 1.030.10 | 1.330.05 | 1.150.10 | 0.850.06 | 0.910.12 | 0.220.06 | 0.590.26 |
| 4-5 | 0.540.01 | 1.350.06 | 0.260.01 | 1.720.18 | 0.360.02 | 2.000.33 | 0.05 | — |
| 6-7 | 0.03 | — | 0.200.01 | 1.820.26 | 0.03 | — | 0.05 | — |