Unraveling the graph structure of tabular data through Bayesian and spectral analysis
Abstract
In the big-data age, tabular data are being generated and analyzed everywhere. As a consequence, finding and understanding the relationships between the features in these data are of great relevance. Here, to encompass these relationships, we propose a graph-based method that allows individual, group and multi-scale analyses. The method starts by mapping the tabular data into a weighted directed graph using the Shapley additive explanations technique. With this graph of relationships, we show that the inference of the hierarchical modular structure obtained by the Nested Stochastic Block Model (nSBM) as well as the study of the spectral space of the magnetic Laplacian can help us identify the classes of features and unravel non-trivial relationships. As a case study, we analyzed a socioeconomic survey conducted with students in Brazil: the PeNSE survey. The spectral embedding of the columns suggested that questions related to physical activities form a separate group. The application of the nSBM approach not only corroborated with that but allowed complementary findings about the modular structure: some groups of questions showed a high adherence with the divisions qualitatively defined by the designers of the survey. As opposed to the structure obtained by the spectrum, questions from the class Safety were partly grouped by our method in the class Drugs. Surprisingly, by inspecting these questions, we observed that they were related to both these topics, suggesting an alternative interpretation of these questions. These results show how our method can provide guidance for tabular data analysis as well as the design of future surveys.
1 Introduction
At the end of the nineteenth century, Edmund Landau addressed the problem of how to distribute a money prize among a group of chess players using a table of matches[22]. In a table of matches, each index is associated with a player and the value of each cell represents the result of a match between two players. Landau proposed a method that outperformed the best approaches at the time to perform prize distributions[22, 23]. Landau’s method is commonly known as eigenvector centrality today and it got several developments and a myriad of applications, from fraud detection to recommendation systems group[49].
Landau’s method scope and limitations would become clear with the emergence of new challenges related to the analysis of tabular data from a variety of domains[14, 1]. For instance, rather than finding the best player, one may want to identify the most important socioeconomic factors to explain the variation inside of a group of people. Rather than finding a probable coalition of players or a group of chess players with similar characteristics and performance, we may want to find a group of health factors that have a similar impact on a group of diseases[25].
To solve these new challenges, recent works[24, 40, 2, 1] have been addressing the problem of exploratory analysis of tabular data by mapping it to a graph where the columns are mapped to the vertices and edges quantify the relationships between these columns. In[24, 40, 1], the relationships are modeled by non-directed edges, with edge weights determined based on the mutual information or correlation values. Also, because of of this construction, the resulting graph often has multiple disconnected components. These characteristics may make up an issue if the relationships between every pair of vertices are of importance. In another work[2], the relationships are modeled by a complete directed graph with weight values expressing the global feature importance known as gain [36, 38]. It has been recently shown[28] that this measurement can lead to inconsistent results and, in addition, it also does not allow the derivation of a local explanation, in the sense of constructing a graph from a single observation (row) or a sample.
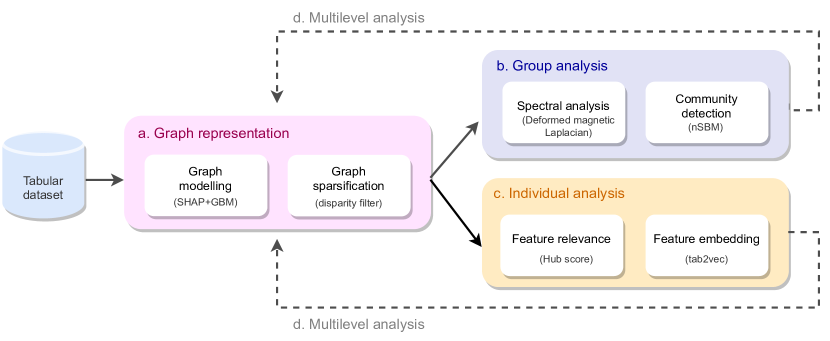
Considering these challenges in the analysis of tabular data, we are interested in answering the following questions: 1)How can we visualize the relationships between every pair of columns?; 2)How can we identify similar columns?; 3) How can we perform the previous analyses using only a subset of columns?. Motivated by these three questions, we propose a framework composed of the following stages: (a) graph representation, (b) individual analysis, (c) group analysis and (d) multilevel analysis (refer to Fig. 1 for a an explanative diagram).
The method starts by representing the data as a graph. A microscale analysis is evaluated by considering the notions of relevance and similarity between columns. A macro-level analysis must be carried out to investigate the existence ofgroups of similar columns. Guided by the analyses results, one can refine these procedures (stages (a), (b) and (c)) considering only a subset of the columns. The effective implementation of the proposed approach requires choices of the algorithms for each stage. In this work, we not just propose this general framework, but we also propose principled choices suitable for the questions we aim to address.
In the graph representation stage, the edge weights was obtained through the SHapley Additive exPlanations (SHAP)[29] technique. This technique was chosen for its good properties when compared with other tools to compute the importance of a feature in machine learning task. In addition, it can supply a local interpretation for each object in the data. The obtained complete graph, here called interpretability graph, is initially sparsified, with the goal of removing the weak relationships between features, extending graph analysis methods that can be applied. In particular, we use the disparity filter[45], which is an edge filtering method that has a good performance in preserving the backbone structure of the graph.
At a group level, we propose using two complementary approaches: spectral analysis and community detection. As well known in undirected graphs, the combinatorial Laplacian have interesting spectral properties related to community structures. Those properties allow the use of this operator in graph embedding methods[5, 49]. These methods rely on two properties of the combinatorial Laplacian operator: the existence of an orthogonal basis and the fact that the eigenvalues associated with them resides in the real line. Therefore, with our interpretability graph, which is a digraph, those two properties are not satisfied[26]. To overpass that, instead of analyzing the combinatorial Laplacian we study the spectral information of the magnetic Laplacian operator. The theory and the applications of this operator has been in focus in the literature recently[10, 11, 50] and one of the reasons for that is because it is a Hermitian operator even for directed graphs. Here we have used the eigenfunctions associated with the magnetic Laplacian operator to map the features of a tabular data into a toroidal space aiming at exploring the data in a more detailed manner. Meanwhile, the analysis of the spectral space can give us a notion about how the features are connected to the interpretability graph. To explore the community structures, we must use a method specifically built for that. Here, we translate the problem of how to divide a group of features into classes into finding the communities that the vertex related to those features belongs. To do that, we have applied the nested-Sochastic Block Model (nSBM)[41, 42, 37] to infer the hierarchical community structure in our graph. The nSBM revealed hierarchical relationships between the features, enabling us to explore and unravel categories that have similar or dissimilar behaviors. Further, we analyze the correspondence between these results and those derived from spectral information associated with the graph.
The spectral and nSBM approach gives to us a way to identify groups of features and how strong they are tied. However, it does not provide subsides to understand the features at the individual level. For example, how much two features are like to each other.To compare the similarity between any two features, our approach is based on the evaluation of the cosine similarity through the node2vec algorithm applied to the interpretability graph. These individual level analyses can identify data leakage issues and features with a similar behavior as well as allowing other data exploration approaches to the tabular data.
To refine the analyses described above, we use the spectral information of the magnetic Laplacian to split the vertices on the interpretability graph in two components. And with each component, we can evaluate again the columns using the same previous analyses.
As an application example, we employed our method to the Brazilian National Survey of Scholar’s Health from IBGE (PeNSE) [9]. This periodic survey has been extensively studied across the years to understand the socioeconomic and health profiles of the students in Brazil, such as regarding illicit and licit drugs consumption[19, 31], health issues[3] and sedentary behavior[48]. Initially, we mapped the survey to a weighted directed graph, which was subsequently filtered. Thus, using the generated graph structure, we created meaningful visualizations of the relationships between the columns through the use of force-directed algorithms and the deformed magnetic Laplacian. Specifically, our visualization unravels a division of the survey, in particular of the survey items originally classified as “Physical activies”. The application of the nSBM to the interpretability graph allowed different insights. For instance, we discovered that some questions such as “Driving behavior” were originally aggregated to the class “Safety” in the design of the survey, but our method suggested that they may present stronger relationships with questions related to the use of drugs. Also, the hierarchical nature of the clustering allowed inferring that questions from “Physical activities” could be further subdivided into more classes in the survey.
The reported results may inspire future works aiming at exploring the effect of interdependence or confounding features in tabular data, and also provide subsidies to improve the design of surveys.
2 Methods
In Fig.1 we describe the method proposed in this work. We divide the method into four stages: graph representation, group, individual, and multilevel column analyses. The method starts by extracting a weighted directed graph from the tabular data, with vertices representing the columns and edges representing their relationships, weighted by the SHAP values. After that, to unravel the sparse graph representation of the tabular data, we choose to apply an edge filtering method to remove the weakest edges which finishes our pre-processing phase and allow us to employ techniques to understanding the columns and rows of the tabular data. To accomplish this understanding task, we focused on our method in the spectral information provided by the deformed magnetic Laplacian operator and the hierarchical modular structure got from the nSBM. Meanwhile, the nSBM give to us a way to group the columns into classes. The spectral information gave us a way to refine ours results based on a subset of the graph and this refinement can be repeated up to a desired granularity. Besides that those two group analyses, we also employ techniques that can give us insights about the relevance of a column (using centrality measures) or how to associate a column with a vector in a space (tab2vec). In the following, we discuss in details each step of this framework.
2.1 Graph modelling
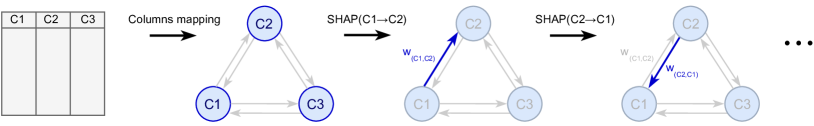
A weighted directed graph is a tuple composed by a set of vertices, , a set of ordered tuples, , and a weight function . Each feature of the dataset associates to at least one vertex of the graph. The directed weighted edges represent the relationships between two columns. Let be the set of columns of the tabular data. A column is randomly chosen and mapped to a set of vertices . We use the remaining columns as features to train a gradient boosting machine (GBM) to predict the column . Let be the features columns of c. After training, for each , we understand the weights for each edge () as corresponding to the contribution of the vertex to the task of predicting the vertices related to . We repeat this procedure for each vertex in and obtain a complete weighted directed graph.
A subject of particular importance concerns the contribution of to predict . First, we want to map the tabular dataset to a graph. We require that the in-degree of vertex quantifies the accuracy of the trained GBM, that is . For instance, if a column has no relevant relationship with the remaining columns or cannot be explained by them, the in-degree is low, which reduces the contribution of the vertex to the overall structure of the graph.
This accuracy is used to calculate the weights of the edges. Let be a function that quantifies the contribution of a column associated with to the task of predicting the values of column using the GBM. Here, we choose the weight function of an edge as:
| (1) |
Next we discuss how to choose . To use (1) and consequently, to construct the interpretability graph, it is necessary to choose a way to explain the prediction of a given variable due to the presence of a feature . There is a wide range of methods in the literature to achieve this[35]. In this work, we opted to use the SHapley Additive exPlanations (SHAP) [44, 27]. The SHAP[21] method was motivated in the theory of cooperation games and works by quantifying the marginal contribution of a feature to a single prediction task.
Since the SHAP value is calculated for each element of the dataset, we have a different graph defined by Eq.(1) for each instance. For example, if the tabular data corresponds to a survey, the graph can be used to study the answers of each person. Although this local exploration allows associating a graph with each instance in the data, in this work we focus on a single graph to describe the entire dataset. In this case, the weight of edge is defined as the mean of the absolute values of SHAP, that is
| (2) |
2.2 Graph filtering
The obtained interpretability graph is, by construction, complete. As a result, the posterior processing may be difficult or even unfeasible. One of the reasons is the high computational cost associated to the processing of the entire graph. Another reason relates to the excess of information, which may end up blurring the objects of interest[6].
A simple approach to reduce the number of edges and to enhance the interpretability of the graph visualization techniques consists in the application of a naive threshold to the edge weights so as to keep just the strongest connections. However, it is hard to choose and justify the value used for the threshold parameter[6]. In addition, this method can create many disconnected components.
In the last decade, a large number of graph filtering methods (a.k.a. graph sparsification) has been developed in order to mitigate the issues present in the naive threshold-based edge filtering approach [45, 33, 4]. In this work, we adopted the disparity filter criterion developed by[45] to filter the edges.
Let be the out-degree of a feature associated with the node in the interpretability graph. Defined in this way, is related to the contribution of feature to explain the outputs of all remaining features. Thus quantifies how the explanation given by the feature in the task of predicting feature contributes to the total amount of interpretability of the feature . Then, with being the out-degree of node , we can associate with each edge the following quantity
| (3) |
Edges with above a given threshold are filtered out. Therefore, this method allows to filter the edges and at the same time keep the graph backbone, as pointed in [45].
2.3 Spectral analysis
In the previous sections we discussed the construction of the weighted directed graph from tabular data and how to extract insights from this data structure. Here we discuss how the spectral information of the magnetic Laplacian can be used to unravel clustering of features.
The derivation of the magnetic Laplacian formalism requires decomposing the weight function between a symmetrical and an asymmetrical components. This allows the definition of a flow function in each vertex due to as . With the decomposition, each digraph results in an associated undirected version , which relates to the Laplacian operator, , by:
| (4) |
where .
As can been seen, the combinatorial Laplacian for the undirected graph is symmetric.
The second term of the right hand side of Eq.(4) needs to be modified to deal with the directionality information of the digraph. To do so, the directionality information is treated as a phase perturbation, formally represented by a function whose domain corresponds to the edge set of the directed graph. This function has the following form:
| (5) |
which inserted in the second term of right-hand side Eq.4 gives us the magnetic Laplacian, ,
| (6) |
where is a parameter called charge because of historical reasons[47].
It is convenient to define a normalized version of the magnetic Laplacian, , as
| (7) |
Noticeably, the magnetic operator can be represented by Hermitian matrx which is not the case of combinatorial operator for digraphs[10]. In addition, the magnetic Laplacian is a positive semi-definite operator. The positive semi-definite and hermiticity properties of the magnetic Laplacian allow constructions of physical analogies which can be used to characterize digraphs[10]. In addition, the phases of a given eigenvector of the normed magnetic Laplacian (7), capture the notion of circularity in the graph. For example, the phases of the eigenvector associated with the lowest eigenvalue of is the approximated solution for the group synchronization problem related with the magnetic Laplacian[12]. In mathematical terms this problem searches for a mapping which minimizes the following function
| (8) |
where .
2.4 Community detection
In principle, a class of features having similar interpretation behavior should belong to the same community in the proposed interpretability graph. Therefore, to understand the relationships between the features, it is first necessary to define first how these communities can be identified. One possibility to do that is to use a modularity optimization method[39]. Unfortunately, this method has some drawbacks. For example, it can find communities even in a random graph [18]. Thus, this can gives to us a meaningless division between the feature of a tabular data. Fortunately, the non-parametric Bayesian method called nested Stochastic Block Model (nSBM)[41] mitigates that.
The nSBM method is the hierarchical formulation of the well-known Stochastic Block Model (SBM)[42, 13]. The major difference between SBM and nSBM is that the latter proceeds by agglomerating graph communities into levels, which represent blocks modeled by a SBM. Using this hierarchical construction, nSBM overcomes some issues of its counterpart, such as the inefficiency in identifying small graph communities[41].
In essence, the SBM performs a Bayesian inference on a set of parameters of a generative graph model. Such parameters are the vertex partitions, that is, the sizes and the number of blocks, and the probability of connections inside and outside those partitions. In mathematical terms, let be a set of vertex partitions and the parameters of a given generative model for a graph , the Bayesian problem is given by:
| (9) |
where it is the model evidence.
The nSBM uses the non-parametric framework proposed by Peixoto and it is able to efficiently infer the block-hierarchical structures and, thus, to understand the modular organization of the graph. Consequently, using this method a user can unravel the relationships between features in the dataset.
2.5 Feature embedding (tab2vec)
We used the inferred community structure to group features (columns) on the tabular data. However, the inferred communities can not be used to define a notion of proximity between two features in the same community. Furthermore, this notion of proximity can be used to unravel features that are most similar in the interpretability graph. To define this notion, we choose to use the node2vec algorithm that allowed us to associate to each feature of the tabular data to a position in an Euclidean space, tab2vec.
2.6 Multilevel analysis
We can repeat all previous procedures for this subset of columns. The reason behind this step is analogous to the graph filtering stage: the density of the graph may obfuscate the identification of the features and the features interaction. While similar in motivation, this stage differs from graph filtering by considering a different set of columns to construct the graph, in contrast to the filtering of edges in the graph filtering step. This step also differs from considering the subgraph of the “full” interpretability graph induced by the selected vertices because here we are considering a different prediction task (without the removed features).
3 Case study: PeNSE
The adolescence phase may strongly impact adulthood. For this reason, different surveys have focused on the related subjects [17, 7]. The PeNSE (National Survey of Scholar’s Health) [9] is a survey organized by the Brazilian Institute of Geography and Statistics (IBGE), with collaboration of the Ministry of Health and of the Ministry of Education. Its mission is to better understand the risk factors and health profiles of the teenagers in Brazil.
The three editions of the survey (2009, 2012 and 2015) targeted students regularly enrolled in a Brazilian school, public or private, at the 9th grade, which often corresponds to fourteen-year-old teenagers. This school age was chosen considering the international ethic guidelines of age to conduct socioeconomic questionnaires targeted at the teenagers group. Here we have explored the 2015 edition which inquired almost students in Brazil111The data is public and available here https://ftp.ibge.gov.br/pense/2015/.
The survey consists in an electronic questionnaire comprising questions from diverse areas, such as the respondents’ socioeconomic context: parents’ level of education, profession, possession of goods; health, including sexual, oral and mental health; eating habits and the risk factors; family relationships and domestic violence; and the infrastructure provided by the school.
This dataset has already been explored by [25], where the authors explored the association between key indicators to sociodemographical profiles. For example, a healthy nutrition indicator, which takes into account the frequency of meals and the consumption of other type of foods, was found to be associated with the age, gender and socioeconomic profile. The analysis was constrained to a linear analysis (linear regression) between these markers. This dataset has also been explored in other works [32, 30], but focusing on specific set of features, such as related to bullying or chronic diseases.
3.1 Force-directed layout and the effect of the disparity filter
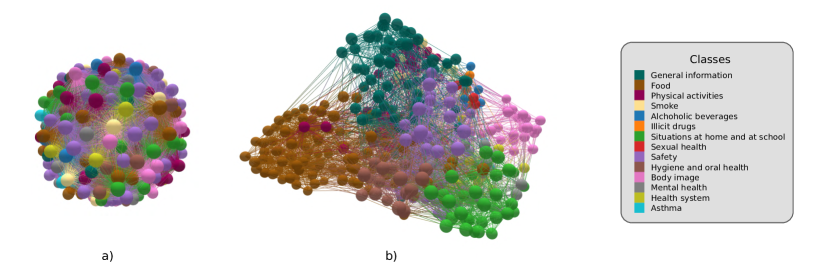
We first discuss how our method could unravel groups of questions in the PeNSE survey. To do so, we first created the interpretability graph as previously discussed and removed less important edges using the disparity filter. In Fig.3 we show the force-directed visualization of both the complete graph (Fig.3(a)) as well as the sparse graph obtained after application of the edges filtering method (Fig.3(b)). The hairy-ball appearance of the complete graph does not allow a direct interpretation. In contrast, when the disparity filter with a was applied to the complete graph, group structures starts to appear. A visual inspection shows that the questions related with physical activities seem involve two separated groups. However, as it is well known, the force-directed embedding can be subjectively interpreted by the person who is seeing the graph. Therefore, any insight given by this method should be verified by more formal methods. Thus, in the following we will investigate more about how this group of questions behaves in the spectral space and in the inferred modular structure.
3.2 Spectral embedding of the PeNSE features

In Fig.4 we present the toroidal embedding using the first two phases of the magnetic Laplacian, with and the hub score as the radial coordinate. The highest hub score questions in the survey according are close to the center. The embedding shows that the questions related to physical activities are grouped in a well separated cluster by the magnetic embedding. Therefore, we must expect that the questions related to physical activities form a group more strongly related with itself. In addition, if a more detailed analysis is requested, a graph-cut approach can been done in the toroidal embedding aiming at removing most of these questions, followed by the application of our method to the reaming columns data aiming at complementing the analysis of other questions.
3.3 Hierarchical categorization of the features
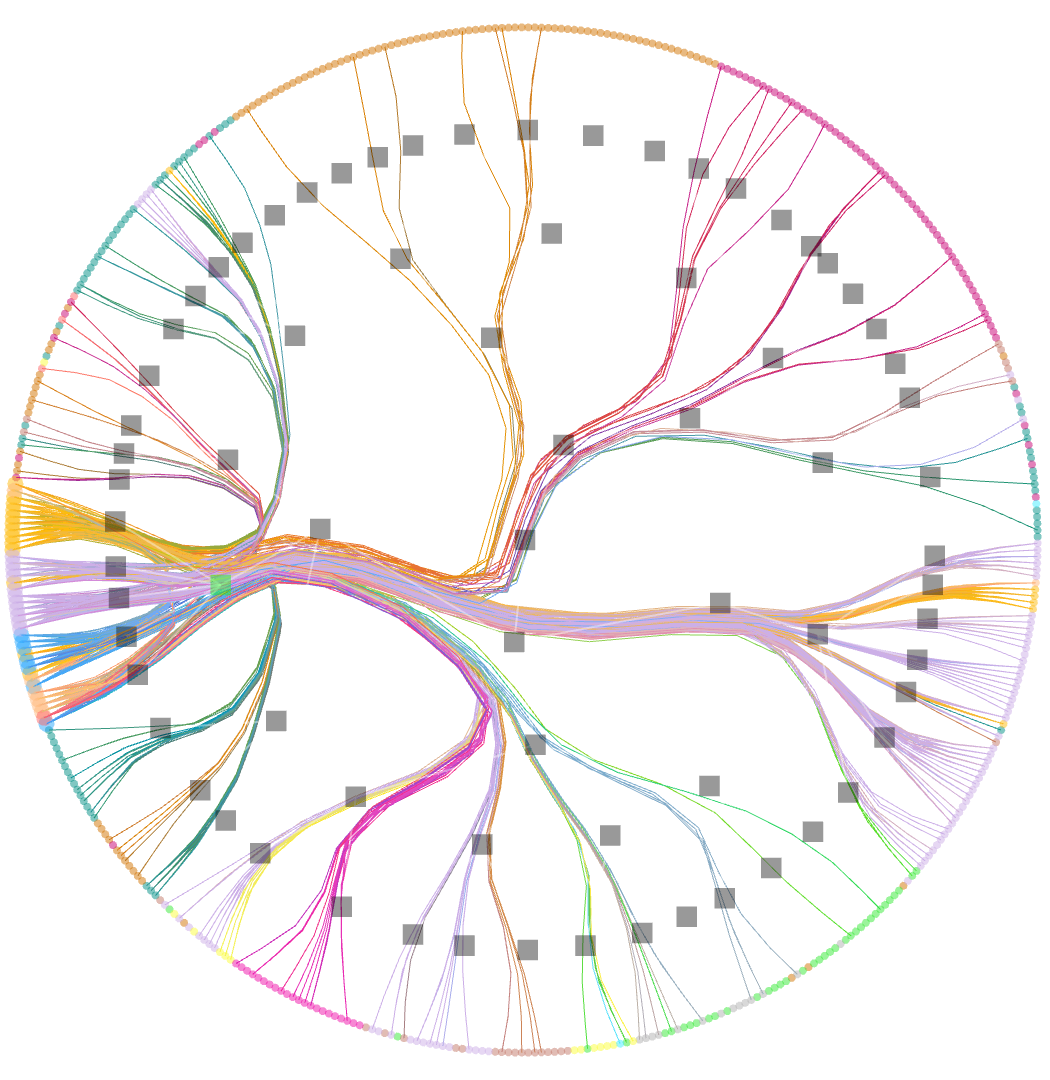
Community detection is generally a hard problem and this difficulty stems, in part, from the absence of a clear and common definition of what a community is [41]. The nSBM approach attempts to mitigate this issue by proposing a statistically principled approach to identify the modular structures. In this work we used the graph-tool222https://graph-tool.skewed.de/ implementation of nSBM[42, 43]. We show in Fig.5 the circular visualization of the filtered interpretability graph of the features in the PeNSE survey provided by nSBM. The directed graph with gray vertices and edges represents the hierarchical structure of the communities of the questions. The vertices are positioned according to the modular structure of the graph and the color of the edges and of the nodes represents the class to which each question belongs in the survey. Such classes were originally defined by the designers of the survey. Thus, communities of vertices with the same color mean a correspondence between the modular structure predicted by the method and the qualitatively classification of the questions in the questionnaire.
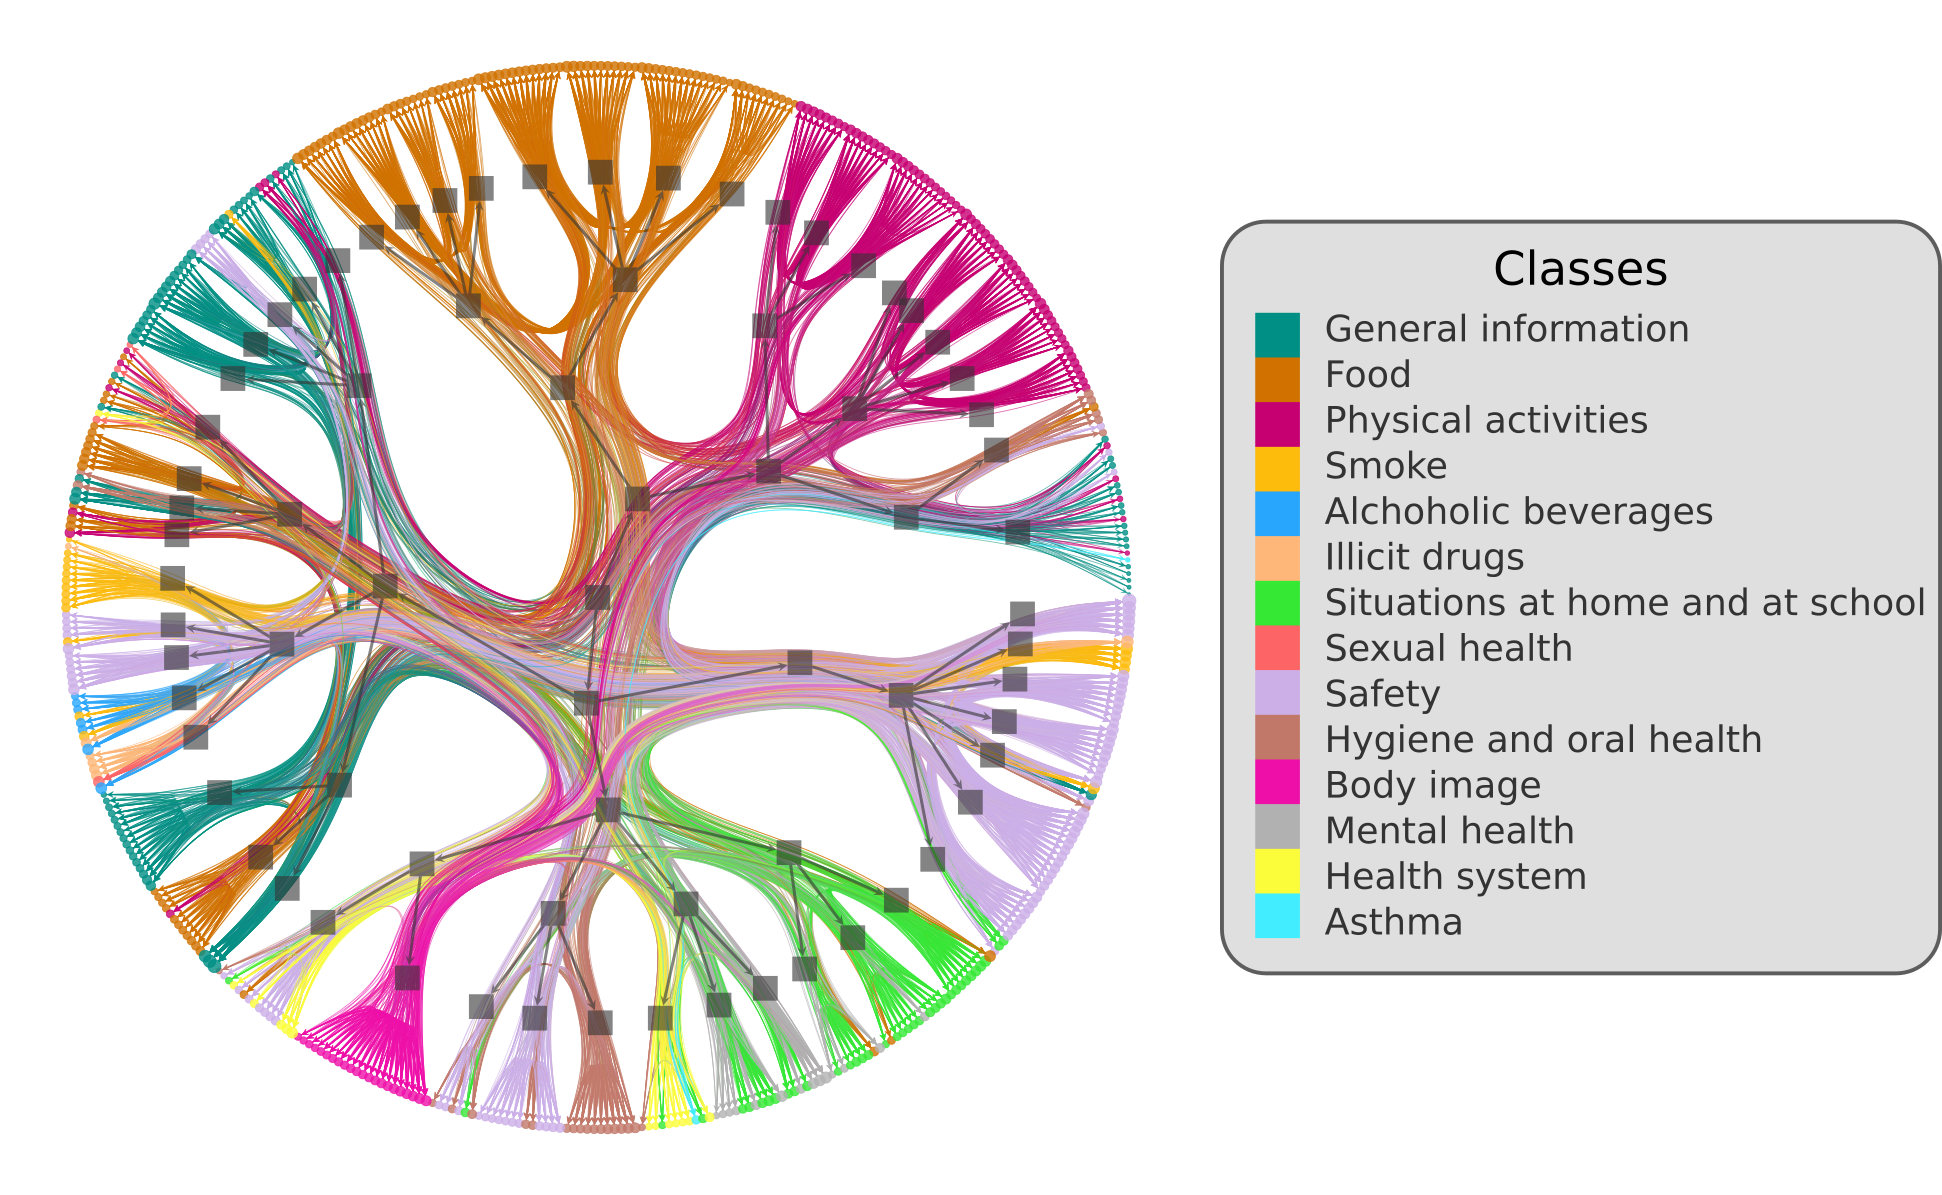
This hierarchical circular visualization in Fig.5 allows different types of analyses, but two are of particular interest regarding the analysis of the survey. The first relates to the positioning and grouping of the vertices and their correspondence with the divisions proposed in the survey. The second has to do with the connections among the areas, i.e., the existence of dominant areas to which a group of features may connect to.
In Fig.5, one can readily see a high correspondence of the obtained grouping of the questions and the divisions of the survey for at least two classes: Food (brown) and Body image (magenta). Whereas the class Safety (pink) presents a considerable agreement, part of the features were positioned by the method separately on the left region of the circle, grouped with questions related to the consumption of drugs (Fig.6(a)). This shows that an alternative classification of the features on the left could be as pertaining to the class of Illicit drugs. Important to emphasize that the nSBM approach is completely automatic and non-subjective, solely based on the pattern of responses in the survey.
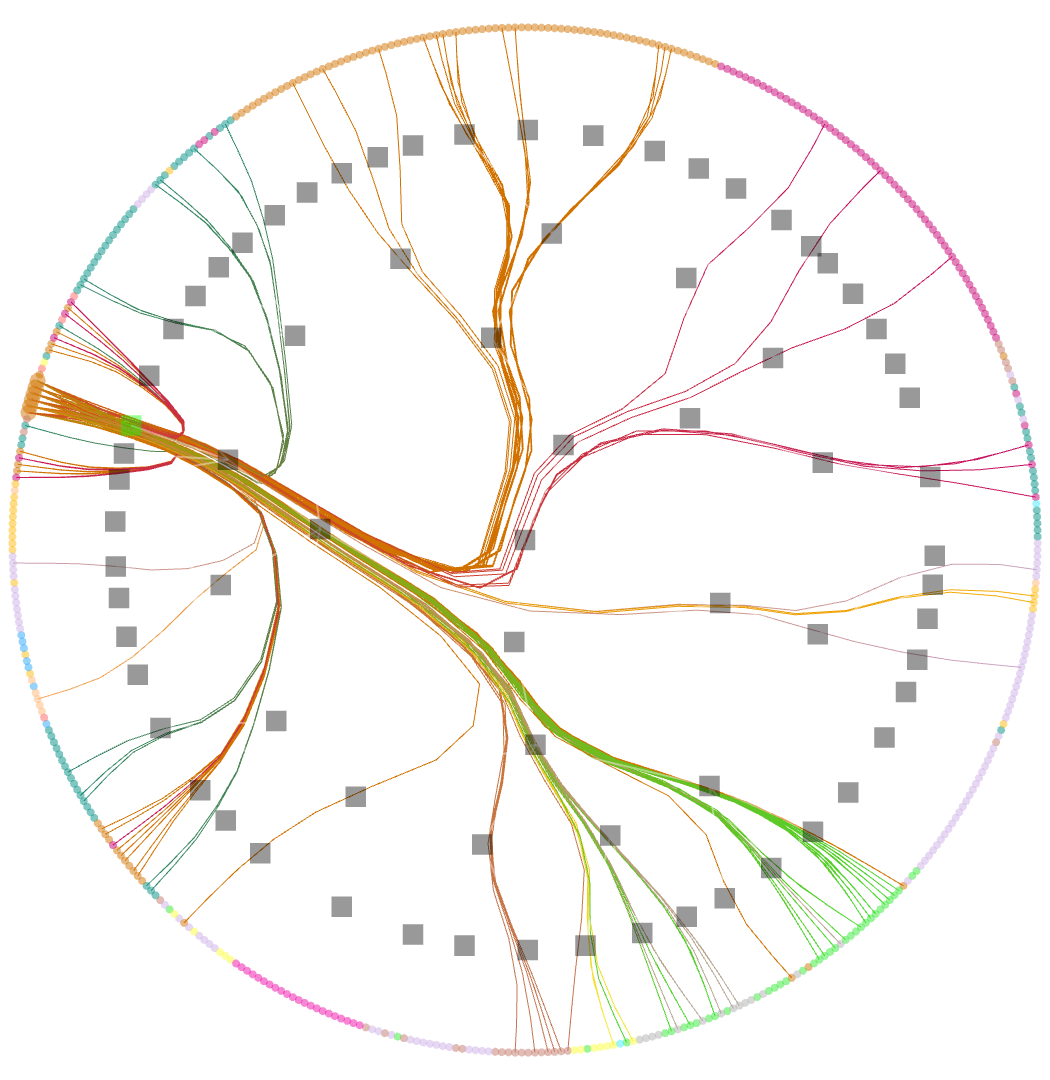
In Fig.6(b), the small group in orange, on the left, is emphasized. This visualization allows us to see that this group has high connectivity to the green group, on the bottom part of the circle. The class in orange corresponds to Food and the highlighted vertices correspond to questions related to eating with parents. The highlighted vertices in green, in turn, represent questions that deal with the relationship of the teenager and their parents. That may be understood as the strong relationship, from the point of view of the student, of a healthy relationship with the parents and sharing regular meals with them. Again, it potentially indicates another possibility of organizing these questions in the questionnaire.
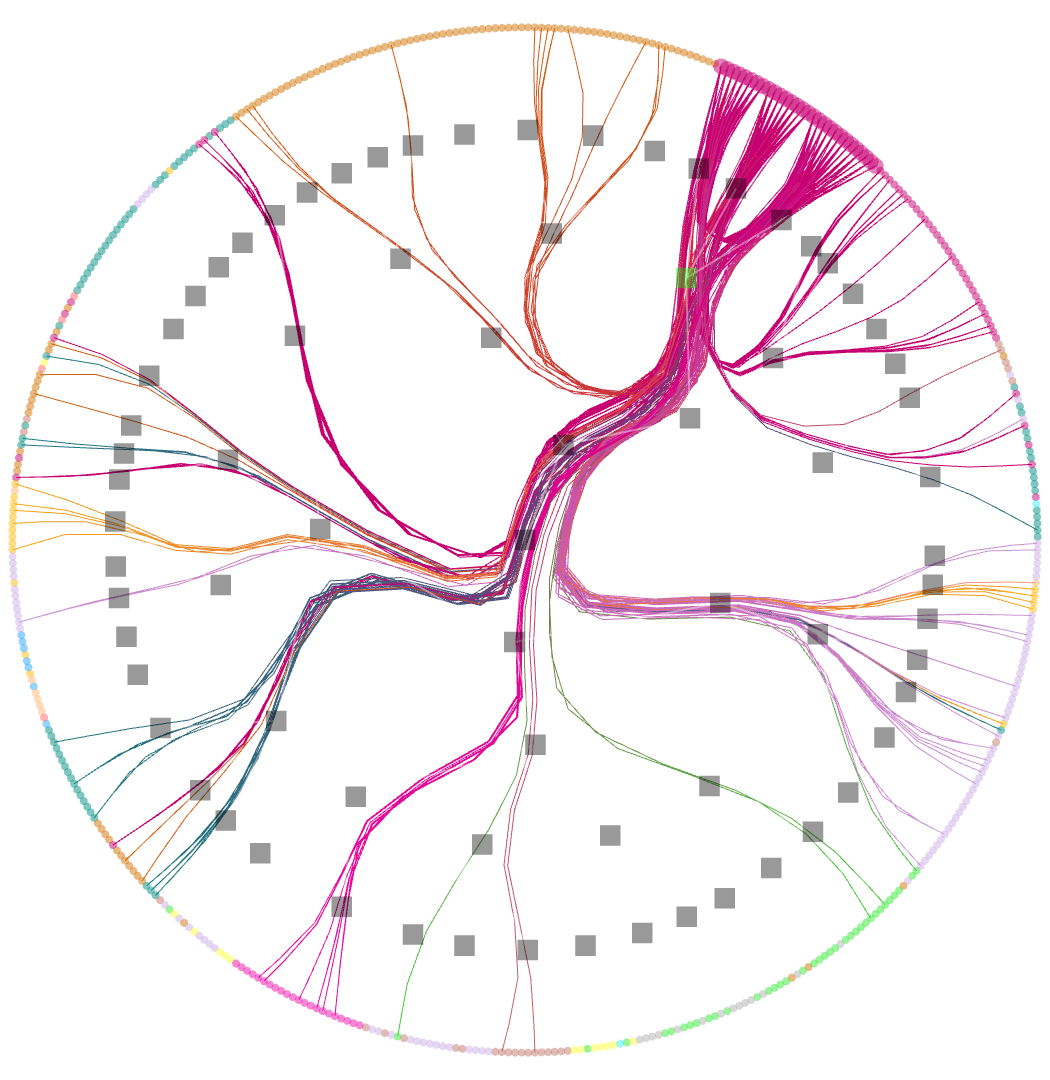
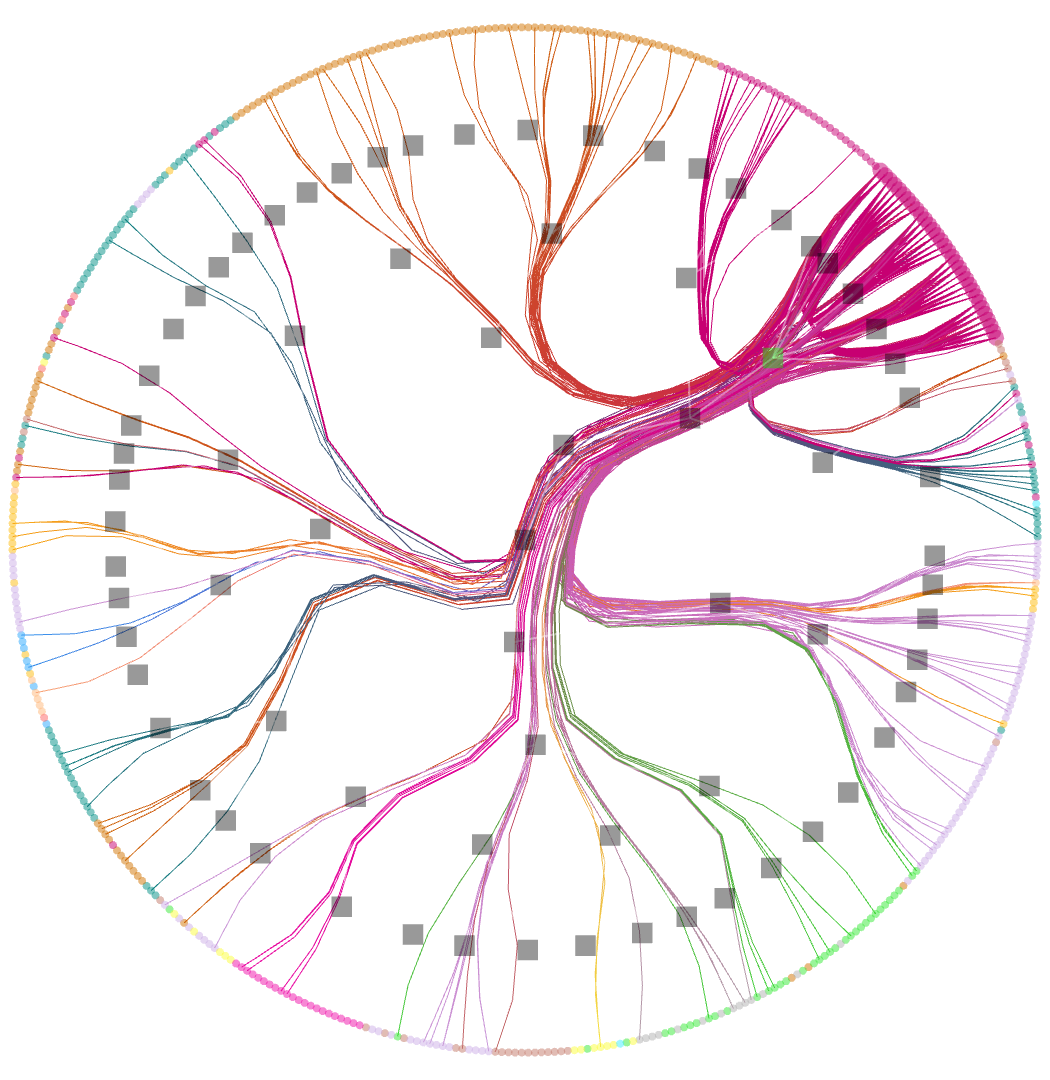
Furthermore, the hierarchical nature of nSBM allows a more detailed categorization of the features. Most of the questions related to Physical activities (in violet) are positioned in the same region of the circle, but they are grouped into two distinct subgroups (see Fig.7). By inspecting the questions in these subgroups, we noticed that the group in Fig.7(a) is related to entertaining activities, such as playing soccer or dancing, while the other (Fig.7(b)) relates to physical activities required by the socioeconomic condition of the respondent, such as walking or cycling from home to school (see the most relevant questions in Table 1). That is related to the fact that in developing countries mobility relates to the socioeconomic level in different ways [8].
The proposed method groups similar questions, such as from Table 1, in nearby regions in the graph. Whereas this analysis could be done manually for visualization purposes, an alternative approach is to performing it automatic and less subjective way. For instance, the questions could be mapped into a vectorial space, tabular2vec. In appendix 3.4, we further discuss this idea and present some results. These preliminary results seem to be consistent with our findings.
| “During the last 7 days, in how many days you went on foot or by bicycle to school?” |
| “During the last 7 days, in how many days you came back on foot or by bicycle to school?” |
| “When you go to school on foot or by bicycle, how long does it take?” |
| “When you come back to school on foot or by bicycle, how long does it take?” |
3.4 Features with a similar interpretation structure as revealed by a tabular2vec approach
The hierarchical structure obtained from nSBM provides a mesoscale interpretation of the relationships between the features allowing addressing questions about how we could group different questions in a survey and how strongly those questions are tied. In addition, we could get some clues about factors, as in the case of PeNSE survey. However, suppose that we are seeking for possible data-leakage issues or investigating specific factors in a tabular data. This problem can be translated to Given a vertices, which relates to a feature, what is the set of other vertices that have the most similar structure in the interpretability graph? One way to answer this is to use a word embedding approach, such as node2vec[16], applied in the context of graphs. Here, we performed a node2vec embedding using the interpretability graph. As an example, Table 2 shows the top four questions with the highest cosine similarity to the question “At school, have you ever received pregnancy prevention counseling?”. Notice that the question “At school, have you ever received advice on how to get condoms for free?” resulted in a cosine similarity of 0.99 with the reference question, meaning that the embeddings of these two different questions are almost the same. This is reasonable considering the fact that interviews aiming counseling youngsters about pregnancy would also talk about condoms. Therefore, this suggests that we can use word embedding and the cosine similarity values in order to identify data relationship issues.
| Cos. | Question |
|---|---|
| 0.99 | “At school, have you ever received advice on how to get condoms for free?” |
| 0.98 | “At school, have you ever received advice about AIDS or other sexually transmitted diseases?” |
| 0.87 | “Have you heard about the vaccination campaign against the HPV virus?” |
| 0.52 | “In the last twelve months, how many times did you get involved in a fight (a physical fight)?” |
3.5 Multilevel analysis
We can do the multilevel analysis defining criteria to select a subset of the vertices sets in the interpretability graph, which represents the set of columns in the tabular data. Here, we proposed and use the magnetic eigenmaps as a tool to perform this column segmentation, similar to image segmentation in computer vision using the combinatorial Laplacian eigenvectors. We present the impact of this segmentation on embedding space got using the t-sne and UMAP technique[20, 34].
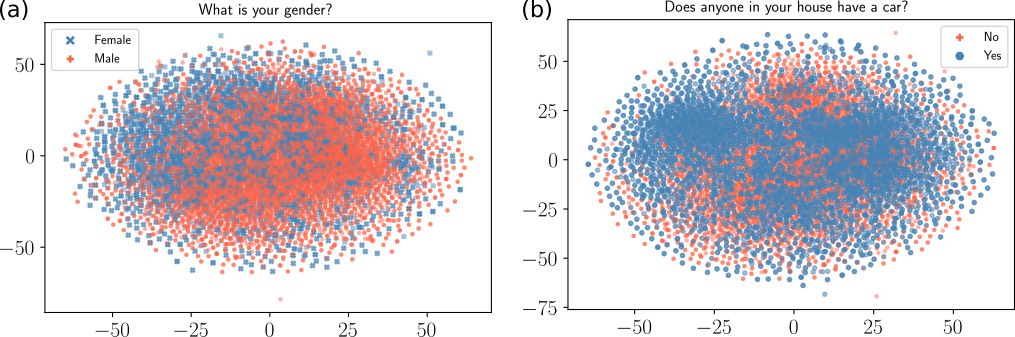
Fig.8 represents the embedding of each row of the survey got by the t-SNE where the colors represent a specific answer for the question above the picture. To compute the t-SNE we used the cosine similarity between each row. Notice the absence of any clustering formation in the embedding space.
Fig.1
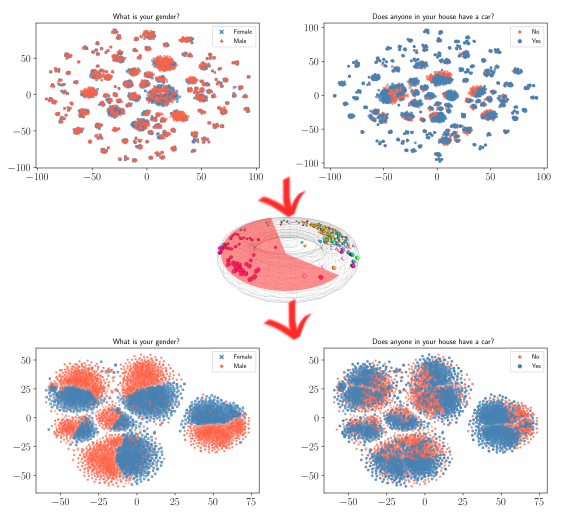
To improve the embedding result from t-sne or UMAP one solution is to perform a weighting in the features using some quantity. This technique is well known and recently was used again in the work [15] using as weight the feature importance. Here, we used a centrality measure derived from the interpretability graph, the hub score, to define this weight. Unfortunately, as a shown in the two pictures on the top of Fig.9 we have a huge number of small clusters present in the space. But, removing somes questions based on the toroidal space obtained from the interpretability graph to segment our features into two groups are performing again the embedding technique we obtained well defined clusters regarding the gender question.
4 Conclusions
Graphs have largely been used to study artificial and real systems, mainly thanks to its direct formalism on modelling relationships. Knowledge in this field has proven to be useful in the study of a variety of problem and data. In this work we report a method that uses recent developments in community and spectral analysis of graphs as well as machine learning interpretability to unravel relationships of the features in a tabular dataset. The proposed method differ from related works mainly by: (1) providing the possibility of interpreting the importance of features in predicting each other and, (2) allowing the study of the data to focus on each observation or to encompass the entire dataset.
To perform the graph analysis proposed in this work it was necessary first to develop a method to map a tabular dataset into a graph that avoids the issues present in previous works. In this method, the graph is modelled having features as vertices and the importance of each feature in predicting another as the weight value of the corresponding directed edge. These weights are assigned by considering the SHAP values of respective predictions of a machine learning model. Since the edges weights are computed for each pair of features, the resulting graph is complete. The complexity of this structure restricts the scope for graph analysis methods that can be effectively applied to it. Therefore, the disparity filter criterion was employed to keep just the strong relationships. From the filtered graph, we showed how to use graph analysis methods to extract insights and improve the understanding of the dataset. Specifically, we analyze the the toroidal embedding obtained by the magnetic Laplacian and the nested stochastic block model to unravel how the features of the dataset group into communities. The resulting modular structure, in turn, allows us to analyze the groups according to varying levels of granularity, thanks to its hierarchical grouping capabilities.
The usefulness of our methodology is exemplified respectively to the PeNSE survey dataset. The results showed several findings such as the good overall agreement between the communities obtained and the original qualitative classification of the questions in the survey, especially for the groups Food and Body Image. However, the method also showed that some questions from the class Safety could also be reassigned as Drug Consumption questions. Also, a high connectivity was observed between the questions from the class Food related to eating with parents and questions from the class Situations at Home, maybe related to the harmonious relationship with the parents.
It is important to understand the scope and limitations of the proposed approach while aiming at developing future works. For instance, the obtained graph takes into account the predictions of a machine learning model, but it does not aim at representing a causality graph. Stronger conditions would need to be satisfied to construct such a graph. Also, if the data is composed of few instances, the findings may result strongly biased. As a future work, different tabular datasets like medical, economical, and technical could be considered. We believe also that future works could investigate the use of some synthetic models for generating extensive tabular therefore allowing more systematic investigations of the suggested method in the spectral space. In doing so, it could be possible to establish a more direct connection between the eigenvalues and eigenvectors behavior and the structural dependencies of features.
Acknowledgments
The authors thank CNPq (grant 307085/2018-0), CAPES and FAPESP (grants 2019/01077-3 and 15/22308-2) for financial support. The authors thank Joao Ricardo Sato, Suzana de S. Santos, Filipi N. Silva and Thomas Peron and for all suggestions and useful discussions.
References
- [1] Jane L. Adams, Todd F. Deluca, Christopher M. Danforth, Peter S. Dodds, Yuhang Zheng, Konstantinos Anastasakis, Boyoon Choi, Allison Min, and Michael M. Bessey. Sirius: A Mutual Information Tool for Exploratory Visualization of Mixed Data. arXiv:2106.05260 [cs, stat], June 2021.
- [2] Amanda Yumi Ambriola Oku, Guilherme Augusto Zimeo Morais, Ana Paula Arantes Bueno, André Fujita, and João Ricardo Sato. Potential Confounders in the Analysis of Brazilian Adolescent’s Health: A Combination of Machine Learning and Graph Theory. International Journal of Environmental Research and Public Health, 17(1):90, December 2019.
- [3] Maurício Lima Barreto, Rita de Cássia Ribeiro-Silva, Deborah Carvalho Malta, Maryane Oliveira-Campos, Marco Antonio Andreazzi, and Alvaro Augusto Cruz. Prevalence of asthma symptoms among adolescents in Brazil: National Adolescent School-based Health Survey (PeNSE 2012). Revista Brasileira de Epidemiologia, 17(1):106–115, 2014.
- [4] Joshua Batson, Daniel A. Spielman, Nikhil Srivastava, and Shang-Hua Teng. Spectral sparsification of graphs: Theory and algorithms. Communications of the ACM, 56(8):87–94, August 2013.
- [5] Yuxin Chen, Yuejie Chi, Jianqing Fan, and Cong Ma. Spectral methods for data science: A statistical perspective. arXiv:2012.08496 [cs, eess, math, stat], Dec 2020. arXiv: 2012.08496.
- [6] Michele Coscia. The Atlas for the Aspiring Network Scientist. arXiv:2101.00863 [physics], February 2021.
- [7] Candace Currie. Inequalities in young people’s health: HBSC international report from the 2005/2006 Survey. Number 5 in 1. World Health Organization, 2008.
- [8] Antônio Nélson Rodrigues Da Silva, Marcela da Silva Costa, and Márcia Helena Macedo. Multiple views of sustainable urban mobility: The case of brazil. Transport Policy, 15(6):350–360, 2008.
- [9] Max Moura de Oliveira, Maryane Oliveira Campos, Marco Antonio Ratzsch de Andreazzi, and Deborah Carvalho Malta. Characteristics of the National adolescent school-based health survey-PeNSE, Brazil. Epidemiologia e Serviços de Saúde, 26:605–616, 2017.
- [10] Bruno Messias F. de Resende and Luciano da F. Costa. Characterization and comparison of large directed networks through the spectra of the magnetic Laplacian. Chaos: An Interdisciplinary Journal of Nonlinear Science, 30(7):073141, July 2020.
- [11] M. Fanuel and J.A.K. Suykens. Deformed Laplacians and spectral ranking in directed networks. Applied and Computational Harmonic Analysis, 47(2):397–422, September 2019.
- [12] Michaël Fanuel, Carlos M. Alaíz, Ángela Fernández, and Johan A.K. Suykens. Magnetic Eigenmaps for the visualization of directed networks. Applied and Computational Harmonic Analysis, 44(1):189–199, January 2018.
- [13] Martin Gerlach, Tiago P. Peixoto, and Eduardo G. Altmann. A network approach to topic models. Science Advances, 4(7):eaaq1360, 2017.
- [14] Aindrila Ghosh, Mona Nashaat, James Miller, Shaikh Quader, and Chad Marston. A comprehensive review of tools for exploratory analysis of tabular industrial datasets. Visual Informatics, 2(4):235–253, December 2018.
- [15] Bruno Iochins Grisci, Mathias J. Krause, and Marcio Dorn. Relevance aggregation for neural networks interpretability and knowledge discovery on tabular data. Information Sciences, 559:111–129, Jun 2021.
- [16] Aditya Grover and Jure Leskovec. node2vec: Scalable feature learning for networks. In Proceedings of the 22nd ACM SIGKDD International Conference on Knowledge Discovery and Data Mining, page 855–864. ACM, Aug 2016.
- [17] Jo Anne Grunbaum, Laura Kann, Steve Kinchen, James Ross, Joseph Hawkins, Richard Lowry, William A. Harris, Tim McManus, David Chyen, and Janet Collins. Youth Risk Behavior Surveillance - United States, 2003 (Abridged). Journal of School Health, 74(8):307–324, October 2004.
- [18] Roger Guimerà, Marta Sales-Pardo, and Luís A. Nunes Amaral. Modularity from fluctuations in random graphs and complex networks. Physical Review E, 70(2):025101, Aug 2004.
- [19] Rogério Lessa Horta, Bernardo Lessa Horta, Andre Wallace Nery da Costa, Rogério Ruscitto do Prado, Maryane Oliveira-Campos, and Deborah Carvalho Malta. Lifetime use of illicit drugs and associated factors among Brazilian schoolchildren, National Adolescent School-based Health Survey (PeNSE 2012). Revista Brasileira de Epidemiologia, 17(1):31–45, 2014.
- [20] Dmitry Kobak and Philipp Berens. The art of using t-sne for single-cell transcriptomics. Nature Communications, 10(11):5416, Nov 2019.
- [21] Harold William Kuhn and Albert William Tucker, editors. Contributions to the Theory of Games (AM-28), Volume II. Princeton University Press, December 1953.
- [22] Edmnund Landau. Zur relativen wertbemessung der turnierresultate. Deutsches Wochenschach, 11:366–369, 1895.
- [23] Edmund Landau. über Preisverteilung bei Spieltunrnieren. Zeitschrift für Mathematik und Physik, 64, 1915.
- [24] Peter Langfelder and Steve Horvath. Wgcna: an r package for weighted correlation network analysis. BMC Bioinformatics, 9(1):559, Dec 2008.
- [25] Renata Bertazzi Levy, Inês Rugani Ribeiro de Castro, Letícia de Oliveira Cardoso, Letícia Ferreira Tavares, Luciana Monteiro Vasconcelos Sardinha, Fabio da Silva Gomes, and André Wallace Nery da Costa. Consumo e comportamento alimentar entre adolescentes brasileiros: Pesquisa Nacional de Saúde do Escolar (PeNSE), 2009. Ciência & Saúde Coletiva, 15:3085–3097, 2010.
- [26] Yuemeng Li, Shuhan Yuan, Xintao Wu, and Aidong Lu. On spectral analysis of directed signed graphs. International Journal of Data Science and Analytics, 6(2):147–162, Sep 2018.
- [27] Scott M. Lundberg, Gabriel Erion, Hugh Chen, Alex DeGrave, Jordan M. Prutkin, Bala Nair, Ronit Katz, Jonathan Himmelfarb, Nisha Bansal, and Su-In Lee. From local explanations to global understanding with explainable AI for trees. Nature Machine Intelligence, 2(1):56–67, January 2020.
- [28] Scott M. Lundberg, Gabriel G. Erion, and Su-In Lee. Consistent individualized feature attribution for tree ensembles. arXiv:1802.03888 [cs, stat], Mar 2019. arXiv: 1802.03888.
- [29] Scott M. Lundberg and Su-In Lee. A unified approach to interpreting model predictions. In Proceedings of the 31st International Conference on Neural Information Processing Systems, NIPS’17, pages 4768–4777, Red Hook, NY, USA, December 2017. Curran Associates Inc.
- [30] Deborah Carvalho Malta, Marco Antonio Ratzsch de Andreazzi, Maryane Oliveira-Campos, Silvania Suely Caribé de Araújo Andrade, Naíza Nayla Bandeira de Sá, Lenildo de Moura, Antonio José Ribeiro Dias, Claudio Dutra Crespo, and Jarbas Barbosa da Silva Júnior. Trend of the risk and protective factors of chronic diseases in adolescents, National Adolescent School-based Health Survey (PeNSE 2009 e 2012). Revista Brasileira de Epidemiologia, 17(1):77–91, 2014.
- [31] Deborah Carvalho Malta, Maryane Oliveira-Campos, Rogério Ruscitto do Prado, Silvania Suely Caribé Andrade, Flávia Carvalho Malta de Mello, Antonio José Ribeiro Dias, and Denise Birche Bomtempo. Psychoactive substance use, family context and mental health among Brazilian adolescents, National Adolescent School-based Health Survey (PeNSE 2012). Revista Brasileira de Epidemiologia, 17(1):46–61, 2014.
- [32] Deborah Carvalho Malta, Marta Angélica Iossi Silva, Flavia Carvalho Malta de Mello, Rosane Aparecida Monteiro, Luciana Monteiro Vasconcelos Sardinha, Claudio Crespo, Mércia Gomes Oliveira de Carvalho, Marta Maria Alves da Silva, and Denise Lopes Porto. Bullying in Brazilian schools: Results from the National School-based Health Survey (PeNSE), 2009. Ciência & Saúde Coletiva, 15:3065–3076, October 2010.
- [33] Riccardo Marcaccioli and Giacomo Livan. A Pólya urn approach to information filtering in complex networks. Nature Communications, 10(1):745, December 2019.
- [34] Leland McInnes, John Healy, and James Melville. Umap: Uniform manifold approximation and projection for dimension reduction. (arXiv:1802.03426), Sep 2020. arXiv:1802.03426 [cs, stat].
- [35] Christoph Molnar. Interpretable Machine Learning, 2019.
- [36] Dan H. Moore. Classification and regression trees. Cytometry, 8(5):534–535, Sep 1987.
- [37] Leonardo Morelli, Valentina Giansanti, and Davide Cittaro. Nested stochastic block models applied to the analysis of single cell data. bioRxiv, page 2020.06.28.176180, Apr 2021.
- [38] Alexey Natekin and Alois Knoll. Gradient boosting machines, a tutorial. Frontiers in Neurorobotics, 7:21, 2013.
- [39] M. E. J. Newman and M. Girvan. Finding and evaluating community structure in networks. Physical Review E, 69(2):026113, Feb 2004.
- [40] Magdalena Niemira, Francois Collin, Anna Szalkowska, Agnieszka Bielska, Karolina Chwialkowska, Joanna Reszec, Jacek Niklinski, Miroslaw Kwasniewski, and Adam Kretowski. Molecular signature of subtypes of non-small-cell lung cancer by large-scale transcriptional profiling: Identification of key modules and genes by weighted gene co-expression network analysis (wgcna). Cancers, 12(1):37, Dec 2019.
- [41] Tiago P. Peixoto. Hierarchical Block Structures and High-Resolution Model Selection in Large Networks. Physical Review X, 4(1):011047, March 2014.
- [42] Tiago P Peixoto. Nonparametric bayesian inference of the microcanonical stochastic block model. Physical Review E, 95(1):012317, 2017.
- [43] Tiago P. Peixoto. Merge-split markov chain monte carlo for community detection. Physical Review E, 102(1):012305, Jul 2020.
- [44] Wojciech Samek. Learning with explainable trees. Nature Machine Intelligence, 2(1):16–17, January 2020.
- [45] M. A. Serrano, M. Boguna, and A. Vespignani. Extracting the multiscale backbone of complex weighted networks. Proceedings of the National Academy of Sciences, 106(16):6483–6488, April 2009.
- [46] Jianbo Shi and J. Malik. Normalized cuts and image segmentation. In Proceedings of IEEE Computer Society Conference on Computer Vision and Pattern Recognition, page 731–737. IEEE Comput. Soc, 1997.
- [47] M. A. Shubin. Discrete Magnetic Laplacian. Communications in Mathematical Physics, 164(2):259–275, August 1994.
- [48] Roberta Mendes Abreu Silva, Amanda Cristina de Souza Andrade, Waleska Teixeira Caiaffa, Danielle Souto de Medeiros, and Vanessa Moraes Bezerra. National adolescent school-based health survey - pense 2015: Sedentary behavior and its correlates. PLOS ONE, 15(1):e0228373, Jan 2020.
- [49] Sebastiano Vigna. Spectral Ranking. arXiv:0912.0238 [physics], February 2019.
- [50] Xitong Zhang, Yixuan He, Nathan Brugnone, Michael Perlmutter, and Matthew Hirn. Magnet: A neural network for directed graphs. arXiv:2102.11391 [cs], Jun 2021. arXiv: 2102.11391.