Phonon-laser ultrasensitive force sensor
Abstract
Developing nano-mechanical oscillators for ultrasensitive force detection is of great importance in exploring science. We report our achievement of ultrasensitive detection of the external force regarding the radio-frequency electric field by a nano-sensor made of a single trapped 40Ca+ ion under injection-locking, where squeezing is additionally applied to detection of the smallest force in the ion trap. The employed ion is confined stably in a surface electrode trap and works as a phonon laser that is very sensitive to the external disturbance. The injection-locking drove the ion’s oscillation with phase synchronization, yielding the force detection with sensitivity of 347 50 yN/. Further with 3 dB squeezing applied on the oscillation phase variance, we achieved a successful detection of the smallest force to be 86.5 70.1 yN.
I INTRODUCTION
With development of nanotechnology using atomic and molecular sensors, the physical quantities have been detected in a higher level of sensitivity than ever before due to the excellent perceived performance of the sensors Hosten2016 ; Schreppler2019 ; Mamin2001 ; Lecocq2015 ; Caves1980 ; Degen2017 ; Kotler12011 ; Kim2017 . Force detection has been always taking an important role in precision measurement since all the changes of motion are concerned with the force due to Newton’s laws, where the small force detection by trapped ions or atoms has recently demonstrated the superiority of high sensitivity and broad adjustability Gilmore2017 ; Affolter2020 ; Gilmore2021 ; Shaniv2017 ; Biercuk2010 ; Blums2018 ; Araneda2019 ; Knunz2010 . The weak AC electric force was sensitively detected by means of spin-motion entanglement in two-dimensional trapped-ion mechanical oscillators Gilmore2017 ; Affolter2020 ; Gilmore2021 . The radio-frequency electric force as small as 5 yN was measured, based on the technique of injection-locked phonon laser, by observing the range of injected frequency and the gravity variance of the ion’s displacement Knunz2010 . Such a radio-frequency electric force was also detected by phase-coherent Doppler velocimetry, reaching the sensitivity of 390 150 yN/ Biercuk2010 . A recent detection of the sub-attonewton force regarding DC electric field was accomplished by measuring the ion’s displacement three-dimensionally at nanometer precision Blums2018 .
In the present work, we report our ultrasensitive detection of the radio-frequency electric force at hundred yoctonewton’s order of magnitude by a nano-probe made of a single trapped 40Ca+ ion. Although our detection, similar to in Knunz2010 , also takes advantage of the stably confined ion behaving as a phonon laser, we acquired the sensitivity of the sensor and the lower bound of the small force by faster measurements compared to the method of scanning the injection frequency in Knunz2010 . In addition, squeezing technique Natarajan1995 was employed to further suppress thermal noises in the system. The ion’s phonon laser under our consideration works as an amplitude-amplified harmonic oscillator, which is quite sensitive to the external force, as reported previously Vahala2009 ; Grudinin2010 ; Ip2018 ; He2016 ; Hush2015 ; Dominguez2017 . In our experiment, the trapped 40Ca+ ion was first Doppler-cooled and then pumped simultaneously by a red-detuned laser and a blue-detuned laser with respect to the resonant transition. After locking the oscillation frequency by injection signal, we might detect the injected force, which is induced by a radio-frequency electric field, based on the photon count measurements of the oscillation amplitude, the latter of which was carried out by fitting the fluorescence curve directly acquired from the photomultiplier tube (PMT) along with the synchronized measurement of the injection-locking signal. Our achieved force sensitivity is as low as 347 50 yN/, and the oscillation amplitude uncertainty is only 15 nm with respect to the oscillation amplitude 18 m. The detection sensitivity represents the minimum detectable change rate of the force. In contrast, we may also try to detect the smallest force, indicating the minimum force our probe could sense. To this end, we introduce the squeezing technique as in Natarajan1995 and with 3 dB squeezing applied on the oscillation phase variance, we detected successfully the smallest force of 86.5 70.1 yN. Our technique could be applied to the oscillation force sensors using other ions, atoms or solid-state oscillators.
II Experimental system and scheme
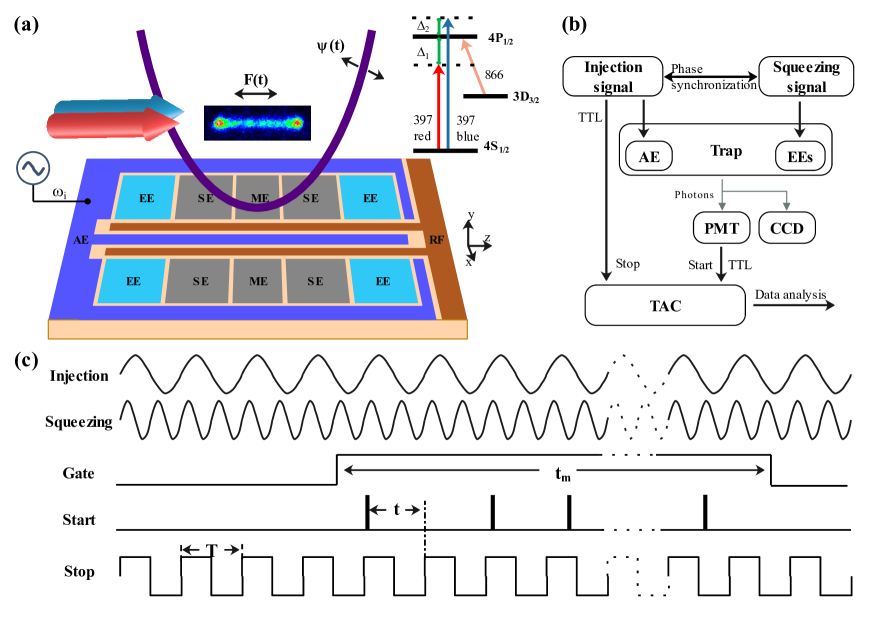
Our experiment of ultrasensitive force detection is carried out by an injection-locked phonon laser regarding a single trapped ion confined stably in the harmonic potential of a surface-electrode trap (SET), see Fig. 1a. The SET employed in our experiment was introduced previously Brownnutt2015 ; Wan2013 ; Liu2020 ; House2008 , which is a 500-m scale planar trap composed of two pairs of endcap electrodes, two pairs of steering electrodes, a pair of middle electrodes, an axial electrode and a radio-frequency electrode. The measured secular frequencies of the SET are, respectively, = 186.020.01 kHz, = 680.40.1 kHz, and = 1020.30.5 kHz. The 40Ca+ ions, when confined stably in the potential, stay with 800 m above the surface of the SET.
The phonon laser is produced by the oscillation amplification of the single 40Ca+ ion stimulated by two 397 nm laser beams, one of which is a red-detuned beam with detuning = -75 MHz and the other of which is a blue-detuned beam with = 30 MHz. Both of the laser beams are elaborately tuned to be with the appropriate intensity ratio = = 0.5 ( = 370 W/m2 and = 175 W/m2) in order to keep the oscillation amplification stable Vahala2009 , which yields the phonon laser with the oscillation amplitude of 17.839 m. Besides, we have a saturated 866 nm laser for repumping, as sketched in Fig. 1a. Since the decay from to is much larger than that from to , the three-level system could be reasonably considered as a two-level system Yan2019 .
In our system, we may produce the phonon laser solely regarding the axis motional degree of freedom of the ion due to the large frequency differences in different directions. Due to the same reason, we may lock the phonon laser’s oscillation frequency to , i.e., the trap frequency along axis, by applying an appropriate injection-locking signal to AE, which has no influence on other two directions. Generally speaking, when the injection frequency is tuned to the locking range, the phonon laser’s oscillation frequency would be fixed at with a very sharp bandwidth Knunz2010 , implying that the oscillation phase , rather than the oscillation amplitude , is also locked. In this case, we describe the injection force simply as , where is the force amplitude to be detected.
The main operations of our experiment are controlled by the injection and/or squeezing signal processing system, as sketched in Fig. 1b. The time-to-amplitude converter (TAC) gets started from the transistor-transistor logic (TTL) signal of the photon pulses via PMT and ended at the synchronized TTL signal of the injection. The time resolution of the TAC is 10 ns, which fully satisfies the requirements of the present experiment. The phonon laser is observed from the charge-coupled-device (CCD), see the images in Fig. 1a. With the locking signal applied, we may observe the oscillation of the phonon laser amplifying in an approximately linear way, implying that the injection locking takes action. To acquire the values of the phase and the amplitude of the oscillation, we locked the oscillation frequency of the phonon laser, and recorded the accumulated photon counts within each measurement time , as indicated in Fig. 1c.
III Fitting method
For our purpose, we have developed an approach to fast acquire the value of by fitting the recorded photons. To this end, we assume that and are constants in by ignoring the short-time noise. Under the irradiation of the 397-nm laser beams, the scattering rate at time is given by Leibfried2003 ,
| (1) |
where is the decay rate of , is the wave vector, means the detuning and represents the saturation parameter. Due to two 397-nm laser beams with different detunings in our experiment, the total scattering rate = . To fit the experimental photon counts, we involved the noise, such as the projection noise, the laser power noise and etc, for which the Gaussian term is introduced in fitting the curve of by a convolution function,
| (2) |
where = with the degree of time dispersion. and represent the factors regarding the measurement time , the fluorescence collection efficiency , the background photons and the number of unit time intervals as well as the signal-to-noise ratio (SNR) relevant to the background light. More details about the fitting can be found in Appendix.
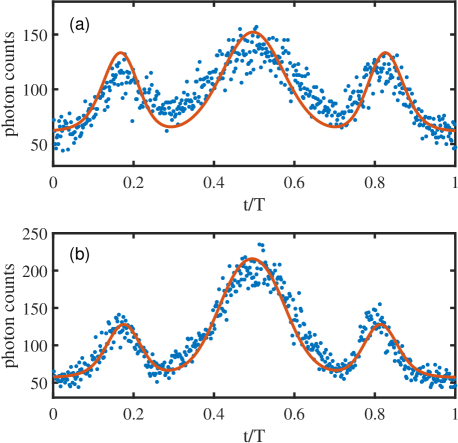
Figure 2 presents two fitting curves with respect to the experimental data under different injection voltages . From the fitting, we acquired the oscillation amplitude and phase as constants. We observed that tuning mainly changes the position of the curve in the horizontal axis of and varying mainly influences the height of the second peak of the curve. This indicates that and are mutually independent and thus can be acquired simultaneously by the fitting.
IV Results and discussion
IV.1 Force sensing
The force calibration is needed prior to the force sensing due to the fact that the injection force sensed by the ion originates from a radio-frequency voltage on AE applied by the injection-locking signal and should be evaluated by comparing with the counterpart regarding a DC voltage on AE. For the latter, we have the static force = with the position deviation of the ion due to the applied DC voltage. In our experiment, we have measured = 12 m when the applied DC voltage is 3 V, implying the force = 1088.5 zN. Thus we obtained the slope = 362.8 yN/mV.
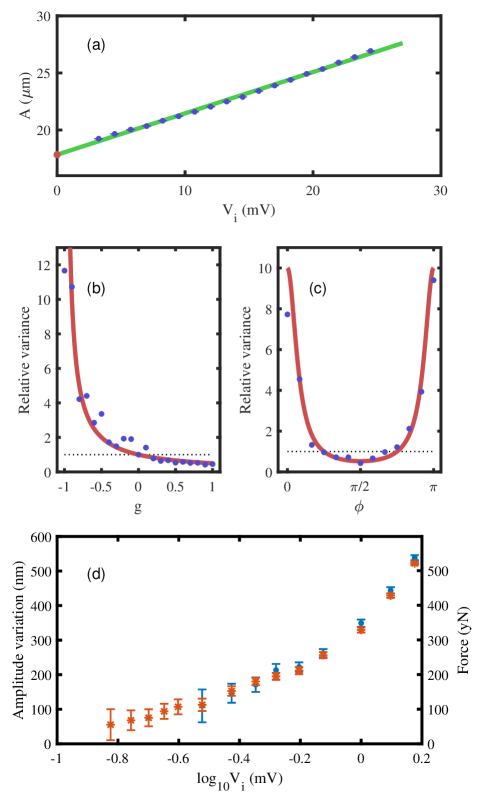
For a harmonic oscillator, such as the trapped ion, however, the oscillation amplitude variation due to the applied radio-frequency voltage of the injection signal originates from the resonance absorption of the energy. But we may reasonably consider the amplitude variation to be driven by the force by assuming . Since the oscillation amplitude can be accurately measured, as discussed above, by fitting the fluorescence curve when the oscillation frequency is locked, we obtained a linear relationship between the injection voltage and the oscillation amplitude , with the slope = 362.1 nm/mV, see Fig. 3a. Excluding the original oscillation amplitude without injection, i.e., 17.839 m, we found the relationship between the injection force and the oscillation amplitude as = 0.9979 nm/yN. Due to frequency drifts, the measured secular frequency along axis is = 186.020.01 kHz, which yields the uncertainty of the measured oscillation amplitude to be 152 nm regarding . Therefore, the sensitivity of our force sensor is 34750 yN/.
IV.2 Squeezing
Squeezing is an effective way to reduce the noises in precision measurement Natarajan1995 ; Burd2019 ; Majorana1997 ; Briant2003 ; Wollman2015 . In our experiment, we try to further improve the measurement precision by employing the approach of squeezing to suppress thermal noises regarding the oscillator, as explored in Natarajan1995 . Compared to the quantum mechanical squeezing to suppress quantum noises for beating standard quantum limit, the squeezing employed here is the classical squeezing, which reduces the effect of thermal noise by redistributing the thermal fluctuations. Since this squeezing is produced also by doubling the motional frequency, similar to the quantum counterpart, we may simply call it squeezing here. In our case with the Doppler-cooled ion, this squeezing helps us improve the precision of detection in the measurement of the smallest force.
The squeezing signal is applied on the EEs with frequency doubling and synchronizing with respect to the injection signal. So only the motion along axis could feel the squeezing effect. Mathematically, the uncertainty of the oscillation can be expressed by the measured standard deviation of and , i.e., = and = , where is the oscillation amplitude in the absence of noises. By ignoring the second-order terms in derivative as well as the higher-order terms of frequency, we acquired the variance of as Majorana1997 ; Briant2003 ,
| (3) |
where means the variance without squeezing and is relevant to the trapping potential modification regarding the squeezing signal (see Appendix for details).
We focus on the variance of the oscillation phase below since we have only locked the oscillation phase, rather than the oscillation amplitude. Squeezing the variance of the phase requires reducing , as indicated in Eq. (3), which is achieved by tuning and , respectively. Fig. 3(b,c) present the relative variance as functions of and , where the red solid curves represent the theoretical simulation using Eq. (3) and the blue dots are the experimental results with each dot acquired by 50 measurements. From the results, we identified the best squeezing effects occurred at 3 dB when = -1.
In our experiment, we have observed the effect of squeezing on the oscillation phase, rather than the oscillation amplitude. This is due to the fact that the squeezing is relevant to the injection-locking we applied, which fixed the phase, but not the amplitude. Compared to the frequency/phase locking, locking amplitude is more challenging in ion-trap systems. For example, the feedback-locking is in principle available to fix the oscillation amplitude, but hard to achieve using current techniques since it requires higher scattering rate and higher fluorescence collection efficiency. Nevertheless, with only frequency/phase locked, we are able to reach the lower bound in the force detection, as elucidated below.
IV.3 Lower bound of force detection
To detect the smallest force, we may reduce the injection voltage until the phonon laser is unlocked, which is judged by fitting the values regarding the variation of the phonon laser’s oscillation amplitude with respect to the voltage. Qualitatively, we identify the phonon laser working in a critical point when the oscillation frequency is locked with success probability of 90. This implies the failure of the force detection once the locking probability is lower than 90. By this way, we have detected in the absence of squeezing the critical voltage of 0.3 mV, corresponding to the lower bound of the detectable force as 171.7 74.3 yN, where the large uncertainty comes from the very weak locking at the critical point and can be resorted to the error bars, as marked in Fig. 3(d). While with 3 dB squeezing applied, the lower bound goes further down to 86.5 70.1 yN due to the successful reach of the critical voltage of 0.15 mV, where the uncertainty is also reduced due to squeezing. Since 3 dB is the best squeezing value in our experiment, we consider this lower bound to be the smallest force we can detect.
Note that, the smallest force detection in our method is determined by the frequency locking and squeezing. Repetition of measurement just helps reducing the detection uncertainty, but irrelevant to the lower bound. In this context, we have measured the electric noise on the electrodes for further understanding of the force detection lower bound. We found that the electric noise is approximately 2 mV. This fact explains the lower bound we have reached in our force detection, that is, the injection voltage could be sensed by the phonon laser only when larger than 15 (8) of the total electric noise in the absence (presence) of squeezing. This indicates that, besides reducing the measurement variance, the squeezing also improves the signal detection from the electric noise, favoring the sensing of the smaller force. In this context, to further detect a smaller force, we will have to optimize our method by suppressing the electric noises. Besides, reducing the frequency drift would be another important effort in the future. We have found that the frequency drifts for about 10 Hz during each measurement of 500 s. Since the locking range is really narrow, the frequency drift has the strong influence on the smallest force detection which occurs at the critical point of the frequency locking.
V Conclusion
In summary, we have demonstrated experimentally an ultrasensitive force sensor of the phonon laser of a trapped ion, where injection-locking favors high sensitivity of force detection and squeezing helps for detecting the smallest force. Our implementation worked without the prerequisite of sideband cooling, but efficiently suppressed thermal noises in the detection of the smallest force. Besides, we developed a fast approach to measure the oscillation amplitude based on counting the emitted photons. By this way, without the help of the phase Fresnel lens as employed in Blums2018 , our force detection by means of detecting the oscillation amplitude variation of the phonon laser is more sensitive to the external disturbance than by detecting the ion’s position deviation. In this context, we anticipate that our scheme could be further optimized to achieve the force detection with better sensitivity in the case of higher fluorescence collection efficiency, lighter ion probe and lower electric noise. Further efforts in the future would be to suppress the secular frequency drift resulted from the electrodes’ voltage drift and lock the oscillation amplitude of the phonon laser. Our employed technique can also be generalized to precisely detecting the force gradient and the surface noise due to electric fluctuation.
ACKNOWLEDGMENTS
This work was supported by Key Research Development Project of Guangdong Province under Grant No. 2020B0303300001, by National Key Research Development Program of China under grant No. 2017YFA0304503, and by National Natural Science Foundation of China under Grant Nos. 12074346, 12074390, 11835011, 11804375, 11804308, 91421111, 11734018.
Zhichao Liu and Yaqi Wei contributed equally to this work.
Appendix A: Dynamics
For a harmonic oscillator with the oscillation frequency under perturbation of the thermal noise, the motion is described as = , which can be rewritten as Natarajan1995 ,
| (A1) |
with two orthogonal components = and = . In the varying electric field, the trap secular frequency in our experiment is given by
| (A2) |
where is the charge-to-mass ratio of 40Ca+ ion and is the potential along axis without squeezing.
When the classical squeezing is on, the squeezing with frequency would modify the original potential, meaning , where is the assumed gain and is the relative phase with respect to the injection signal. In this case, the trap frequency is rewritten as = . For convenience of calculation, we assume = , where is dimensionless and , and is the frictional damping. Considering two 397 nm laser beams, we have the total frictional damping = with the mathematical expression as Leibfried2003 ,
| (A3) |
where , and are, respectively, the wave number, detuning and saturation parameter of the th beam of the 397-nm laser.
As the oscillation frequency of the phonon laser is locked and the squeezing is on, we have and then the Langevin equation is given by Rugar1991 ,
| (A4) |
where the random force by thermal noise is and the injection force is = . When the oscillation frequency is locked, we have = . Rewriting Eq. (A4) by two orthogonal components and , we obtain,
| (A5) |
| (A6) |
where the second-order terms and ’’ terms are neglected. Thus the variances of and related to temperature are = = Majorana1997 . In our experiment, we just focus on , whose variance with the squeezing gain can be written as in Eq. 3 Briant2003 .
From Eq. (A1), we have = , where is the uncertainty of the oscillation phase. Therefore, we obtain = . In the case of 01, the uncertainty increases, whereas for -10, the uncertainty reduces. We have observed experimentally that the best squeezing is 3 dB, which occurs in 1 and = .
Appendix B: Fluorescence collection efficiency
Improving the fluorescence collection efficiency of the force sensor is an important technique to achieve higher sensitivity. In our experiment, the numerical aperture of the imaging lens set is 0.36 and the transmittance is 80. The transfer efficiency of the photons by PMT is 23 and only 70 light goes through the beam splitter mirror. There are other factors in our system for the light loss of 12. For the phonon laser, the TAC transfer efficiency of the PMT pulses to TTL is about 66. Therefore, the total fluorescence collection efficiency is about 0.25 in theoretical prediction, which basically agrees with the measurement result 0.28. The SNR is about 2.0 and the background noise is mainly from the diffuse reflection of the two 397-nm laser beams.
The efficiency is an important factor for sensitivity. With high efficiency, the total measurement time could be shorten, where can be written as the product of the single measurement time and the measurement repetition , namely = . In our experiment, = 50 and = 10 s. Therefore, the sensitivity is given by Campbell2017 ,
| (A7) |
where is the standard deviation of the measured oscillation amplitude. In our experiment, we have = 0.9979 nm/yN and = 15 nm, so that the sensitivity is 347 yN/, which could be improved by lowering the total measurement time , i.e., enhancing the fluorescence collection efficiency.
Appendix C: Drift of the secular frequency
When the oscillation frequency of the phonon laser is locked to the injection frequency , i.e., = , the bandwidth of the oscillation frequency turns to be very sharp. The locking range is approximately in linear proportion to the injection force and the central frequency of the locking range is exactly the secular frequency Knunz2010 . However, there exist drifts of the voltages applied on the electrodes, which lead to the secular frequency drifts. We have observed experimentally the drift of the frequency for about 10 Hz per 500 s. This drift has strong influence on the smallest force detection which occurs at the critical point of the frequency locking. Further suppression of such drifts would make a smaller force detection available.
Appendix D: Fitting parameters
Before acquiring the oscillation amplitude and phase by fitting experimental data, we need to determine other parameters. The detunings of the 397-nm laser beams can be adjusted by acoustic optical modulators, and the resonant frequency is obtained by the Lorentzian curve Li2020 ; Urabe1998 . The densities of the 397-nm laser beams are directly measured by saturation spectra, which are = 0.8 and = 0.4 in our experiment. The wave vectors are approximately considered as , related to the resonant frequency 755.22 THz. The decay rate is = 20.68 MHz.
Other three parameters , and are obtained by the fitting. We set = 0.8 s in terms of the system’s noise, and observed the oscillation amplitude 22 m of the phonon laser. The emitted photons are theoretically 1.271107 within 10 seconds, while the experimentally collected photon count is 5.353104. Since the SNR is about 2.0, we have to be 0.28. Then we acquired the values of and by = and = , which led to the values of and .
References
- (1) O. Hosten, N. J. Engelsen, R. Krishnakumar, M. A. Kasevich, Measurement noise 100 times lower than the quantum-projection limit using entangled atoms. Nature 529, 505-508 (2016).
- (2) S. Schreppler, N. Spethmann, N. Brahms, T. Botter, M. Barrios, D. M. Stamper-Kurn, Optically measuring force near the standard quantum limit. Science 344, 1486-1489 (2019).
- (3) H. J. Mamin, D. Rugar, Sub-attonewton force detection at millikelvin temperatures. Appl. Phys. Lett. 79, 3358 (2001).
- (4) F. Lecocq, J. B. Clark, R. W. Simmonds, J. Aumentado, J. D. Teufel, Quantum nondemolition measurement of a nonclassical state of a massive object. Phys. Rev. X 5, 041037 (2001).
- (5) C. M. Caves, Quantum-mechanical noise in an interferometer. Phys. Rev. D 23, 8 (1980).
- (6) C. L. Degen, F. Reinhard. P. Cappellaro, Quantum sensing. Rev. Mod. Phys. 89, 035002 (2017).
- (7) S. Kotler, N. Akerman, Y. Glickman, A. Keselman, R. Ozeri, Single-ion quantum lock-in amplifier. Nature 473, 61-65 (2011).
- (8) E. Kim, A. Safavi-Naini, D. A. Hite, K. S. McKay, D. P. Pappas, P. F. Weck, and H. R. Sadeghpour. Electric-field noise from carbon-adatom diffusion on a Au(110) surface: First-principles calculations and experiments. Phys. Rev. A 95, 033407 (2017).
- (9) K. A. Gilmore, J. G. Bohnet, B. C. Sawyer, J.W. Britton, and J. J. Bollinger, Amplitude sensing below the zero-point fluctuations with a two-dimensional trapped-ion mechanical oscillator. Phys. Rev. Lett. 118, 263602 (2017).
- (10) M. Affolter, K. A. Gilmore, J. E. Jordan and J. J. Bollinger. Phase-coherent sensing of the center-of-mass motion of trapped-ion crystals. Phys. Rev. A 102, 052609 (2020).
- (11) K. A. Gilmore, M. Affolter, R. J. Lewis-Swan, D. Barberena, E. Jordan, A. M. Rey and J. J. Bollinger. Quantum-enhanced sensing of displacements and electric fields with large trapped-ion crystals. arXiv:2103.08690.
- (12) S. Knünz, M. Herrmann, V. Batteiger, G. Saathoff, T. W. Hänsch, K. Vahala, T. Udem, Injection-lock of a trapped-ion phonon laser. Phys. Rev. Lett. 105, 013004 (2010).
- (13) M. J. Biercuk, H. Uys, J. W. Britton, A. P. VanDevender, J. J. Bollinger, Ultrasensitive detection of force and displacement using trapped ions. Nat. Nanotechnol. 5, 646-650 (2010).
- (14) R. Shaniv, R. Ozeri, Quantum lock-in force sensing using optical clock Doppler velocimetry. Nat. Commun 8, 14157 (2017).
- (15) V. Blūms, M. Piotrowski, M. I. Hussain, B. G. Norton, S. C. Connell, S. Gensemer, M. Lobino, E. W. Streed, A single-atom 3D sub-attonewton force sensor. Sci. Adv. 4, 4453 (2018).
- (16) G. Araneda, S. Walser, Y. Colombe, D. B. Higginbottom, J. Volz, R. Blatt, A. Rauschenbeute, Wavelength-scale errors in optical localization due to spin-orbit coupling of light. Nat. Phys. 15, 17-21 (2019).
- (17) V. Natarajan, F. DiFilippo, D. E. Pritchard, Classical squeezing of an oscillator for subthermal noise operation. Phys. Rev. Lett. 74, 2855 (1995).
- (18) K. Vahala, M. Herrmann, S. Knünz, V. Batteiger, G. Saathoff, T. W. Hänsch and T. Udem, A phonon laser. Nat. Phys. 5, 682-686 (2009).
- (19) I. S. Grudinin, H. Lee, O. Painter, K. J. Vahala, Phonon laser action in a tunable two-level system. Phys. Rev. Lett. 104, 083901 (2010).
- (20) M. Ip, A. Ransford, A. M. Jayich, X. Long, C. Roman, and W. C. Campbell, Phonon lasing from optical frequency comb illumination of trapped ions. Phys. Rev. Lett 121, 043201 (2018).
- (21) B. He, L. Yang, M. Xiao, Dynamical phonon laser in coupled active-passive microresonators. Phys. Rev. A 94, 031802 (2016).
- (22) M. R. Hush, W. Li, S. Genway, I. Lesanovsky, A. D. Armour, Spin correlations as a probe of quantum synchronization in trapped-ion phonon lasers. Phys. Rev. A 91, 061401 (2015).
- (23) F. Dominguez, I. Arrazola, J. Doménech1, J. S. Pedernales, L. Lamata, E. Solano, D. Rodriguez1, A single-ion reservoir as a high-sensitive sensor of electric siqnals. Sci. Rep. 7, 8336 (2017).
- (24) M. Brownnutt, M. Kumph, P. Rabl, R. Blatt, Ion-trap measurements of electric-field noise near surfaces. Rev. Mod. Phys. 87, 1419 (2015).
- (25) W. Wan, H. Y. Wu, L. Chen, F. Zhou, S. J. Gong, and M. Feng, Demonstration of motion transduction in a single-ion nonlinear mechanical oscillator. Phys. Rev. A 89, 063401 (2013).
- (26) Z. C. Liu, L. Chen, Ji Li, H. Zhang, C. Li, F. Zhou, S. L. Su, L. L. Yan, M. Feng, Structural phase transition of the ion crystals embedded in an optical lattice. Phys. Rev. A 102, 033116 (2020).
- (27) M. G. House, Analytic model for electrostatic fields in surface-electrode ion traps. Phys. Rev. A 78, 033402 (2008).
- (28) L. L. Yan, S. L. Su, and M. Feng, Analytical investigation of one-dimensional Doppler cooling of trapped ions with -type configuration. Phys. Rev. A 100, 033418 (2019).
- (29) D. Leibfried, R. Blatt, C. Monroe, D. Wineland, Quantum dynamics of single trapped ions. Rev. Mod. Phys. 75, 281 (2003).
- (30) E. Majorana, Y. Ogawa, Mechanical thermal noise in coupled oscillators. Phys. Lett. A 233, 162-168 (1997).
- (31) T. Briant, P. F. Cohadon, M. Pinard, A. Heidmanna, Optical phase-space reconstruction of mirror motion at the attometer level. Eur. Phys. J. D 22, 131-140 (2003).
- (32) E. E. Wollman, C. U. Lei, A. J. Weinstein, J. Suh, A. Kronwald, F. Marquardt, A. A. Clerk, K. C. Schwab, Quantum squeezing of motion in a mechanical resonator. Phys. Rev. A 349, 952-955 (2015).
- (33) S. C. Burd, R. Srinivas, J. J. Bollinger, A. C. Wilson, D. J. Wineland, D. Leibfried, D. H. Slichter, D. T. C. Allcock, Quantum amplification of mechanical oscillator motion. Science 364, 1163-1165 (2019).
- (34) J. Li, L. Chen, Y. H. Chen, Z. C. Liu, H. Zhang. and M. Feng, Three-Dimensional Compensation for Minimizing Heating of the Ion in Surface-Electrode Trap. Chin. Phys. Lett. 37, 053701 (2020).
- (35) S. Urabe, M. Watanabe, H. Imajo, K. Hayasaka, U. Tanaka and R. Ohmukai, Observation of Doppler sidebands of a laser-cooled Ca+ ion by using a low-temperature-operated Laser diode. Apply. Phys. B 67, 223 (1998).
- (36) D. Rugar and P. Griitter, Mechanical parametric amplification and thermomechanical noise squeezing. Phys. Rev. Lett. 67, 6 (1991).
- (37) W. C. Campbell, and P. Hamilton, Rotation sensing with trapped ions. J. Phys. B 50, 064002 (2017).