Role of equilibrium fluctuations in light-induced order
Abstract
Engineering novel states of matter with light is at the forefront of materials research. An intensely studied direction is to realize broken-symmetry phases that are “hidden” under equilibrium conditions but can be unleashed by an ultrashort laser pulse. Despite a plethora of experimental discoveries, the nature of these orders and how they transiently appear remain unclear. To this end, we investigate a nonequilibrium charge density wave (CDW) in rare-earth tritellurides, which is suppressed in equilibrium but emerges after photoexcitation. Using a pump-pump-probe protocol implemented in ultrafast electron diffraction, we demonstrate that the light-induced CDW consists solely of order parameter fluctuations, which bear striking similarities to critical fluctuations in equilibrium despite differences in the length scale. By calculating the dynamics of CDW fluctuations in a nonperturbative model, we further show that the strength of the light-induced order is governed by the amplitude of equilibrium fluctuations. These findings highlight photoinduced fluctuations as an important ingredient for the emergence of transient orders out of equilibrium. Our results further suggest that materials with strong fluctuations in equilibrium are promising platforms to host “hidden” orders after laser excitation.
In a symmetry-breaking phase transition, fluctuations of the order parameter provide important information about the way an ordered state develops. Near the transition temperature , fluctuations exhibit a diverging correlation length and correlation time, whose critical exponents define the underlying universality class. In contrast to the equilibrium situation, the role of order parameter fluctuations remains unclear if a phase transition proceeds under nonequilibrium conditions. Of particular interest are transitions instigated by an intense laser pulse, which has led to discoveries of many “hidden” orders that are not accessible in thermal equilibrium, such as light-induced superconductivity [1, 2, 3], charge or spin density waves [4, 5, 6, 7], and ferroelectricity [8, 9]. These out-of-equilibrium orders are often short-lived, raising the question of whether they exist in the form of fluctuations and if so, how they are related to fluctuations in equilibrium.
Empirically, several material classes that host transient states also display strong equilibrium fluctuations of the associated order [10, 11, 12, 13, 3, 8, 9, 14]. In underdoped cuprates where light-induced superconductivity was discovered [10, 11, 12, 13], pronounced superconducting fluctuations are expected due to the small phase stiffness and poor screening [15]. In -type organic salts where light-induced superconductivity was observed above , Nernst effect measurements also pointed towards large fluctuations due to a nearby Mott criticality [16, 17, 3]. In cases where equilibrium fluctuations do not yield an ordered state at finite temperature, such as in the quantum paraelectric phase of SrTiO3, a terahertz pulse can induce a ferroelectric state in a metastable fashion [18, 8, 9]. These observations suggest that photoinduced orders may be a special manifestation of equilibrium fluctuations, but experimental evidence is lacking to formally establish a link between the two entities.
Here, through a side-by-side comparison, we show that a newly-discovered photoinduced charge density wave (CDW) [4, 5] shares the key characteristics of the CDW fluctuations at even though the former does not have a diverging correlation length. The comparison was enabled by a pump-pump-probe scheme with ultrafast electron diffraction, which gives a direct measurement of fluctuations through diffuse scatterings. Using a nonperturbative calculation, we further demonstrate that the intensity of the photoinduced CDW peak increases with the strength of the CDW fluctuations in equilibrium. The positive correlation suggests that photoinduced “hidden” state is more likely found in systems with significant equilibrium fluctuations, paving the way forward as we search for novel nonequilibrium orders.
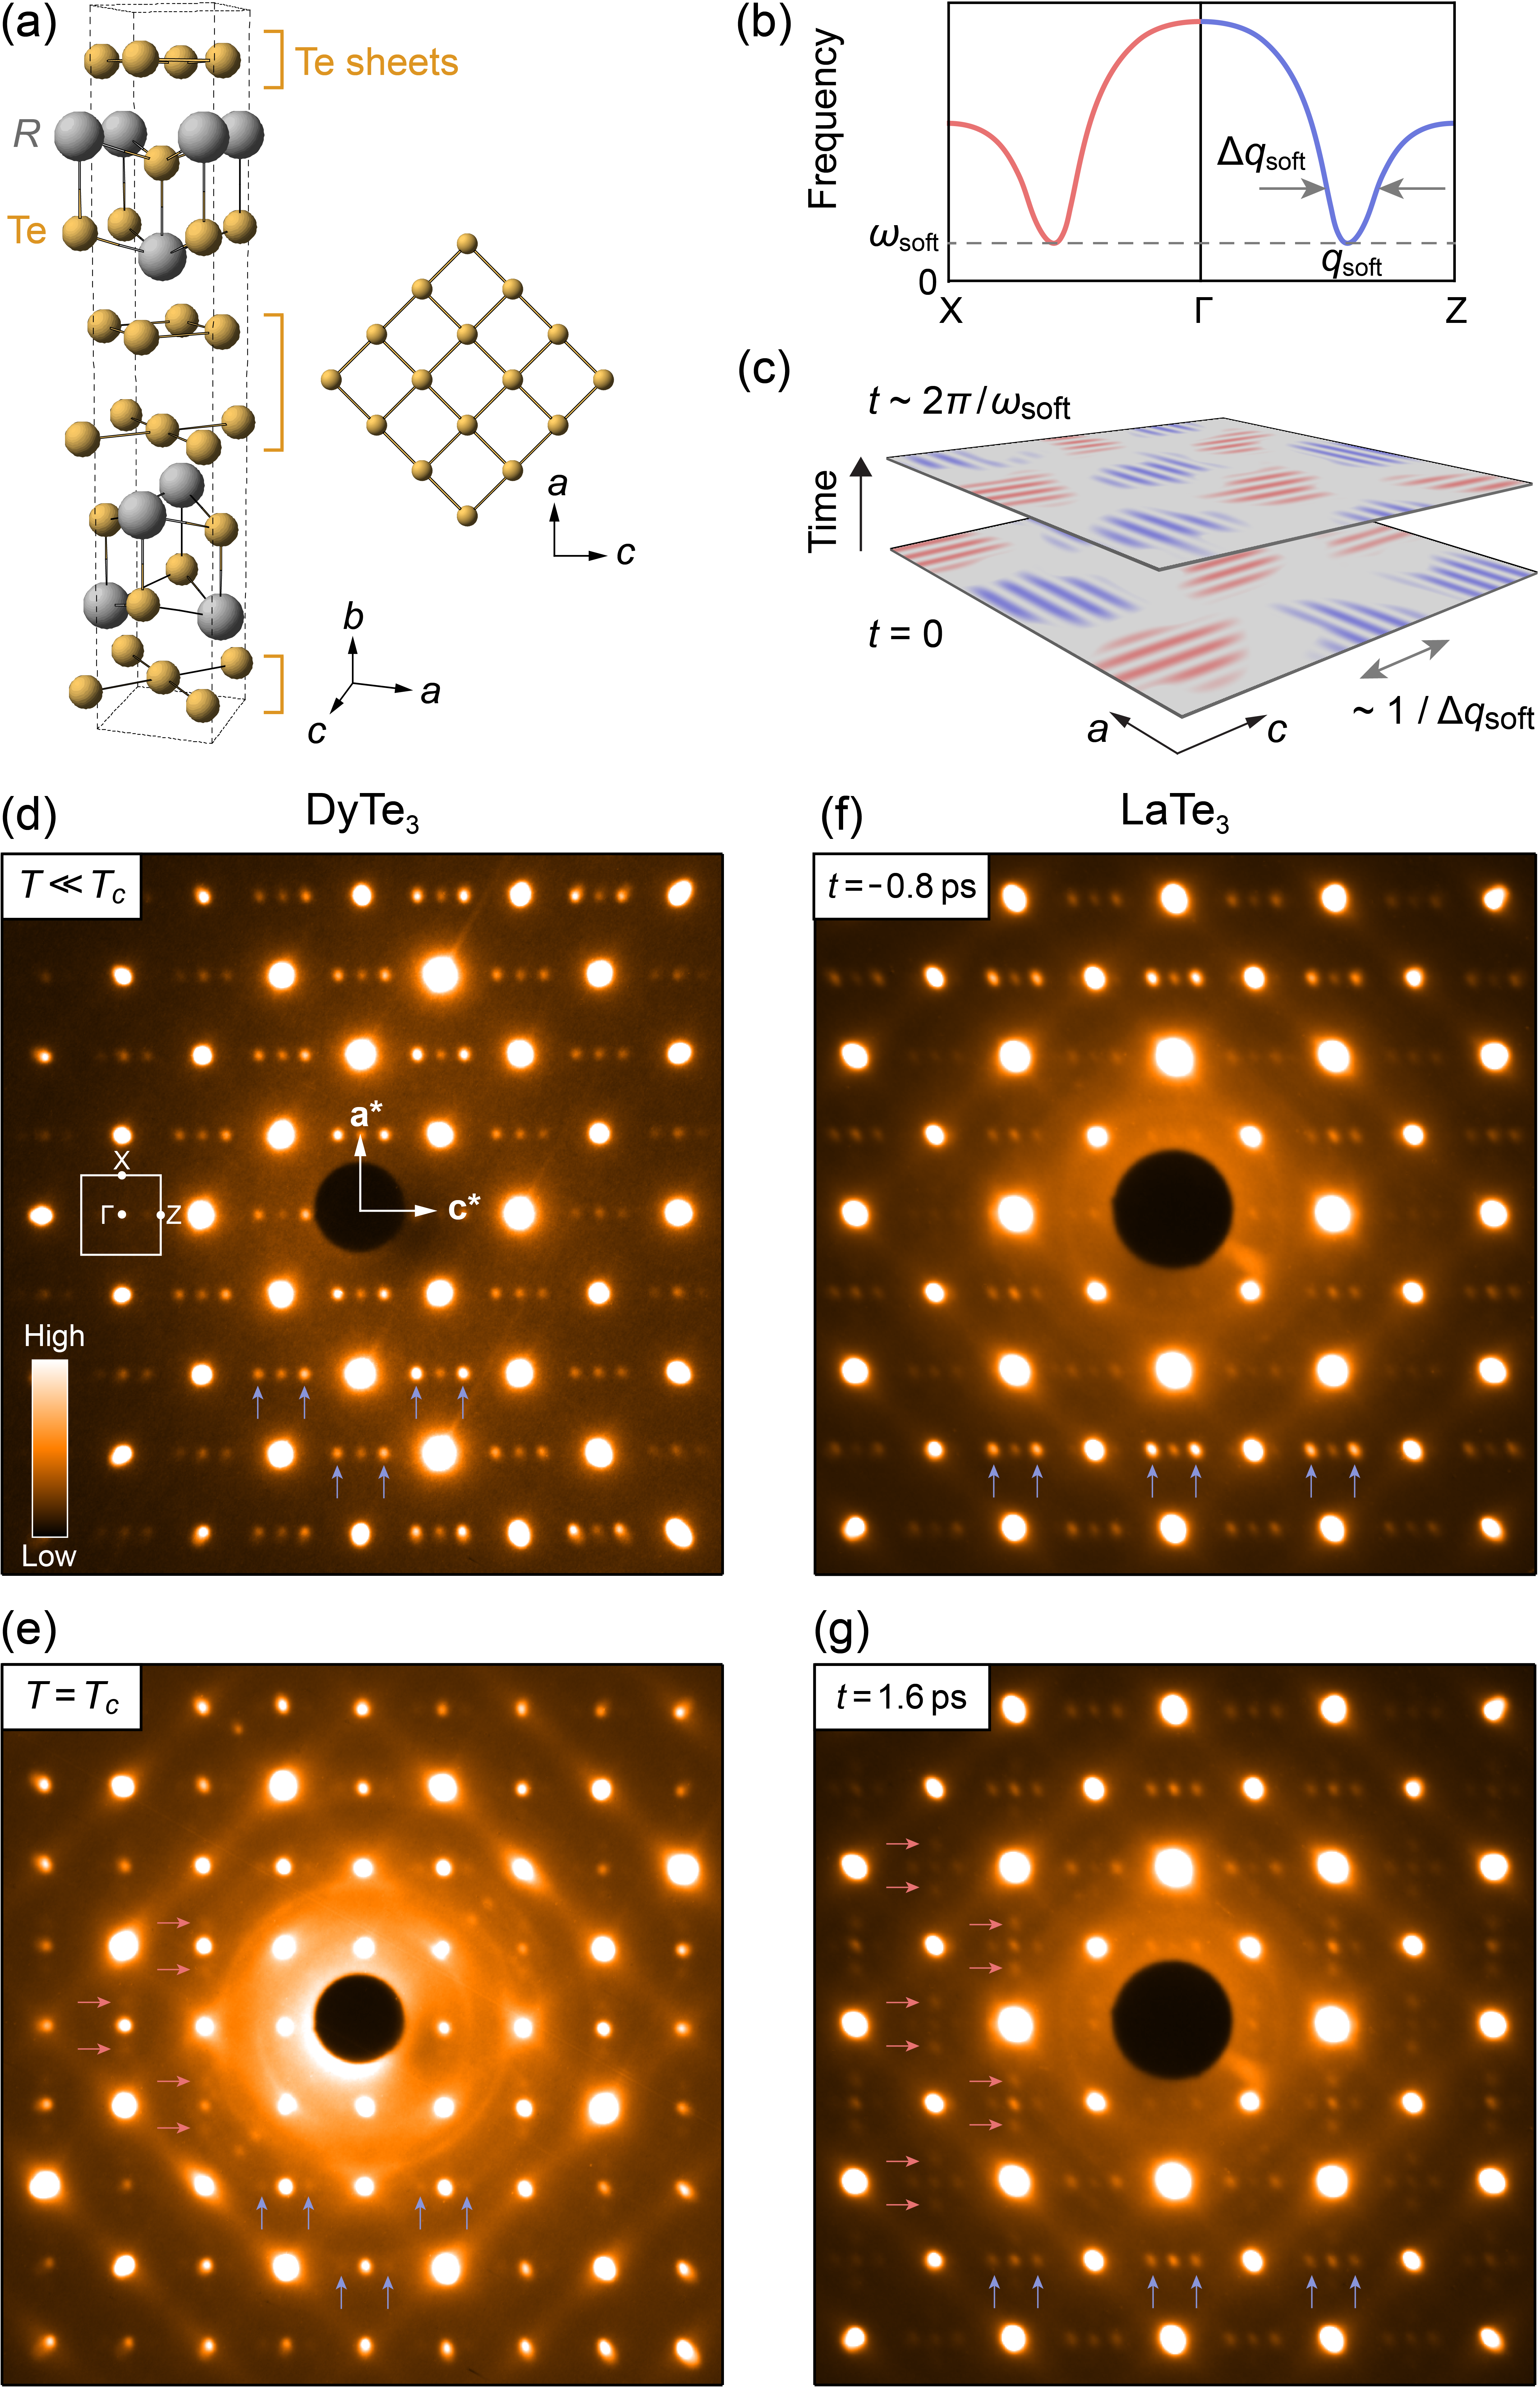
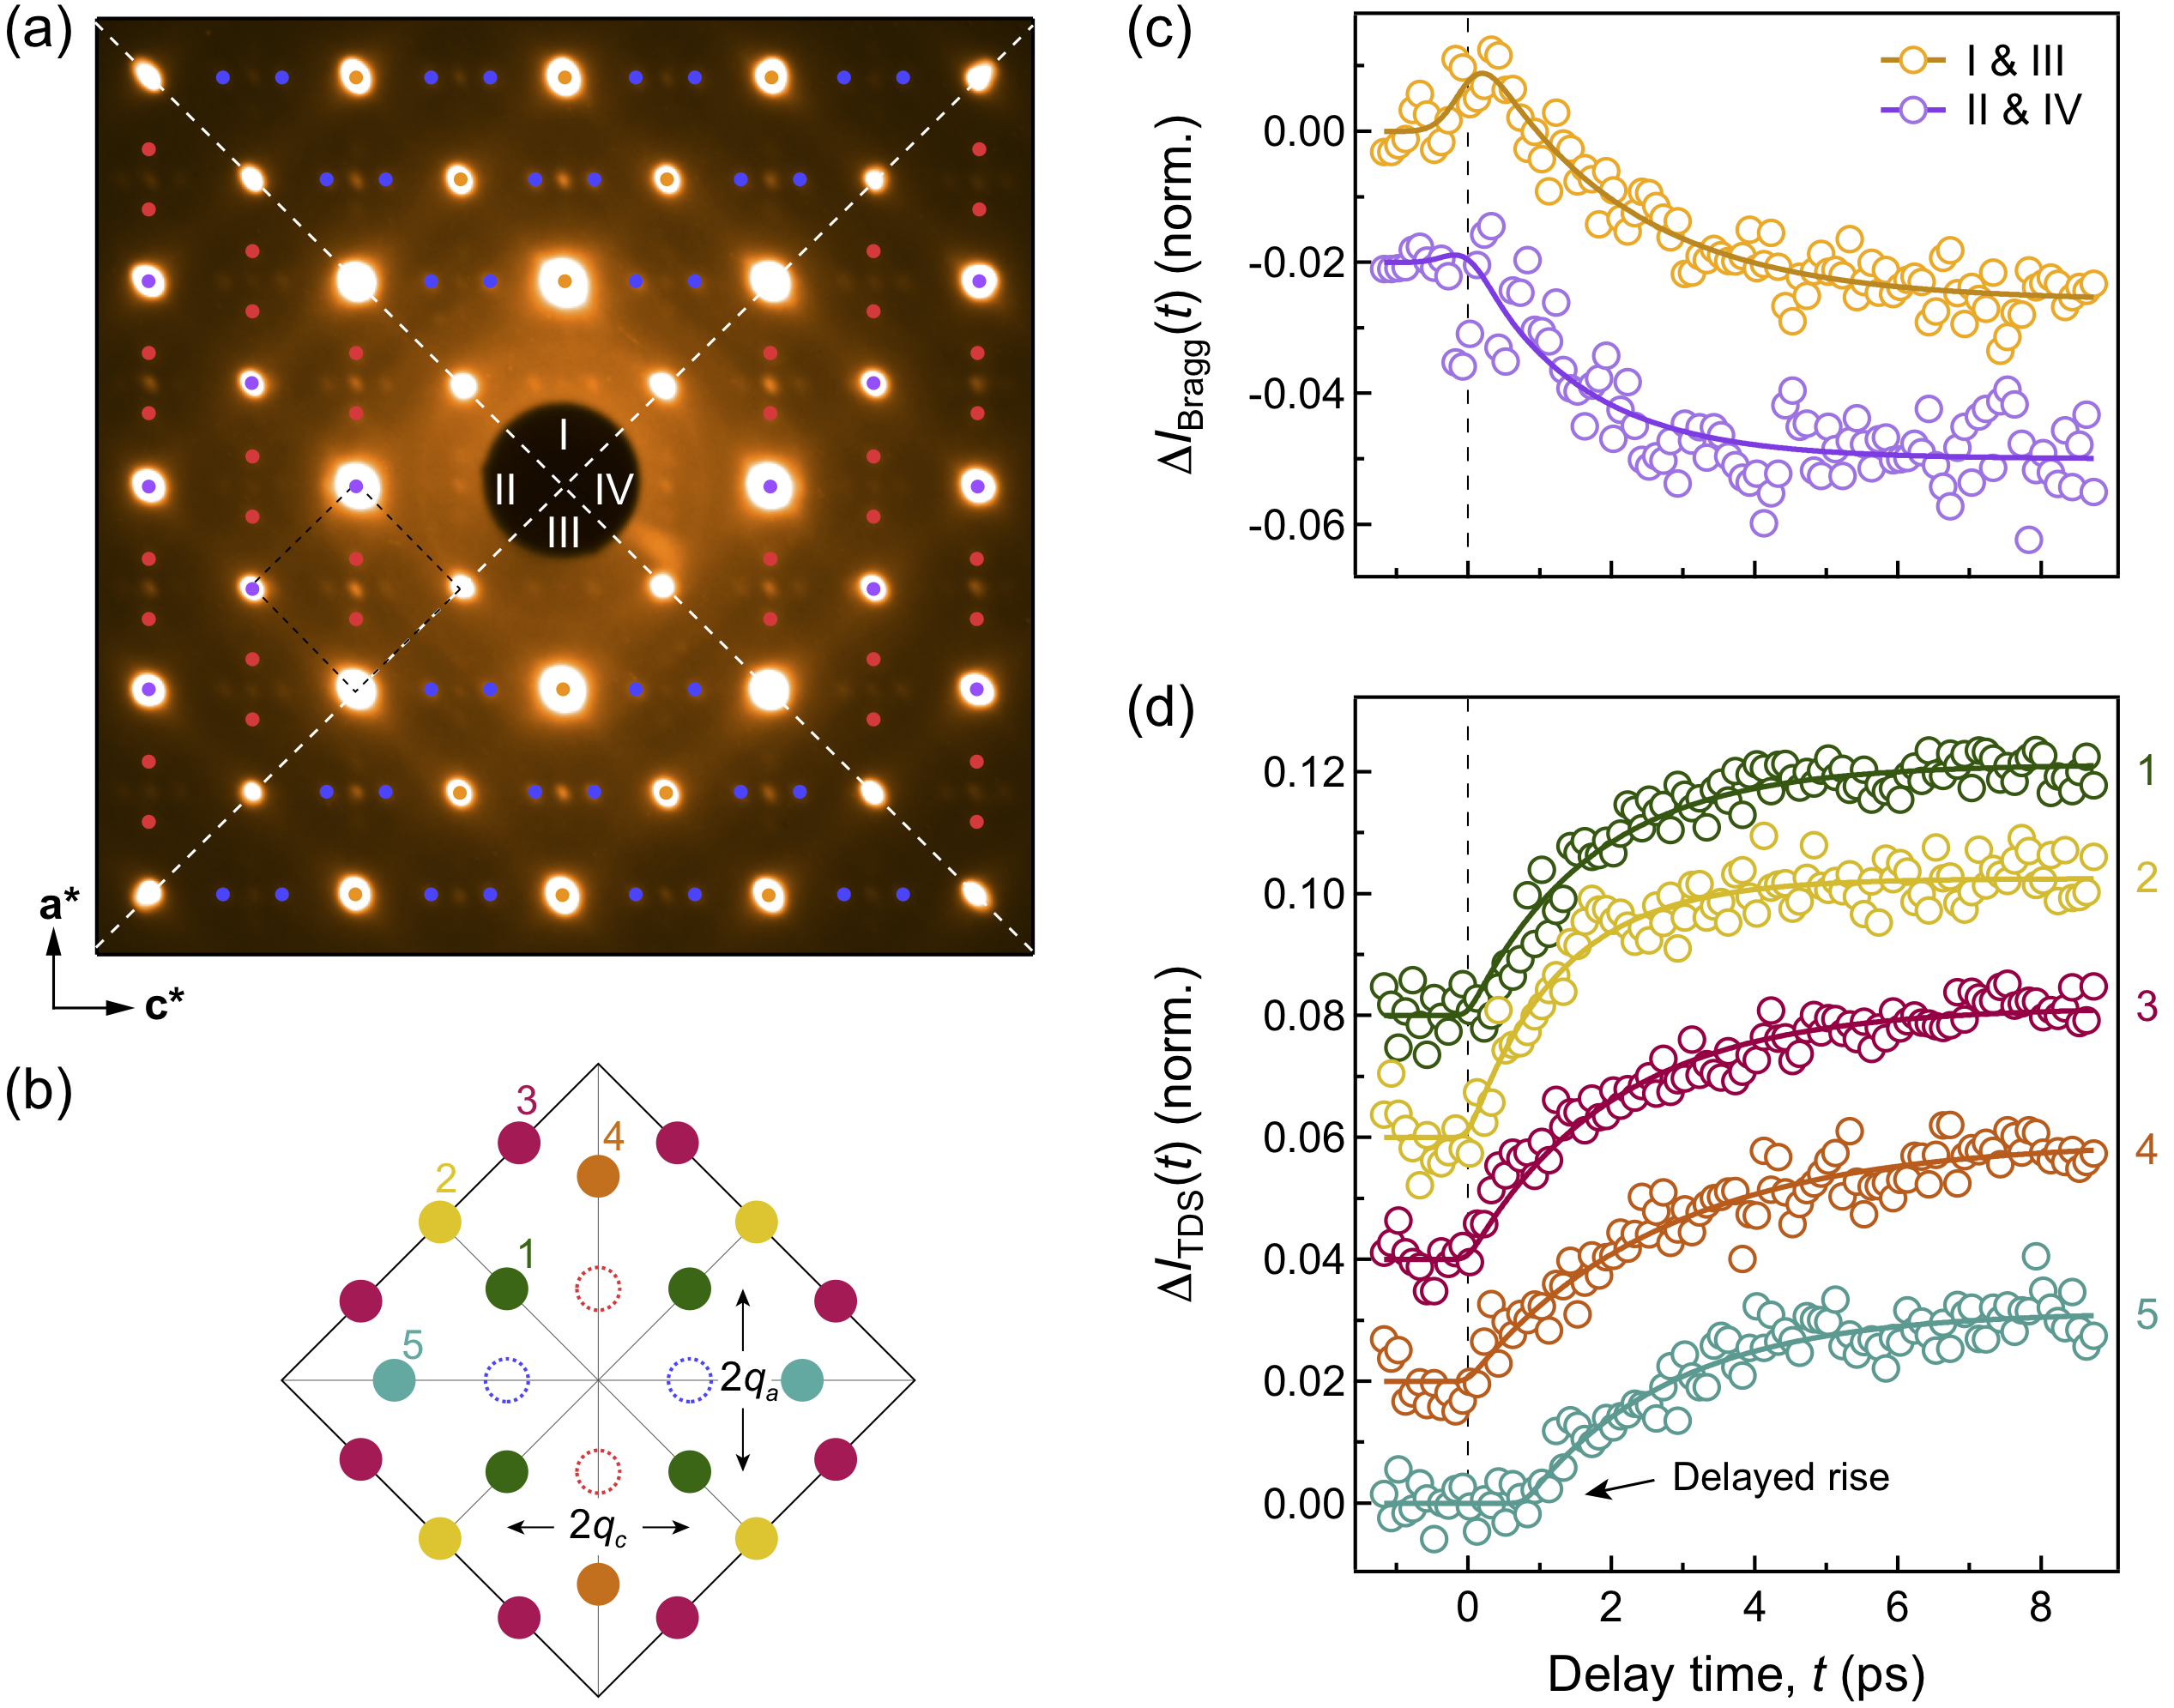
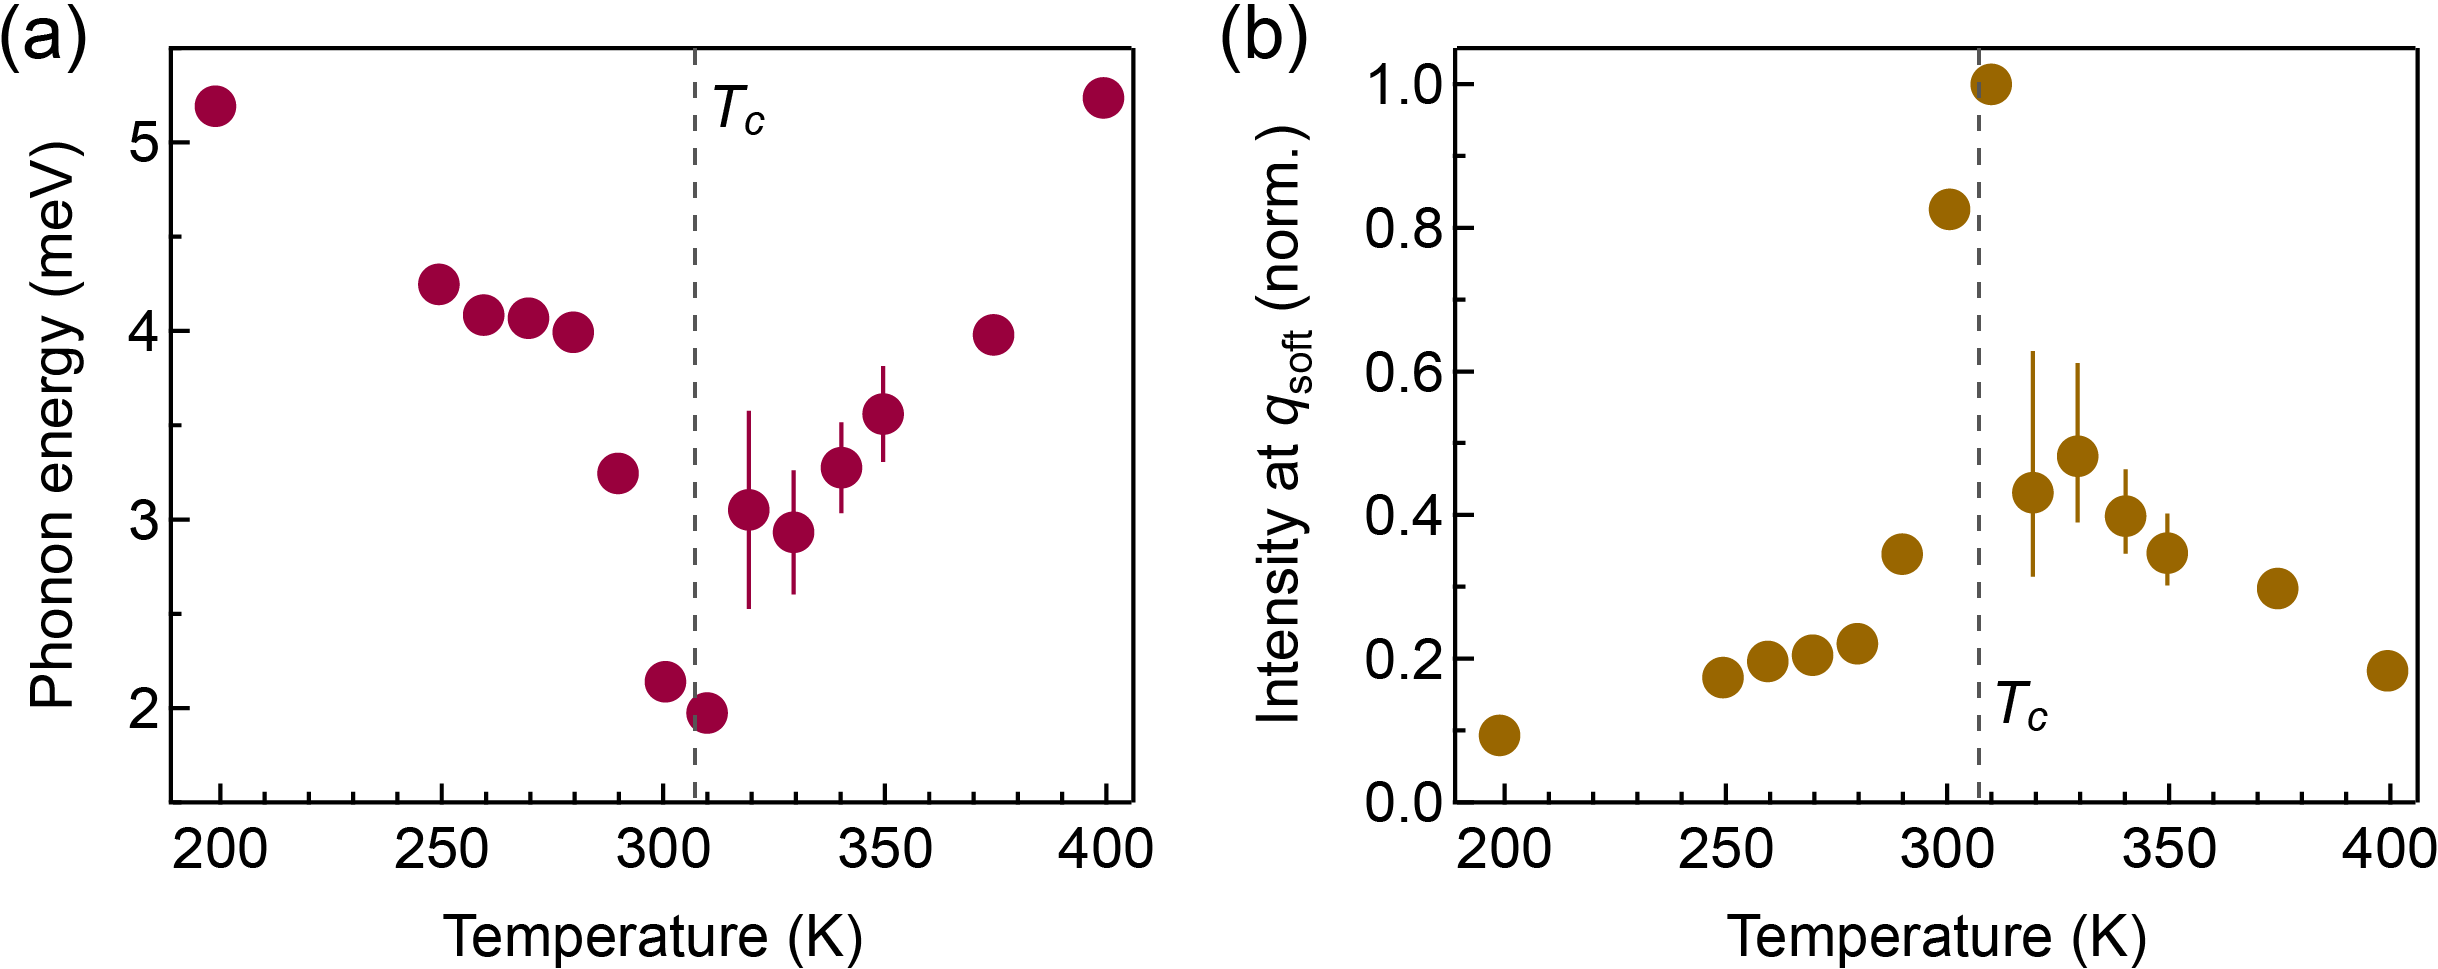
The charge density wave is hosted by the rare-earth tritelluride (Te3) family. All members possess a layered structure and the CDW instability is found in the nearly square-shaped Te sheets [Fig. 1(a)]. The quasi-two-dimensional nature of the crystals leads to a much reduced compared to the mean-field transition temperature. This gives rise to significant CDW fluctuations above , as evidenced by Raman spectroscopy [20] and inelastic X-ray scattering [21]. The near- symmetry of the Te sheets leads to two competing CDWs: The dominant one has a modulation along the -axis while the subdominant one along the orthogonal -axis [22]. Here, we focus on LaTe3 ( K) and DyTe3 ( K) [23, 22]. They share nearly identical properties except for the different transition temperatures [24]. Hence, under similar experimental conditions, we have access to CDW fluctuations in the critical regime near (DyTe3) as well as a state with only the dominant -axis CDW (LaTe3).
Figure 1(d)(e) shows the equilibrium electron diffraction patterns of DyTe3 in the plane, taken below and near (see [25] for experimental details). At 100 K, pairs of CDW satellite peaks are found along the -axis at a wavevector (blue arrows), but no satellite peaks are observed along the orthogonal -axis [26]. When the sample is heated to , the -axis peaks significantly weaken but remain visible [Fig. 1(e)]; in the meantime, diffuse spots arise along the -axis (red arrows). Notably, the diffraction pattern appears symmetric between the - and -axis, as highlighted by three observations: (i) brighter satellites are found along the -axis than along the -axis; vice versa for the peaks; (ii) the CDW wavevectors are similar, ; (iii) the satellite intensities are comparable for the two CDWs. Transverse atomic displacements associated with both CDWs account for the intensity pattern in (i) [25]. Observations (ii) and (iii) preclude the possibility of a long-range CDW along the -axis that is known to occur in DyTe3 at 68 K [21] because this low-temperature -axis peak has a markedly different wavevector and a much weaker diffraction intensity compared to its -axis counterpart [27, 4]. The symmetric appearance of the diffuse spots in Fig. 1(e) is a signature unique to the critical regime near . Below , such symmetry is broken by the long-range -axis CDW. At temperatures significantly exceeding , fluctuations are weak, rendering any diffuse scattering invisible under the background intensity.
We now turn to LaTe3 and study the behavior of the CDWs out of equilibrium. Figure 1(f)(g) show the electron diffraction patterns taken 0.8 ps before and 1.6 ps after the incidence of an 80-fs, 800-nm laser pulse. After photoexcitation, the long-range CDW order along the -axis is suppressed (blue arrows) while new peaks appear along the -axis (red arrows), whose intensity increases monotonically with pump laser fluence [4, 25]. Remarkably, the CDW superlattice spots in this transient snapshot of the photoexcited state are visually indistinguishable from those in the equilibrium diffraction pattern recorded at in DyTe3 [Fig. 1(e)(g)]. In particular, the transient CDW satellites along both axes share a similar intensity and wavevector, hinting at a restored symmetry between the two CDWs.
The similarity between Fig. 1(e) and 1(g) allows us to interpret the light-induced CDW state using an equilibrium picture close to . In momentum space, the diffuse satellite peaks are indicative of the population of transient soft phonons along the - and -axis [Fig. 1(b)]. In real space, this critical regime is characterized by short-range CDW patches in both directions [Fig. 1(c)], with the correlation length inversely proportional to the momentum width of the Kohn anomaly [25]. From inelastic X-ray measurements [21], the phonon energies at and are approximately 1 to 2 meV, corresponding to a fluctuating timescale of 2 to 4 ps for these CDW patches. A similar timescale is observed as the lifetime of the light-induced -axis CDW [Fig. S4(a)]. This energy-time correspondence suggests that the light-induced -axis CDW is indistinguishable from a soft phonon at the corresponding wavevector, confirming the intimate link between the photoexcited state and the critical regime near .
The comparison between the photoexcited and the critical state suggests that the photoinduced -axis CDW in LaTe3 does not have long-range order and remains fluctuating. While the statement can be rigorously proven by simple theoretical arguments [25], here we give an estimate of the finite correlation length of the -axis CDW. Based on the diffraction peak width [Fig. 1(g)], which is limited by instrumental resolution, the correlation length has a lower bound of nm, or 8 crystallographic unit cells (u.c.). Given the approximate CDW lifetime of 4 ps [Fig. S4(a)], the correlation length is at most nm (23 u.c.), where m/s is the speed of sound along the -axis [28]. This upper bound is a testament that each fluctuating patch cannot establish phase coherence with its neighbors at a speed faster than phonon propagation. Compared to the correlation length of the dominant -axis CDW in equilibrium, which is estimated to be at least 1.8 m within Te planes [22], the particularly small value of hence confirms the absence of long-range order along the -axis and suggests that the light-induced CDW consists entirely of short-range fluctuations.
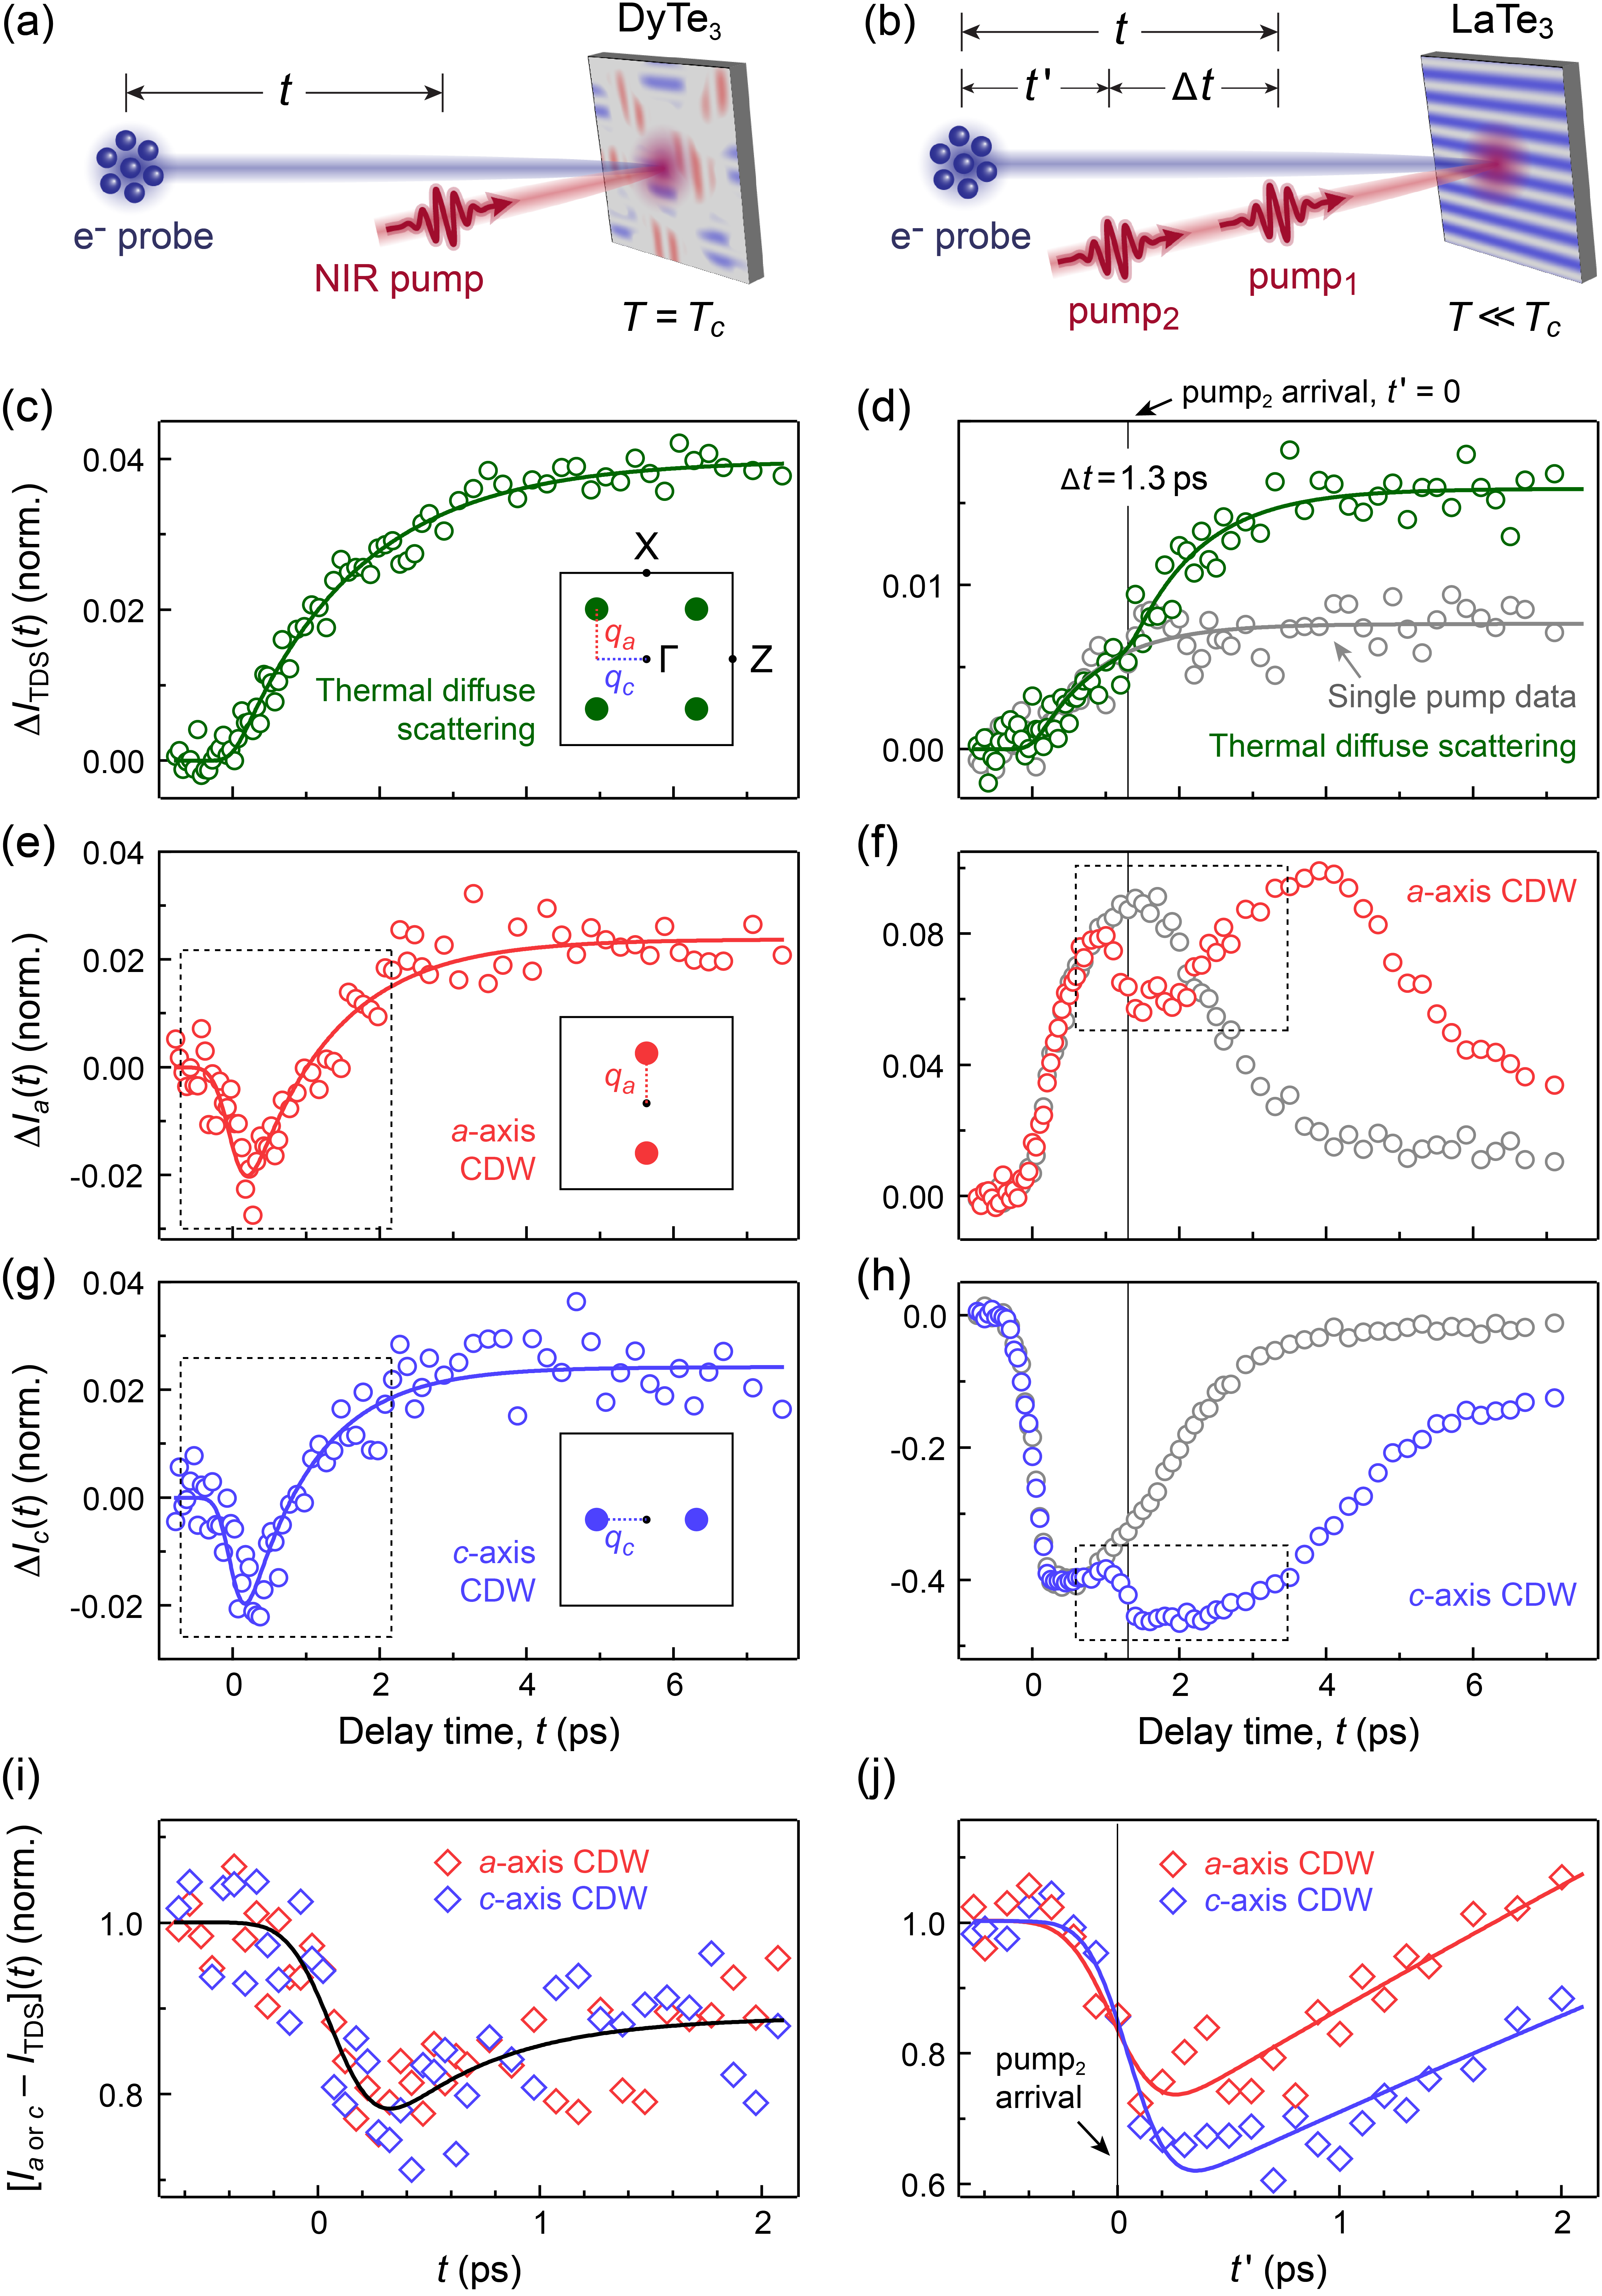
An almost square-symmetric diffraction pattern after photoexcitation and at equilibrium is suggestive of a close connection between the two states. To further elucidate their relationship, we investigate their response to an external perturbation. By comparing the respective dynamics of the order parameter fluctuations, we can gain some crucial insights into the similarities and differences between the two regimes. To this end, we apply a second laser pulse to LaTe3 right after the emergence of the -axis satellite peak and record the intensity evolution of the CDW fluctuations along both axes. As a reference, we also photoexcite DyTe3 at its CDW transition temperature, where fluctuations of both density waves abound.
We first examine the laser-induced response in DyTe3 at its [Fig. 2(a)]. After photoexcitation, the diffuse satellite spots display an initial dip in intensity followed by a fast recovery, a trend perfectly mirrored in both axes [Fig. 2(e) and (g)]. These dynamics are in stark contrast to diffuse scattering intensities at other momenta away from Bragg or CDW peaks, where only a single-exponential rise is observed [Fig. 2(c)]. The dip can be understood in two equivalent ways. From the phonon perspective, it represents a transient stiffening of the soft mode [29, 25]. As electrons are excited to high energy, there is a transient reduction in the electronic band occupation near the Fermi energy that interacts with the lattice ions. This reduction leads to an increase in the renormalized phonon frequency and hence a decrease in the phonon population, as suggested by the equipartition theorem. An alternative viewpoint is based on the classical description of phonons as atomic displacements in real space. In each frame diffracted from a single electron pulse, we capture a snapshot of the system, such as the one depicted in Fig. 1(c). The dip hence indicates a smaller lattice distortion amplitude in the fluctuating CDW patches, averaged over space and over all snapshots at the same pump-probe delay. The second perspective naturally connects the photoinduced melting of fluctuating CDWs to the melting of a long-range CDW. Locally, there is minimal distinction between the two processes and both occur over ps, a timescale dictated by the phonon period associated with the CDW distortion [30, 31]. In Fig. 2(e)(g), we observe that the intensities quickly rise after the dip, indicating an increased phonon population from laser-induced heating. After subtracting the thermal diffuse contribution, the dip only partially recovers [Fig. 2(i)], suggesting an elevated lattice temperature above , where the Kohn anomaly becomes less pronounced.
Next, we study the dynamics in the photoexcited state of LaTe3. As illustrated in Fig. 2(b), we use the first laser pulse to bring the material into a nonequilibrium state, where we have observed a symmetric appearance of diffuse satellite spots along both - and -axes. We then apply a second pulse to perturb this transient state and look at the response of the two competing CDW fluctuations. In the experiment, the two pump pulses share the same incident fluence. To assess the absorbed fluence, we note that the maximum value attained in thermal diffuse scattering doubles after the second pulse [Fig. 2(d)]. This observation affirms that energy absorption is minimally affected by the presence of excited carriers after the first pulse. We now move on to analyze the CDW peaks, shown in Fig. 2(f) and (h). Unlike their distinct behavior upon the initial photoexcitation, the intensity evolution of the peaks along both axes share almost identical trends after the second pulse. For a direct comparison between the two orders, we zoom in to their dynamics right after the second pulse and plot them together in Fig. 2(j), where intensities from thermal diffuse scattering have been subtracted using the same procedure applied to DyTe3. Similar to the fluctuating CDWs in DyTe3 near , the two diffuse peaks in LaTe3 feature a transient reduction in the fluctuation amplitude, followed by a recovery that lasts for more than 2 ps. Unlike DyTe3, the satellite intensities in LaTe3 are fully recovered compared to their values just before the second pulse, suggesting the nonthermal nature of these density wave fluctuations.
The similarities between the excited state in LaTe3 and the critical state in DyTe3 – both in their diffraction snapshots (Fig. 1) and in their photoinduced dynamics (Fig. 2) – suggest that the light-induced CDW is a special manifestation of critical fluctuations. While the equilibrium fluctuations near are thermal and follow the scaling relations prescribed by the theory of renormalization group [32], the light-induced fluctuations may not conform to a thermodynamic distribution [33]. To understand how the strength of equilibrium fluctuations affect the appearance of the light-induced CDW, we developed a time-dependent Ginzburg-Landau formalism within the Gaussian approximation (see [25] for derivation). This approach gives a nonperturbative solution to the light-induced dynamics, yielding quantities that have a one-to-one correspondence to the observables in our time-resolved diffraction experiments. Unlike -temperature models [34], here we do not need to artificially assign a temperature to each degree of freedom in the system.
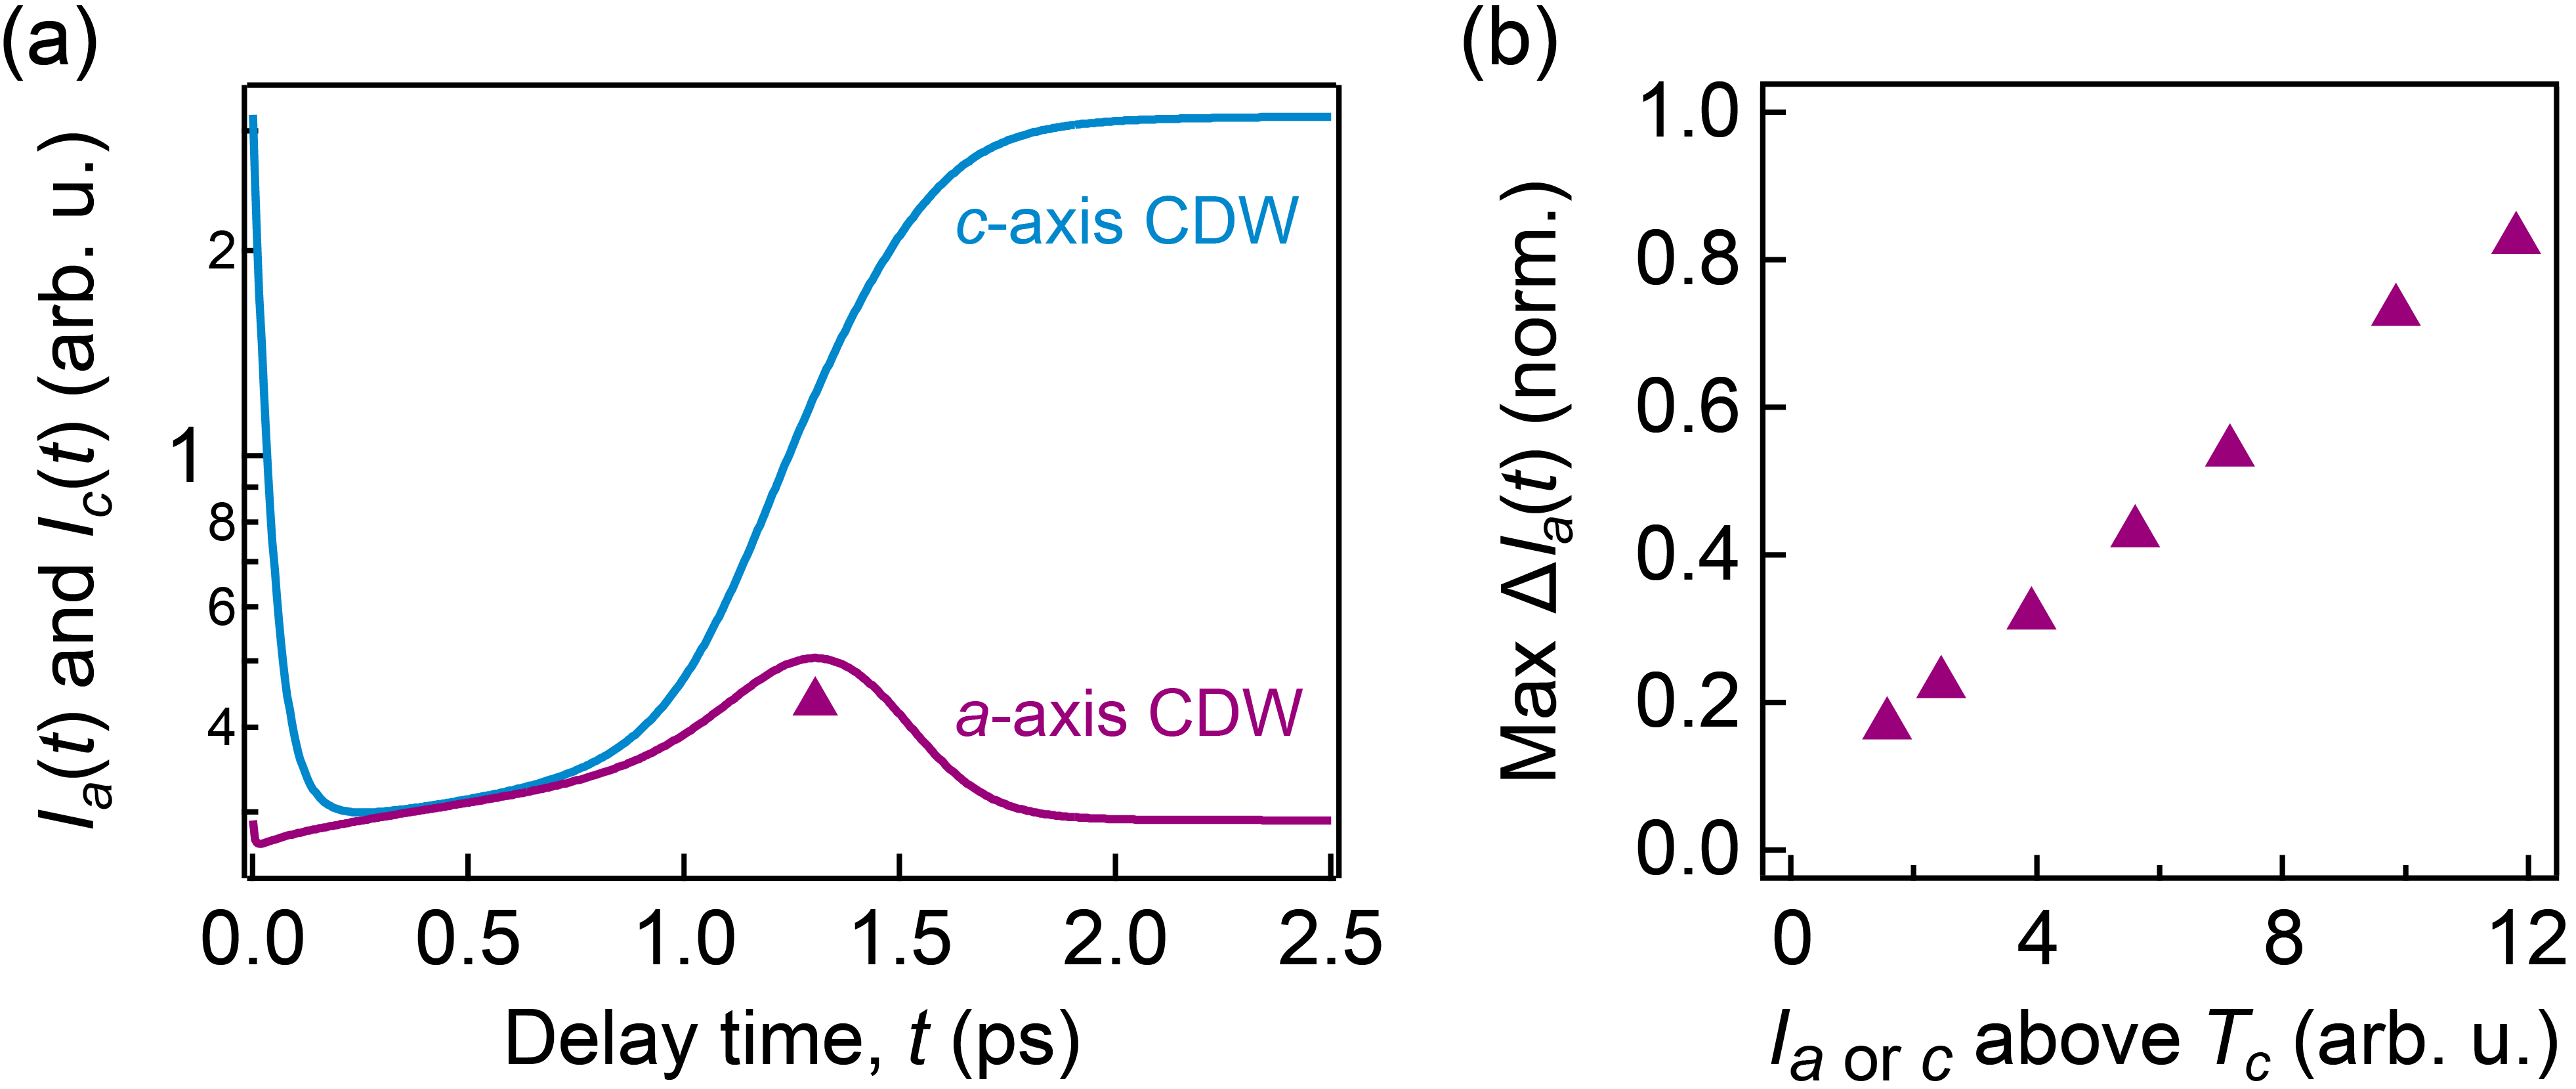
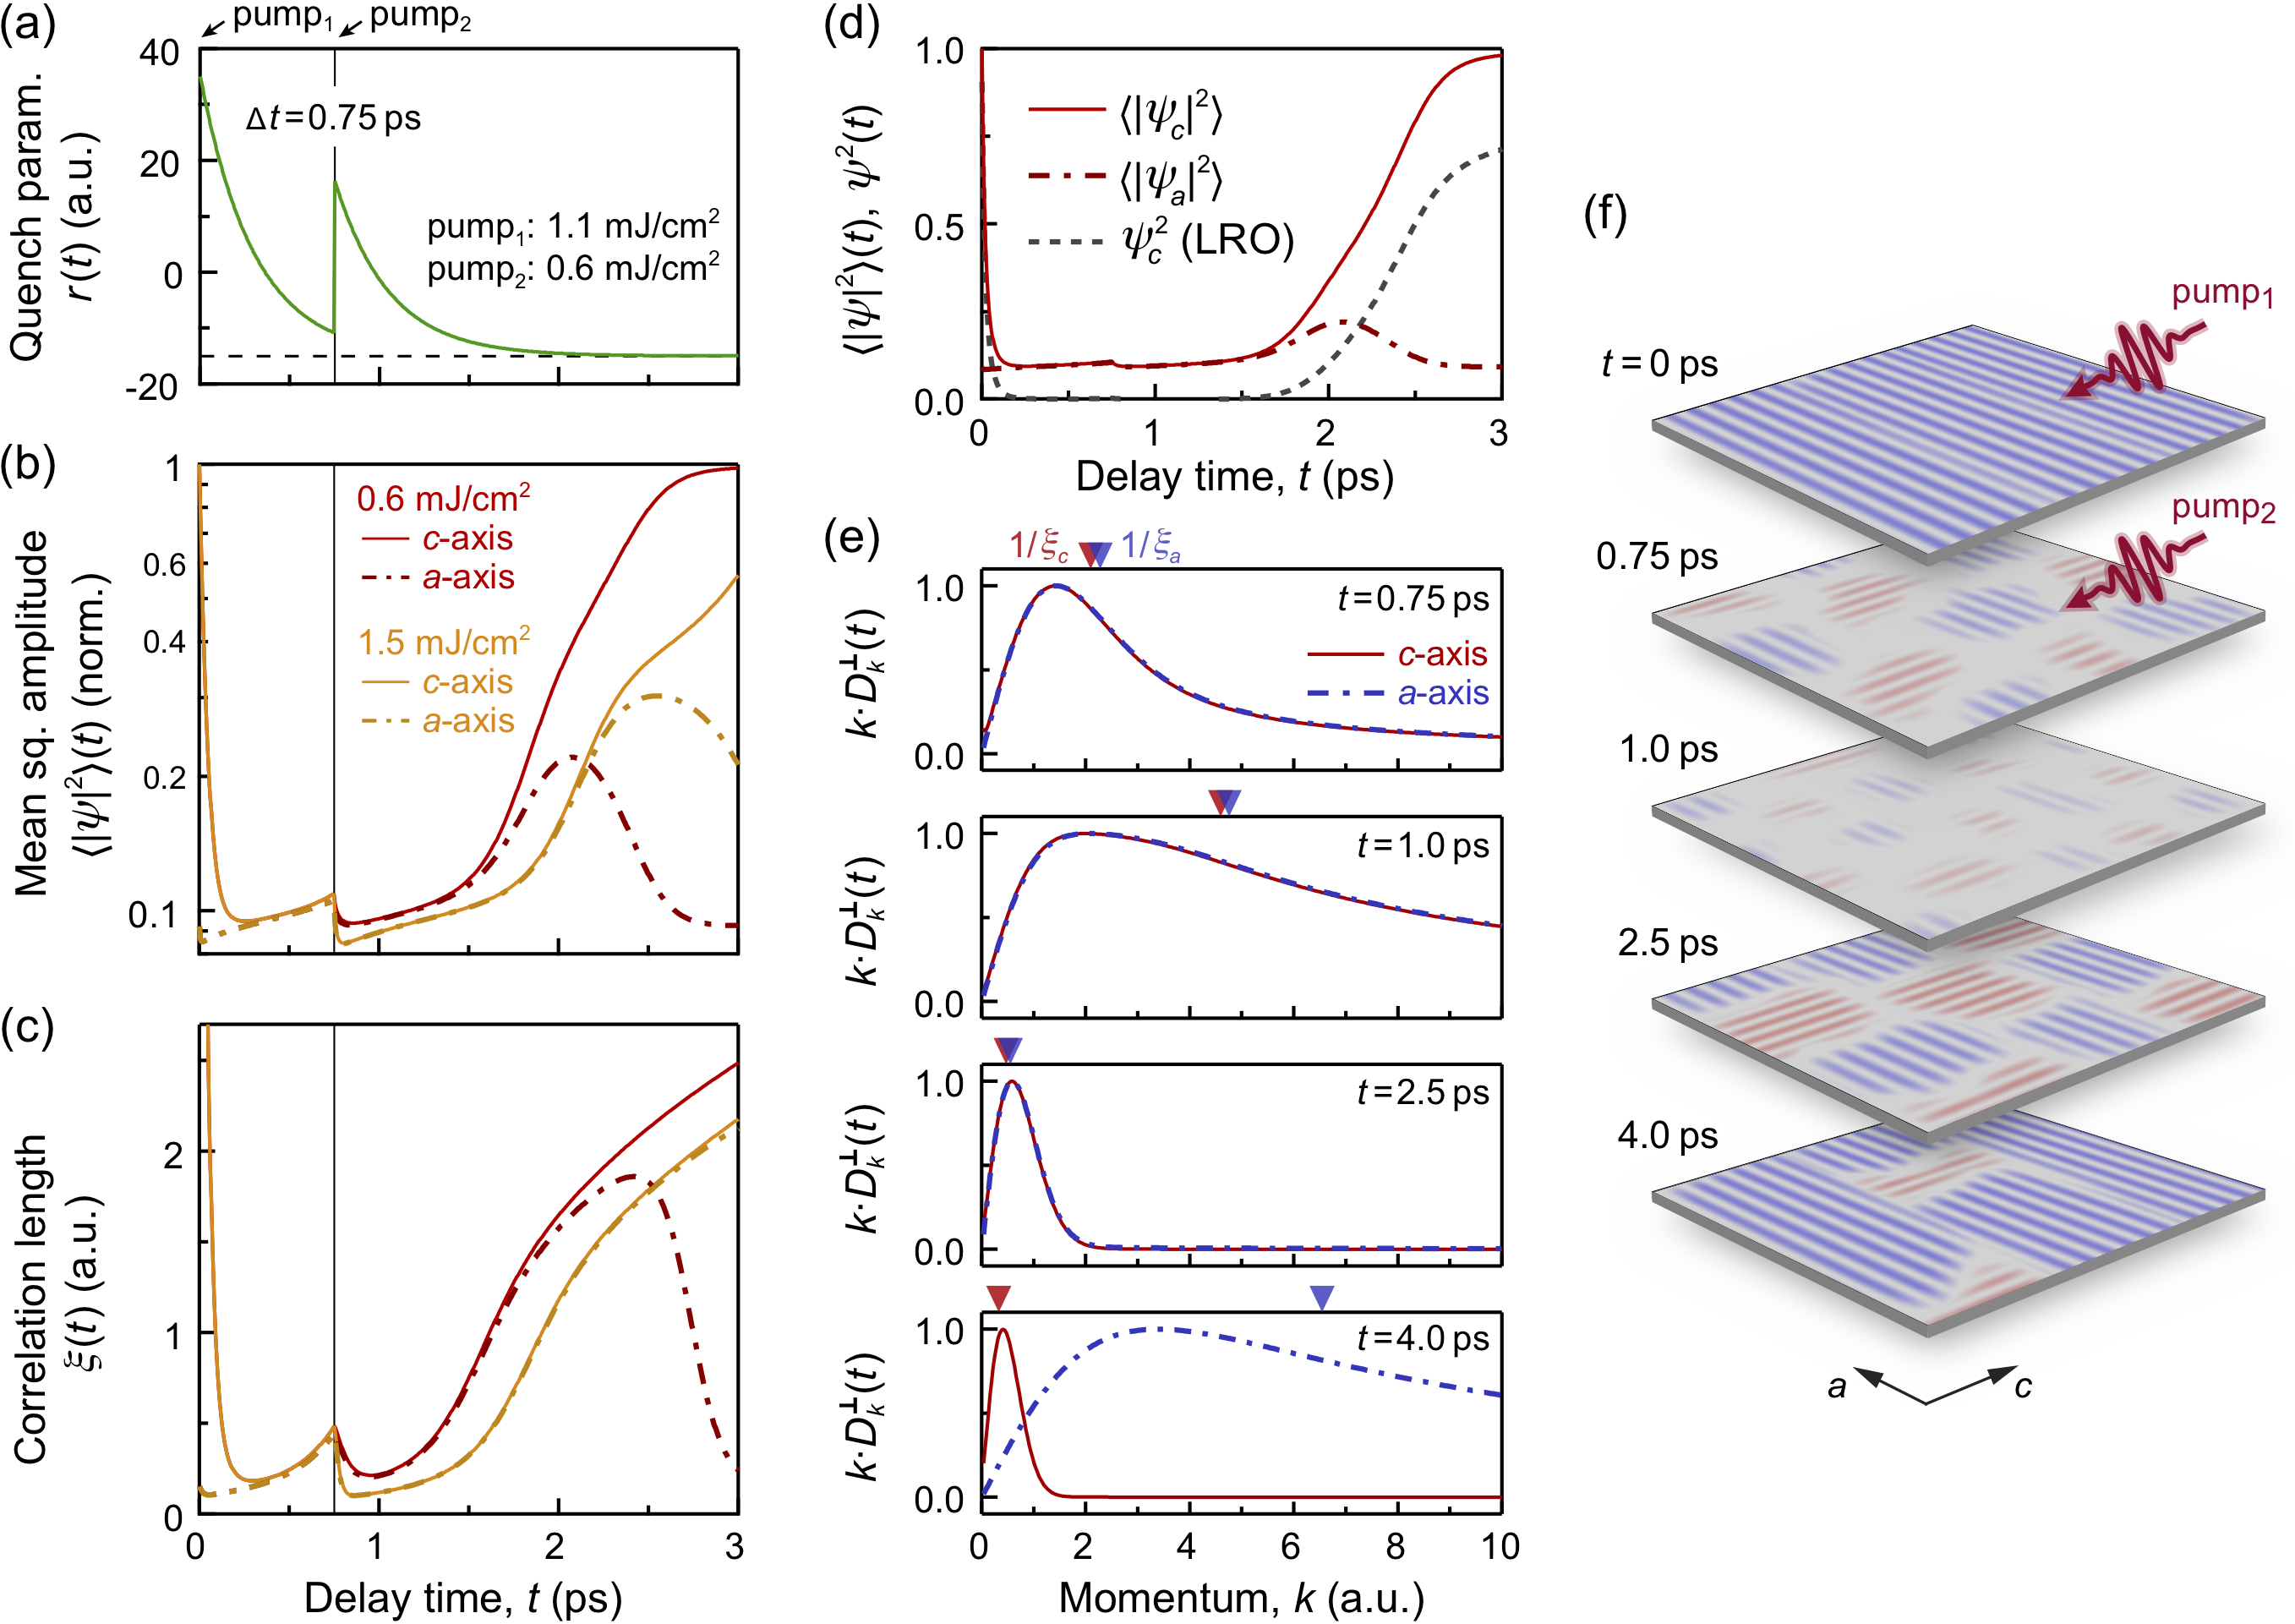
To assess the validity of the model, we first calculate intensity evolution of - and -axis CDW peaks after photoexcitation [Fig. 3(a)]. The simulated trends successfully reproduce the experimental observations (Fig. S4). The transient enhancement of intensity along the -axis is solely the result of CDW fluctuations without long-range order [25]. In Fig. 3(b), as we reduce the order parameter stiffness to increase the amplitude of equilibrium fluctuations above , the strength of the transient CDW order also increases under identical photoexcitation conditions. This positive correlation suggests that strong fluctuations in equilibrium constitute an important factor for observing light-induced ordering phenomena out of equilibrium.
Despite the similarities between the light-induced CDW and the critical fluctuations, there exist important differences [25]. For example, the transient lattice temperature of LaTe3 stays far below its equilibrium , and there is no change in the in-plane lattice anisotropy after photoexcitation, distinct from the evolution of and lattice parameters across [4, 22]. Importantly, the light-induced CDW has a finite correlation length for all time delays but at the critical point in equilibrium, correlation length diverges with fluctuations occurring at all length scales. Hence, strictly speaking, the photoexcited state is not truly critical as described in a thermodynamic transition.
By leveraging the symmetry between two competing CDWs in Te3, we have elicited the correspondence between a photoinduced order and critical fluctuations in equilibrium. The parallels provide a nonthermal pathway to access hidden symmetries of a system even if is unattainable under equilibrium condition. The similarities also hint at the existence of universal scaling laws that govern the dynamics of a highly nonequilibrium system [33], which have been detected in scattering experiments with high momentum resolution and an extended time delay [35, 36, 37]. Furthermore, our results offer a generic mechanism for the creation of photoinduced states, which can emerge as order parameter fluctuations in the absence of long-range order. This insight suggests that one should look for material classes that exhibit strong order parameter fluctuations in equilibrium in order to look for “hidden” states out of equilibrium. Experimental signatures for such strong fluctuations depend on the order parameter, ranging from diffuse peaks in a charge or spin density wave system to Nernst effect in a superconductor [25]. We expect the connection between equilibrium fluctuations and out-of-equilibrium ordering to hold regardless of microscopic details, providing a guiding principle in our search for other light-induced states.
Acknowledgements.
We thank Mariano Trigo and Yu He for helpful discussions. This work was mainly funded by the U.S. Department of Energy, BES DMSE (data taking and analysis) and the Gordon and Betty Moore Foundation’s EPiQS Initiative grant GBMF9459 (modeling and manuscript writing). We acknowledge support from the U.S. Department of Energy BES SUF Division Accelerator & Detector R&D program, the LCLS Facility, and SLAC under contract No.’s DE-AC02-05-CH11231 and DE-AC02-76SF00515 (MeV UED at SLAC). Sample growth and characterization work at Stanford was supported by the U.S. Department of Energy, Office of Basic Energy Sciences, under contract number DEAC02-76SF00515. A.Z. acknowledges support from the Miller Institute for Basic Research in Science. This research was partly supported by the Army Research Office through Grant No. W911NF1810316, and the Gordon and Betty Moore Foundation EPiQS Initiative through grant GBMF9643 to P.J.-H. (sample preparation and characterization). This work made use of the Materials Research Science and Engineering Center Shared Experimental Facilities supported by the National Science Foundation (NSF) (Grant No. DMR-0819762). This work was performed in part at the Harvard University Center for Nanoscale Systems (CNS), a member of the National Nanotechnology Coordinated Infrastructure Network (NNCI), which is supported by the National Science Foundation under NSF ECCS Award No. 1541959. P.E.D. and E.D. were supported by Harvard-MIT CUA, AFOSR-MURI: Photonic Quantum Matter award FA95501610323, Harvard Quantum Initiative.References
- Kaiser [2017] S. Kaiser, Light-induced superconductivity in high- cuprates, Phys. Scr. 92, 103001 (2017).
- Mitrano et al. [2016] M. Mitrano, A. Cantaluppi, D. Nicoletti, S. Kaiser, A. Perucchi, S. Lupi, P. Di Pietro, D. Pontiroli, M. Riccò, S. R. Clark, D. Jaksch, and A. Cavalleri, Possible light-induced superconductivity in K3C60 at high temperature, Nature 530, 461 (2016).
- Buzzi et al. [2020] M. Buzzi, D. Nicoletti, M. Fechner, N. Tancogne-Dejean, M. A. Sentef, A. Georges, T. Biesner, E. Uykur, M. Dressel, A. Henderson, T. Siegrist, J. A. Schlueter, K. Miyagawa, K. Kanoda, M.-S. Nam, A. Ardavan, J. Coulthard, J. Tindall, F. Schlawin, D. Jaksch, and A. Cavalleri, Photomolecular high-temperature superconductivity, Phys. Rev. X 10, 031028 (2020).
- Kogar et al. [2020] A. Kogar, A. Zong, P. E. Dolgirev, X. Shen, J. Straquadine, Y.-Q. Bie, X. Wang, T. Rohwer, I.-C. Tung, Y. Yang, R. Li, J. Yang, S. Weathersby, S. Park, M. E. Kozina, E. J. Sie, H. Wen, P. Jarillo-Herrero, I. R. Fisher, X. Wang, and N. Gedik, Light-induced charge density wave in LaTe3, Nat. Phys. 16, 159 (2020).
- Zhou et al. [2021] F. Zhou, J. Williams, S. Sun, C. D. Malliakas, M. G. Kanatzidis, A. F. Kemper, and C.-Y. Ruan, Nonequilibrium dynamics of spontaneous symmetry breaking into a hidden state of charge-density wave, Nat. Commun. 12, 566 (2021).
- Han et al. [2015] T.-R. T. Han, F. Zhou, C. D. Malliakas, P. M. Duxbury, S. D. Mahanti, M. G. Kanatzidis, and C.-Y. Ruan, Exploration of metastability and hidden phases in correlated electron crystals visualized by femtosecond optical doping and electron crystallography, Sci. Adv. 1, e1400173 (2015).
- Kim et al. [2012] K. W. Kim, A. Pashkin, H. Schäfer, M. Beyer, M. Porer, T. Wolf, C. Bernhard, J. Demsar, R. Huber, and A. Leitenstorfer, Ultrafast transient generation of spin-density-wave order in the normal state of BaFe2As2 driven by coherent lattice vibrations, Nat. Mater. 11, 497 (2012).
- Li et al. [2019] X. Li, T. Qiu, J. Zhang, E. Baldini, J. Lu, A. M. Rappe, and K. A. Nelson, Terahertz field-induced ferroelectricity in quantum paraelectric SrTiO3, Science 364, 1079 (2019).
- Nova et al. [2019] T. F. Nova, A. S. Disa, M. Fechner, and A. Cavalleri, Metastable ferroelectricity in optically strained SrTiO3, Science 364, 1075 (2019).
- Fausti et al. [2011] D. Fausti, R. I. Tobey, N. Dean, S. Kaiser, A. Dienst, M. C. Hoffmann, S. Pyon, T. Takayama, H. Takagi, and A. Cavalleri, Light-induced superconductivity in a stripe-ordered cuprate, Science 331, 189 (2011).
- Kaiser et al. [2014] S. Kaiser, C. R. Hunt, D. Nicoletti, W. Hu, I. Gierz, H. Y. Liu, M. Le Tacon, T. Loew, D. Haug, B. Keimer, and A. Cavalleri, Optically induced coherent transport far above in underdoped YBa2Cu3O6+δ, Phys. Rev. B 89, 184516 (2014).
- Hu et al. [2014a] W. Hu, S. Kaiser, D. Nicoletti, C. R. Hunt, I. Gierz, M. C. Hoffmann, M. Le Tacon, T. Loew, B. Keimer, and A. Cavalleri, Optically enhanced coherent transport in YBa2Cu3O6.5 by ultrafast redistribution of interlayer coupling, Nat. Mater. 13, 705 (2014a).
- Nicoletti et al. [2014] D. Nicoletti, E. Casandruc, Y. Laplace, V. Khanna, C. R. Hunt, S. Kaiser, S. S. Dhesi, G. D. Gu, J. P. Hill, and A. Cavalleri, Optically induced superconductivity in striped La2-xBaxCuO4 by polarization-selective excitation in the near infrared, Phys. Rev. B 90, 100503 (2014).
- Borroni et al. [2017] S. Borroni, E. Baldini, V. M. Katukuri, A. Mann, K. Parlinski, D. Legut, C. Arrell, F. van Mourik, J. Teyssier, A. Kozlowski, P. Piekarz, O. V. Yazyev, A. M. Oleś, J. Lorenzana, and F. Carbone, Coherent generation of symmetry-forbidden phonons by light-induced electron-phonon interactions in magnetite, Phys. Rev. B 96, 104308 (2017).
- Emery and Kivelson [1995] V. J. Emery and S. A. Kivelson, Importance of phase fluctuations in superconductors with small superfluid density, Nature 374, 434 (1995).
- Nam et al. [2007] M.-S. Nam, A. Ardavan, S. J. Blundell, and J. A. Schlueter, Fluctuating superconductivity in organic molecular metals close to the Mott transition, Nature 449, 584 (2007).
- Kagawa et al. [2009] F. Kagawa, K. Miyagawa, and K. Kanoda, Magnetic Mott criticality in a -type organic salt probed by NMR, Nat. Phys. 5, 880 (2009).
- Müller and Burkard [1979] K. A. Müller and H. Burkard, SrTiO3: An intrinsic quantum paraelectric below 4 K, Phys. Rev. B 19, 3593 (1979).
- Ru [2008] N. Ru, Charge Density Wave Formation in Rare-earth Tellurides, Ph.D. thesis, Stanford University, Stanford (2008).
- Eiter et al. [2013] H.-M. Eiter, M. Lavagnini, R. Hackl, E. A. Nowadnick, A. F. Kemper, T. P. Devereaux, J.-H. Chu, J. G. Analytis, I. R. Fisher, and L. Degiorgi, Alternative route to charge density wave formation in multiband systems, Proc. Natl. Acad. Sci. U.S.A. 110, 64 (2013).
- Maschek et al. [2018] M. Maschek, D. A. Zocco, S. Rosenkranz, R. Heid, A. H. Said, A. Alatas, P. Walmsley, I. R. Fisher, and F. Weber, Competing soft phonon modes at the charge-density-wave transitions in DyTe3, Phys. Rev. B 98, 094304 (2018).
- Ru et al. [2008] N. Ru, C. L. Condron, G. Y. Margulis, K. Y. Shin, J. Laverock, S. B. Dugdale, M. F. Toney, and I. R. Fisher, Effect of chemical pressure on the charge density wave transition in rare-earth tritellurides Te3, Phys. Rev. B 77, 035114 (2008).
- Hu et al. [2014b] B. F. Hu, B. Cheng, R. H. Yuan, T. Dong, and N. L. Wang, Coexistence and competition of multiple charge-density-wave orders in rare-earth tritellurides, Phys. Rev. B 90, 085105 (2014b).
- Note [1] Unlike LaTe3 that only develops a unidirectional CDW under ambient pressure, there are two CDW transitions in DyTe3 [19]. Starting from its normal metallic state, DyTe3 first develops a unidirectional CDW at ; the second transition into a bidirectional CDW state occurs at a lower temperature . Here, we are only concerned with the high-temperature transition and we denote by for brevity.
- [25] See the Supplemental Material for more details.
- Note [2] The image was taken above K for DyTe3 [21].
- Straquadine et al. [2019] J. A. W. Straquadine, F. Weber, S. Rosenkranz, A. H. Said, and I. R. Fisher, Suppression of charge density wave order by disorder in Pd-intercalated ErTe3, Phys. Rev. B 99, 235138 (2019).
- Note [3] The speed of sound is deduced from the phonon dispersion in DyTe3 calculated by density functional perturbation theory and verified by inelastic X-ray scattering [21]. The speed of sound associated with the phason excitation may be an alternative choice for this correlation length estimate. The phason dispersion is unavailable for Te3 but we take note of values in other incommensurate CDWs. The phason speed ranges from m/s in 1-TaS2 [38] to m/s in K0.3MoO3 [39], hence not changing the conclusion that the largest possible correlation length of the transient CDW in LaTe3 is still orders of magnitude smaller compared to its dominant CDW in equilibrium.
- Otto et al. [2021] M. R. Otto, J.-H. Pöhls, L. P. René de Cotret, M. J. Stern, M. Sutton, and B. J. Siwick, Mechanisms of electron-phonon coupling unraveled in momentum and time: The case of soft phonons in TiSe2, Sci. Adv. 7, eabf2810 (2021).
- Hellmann et al. [2012] S. Hellmann, T. Rohwer, M. Kalläne, K. Hanff, C. Sohrt, A. Stange, A. Carr, M. M. Murnane, H. C. Kapteyn, L. Kipp, M. Bauer, and K. Rossnagel, Time-domain classification of charge-density-wave insulators, Nat. Commun. 3, 1069 (2012).
- Zong et al. [2019a] A. Zong, P. E. Dolgirev, A. Kogar, E. Ergeçen, M. B. Yilmaz, Y.-Q. Bie, T. Rohwer, I.-C. Tung, J. Straquadine, X. Wang, Y. Yang, X. Shen, R. Li, J. Yang, S. Park, M. C. Hoffmann, B. K. Ofori-Okai, M. E. Kozina, H. Wen, X. Wang, I. R. Fisher, P. Jarillo-Herrero, and N. Gedik, Dynamical slowing-down in an ultrafast photoinduced phase transition, Phys. Rev. Lett. 123, 097601 (2019a).
- Goldenfeld [1992] N. Goldenfeld, Lectures on Phase Transitions and the Renormalization Group (Westview, Boulder, 1992).
- Dolgirev et al. [2020a] P. E. Dolgirev, M. H. Michael, A. Zong, N. Gedik, and E. Demler, Self-similar dynamics of order parameter fluctuations in pump-probe experiments, Phys. Rev. B 101, 174306 (2020a).
- Dolgirev et al. [2020b] P. E. Dolgirev, A. V. Rozhkov, A. Zong, A. Kogar, N. Gedik, and B. V. Fine, Amplitude dynamics of charge density wave in LaTe3: Theoretical description of pump-probe experiments, Phys. Rev. B 101, 054203 (2020b).
- Laulhé et al. [2017] C. Laulhé, T. Huber, G. Lantz, A. Ferrer, S. O. Mariager, S. Grübel, J. Rittmann, J. A. Johnson, V. Esposito, A. Lübcke, L. Huber, M. Kubli, M. Savoini, V. L. R. Jacques, L. Cario, B. Corraze, E. Janod, G. Ingold, P. Beaud, S. L. Johnson, and S. Ravy, Ultrafast formation of a charge density wave state in 1-TaS2: Observation at nanometer scales using time-resolved x-ray diffraction, Phys. Rev. Lett. 118, 247401 (2017).
- Vogelgesang et al. [2018] S. Vogelgesang, G. Storeck, J. G. Horstmann, T. Diekmann, M. Sivis, S. Schramm, K. Rossnagel, S. Schäfer, and C. Ropers, Phase ordering of charge density waves traced by ultrafast low-energy electron diffraction, Nat. Phys. 14, 184 (2018).
- Mitrano et al. [2019] M. Mitrano, S. Lee, A. A. Husain, L. Delacretaz, M. Zhu, G. de la Peña Munoz, S. X.-L. Sun, Y. I. Joe, A. H. Reid, S. F. Wandel, G. Coslovich, W. Schlotter, T. van Driel, J. Schneeloch, G. D. Gu, S. Hartnoll, N. Goldenfeld, and P. Abbamonte, Ultrafast time-resolved x-ray scattering reveals diffusive charge order dynamics in La2-xBaxCuO4, Sci. Adv. 5, eaax3346 (2019).
- Minor et al. [1989] W. Minor, L. D. Chapman, S. N. Ehrlich, and R. Colella, Phason velocities in TaS2 by X-ray diffuse scattering, Phys. Rev. B 39, 1360 (1989).
- Pouget et al. [1991] J. P. Pouget, B. Hennion, C. Escribe-Filippini, and M. Sato, Neutron-scattering investigations of the Kohn anomaly and of the phase and amplitude charge-density-wave excitations of the blue bronze K0.3MoO3, Phys. Rev. B 43, 8421 (1991).
- Ru and Fisher [2006] N. Ru and I. R. Fisher, Thermodynamic and transport properties of YTe3, LaTe3, CeTe3, Phys. Rev. B 73, 033101 (2006).
- Bie et al. [2021] Y.-Q. Bie, A. Zong, X. Wang, P. Jarillo-Herrero, and N. Gedik, A versatile sample fabrication method for ultrafast electron diffraction, Ultramicroscopy 230, 113389 (2021).
- Weathersby et al. [2015] S. P. Weathersby, G. Brown, M. Centurion, T. F. Chase, R. Coffee, J. Corbett, J. P. Eichner, J. C. Frisch, A. R. Fry, M. Gühr, N. Hartmann, C. Hast, R. Hettel, R. K. Jobe, E. N. Jongewaard, J. R. Lewandowski, R. K. Li, A. M. Lindenberg, I. Makasyuk, J. E. May, D. McCormick, M. N. Nguyen, A. H. Reid, X. Shen, K. Sokolowski-Tinten, T. Vecchione, S. L. Vetter, J. Wu, J. Yang, H. A. Dürr, and X. J. Wang, Mega-electron-volt ultrafast electron diffraction at SLAC National Accelerator Laboratory, Rev. Sci. Instrum. 86, 073702 (2015).
- Shen et al. [2018] X. Shen, R. K. Li, U. Lundström, T. J. Lane, A. H. Reid, S. P. Weathersby, and X. J. Wang, Femtosecond mega-electron-volt electron microdiffraction, Ultramicroscopy 184, 172 (2018).
- Moore et al. [2016] R. G. Moore, W. S. Lee, P. S. Kirchman, Y. D. Chuang, A. F. Kemper, M. Trigo, L. Patthey, D. H. Lu, O. Krupin, M. Yi, D. A. Reis, D. Doering, P. Denes, W. F. Schlotter, J. J. Turner, G. Hays, P. Hering, T. Benson, J.-H. Chu, T. P. Devereaux, I. R. Fisher, Z. Hussain, and Z.-X. Shen, Ultrafast resonant soft X-ray diffraction dynamics of the charge density wave in TbTe3, Phys. Rev. B 93, 024304 (2016).
- Sacchetti et al. [2006] A. Sacchetti, L. Degiorgi, T. Giamarchi, N. Ru, and I. R. Fisher, Chemical pressure and hidden one-dimensional behavior in rare-earth tri-telluride charge-density wave compounds, Phys. Rev. B 74, 125115 (2006).
- Ramsey et al. [1965] T. H. Ramsey, H. Steinfink, and E. J. Weiss, Thermoelectric and electrical measurements in the La-Te System, J. Appl. Phys. 36, 548 (1965).
- René de Cotret et al. [2019] L. P. René de Cotret, J.-H. Pöhls, M. J. Stern, M. R. Otto, M. Sutton, and B. J. Siwick, Time- and momentum-resolved phonon population dynamics with ultrafast electron diffuse scattering, Phys. Rev. B 100, 214115 (2019).
- Maschek et al. [2015] M. Maschek, S. Rosenkranz, R. Heid, A. H. Said, P. Giraldo-Gallo, I. R. Fisher, and F. Weber, Wave-vector-dependent electron-phonon coupling and the charge-density-wave transition in TbTe3, Phys. Rev. B 91, 235146 (2015).
- Stern et al. [2018] M. J. Stern, L. P. René de Cotret, M. R. Otto, R. P. Chatelain, J.-P. Boisvert, M. Sutton, and B. J. Siwick, Mapping momentum-dependent electron-phonon coupling and nonequilibrium phonon dynamics with ultrafast electron diffuse scattering, Phys. Rev. B 97, 165416 (2018).
- Mazenko and Zannetti [1985] G. F. Mazenko and M. Zannetti, Instability, spinodal decomposition, and nucleation in a system with continuous symmetry, Phys. Rev. B 32, 4565 (1985).
- Bray [1994] A. J. Bray, Theory of phase-ordering kinetics, Adv. Phys. 43, 357 (1994).
- Zong et al. [2019b] A. Zong, A. Kogar, Y.-Q. Bie, T. Rohwer, C. Lee, E. Baldini, E. Ergeçen, M. B. Yilmaz, B. Freelon, E. J. Sie, H. Zhou, J. Straquadine, P. Walmsley, P. E. Dolgirev, A. V. Rozhkov, I. R. Fisher, P. Jarillo-Herrero, B. V. Fine, and N. Gedik, Evidence for topological defects in a photoinduced phase transition, Nat. Phys. 15, 27 (2019b).
- Chaikin and Lubensky [1995] P. M. Chaikin and T. C. Lubensky, Mean-field theory, in Principles of Condensed Matter Physics (Cambridge University Press, Cambridge, 1995) pp. 144–212.
- Hohenberg and Halperin [1977] P. C. Hohenberg and B. I. Halperin, Theory of dynamic critical phenomena, Rev. Mod. Phys. 49, 435 (1977).
- Sun and Millis [2020] Z. Sun and A. J. Millis, Transient trapping into metastable states in systems with competing orders, Phys. Rev. X 10, 021028 (2020).
- Trigo et al. [2019] M. Trigo, P. Giraldo-Gallo, M. E. Kozina, T. Henighan, M. P. Jiang, H. Liu, J. N. Clark, M. Chollet, J. M. Glownia, D. Zhu, T. Katayama, D. Leuenberger, P. S. Kirchmann, I. R. Fisher, Z. X. Shen, and D. A. Reis, Coherent order parameter dynamics in SmTe3, Phys. Rev. B 99, 104111 (2019).
- Holt et al. [2001] M. Holt, P. Zschack, H. Hong, M. Y. Chou, and T.-C. Chiang, X-ray studies of phonon softening in TiSe2, Phys. Rev. Lett. 86, 3799 (2001).
- Glaeser [1985] R. M. Glaeser, Electron crystallography of biological macromolecules, Annu. Rev. Phys. Chem. 36, 243 (1985).
- Rettig et al. [2016] L. Rettig, R. Cortés, J.-H. Chu, I. R. Fisher, F. Schmitt, R. G. Moore, Z.-X. Shen, P. S. Kirchmann, M. Wolf, and U. Bovensiepen, Persistent order due to transiently enhanced nesting in an electronically excited charge density wave, Nat. Commun. 7, 10459 (2016).
- Yokoya et al. [2005] T. Yokoya, T. Kiss, A. Chainani, S. Shin, and K. Yamaya, Role of charge-density-wave fluctuations on the spectral function in a metallic charge-density-wave system, Phys. Rev. B 71, 140504(R) (2005).
- Chatterjee et al. [2015] U. Chatterjee, J. Zhao, M. Iavarone, R. Di Capua, J. P. Castellan, G. Karapetrov, C. D. Malliakas, M. G. Kanatzidis, H. Claus, J. P. C. Ruff, F. Weber, J. van Wezel, J. C. Campuzano, R. Osborn, M. Randeria, N. Trivedi, M. R. Norman, and S. Rosenkranz, Emergence of coherence in the charge-density wave state of 2-NbSe2, Nat. Commun. 6, 6313 (2015).
- Xu et al. [2000] Z. A. Xu, N. P. Ong, Y. Wang, T. Kakeshita, and S. Uchida, Vortex-like excitations and the onset of superconducting phase fluctuation in underdoped La2-xSrxCuO4, Nature 406, 486 (2000).
- Pourret et al. [2006] A. Pourret, H. Aubin, J. Lesueur, C. A. Marrache-Kikuchi, L. Bergé, L. Dumoulin, and K. Behnia, Observation of the Nernst signal generated by fluctuating Cooper pairs, Nat. Phys. 2, 683 (2006).
- Nam et al. [2013] M.-S. Nam, C. Mézière, P. Batail, L. Zorina, S. Simonov, and A. Ardavan, Superconducting fluctuations in organic molecular metals enhanced by Mott criticality, Sci. Rep. 3, 3390 (2013).
- Buzzi et al. [2021] M. Buzzi, D. Nicoletti, S. Fava, G. Jotzu, K. Miyagawa, K. Kanoda, A. Henderson, T. Siegrist, J. A. Schlueter, M.-S. Nam, A. Ardavan, and A. Cavalleri, A phase diagram for light-induced superconductivity in -(ET)2-X (2021), arXiv:2106.14244 .
- He et al. [2021] Y. He, S.-D. Chen, Z.-X. Li, D. Zhao, D. Song, Y. Yoshida, H. Eisaki, T. Wu, X.-H. Chen, D.-H. Lu, C. Meingast, T. P. Devereaux, R. J. Birgeneau, M. Hashimoto, D.-H. Lee, and Z.-X. Shen, Superconducting fluctuations in overdoped Bi2Sr2CaCu2O8+δ, Phys. Rev. X 11, 031068 (2021).
- Tallon et al. [2011] J. L. Tallon, J. G. Storey, and J. W. Loram, Fluctuations and critical temperature reduction in cuprate superconductors, Phys. Rev. B 83, 092502 (2011).
- Weber et al. [2011] F. Weber, S. Rosenkranz, J.-P. Castellan, R. Osborn, R. Hott, R. Heid, K.-P. Bohnen, T. Egami, A. H. Said, and D. Reznik, Extended phonon collapse and the origin of the charge-density wave in 2-NbSe2, Phys. Rev. Lett. 107, 107403 (2011).
- Hoesch et al. [2009] M. Hoesch, A. Bosak, D. Chernyshov, H. Berger, and M. Krisch, Giant Kohn anomaly and the phase transition in charge density wave ZrTe3, Phys. Rev. Lett. 102, 086402 (2009).
- Grüner [1994] G. Grüner, Density Waves in Solids (Addison-Wesley, Boston, 1994).
- Ma and Yu [2013] L. Ma and W.-Q. Yu, Review of nuclear magnetic resonance studies on iron-based superconductors, Chinese Phys. B 22, 087414 (2013).
- Zhang et al. [2016] J. Zhang, X. Tan, M. Liu, S. W. Teitelbaum, K. W. Post, F. Jin, K. A. Nelson, D. N. Basov, W. Wu, and R. D. Averitt, Cooperative photoinduced metastable phase control in strained manganite films, Nat. Mater. 15, 956 (2016).
- McLeod et al. [2020] A. S. McLeod, J. Zhang, M. Q. Gu, F. Jin, G. Zhang, K. W. Post, X. G. Zhao, A. J. Millis, W. B. Wu, J. M. Rondinelli, R. D. Averitt, and D. N. Basov, Multi-messenger nanoprobes of hidden magnetism in a strained manganite, Nat. Mater. 19, 397 (2020).
- Zhang [1997] S.-C. Zhang, A unified theory based on symmetry of superconductivity and antiferromagnetism, Science 275, 1089 (1997).
- Demler et al. [2004] E. Demler, W. Hanke, and S.-C. Zhang, theory of antiferromagnetism and superconductivity, Rev. Mod. Phys. 76, 909 (2004).
Supplemental Material to “Role of equilibrium fluctuations in light-induced order”
I Experimental details
I.1 Sample preparation
Single crystals of LaTe3 and DyTe3 were grown by slow cooling of a binary melt [40], and then mechanically exfoliated to a typical size of approximately nm. Via an all-dry viscoelastic stamping method [41], thin flakes were transferred to a commercial 10-nm-thick silicon nitride window (SiMPore), which was mounted on a copper holder for ultrafast electron diffraction measurements. All preparations were performed in argon or nitrogen gas as Te3 compounds are readily oxidized under ambient conditions [40].
I.2 Single- and double-pump ultrafast electron diffraction
The ultrafast electron diffraction experiments were carried out at the MeV UED beamline at SLAC National Accelerator Laboratory [42, 43]. The 800-nm (1.55-eV), 80-fs pump pulse from a commercial Ti:sapphire regenerative amplifier laser (Vitara and Legend Elite HE, Coherent Inc.) was split into the pump and probe arms. The probe arm was frequency tripled and focused to a copper photocathode, and 3.1 MeV (or 4.2 MeV) electron bunches were generated by radiofrequency photoinjetors at a repetition rate of 180 Hz (or 360 Hz). The electron beam was normally incident on the sample with a m2 spot size, measured at full-width at half maximum (FWHM). The diffraction pattern was imaged by a phosphor screen and recorded by an electron-multiplying charge-coupled device (EMCCD, Andor iXon Ultra 888). A circular through hole in the center of the phosphor screen allowed the passage of undiffracted electron beam to prevent camera saturation.
The pump arm goes through a linear translation stage (Delay 1) before being split into two paths: a fixed path and a variable path. The variable path has an additional linear stage (Delay 2) that adjusts the relative optical delay between the two pump paths. Each pump path can be individually blocked and its pulse energy can be separately tuned. The two pump paths were recombined before entering the vacuum chamber, and the pump was then focused to an area larger than m2 (FWHM) in the sample at an incidence angle around from sample normal. For single-pump measurements, one of the two pump paths was blocked and Delay 1 was scanned. For double-pump measurements, both pump paths were unblocked. Delay 1 was varied with a fixed value of Delay 2 that set the relative arrival time between the two pump pulses. The relative time delay and incident fluence of the two excitation pulses were calibrated by illuminating them separately on the same sample and observing the initial intensity drop of the CDW peaks.
I.3 Time trace fitting
In Figs. 2 and S2, the time evolution of diffraction intensities was fit to a phenomenological model to describe the photoinduced changes [30, 44]
| (S1) |
In this model, represents the intrinsic system response time to photoexcitation; represents the maximum intensity change; denotes the value of at long time delays; is the characteristic relaxation time to the quasi-equilibrium; is associated with the relative arrival time of pump and probe pulses, and it is the time delay when reaches . The effect of the finite pulse width in both pump and probe branches is taken into account by convolving the terms in the square brackets with a normalized Gaussian pump-probe cross-correlation function , where denotes the FWHM. In the curve fits, takes the value of 300 fs (or 230 fs) for the 3.1 MeV (or 4.2 MeV) electrons used. If the time trace can be described by a single-exponential evolution, such as the thermal diffuse intensity in Figs. 2(c)(d) and S2(d), Eq. (I.3) is simplified by setting and .
I.4 Transient lattice temperature
An important observation made in the main text is the close resemblance between photoexcited LaTe3 at 307 K and equilibrium DyTe3 near its . To rule out the trivial scenario where the laser pulse transiently heats LaTe3 to its around 670 K [23], here we estimate the transient increase of its lattice temperature. Assuming no heat dissipation out of the probed volume, an upper bound of the temperature rise is given by
| (S2) |
where is the room temperature reflectivity at 800 nm [45], is the incident fluence, nm is the penetration depth at which the intensity of the 800-nm light decays to of its original value [31], and J/(cmK) is the room temperature specific heat capacity [40, 46]. In this work, a maximum incident fluence of 2.1 mJ/cm2 was used to photoexcite LaTe3, leading to a maximum possible increase of K in the lattice temperature. Given the low repetition rate of 180 Hz or 360 Hz used in the experiment and given the equilibrium sample temperature of 307 K, we conclude that LaTe3 is much below its CDW transition temperature throughout the temporal evolution.
II Diffraction intensity near a Kohn anomaly
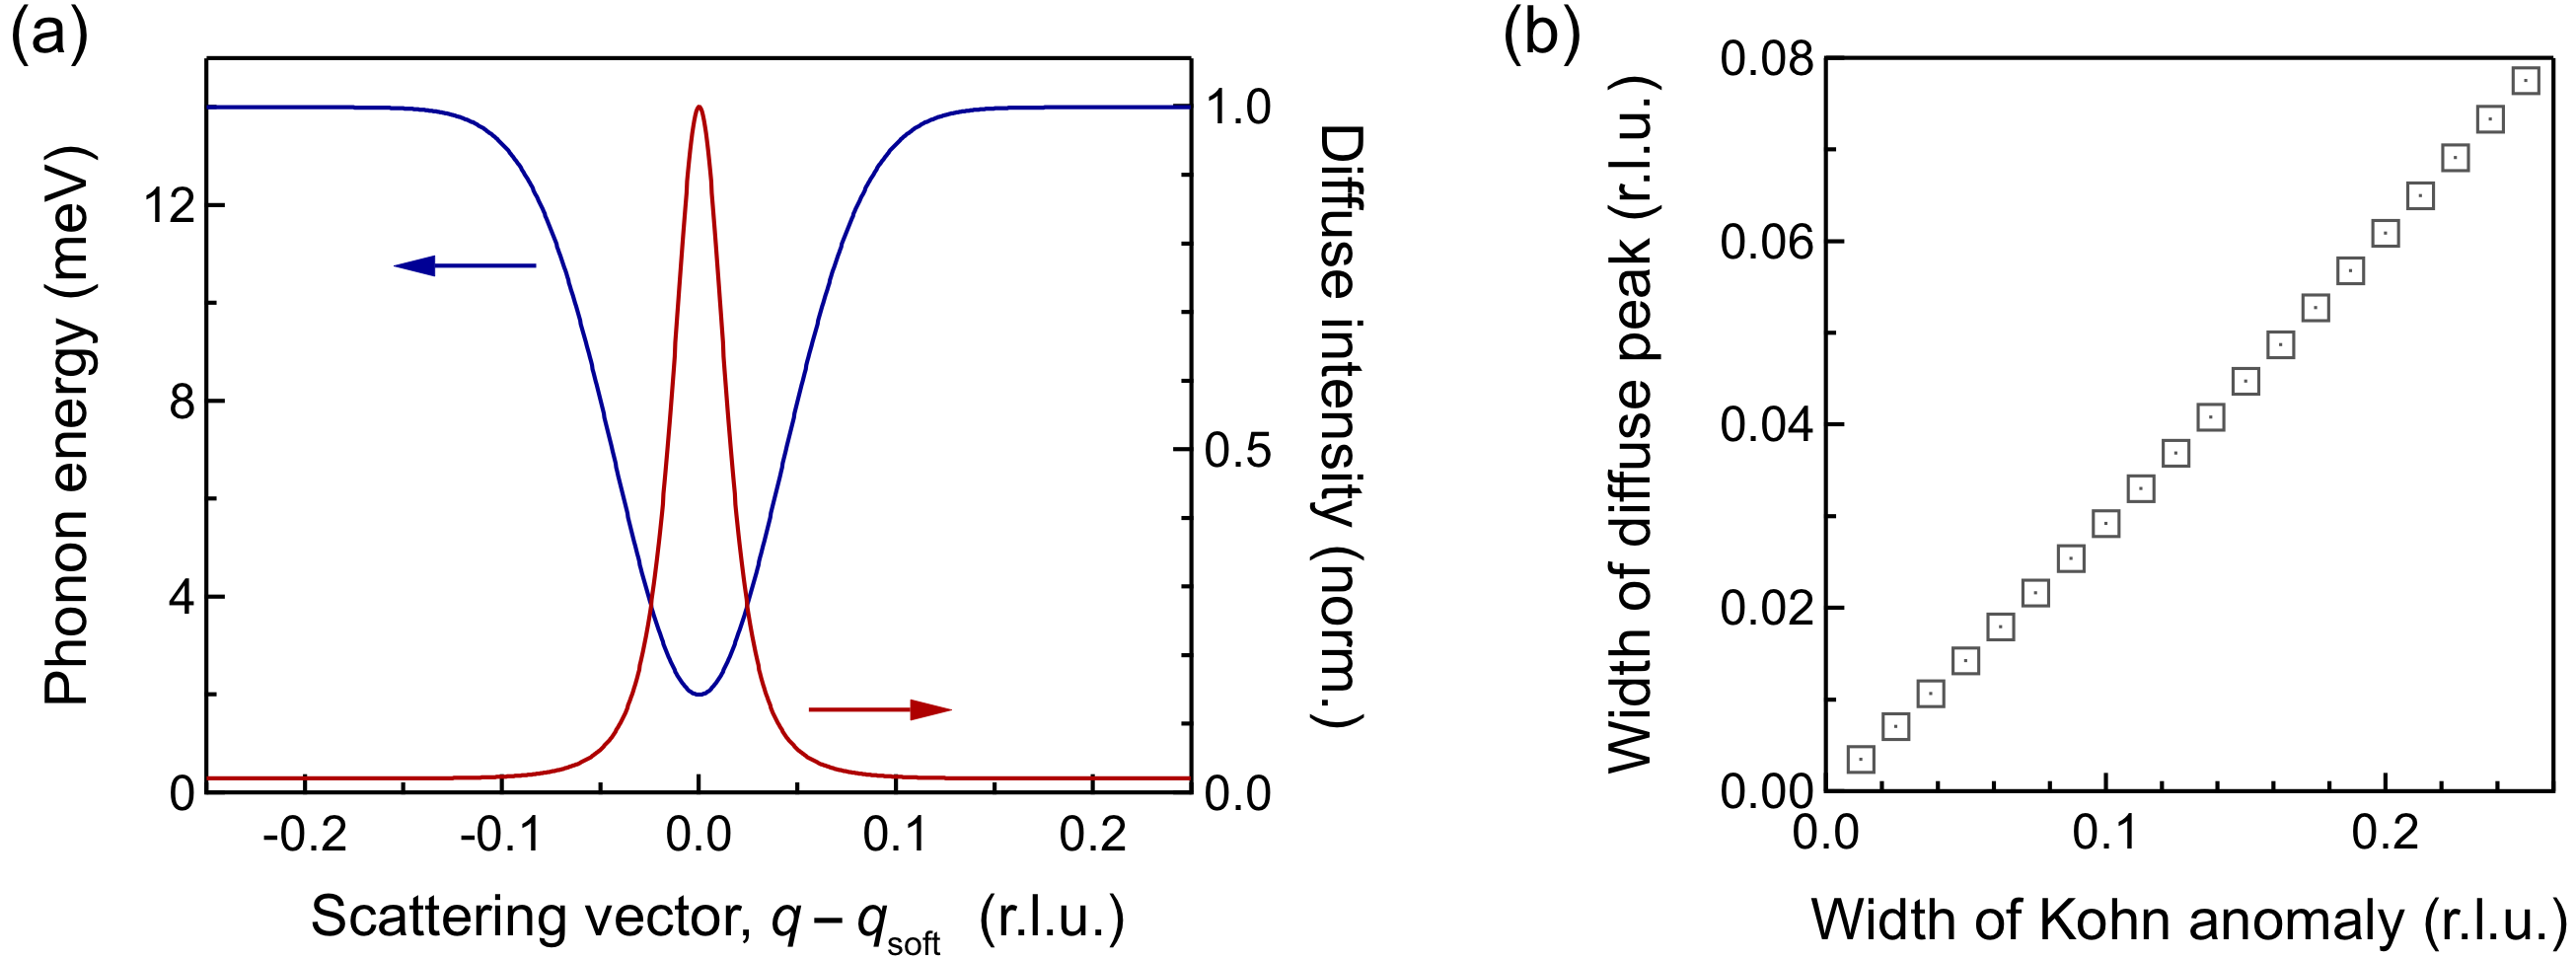
In Fig. 1(c), the characteristic length scale of a fluctuating CDW domain is labeled as , where is the width of the Kohn anomaly in the phonon dispersion. In this section, we formalize the relation between the momentum width of the Kohn anomaly and the corresponding width of the diffuse scattering peak, the latter of which measures the reciprocal of the fluctuating domain size.
Under the kinematic approximation, the diffraction intensity at wavevector is the sum of contributions from elastic scattering and inelastic scatterings with phonons:
| (S3) |
As the scattering cross sections with two or more phonons are relatively small, we are mostly concerned with and , given by [47]
| (S4) | ||||
| (S5) |
where is some constant of proportionality, is the total scattering wavevector, is the reduced crystal momentum, defined with respect to the closest reciprocal lattice vector for a given . is the position of atom in the unit cell, is the Debye-Waller factor, and is the atomic form factor. Index runs over the phonon branches and , correspond to the population and frequency for the phonon at reduced momentum in branch . is the one-phonon structure factor, given by
| (S6) |
where is the mass of atom and is the displacement polarization vector for atom under the motion of phonon in branch with momentum . As we explain in Sec. III, the transverse polarization of the CDWs in Te3 leads to a momentum-dependent satellite intensity in the diffraction pattern, which is accounted for by the term. The Debye-Waller factor describes the intensity reduction in both and , which results from the excitation of phonons in all branches and momenta. It reads
| (S7) |
Here, is the vibration amplitude for a particular phonon mode,
| (S8) |
where is the number of unit cells.
From Eq. (S5), the presence of a Kohn anomaly – a dip in the frequency at a particular momentum for phonon branch – would lead to a locally enhanced one-phonon scattering. The enhancement is primarily due to the term in the numerator and the term in the denominator. If we choose a scattering vector that is aligned with the polarization vector for the soft mode in question, we expect the one-phonon structure factor to be a slow-varying function of within a Brillouin zone, so it is less affected by the Kohn anomaly. To see the relationship between and , a schematic of a Kohn anomaly is sketched in Fig. S1(a) (blue curve), using experimentally determined parameters for DyTe3 near its [21]. The corresponding from this soft phonon branch is shown in the red curve, where the contribution from is neglected. Here, we use the Bose-Einstein distribution for the phonon population , where is set to 307 K, near the of DyTe3. As expected, a diffuse peak develops at , whose width matches that of the Kohn anomaly up to a small factor. In Fig. S1(b), the width of the diffuse peak is plotted for a range of widths for the Kohn anomaly, showing a quasi-linear relationship. Therefore, it is indeed justified to use the width of the Kohn anomaly to estimate the width of the diffuse peak up to a small constant factor, which in turn indicates the spatial extent of the fluctuating CDW domains [Fig. 1(b)(c)].
III Transverse atomic displacement and Bragg peak dynamics
From the diffraction patterns in Fig. 1(d)–(g), the -axis CDW peaks at are most prominent when . On the other hand, the -axis satellites at are the brightest for . Here, we adopt the convention of , so is an odd integer. As we explain in the following, this momentum dependence suggests the transverse polarization of the atomic displacement underlying the periodic lattice distortion [48, 21]. For small distortion, the intensity of the CDW peak contains a factor of , where is the atomic displacement and is the scattering vector [34]. For a transverse mode, , where is the CDW ordering vector. Hence, for the -axis CDW and for the -axis CDW. The maximum satellite peak intensity occurs when , leading to the momentum pattern observed. For this reason, we divide the diffraction pattern into four quadrants, shown in Fig. S2(a). When plotting the intensity evolutions of CDW peaks – and – we only average over peaks in the corresponding quadrants to maximize the signal. The integration areas for and are marked by red and blue circles in Fig. S2(a), respectively.
Another consequence of the transverse polarization is encoded in the intensity evolution of the Bragg peak, shown in Fig. S2(c). The yellow markers correspond to quadrants I & III while the purple markers correspond to quadrants II & IV, as indicated by the color-coded regions of interest (ROIs) in Fig. S2(a). While the yellow curve shows an initial increase in intensity, the purple curve only exhibits an intensity decay over ps. The decay arises from the photoinduced Debye-Waller factor that redistributes the spectral weight from the Bragg peak to elsewhere in the momentum space as phonon branches are populated. The initial rise can only be accounted for by the transient suppression of the equilibrium -axis CDW. This intensity gain of the Bragg peak also contains the factor [34], so the effect is the most pronounced when . For the -axis CDW, , so the intensity gain is mostly manifested in Bragg peaks from quadrants I & III.
IV Momentum-dependent diffuse scattering dynamics
In Fig. 2(c)(d), we plotted the temporal evolutions of diffuse scattering at , showing a single-exponential rise after photoexcitation. In this section, we examine the momentum-dependence of the diffuse scattering dynamics. In Fig. S2(b), we identified five representative momentum positions together with their symmetry-equivalent points within the diamond-shaped ROI. The intensity evolution of thermal diffuse scattering from each location is plotted in Fig. S2(d). The short-time dynamics of all curves is well described by a single-exponential rise, indicating the transient excitation of incoherent phonons. In particular, for locations 1 to 4, the intensity rise starts immediately after photoexcitation and all curves plateau at a quasi-equilibrium value of a 4% increase. For comparison, under the same excitation condition, the maximum intensity rise at is approximately 10%, plotted in Fig. S4(a). The time constants for the intensity rise vary among different momenta, ranging from 1 to 2.5 ps. These rise times encode information about the momentum-dependent electron-phonon and phonon-phonon coupling strengths [49], which are subject to future investigations.
The diffuse scattering dynamics at location 5 is markedly different from the others. First, there is a 0.8 ps delay of the rise, indicated by the arrow in Fig. S2(d). Second, the intensity only increases by 3% when it plateaus, distinctly smaller than the others. These features suggest that there is another dynamics apart from the increase in the phonon population. One possibility is that location 5 lies in close proximity to high-order -axis CDW peaks [27]. The photoinduced melting of these high-order peaks will both delay and offset the rise of diffuse scattering, explaining the anomaly at location 5. Another possibility is that the electron-phonon coupling vertex is anomalously small at this location, leading to a delayed rise of the phonon population.
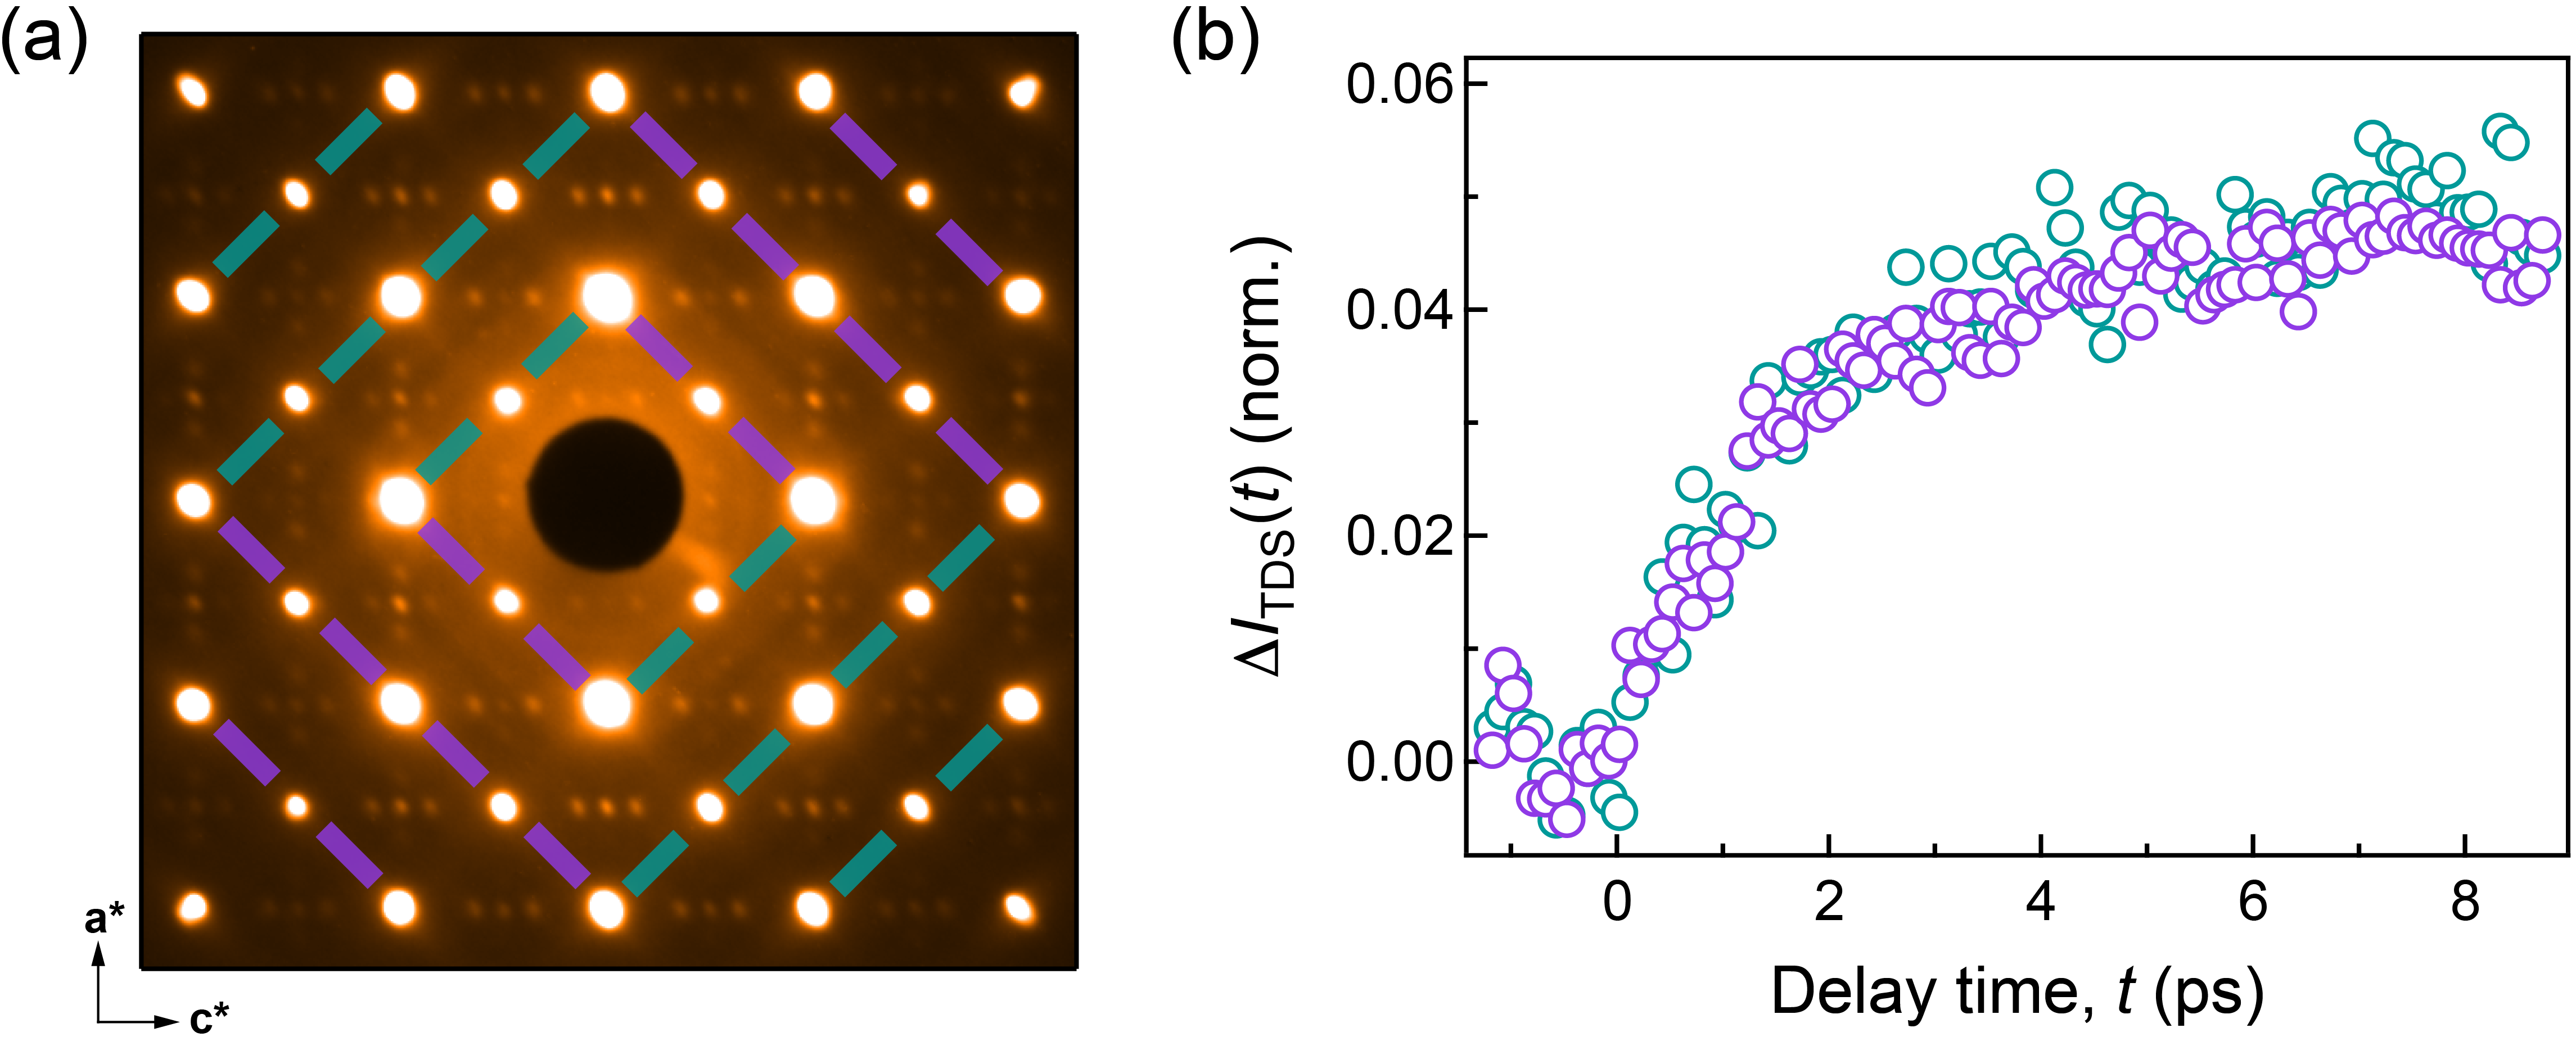
In Fig. S2(d), the ROIs for the diffuse intensity dynamics are taken in a four-fold symmetric manner, as illustrated in Fig. S2(b). This is because the transient diffuse intensity change appears isotropic and does not distinguish between the - and -axis. We verify this lack of anisotropy in Fig. S3, where diffuse signals in two sets of ROIs along the two diagonal directions are analyzed. These ROIs correspond to the acoustic transverse phonon branches in the (001) diffraction plane, which give rise to the diamond-shaped diffuse scattering signals in Fig. 1(e)(g). Upon photoexcitation, the diffuse scattering evolutions along the two orthogonal directions are perfectly overlapped [Fig. S3], reaffirming the direction-independent nature of the diffuse signals.
V Initial CDW dynamics after photoexcitation
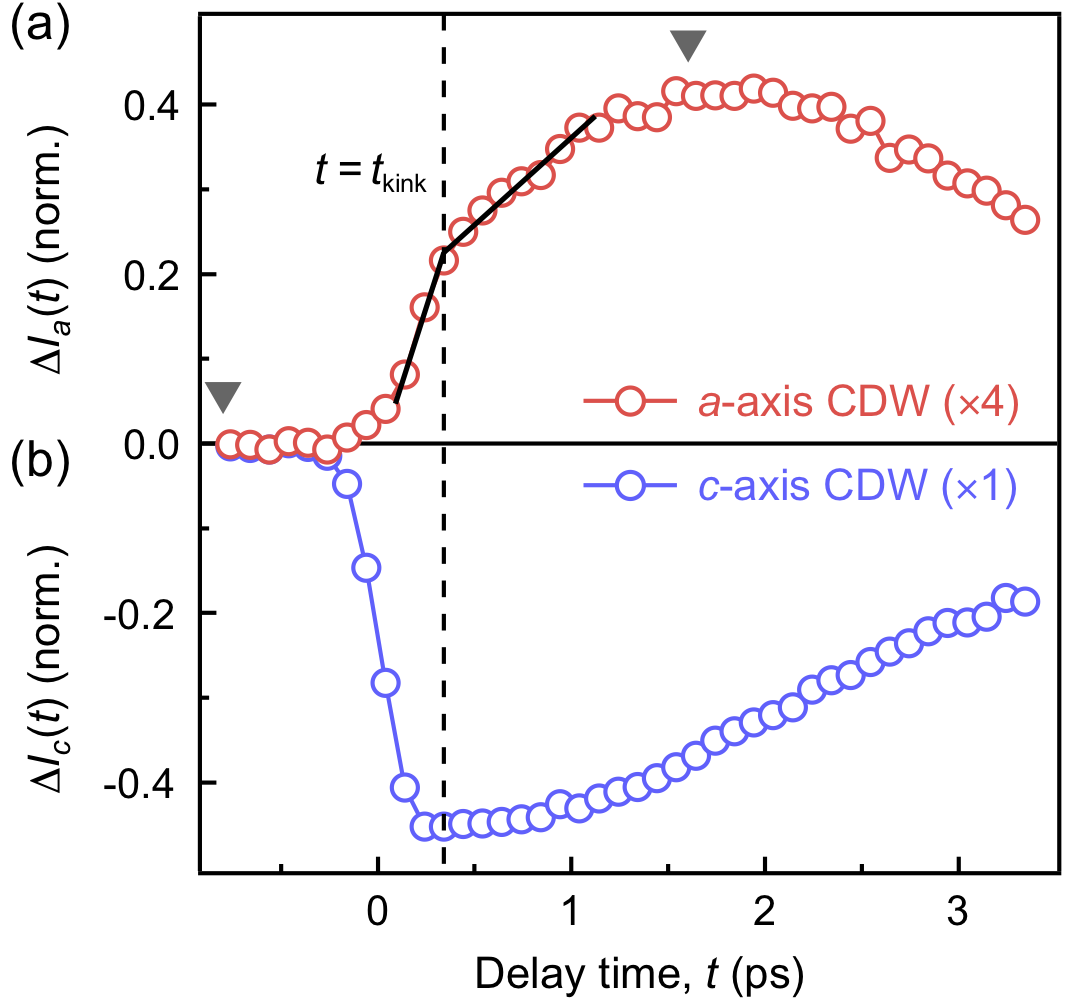
In Fig. 2(f)(h) of the main text, the initial rise of the light-induced -axis CDW peak appears slower than the drop of the equilibrium -axis CDW peak. Here, we elaborate on their initial fast dynamics and explain the origin of the discrepancy. As shown in Fig. S4, within 350 fs after photoexcitation, the -axis peak is maximally suppressed. The growth of the fluctuation along the -axis is conspicuously slower, peaking at a pump-probe delay of ps. In addition, its intensity evolution exhibits a kink at fs (dashed line), corresponding to the time delay when the -axis intensity reaches the minimum. This correspondence is not coincidental and hints at the competing relation between the two CDWs. The rapid growth of fluctuations before is facilitated by the suppression of the equilibrium order. After , there is no further decrease of the -axis CDW and the development of -axis fluctuations slows down. From a microscopic point of view, a vanishing equilibrium CDW restores electronic densities of states to the Fermi level when the corresponding CDW gap closes, providing mobile carriers that can scatter the soft phonons associated with the CDW fluctuations. After , no more carriers are added to the Fermi level, so the fluctuations do not grow as quickly as before.
VI Fluence-dependent slowing-down in the fluctuation dynamics
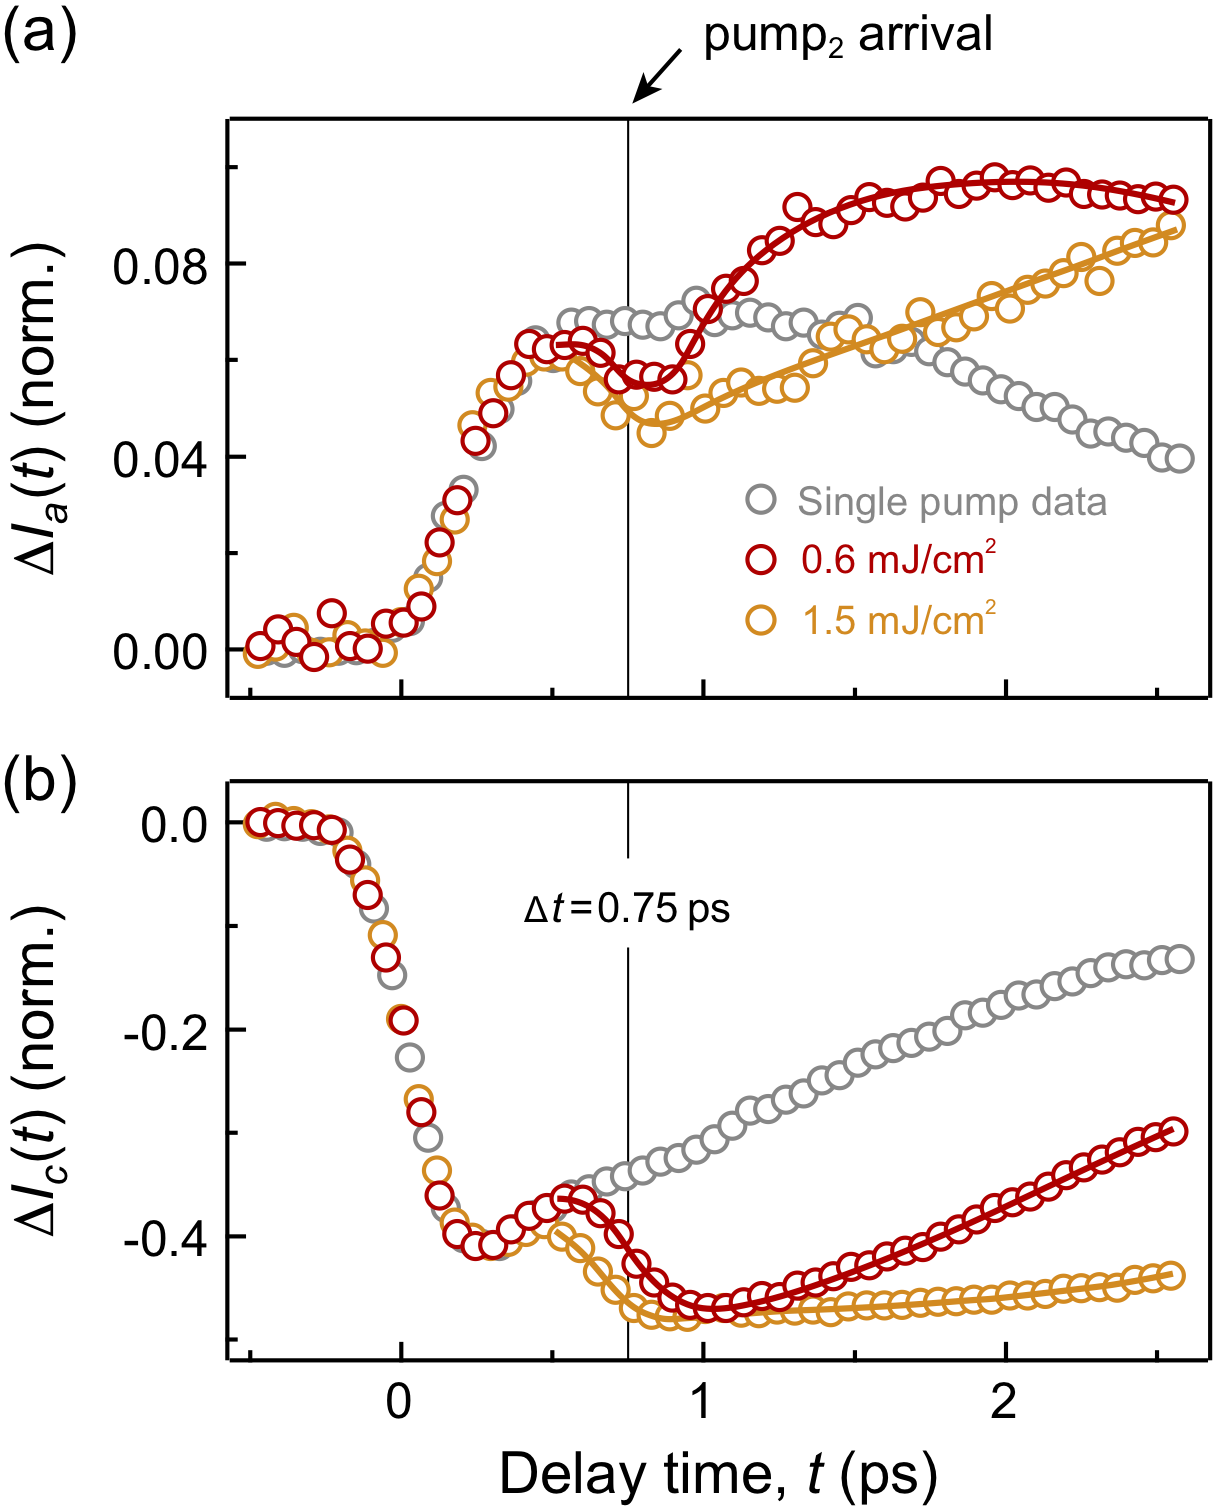
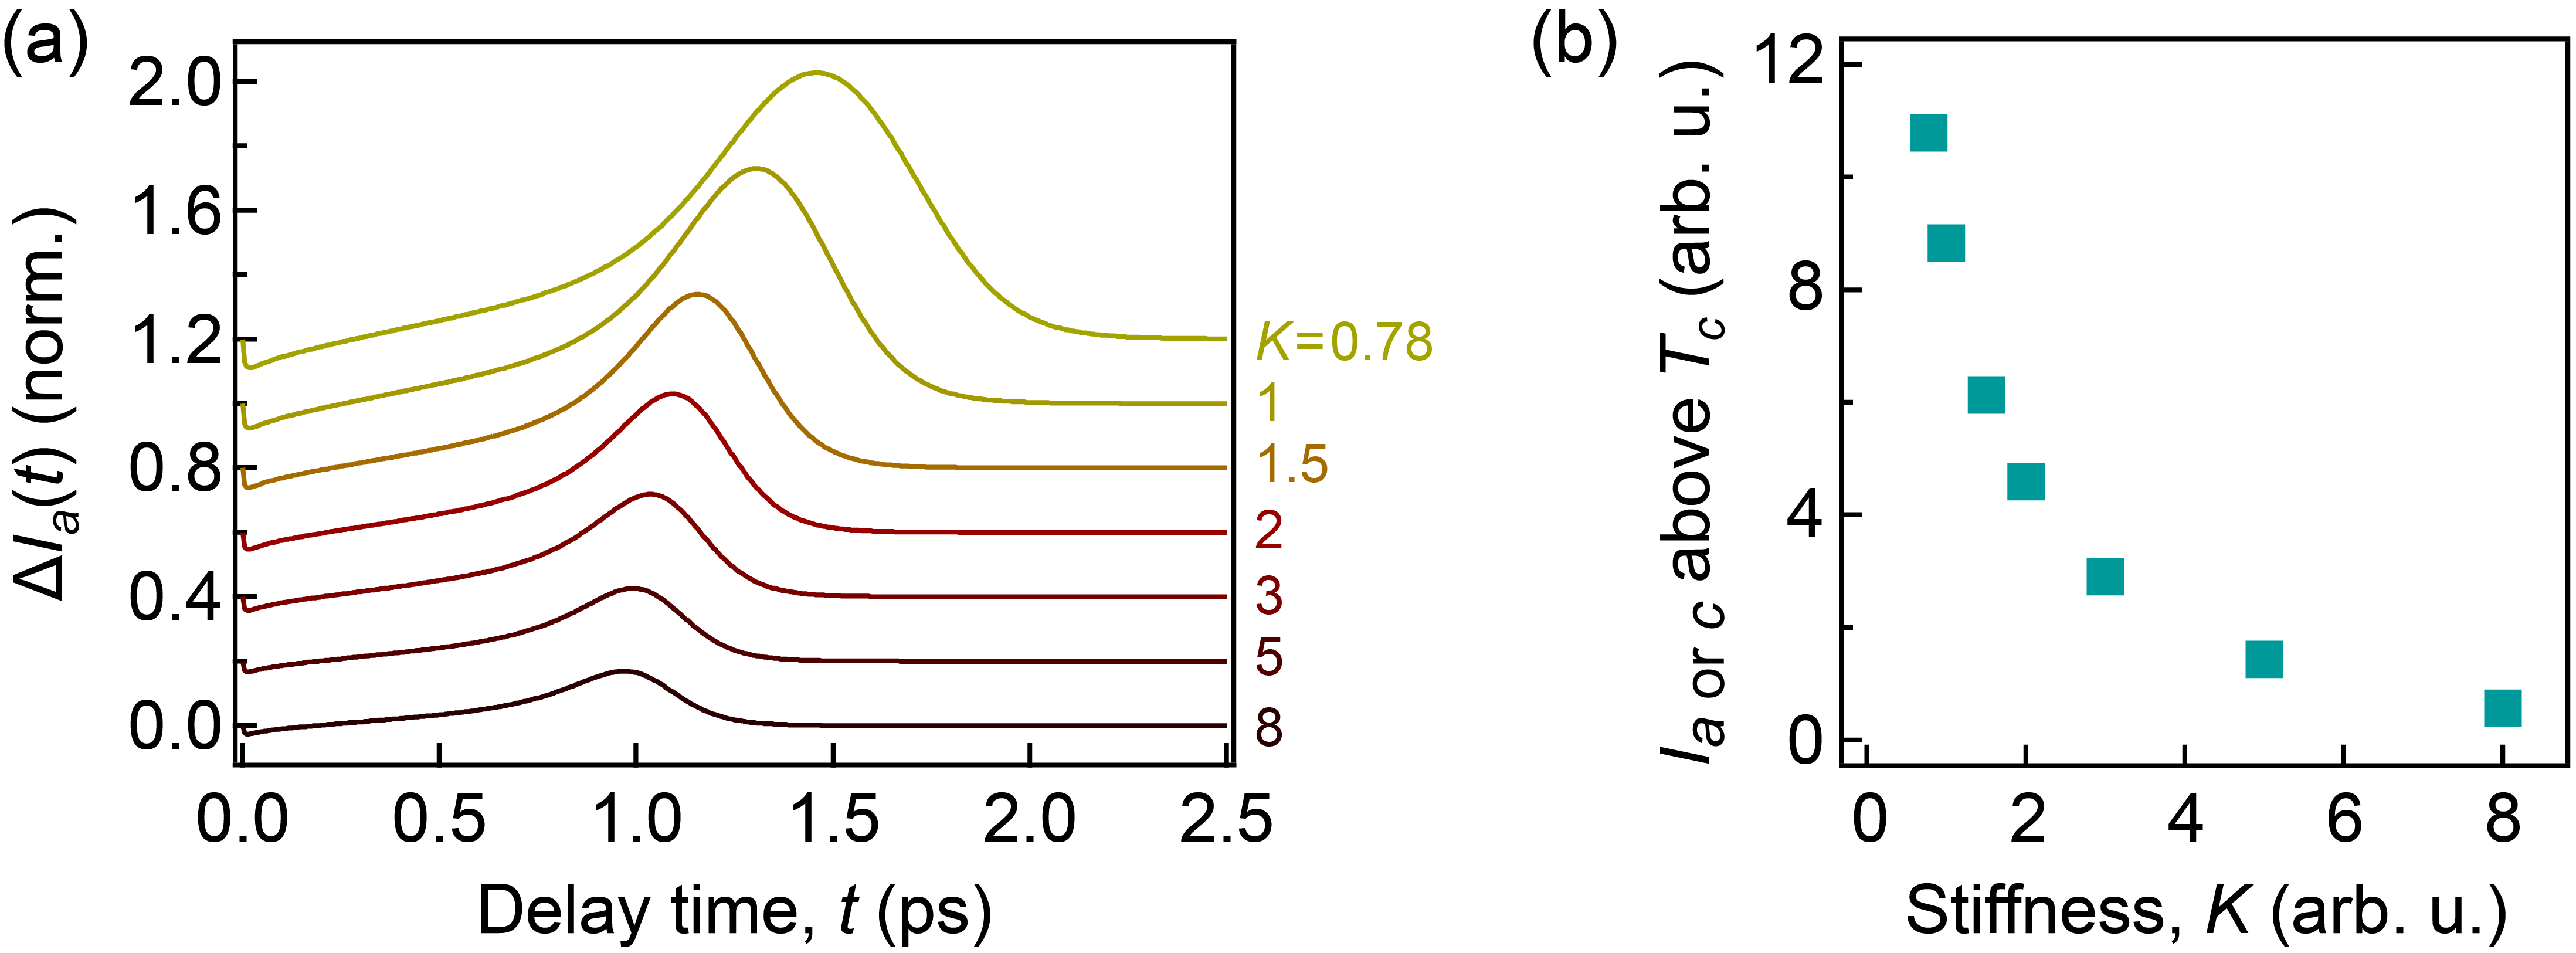
A close examination of Fig. 2(f) in the main text reveals that the growth of the -axis fluctuation significantly slows down after the incidence of the second pump pulse. To understand the origin of this effect, we repeated the double-pump experiment with varying laser fluences of the second pulse (Fig. S5). As more energy is injected into the system, both - and -axis fluctuations are found to slow down in their joint growth. The slower growth as a function of increasing fluence is captured by our nonperturbative model formulated in Sec. VII [Fig. S6(b)]. An important implication of this slowing-down is that the photoinduced fluctuation would appear to last longer with higher laser fluence [4]. Hence, one could in principle use tailored fluence to adjust the lifetime of light-induced fluctuating states.
VII Nonperturbative calculation of photoinduced fluctuations
In this section, we explain the time-dependent model and its nonperturbative solution to the light-induced dynamics of both -axis and -axis CDWs. Without assuming any thermal state of the excited system, our method yields the exact observable in an ultrafast electron diffraction measurement. The benefit of our approach is that it contains only a few model parameters, yet it captures all essential aspects of the equilibrium phase diagram of the material as well as the dynamics in the ultrafast regime.
VII.1 Ginzburg-Landau free energy and equilibrium phase diagram
We start by considering the simplest Ginzburg-Landau free energy functional that contains all necessary ingredients for the two competing CDWs,
| (S9) |
where is the usual Ginzburg-Landau potential
| (S10) |
and describes the competing interaction
| (S11) |
Here, , , , and are the model parameters. is an -component vector of real numbers, which is used to denote the order parameter for the symmetry-breaking transition [50, 51]
| (S12) |
In our case, for incommensurate CDWs in Te3 and the spatial dimension is .
The mean-field phase diagram of the model in Eq. (S9) agrees with the phenomenology of rare-earth tritellurides. Specifically, this model has two qualitatively different regimes [53]: (i) bicritical regime () corresponds to a situation when only the dominant order, , can develop in equilibrium; (ii) tetracritical regime () represents the case when the two order parameters can coexist. We focus on the former situation for LaTe3 and further impose and because the anisotropy between the orthogonal CDWs is small. The equilibrium asymmetry between the two CDWs lies in a slightly smaller value of compared to , so the CDW always occurs along the -axis.
VII.2 Photoexcitation protocol
Photoexcitation is modeled by an impulsive change to the phenomenological parameters and in Eq. (S10). If we define and , the quench protocol is
| (S13) |
where is the equilibrium value; and denote the arrival times and fluences of the two excitation pulses; for single-pump measurement, we set . is assumed to be constant throughout the temporal evolution to minimize the number of adjustable parameters and to mirror the equilibrium phase diagram of a bicritical regime. represents the typical relaxation timescale of excited quasiparticles, which are responsible for the modification of the free energy potential. A representative is shown in Fig. S6(a) for a double-pump pulse sequence.
VII.3 Equations of motion for long-range order and fluctuations
Here, we explain the equations of motion for the long-range order and order parameter fluctuations corresponding to the free energy functional in Eq. (S9). To describe the photoinduced evolution, we assume overdamped order parameter dynamics (model-A [54]) and follow the formalism in ref. [33]. We neglected the coherent oscillatory dynamics associated with the phononic degree of freedom. The overdamped dynamics is expected to be reliable in describing long-time dynamics after a strong laser pulse, which results in a proliferation of low-energy, low-momenta order parameter collective modes. Adding the phonon contribution will better capture the short-time dynamics, especially the initial response time [31].
Without loss of generality, we assume that spontaneous symmetry breaking occurs along the first component of the order parameter, . In the temporal evolution after photoexcitation, the presence of long-range order is hence represented by a nonzero expectation value
| (S14) |
Irrespective of whether long-range order exists, the order parameter can also exhibit transverse and longitudinal fluctuations, represented by the transient equal-time two-point correlation functions [33],
| (S15) | ||||
| (S16) |
Here, describes the Higgs modes while represents the Goldstone modes. The evolutions of , , and can be numerically solved following their respective equations of motion:
| (S17) | ||||
| (S18) | ||||
| (S19) |
where is the temperature of a phononic bath that provides thermalization of the excited system, and is assumed to be unchanged after photoexcitation. is a measure of the relaxation rate of the corresponding long-range order. Given the photoinduced symmetry between the two CDWs in LaTe3 and DyTe3, we assume that are the same for the two density waves. In principle, one is free to impose different values for different order parameters, leading to long-lasting metastable states that are not in the global free-energy minimum [55]. is a self-consistent “mass” term, defined as
| (S20) |
and a symmetric expression holds for .
We make a few remarks on Eqs. (S17)–(S19). In equilibrium, there is no long-range order for the -axis CDW (), so it remains zero throughout the time evolution as dictated by Eq. (S17). It also implies that the dynamics of and are identical because there is no distinction between transverse and longitudinal fluctuations in the absence of any symmetry breaking along the -axis.
VII.4 Intensity evolutions of c- and a-axis CDW peaks
In electron diffraction, the integrated intensity surrounding the CDW peaks measures the mean square order parameter amplitude at each pump-probe delay , averaged over the probed sample volume. We denote this observable by
| (S21) | ||||
| (S22) |
where the second line follows from the Fourier transform. As labeled in Eq. (S22), the integrated intensity contains contributions from both the long-range order and the fluctuations. This statement is true for the dominant -axis CDW. However, as explained above, Eq. (S17) imposes that the long-range order is always absent in the subdominant -axis CDW throughout the temporal evolution. Therefore, the diffraction intensity in the -axis satellite is an exclusive marker for the order parameter fluctuations.
In Fig. 3(a) of the main text, we presented the evolutions of following a single pump. Here, we also explore their dynamics after a double-pump sequence, mimicking the experimental scheme in Fig. 2(f)(h). After the first photoexcitation event, decreases significantly due to the loss of long-range order , which is shown separately in Fig. S6(d) (gray dashed curve). As the long-range -axis CDW is suppressed, short-range fluctuations of both CDWs start to develop in an indistinguishable manner. The effect of the second pump is to transiently suppress the codeveloping fluctuations, which swiftly rebound and grow over the next picosecond. As the fluence of the second pump increases, the joint growth of both and slows down, in agreement with experimental observations in Fig. S5. The mean square amplitudes of the two CDWs start to diverge once the long-range order starts to recover from zero [Fig. S6(d)].
We can use the same formalism to study the dynamics when the initial state lacks any long-range -axis CDW, such as in DyTe3 near its . Figure S7(a) shows the evolutions of mean square order parameter amplitude for the fluctuating CDWs above , mimicking the dynamics measured experimentally in Fig. 2(i). In particular, there is no observable distinction between the two competing orders because long-range order never sets in during the nonequilibrium evolution.
VII.5 Evolution of correlation lengths
We can further infer the correlation length of fluctuating CDW patches from the transverse correlation function . In equilibrium, the corresponding transverse correlation length increases as one approaches from above and remains divergent in the symmetry-broken phase, as expected in a second-order phase transition [33]. In Fig. S6(e), are shown for several representative time delays, corresponding to the simulated dynamics in Fig. S6(b). Right after the second pulse, the distribution shifts to higher momenta, indicating a reduction of the CDW correlation length in the real space ( ps). As both CDWs develop in amplitude, their correlation lengths also grow in a symmetric manner ( ps). Finally, as long-range order along the -axis develops, the correlation functions of the two CDWs depart and the -axis order loses its phase coherence ( ps).
From the correlation function , we can extract a correlation length , whose reciprocal is indicated by the triangles in Fig. S6(e). In the simulation, is taken as the centroid of up to an ultraviolet cutoff, though the exact definition is not important. The qualitative change in the correlation lengths of the respective CDWs is summarized by the schematic in Fig. S6(f); the quantitative change of is captured in Fig. S6(c). In general, photoexcitation decreases the correlation length; the amount of suppression positively scales with the fluence. The recovery of the correlation lengths are predicted to follow a scaling law at long time delays [33], hence a longer recovery time is expected for a larger suppression.
VII.6 Correlation between photoinduced a-axis CDW and equilibrium fluctuations
To study how the equilibrium fluctuations affect the light-induced -axis CDW, we vary the stiffness parameter, in Eq. (S10), to adjust the strength of the equilibrium fluctuations. Recall that due to the symmetry between the - and -axes, we set , so fluctuations in both axes are equally affected. A small stiffness implies a large deviation from the mean-field behavior near and hence significant order parameter fluctuations are expected. Indeed, at a fixed temperature above , Fig. S8(b) shows that smaller stiffness leads to a larger CDW diffuse scattering intensity in our calculation. Turning to the nonequilibrium situation, we plot in Fig. S8(a) the evolutions of diffraction intensity change for the light-induced -axis CDW at several stiffness values at a fixed temperature below . For comparison, these traces are normalized by their equilibrium values before photoexcitation, and are vertically displaced for clarity. As stiffness decreases, the light-induced order strengthens, as summarized in Fig. 3(b). This relationship hints that the transient CDW order is closely tied to the degree of order parameter fluctuations in equilibrium, as we discussed in the main text.
VII.7 Codevelopment of competing orders
An important experimental observation is the codevelopment of competing orders in LaTe3, best illustrated by the dynamics following the second pump pulse [Fig. 2(j)]. This is very well captured by our simulation in Fig. S6(b)(c). The timespan of this stage of concurrent growth increases with the pump fluence (Fig. S5). A corollary is that the lifetime of the transient CDW would appear to be prolonged by an increasing pulse fluence. Therefore, a long-lasting photoinduced order does not necessarily imply a protracted absence of the competing order; rather, both could experience a slowing-down in their dynamics.
The observed transient symmetry between the two CDWs also distinguishes our theoretical model from the previous work in ref. [55], where a similar model-A-based approach has been utilized to investigate the nonequilibrium dynamics of two competing orders. In ref. [55], it is assumed that the two orders have very different relaxation rates [ in Eq. (S17)], giving rise to the possibility of transient development of a metastable subdominant order at the cost of suppressing the dominant one. By contrast, here we encounter a regime where both order parameters have similar relaxation timescales, resulting in the intriguing effect of a concurrent development after photoexcitation.
VIII Fluctuations in the dominant CDW
We argued in the main text that the photoinduced -axis CDW lacks long-range order and consists solely of order parameter fluctuations. Given the symmetry between the - and -axes, one would expect large photoinduced fluctuations in the dominant CDW as well. Even though it is experimentally challenging to isolate the fluctuation dynamics in the -axis CDW peak given the dominant photoinduced intensity change from the collapse of long-range order, there is experimental evidence that hints at the existence of its fluctuations. For example, time-resolved X-ray diffraction detects no appreciable broadening of the -axis peak upon photoexcitation [44, 56]. By contrast, time-resolved electron diffraction reports a significant increase in the peak width [52, 5]. The differences between X-ray and electron scattering are twofold. The former has much superior momentum resolution, so the resolution-limited peak in X-ray diffraction only captures contribution from the long-range order. In Te3, the long-range order peak can be as sharp as less than Å-1 in width [22], at least 100 times narrower than typical diffuse peaks [57]. In the presence of the long-range order peak, the weak intensity and large momentum spread hence make diffuse peaks hard to detect in high-resolution X-ray diffraction. On the other hand, the cross section of electron diffraction at comparable energy is orders-of-magnitude larger [58], so it is more sensitive to the weak diffuse background. Therefore, the apparent contradiction between time-resolved X-ray and electron diffraction can be interpreted as evidence for photoinduced order parameter fluctuations. They do not affect the width of the long-range order peak but would broaden the diffuse scattering peak when CDW correlation length decreases after photoexcitation, as correctly predicted by our theoretical simulation [Fig. S6(c)].
Another piece of evidence that hints at the proliferation of -axis fluctuations is the persistence of satellite diffraction signal even at very high fluence, which is expected to completely suppress the long-range -axis CDW [Figs. 1(g), 2(h), S4(b), and S5(b)] [44, 56, 4]. It was previously thought that a mismatch between photon-pumped and electron-probed volumes contributes to the residual intensity at . Our findings suggest that at least part of the observed satellite intensity under strong photoexcitation originates from enhanced fluctuations. Similar to a nonvanishing residual intensity in time-resolved diffraction, the CDW gap measured in time- and angle-resolved photoemission experiments also seems to persist at high fluence [59, 52]. The finite gap size was interpreted as transient improvement of the nesting condition of the Fermi surface [59]. In light of our analysis, the residual gap could be caused by short-range -axis fluctuations induced by photoexcitation, resembling the pseudogap found in equilibrium [60, 61].
IX Comparison of photoexcited and critical states
In a photoexcited state where long-range order transiently vanishes, we have shown that the system and its dynamical response closely resemble the critical state near , which is earmarked by nearly identical CDW fluctuations along both the - and -axis.
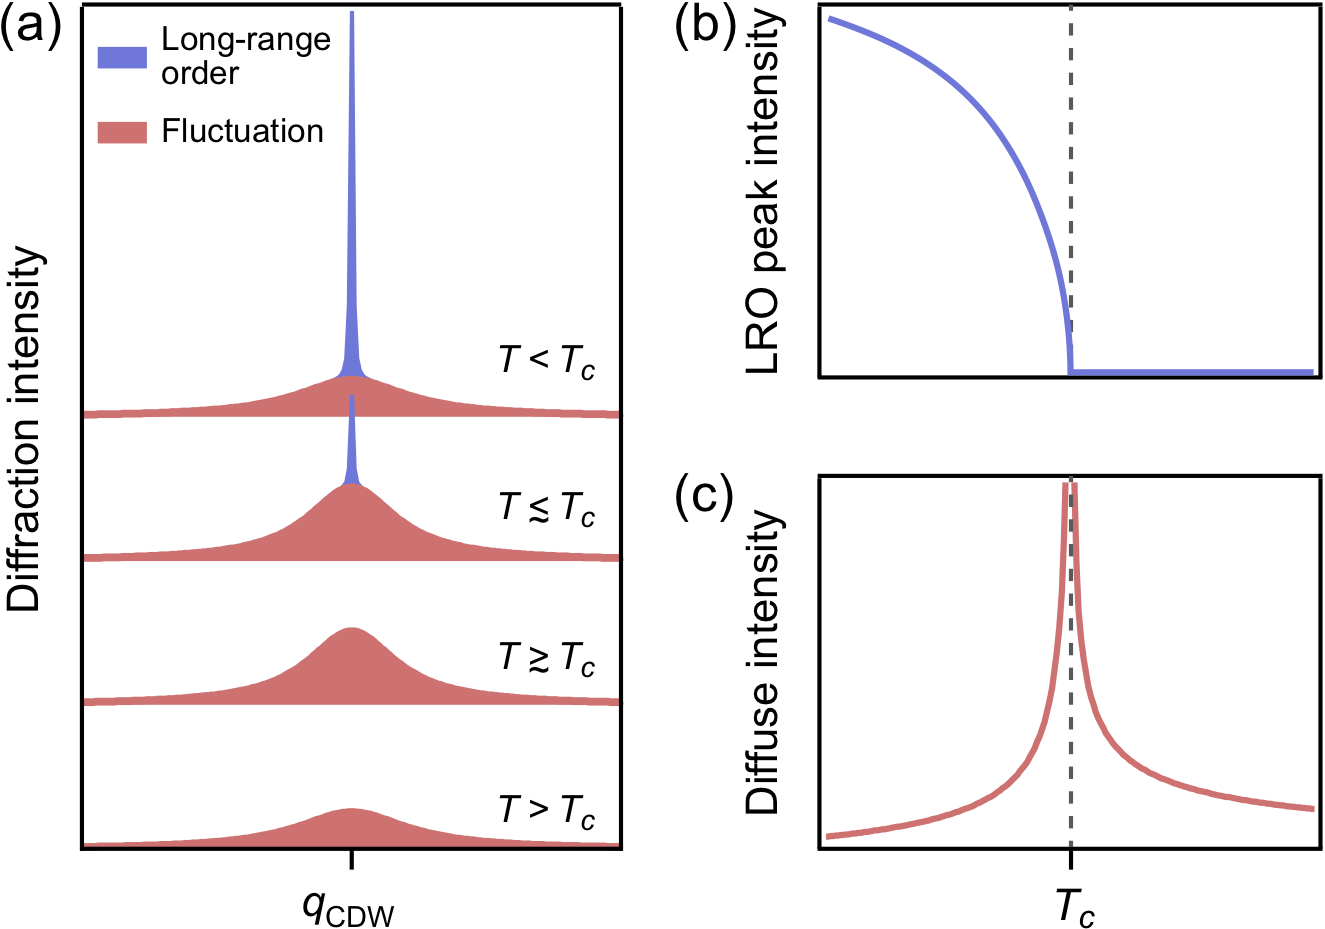
The analogy between photoexcited and critical state motivates a connection between the respective control knob: pump laser fluence and temperature. In the model, both quantities are used to adjust the phenomenological parameter [see Eq. (S10)], which determines whether the potential energy has minima away from the origin. However, the effect of a larger fluence should not be confused with a higher temperature. In equilibrium, critical fluctuations only develop close to and subside at either higher or lower temperatures. This behavior is summarized by the schematic of temperature-dependent long-range order and diffuse peaks in a typical charge density wave compound in Fig. S9. By leveraging previous results from inelastic X-ray scattering experiments [21], we can explicitly compute the intensity of the diffuse peaks due to the CDW fluctuations. As shown in Fig. S10, the energy of the soft phonon along the -axis reaches a minimum at . Correspondingly, the diffuse spot intensity is the most pronounced, calculated using the formalism in Sec. II. Either above or below , the soft phonon frequency increases significantly, leading to suppressed diffuse intensities away from as well.
The picture is different if we replace temperature with pump laser fluence. As long as sufficient fluence is provided to suppress the long-range order, order parameter fluctuations will continue to grow with increasing fluence until a saturation point is reached, which is set by the electron density near the Fermi level [Figs. S5(a) and S6(b)]. This distinction can be understood by the different shapes of the free energy profile at and after photoexcitation. The former features a flat profile, which allows thermal fluctuations to develop. Away from , the flat potential disappears, accounting for the weakened fluctuations. On the other hand, a photoexcited state has a fast evolving energy landscape. The amount of light-induced fluctuations are not tied to a specific shape of the free energy at a particular point in the temporal evolution. Instead, they are determined by the initial change in the free energy, which is set by the pump laser fluence.
The different origins of order parameter fluctuations in and out of equilibrium also dictate their different correlation lengths. Our calculation shows that the correlation of photoinduced fluctuations remains short-range. Larger laser fluence or an additional pump pulse only serves to further decrease the correlation length [Fig. S6(c)]. In sharp contrast, correlation length diverges near , which follows the universal scaling law that governs the phase transition. The notion of universality is, however, not restricted to equilibrium transitions. The close resemblance between photoexcited state and critical state also encourages one to search for universal scaling behavior in systems far from equilibrium. Theoretical simulations have made several concrete predictions of time- and momentum-scalings for light-induced order parameter fluctuations [33], which can be tested in future experiments.
X Experimental indicators of order parameter fluctuations
Based on the positive correlation between equilibrium and photoinduced fluctuations in Figs. 3 and S8, we suggested in the main text that one should look for material classes with strong order parameter fluctuations in equilibrium as candidate platforms to search for “hidden” photoinduced states. In our theoretical model, the amount of fluctuations is tuned by the stiffness parameter, , in Eq. (S10). Here, we provide some experimental guidance in characterizing the degree of fluctuations in equilibrium, which depends on the nature of the order parameter in question.
In superconductors, a common method to characterize the strength of superconducting fluctuations is the Nernst signal above , which is used to study, for example, underdoped cuprates [62] and amorphous superconducting films [63]. More recently, the Nernst effect is also evidenced in quasi-2D organic molecular metals -(BEDT-TTF) [16, 64], which are found to exhibit light-induced superconductivity above their equilibrium [3]. By comparing different members in this organic metal family, Buzzi and coworkers revealed that the light-induced superconductivity does not exist unless the Nernst signal is present above in equilibrium [65]. This finding suggests that superconducting fluctuations in equilibrium are strong indicators of the photoinduced superconductivity in this compound, lending further support to our outlook of searching for exotic states of matter in a nonequilibrium setting.
We can further quantify the degree of fluctuations in a superconductor by comparing a few temperature scales. The fluctuations above represent pre-formed Cooper pairs that do not have long-range phase coherence. In a BCS-like three-dimensional superconductor with low disorder, the Ginzburg criterion dictates that fluctuations are not experimentally accessible because they are only present very close to . For low-dimensional, disordered or non-BCS superconductors, strong fluctuations can exist above . One practical indicator for the fluctuation strength is the ratio of , where is the Cooper-pairing temperature and is the zero resistance temperature [66]. Experimentally, can be extracted from the spectral gap opening temperature in angle-resolved photoemission spectroscopy (ARPES) or it can be approximated by the mean-field pairing temperature from specific heat measurements [67]. A higher ratio is therefore a strong hint for larger superconducting fluctuations.
In a charge density wave compound, the fluctuations manifest as diffuse scatterings due to the soft phonons at temperatures well above , such as in Te3 studied in the present work, or other compounds including 1-TiSe2 [57], 2-NbSe2 [68], and ZrTe3 [69]. These CDW materials typically possess a quasi-1D or quasi-2D structure, where the reduced dimensionality leads to significant fluctuations in a regime above and below the mean-field transition temperature [70]. In this temperature range, short-range CDWs form along 1D chains or within 2D planes, but chains or planes are not strongly coupled, preventing the formation of long-range order. These short-range CDWs give rise to diffuse peaks in the diffraction pattern, whose intensity signifies the strength of fluctuations. Besides diffraction probes, these CDW fluctuations can also be detected in ARPES, where a suppression in the density of states at the Fermi level is observed even above [61]. The amount of suppression is a direct indicator of the strength of the CDW fluctuations.
For magnetically ordered systems, nuclear magnetic resonance (NMR) is a sensitive probe of the spin fluctuations, which modify the spin-lattice relaxation rate. This technique has been extensively applied to investigate, for example, the spin fluctuations in iron-based superconductors [71]. For an antiferromagnet, one can also adopt a similar guideline used in CDW compounds, where antiferromagnetic fluctuations above the transition temperature are detected through the diffuse peak in magnetic neutron diffraction or X-ray scattering.
XI Underlying high-energy symmetries
In the main text, we envisioned that the parallels between a photoexcited state and a critical state provides a viable pathway to attain hidden symmetries of a system. Indeed, spontaneous symmetry breaking is a low-energy property of a system. When the material is excited by a strong laser pulse, the system transiently gains access to its high-energy symmetries without passing through the transition temperature. If a crystal melts or disintegrates before its equilibrium is reached, photoexcitation provides an alternative passage to access the high-symmetry regime. For Te3, the underlying symmetry between its - and -axis CDW is recovered: Given the experimental resolution, the two CDW fluctuations cannot be distinguished by their wavevector, diffuse intensity, or temporal evolution. It is worth noting that the unit cell of Te3 has a weak anisotropy between the two in-plane axes and it lacks symmetry due to a glide plane [Fig. 1(a)]. The restored fourfold symmetry is hence exclusive to the CDWs, whose enhanced fluctuations overcome the anisotropy of the lattice structure.
An enticing prospect of nonthermal access to the underlying high-energy state is the discovery of symmetries corresponding to some hidden order parameters, which could in principle be manipulated and investigated with pump-probe experiments. In particular, in systems that harbor competing phases, an ultrafast pulse could be a promising route to unveil subdominant order that is suppressed in equilibrium. This mechanism has been proposed for light-induced superconductivity at the expense of CDWs in cuprates [1] and a light-induced ferromagnetic metal out of an antiferromagnetic insulator in strained manganites [72, 73]. As experimental techniques progress, we could also test ideas like the theory of high- superconductivity by observing photoinduced fluctuations of both -wave order parameter and antiferromagnetism [74, 75]. Ultimately, an ultrafast laser pulse would allow us to construct a “nonequilibrium phase diagram”, which contains hidden symmetries that are otherwise inaccessible.