Evolution of electronic structure of Ru-doped single-crystal iridiates, Sr2Ir1-xRuxO4
Abstract
We investigated Ru-doped single-crystal 5 iridiates, Sr2Ir1-xRuxO4, at three different doping concentrations ( 0.01, 0.07 and 0.10) using optical spectroscopy. The undoped pristine compound (Sr2IrO4) is known as a novel = 1/2 Mott insulator. Remarkably, the optical conductivity spectra of all three samples exhibited the insulating behavior, although we observed weak Drude components in the optical conductivity spectra down to the lowest temperature of 30 K. The charge-carrier densities of the Ru-doped iridiates estimated from the Drude components are significantly smaller than the expected values estimated from the nominal Ru-doping concentrations. Herein, we provide temperature- and doping-dependent electronic structure evolution of Ru-doped iridiates. We expect that our results will be useful for understanding the intriguing Ru-doping-dependent properties of 5 iridiate Sr2IrO4.
pacs:
78.20.-e, 78.30.-j, 78.40.-qI Introduction
A 5 ternary compound, Sr2IrO4, was discovered many years agoJohn J. Randall et al. (1957). Since then, 5 transition metal (iridium) oxides have been extensively investigatedCava et al. (1994b); Moon et al. (2008); Kim et al. (2008); Moon et al. (2009); Kim et al. (2009); Lee et al. (2012); Ye et al. (2013); Sohn et al. (2014); Clancy et al. (2014); Cao et al. (2016). Because the 5 transition metal oxides exhibit a significantly larger bandwidth than that of 3 metal oxides, the Coulomb interaction is reduced and the spin-orbit coupling enhanced. These differences may spawn interesting new electronic ground states of 5 transition metal oxides because of the three competing energy scales of bandwidth (), Coulomb repulsion (), and spin-orbit coupling (). Appropriate doping can be used to control these electronic tuning parametersLee et al. (2012). By replacing 5 Ir atom with 4 Ru, the band-filling (hole doping), , and the ratio of the Coulomb repulsion to the bandwidth () through structural distortion () and orbit extension difference () can be tunedSubramanian et al. ; Lee et al. (2012). An optical spectroscopic study on Ru-doped Sr2IrO4 (Sr-214) thin films at room temperature was performed and it provided interesting doping-dependent electronic evolutionsLee et al. (2012). In a recent optical study on La-doped Sr-214 ((Sr1-xLa)2IrO4) single crystals, pesudogap effects were observed below the onset temperature of short-range antiferromagnetic order and the anomalous charge dynamics were attributed to the electronic correlationsSeo et al. (2017). In another optical study on La-doped Sr-214 single crystals, a soft collective mode and a Drude mode were observed simultaneously in over 10% La-doped Sr-214 and part of its Fermi surface was ungapped at low temperaturesWang et al. (2018). Other studies have been performed on Rh-doped Sr-214Clancy et al. (2014); Cao et al. (2016). One may expect that these Rh-doped Sr-214 systems are isovalently doped. However, studies revealed that Rh-doped Sr-214 became hole-doped owing to the introduction of Rh3+/Ir5+. An intriguing question is whether doped Sr-214 can be used as a platform for superconductivity. A study on angle-resolved photoemission spectroscopy observed a gap with the -wave symmetry in electron-doped Sr-214de la Torre et al. (2015); Kim et al. (2016). However, superconductivity has not been clearly observed in doped Sr-214. A Raman study on Ru-doped Sr-214 systems revealed that a small percentage of Ru-doping had a strong effect on spin excitations and lattice dynamicsGlamazda et al. (2014). An optical spectroscopy study on Ru-doped Sr-214 single crystals may provide interesting new information, particularly on Ru-doping-dependent evolutions of charge-carrier density and electronic structure.
In this study, we investigated Ru-doped Sr-214 single crystals, Sr2Ir1-xRuxO4 ( 0.01, 0.07, and 0.10), using optical spectroscopy. Optical spectroscopy is a suitable experimental technique for studying the charge-carrier dynamics, electronic ground state, and electronic structures of a particular material system. We expected that the hole-doping level of Sr-214 could be controlled by Ru-doping because the 4 Ru atom has one less electron than the 5 Ir atom. However, our results indicate that the doping effect is negligibly small in terms of charge-carrier density. The charge-carrier densities obtained from measured optical spectra were significantly smaller than those estimated using the energy dispersive spectrometry (EDS) technique. However, we obtained the Ru-doping-dependent electronic band structure evolution of Sr-214 from the results of Drude-Lorentz model analysisWooten (1972); Tanner (2019) and discussed about the electronic band structure evolution.
II Experiments
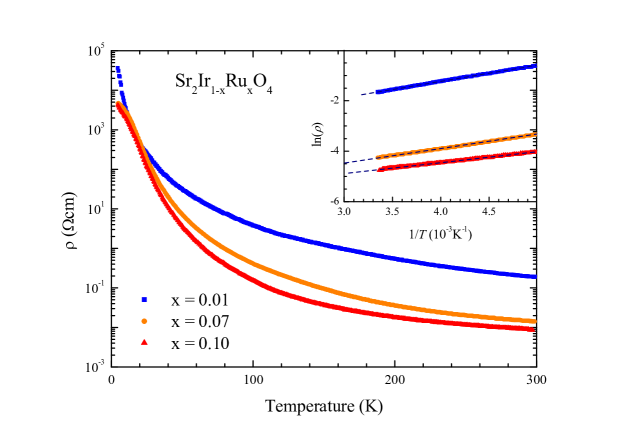
High-quality single crystals of Sr2Ir1-xRuxO4 ( = 0.01 , 0.07, and 0.10) were grown using a self-flux methodKim et al. (2009). To verify Ru concentrations of Sr2Ir1-xRuxO4 crystals, the energy dispersive spectrometry (EDS) technique was employed using a JEOL-7800F (JEOL Ltd.) field emission scanning electron microscope equipped with an energy dispersive x-ray spectrometer working at 5.0 kV. The estimated Ru concentrations were 0.0180.002, 0.0700.005, and 0.1040.011, respectively, for the samples with 0.01, 0.07 and 0.10. The sample with 0.01 shows a larger concentration than the nominal one. DC resistivity data were measured using a conventional 4-point probe technique and a physical property measurement system (PPMS, Quantum Design, Inc.). The measured DC resistivity data of the all three samples are shown in Fig. 1, which interestingly exhibit insulating temperature-dependent behavior. In the inset, we show the Arrhenius plots of the DC resistivity data of the three samples in a temperature range from 300 to 200 K. From the Arrhenius plot, we estimated the activation energy . The estimated are 55, 50, and 37 meV for the samples with 0.01, 0.07, and 0.10, respectively. The prepared single crystals were considerably small ( 1 mm2 area) and brittle. The size of the sample became smaller as the doping increased. However, because the surfaces of all samples were flat and bright, we could obtain reliable spectra. Because the size of Ru ion is similar to that of Ir ion, the unit cell volume with respect to Ru-doping remains within 0.5% up to 10% Ru-doping concentrations Cava et al. (1994b). Therefore, all three samples had the same crystal symmetry: a tetragonal symmetry (space group /a)Torchinsky et al. (2015).
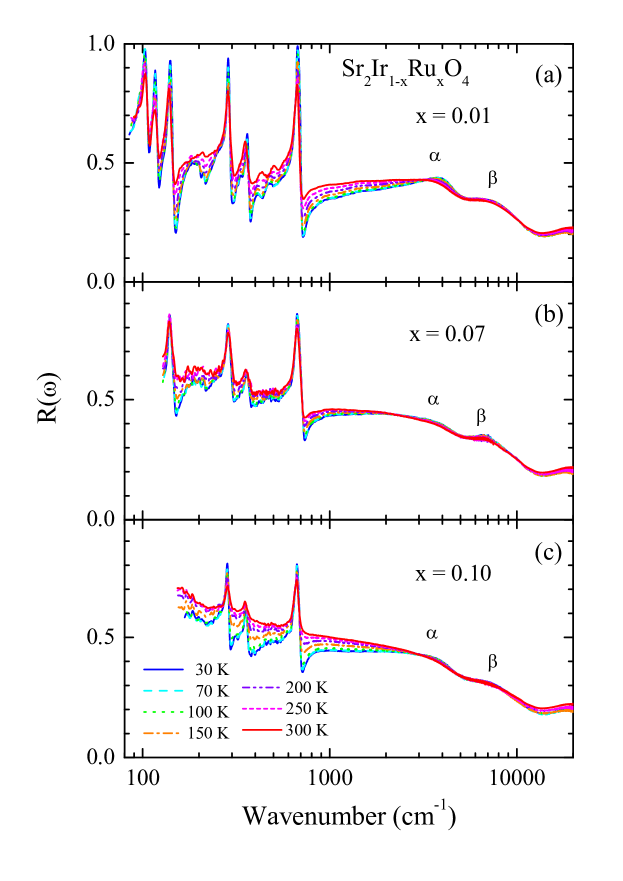
We measured near-normal reflectance spectra in the spectral range from 80 to 13,000 cm-1 at several selected temperatures from 30 to 300 K using a commercial Fourier-transform infrared spectrometer (Bruker Vertex 80v) and a continuous liquid helium flow cryostat. To obtain accurate reflectance spectra in a wide spectral range up to 20,000 cm-1, we employed an in-situ gold/aluminum evaporation techniqueHomes et al. (1993). We obtained reflectance spectra of the sample with 0.01, which was the largest sample, from 8000 to 20,000 cm-1 at the selected temperatures, and used the measured reflectance spectra to extend the data up to 20,000 cm-1 for all three samples. We note that, for samples with 0.07 and 0.10, the extensions to 20,000 cm-1 were approximates; we used them just for the Kramers-Kronig analysis. The measured reflectance spectra of the three samples at various selected temperatures are shown in Fig. 2. Because the size of the sample became smaller with increasing the doping the low-frequency cutoff of the measured spectra was 150 cm-1 for the highest doped (10%) sample due to the diffraction limit. As we expect from the DC resistivity data, all three samples exhibited insulating temperature-dependent behavior; the reflectance at the low-frequency region below 2000 cm-1 was enhanced as the temperature increased. The overall reflectance was enhanced as the doping increased. However, the doping-dependent enhancement of reflectance at low-frequency region is not very dramatic, comparing to that of 3 transition metal oxides such as cupratesUchida et al. (1991). We used the well-developed Kramers-Kronig analysis to obtain the phase of the reflection coefficient from the measured reflectance. For performing the Kramers-Kronig analysis, the measured spectrum should be extrapolated to zero and infinity Wooten (1972). For the extrapolation to zero, we employed the Hagen-Rubens relation, i.e., , using the measured DC resistivity data, (see Fig. 1). For the extrapolation to infinity, we used from 20,000 to cm-1 and above cm-1 we assumed the free electron behavior, i.e., . We obtained the complex optical conductivity using the Fresnel formula and well-known relationships between the optical constantsWooten (1972); Tanner (2019).
III Results and discussion
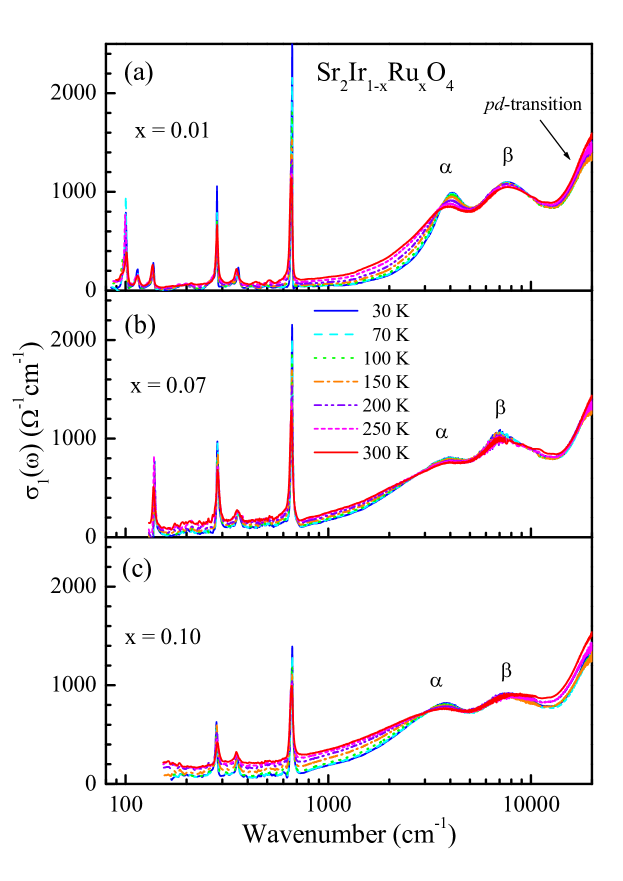
Fig. 3 shows the optical conductivity spectra of our three samples (Sr2Ir1-xRuxO4: 0.01, 0.07, and 0.10) at various selected temperatures from 30 to 300 K. The overall level of the optical conductivity in the high frequency region above 10,000 cm-1 is slightly higher than that of undoped Sr-214 obtained using an ellipsometrySohn et al. (2014). It is worth to be noted that the optical conductivity in the high frequency region can be influenced by extrapolations to infinity for the Kramers-Kronig analysis. Below 10,000 cm-1, we observed two prominent interband transitions, which were previously observed in undoped Sr-214Kim et al. (2008). We also observed another interband transition above 15,000 cm-1, which has been observed and assigned as a -transitionSohn et al. (2014). We adopted the previous naming of the two prominent modes. We denoted them as (near 4000 cm-1) and (near 7500 cm-1) modes. These modes appear owing to the strong spin-orbit-coupling () in Sr-214, which splits the orbital into = 1/2 and 3/2 orbitals, and the Coulomb repulsion (), which splits the half-filled = 1/2 state into the lower Hubbard band (LHB) and upper Hubbard band (UHB)Kim et al. (2008); Kuriyama et al. (2010). Therefore, the ground state of the undoped Sr-214 is insulating. The mode has been identified as the optical transition from the occupied = 1/2 LHB to the unoccupied = 1/2 UHB and the mode as the transition from the occupied = 3/2 band to the unoccupied = 1/2 UHB. Undoped Sr-214 has been known as a = 1/2 Mott insulator. In a previous studyLee et al. (2012), measured optical spectra at room temperature of Ru-doped Sr-214 thin films exhibited strong Drude components, indicating that the 1/2 LHB is partially filled by charge carriers introduced by Ru-doping. However, as shown in Fig. 3, the optical conductivity spectra of Ru-doped Sr-214 single crystals were significantly different from those in a previous optical study on Ru-doped Sr-212 thin filmsLee et al. (2012). In the previous study, a thin film with a continuous doping gradient was prepared on a substrate using a pulsed laser deposition; different spots in the film have different doping levels. The optical conductivity was estimated through a numerical subtraction of the substrate contribution using an approximate formulaOkazaki et al. (2006). The resulting conductivity spectra may contain unexpected uncertainty, which may result from the subtraction process. Additionally, the measured spectra might be affected by some extrinsic effects such as a lattice mismatch between the thin film and substrate. In fact, one earlier study demonstrated that the strain could be used to tune the electronic bandwidth, which caused changes in the overall electronic band diagramNichols et al. (2013); Bhandari et al. (2019). However, the causes of differences between the two data sets obtained from thin films and single crystals have not been clearly understood yet.
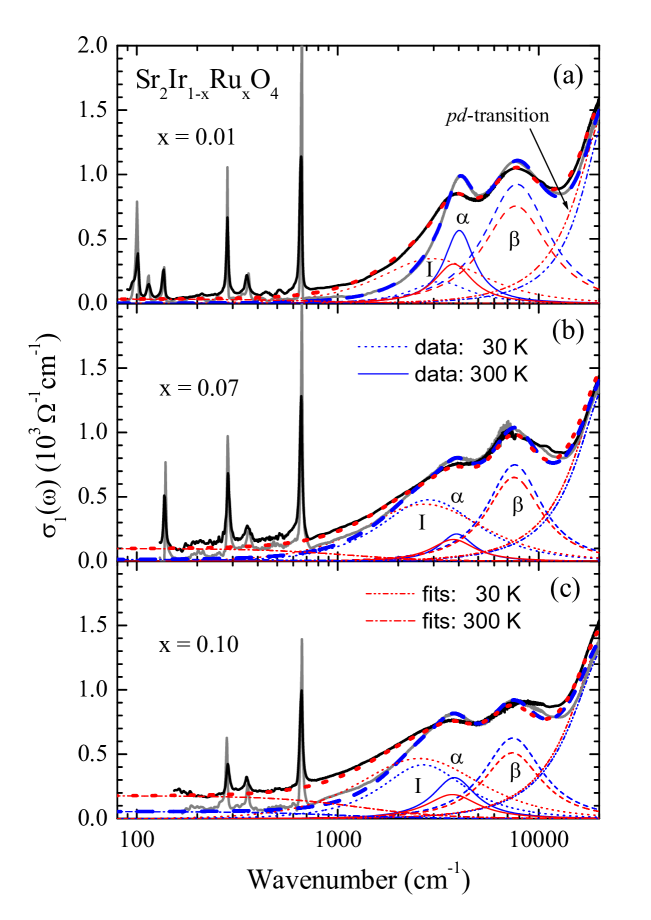
Fig. 4 shows the optical conductivity spectra and Drude-Lorentz model fits of our three samples at two representative temperatures, 30 and 300 K. In the Drude-Lorentz model, the real part of the optical conductivity can be expressed as
| (1) |
where is the Drude plasma frequency and is the elastic impurity scattering rate. , , and are the center frequency, strength, and width (or damping parameter) of the th Lorentz oscillator, respectively. Ru-doping introduces another new mode below the mode, which was observed and interpreted as an inner-gap excitation in previous optical studies on Ru-doped Sr-214 thin filmsLee et al. (2012) and La-doped Sr-214 single crystal samplesSeo et al. (2017); Wang et al. (2018). For the fitting, we used one Drude mode, three (, , and ) Lorentz modes, and one additional interband transition located at the high frequency region, known as a -transitionSohn et al. (2014). Here, we denote the inner-gap excitation as the mode. Similar inner-gap excitations have been observed in 3 transition metal oxides when they are dopedImada et al. (1998). This new mode may be related to the famous mid-infrared absorption in cupratesUchida et al. (1991); Quijada et al. (1999). The absorption can be explained as the incoherent component of the spectral weight of charge carriers induced by a strong correlationHwang et al. (2008). However, the origin of the inner-gap excitation in Ru-doped Sr-214 systems is not clearly known yet. We separately show the Drude mode, the three prominent Lorentz modes, and the -transition in Fig. 4. We ignored the sharp phononic absorption peaks located in the low-frequency region below 800 cm-1 for these fittings.
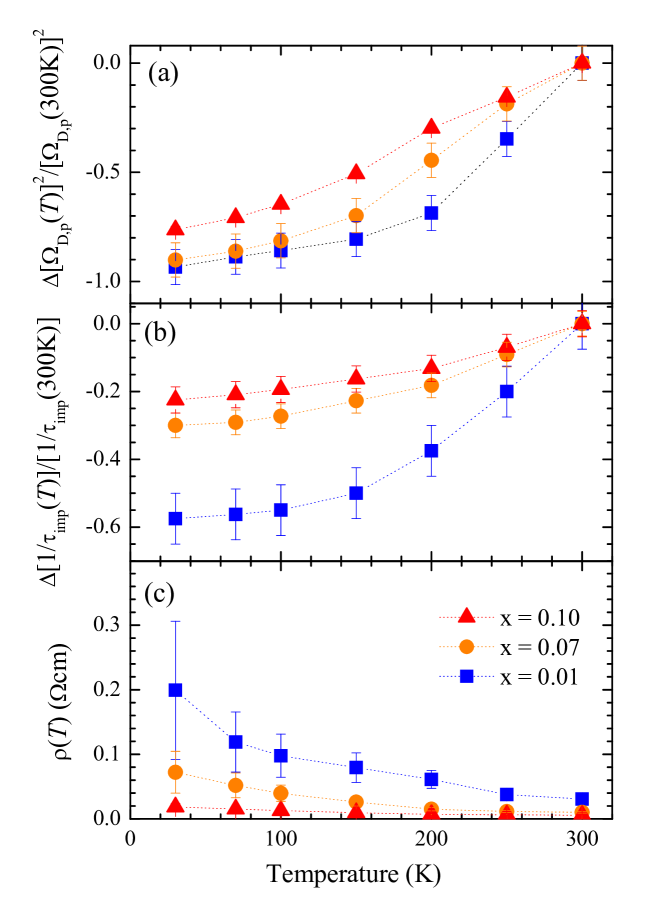
In Fig. 5(a) and 5(b), we show normalized relative temperature-dependencies, and , of two fitting parameters (plasma frequency and impurity scattering rate) of the Drude mode for the three Ru-doped samples ( 0.01, 0.07, and 0.10). The normalized relative temperature-dependencies are defined by and . Pairs of and are 1250 and 800, 2550 and 1100, and 3700 and 1290 cm-1, for the three samples with = 0.01, 0.07, and 0.10, respectively. The Drude plasma frequencies of all three samples exhibit significant temperature dependencies. The plasma frequency squared, , which is proportional to the charge-carrier density, monotonically increases with raising the temperature, probably due to thermal excitations. In general, the plasma frequency of a good metal is independent of temperature. The impurity scattering rates of all three samples decrease with lowering the temperature, which is a generic temperature-dependent trend of the impurity scattering rate of a good metal. Both plasma frequency and impurity scattering rate increase with the Ru-doping. Using these two Drude fitting parameters, we estimated dc resistivity (), i.e., . The estimated dc resistivity data of the three samples are shown as functions of temperature in Fig. 5(c). The obtained dc resistivity data of all three samples exhibit insulating temperature-dependent behavior, which is consistent with the directly measured DC resistivity data shown in Fig. 1. We can see huge discrepancy in low temperatures between the two sets of DC resistivity data. At low temperatures, the Drude component is very (or almost too) weak to get reasonable fitting parameters. Therefore, the very weak Drude component may cause the huge discrepancy between the two sets of the DC resistivity data at low temperatures.
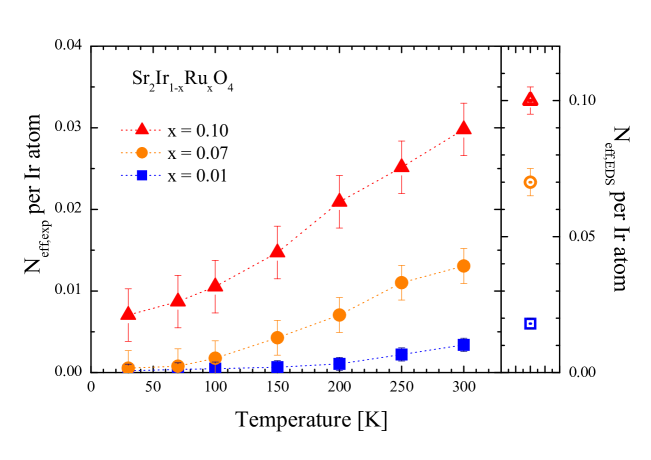
Fig. 6 shows the effective charge-carrier number per Ir atom, , of the three Ru-doped Sr-214 samples obtained from the Drude plasma frequencies. The the effective charge-carrier number per Ir atom () can be estimated using the relationship between the plasma frequency and carrier density, i.e., , where is the electron mass, the elementary charge, and the volume per one formula unit. The experimentally estimated exhibited strong Ru-doping and temperature dependencies. As the temperature increased, significantly increased due to the thermal excitation effect, which are closely related to the small activation energies estimated from the DC resistivity data (see the inset of Fig. 1). The estimated were significantly smaller than the expected ones (), which were estimated using the EDS technique. The estimated by the EDS are shown in the narrow frame on the right in Fig. 6, where the vertical axis scale is around 3 times larger than that of the main frame. This kind of discrepancy between the estimated values from the optical spectroscopy and EDS technique can be observed between two infrared studies of La-doped Sr-214 system (Sr2-yLayIrO4)Seo et al. (2017); Wang et al. (2018). The related problem of doping may be seen between two samples (Sr2-yLayIrO4 with = 0.1 and 0.18) in an optical studyWang et al. (2018). It is not clear why the estimated is significantly smaller than the EDS one. A possible interpretation of this low charge-carrier density may be associated with the effective mass. For the estimation, we considered the mass of charge carriers as the bare electron mass; however, the mass can be enhanced owing to the correlations. Typically, the spectral weight is divided into two components (coherent and incoherent) owing to the correlationHwang et al. (2008); Basov et al. (2011). Here, the Drude spectral weight () can be approximately that of the coherent component, and the total spectra weight can be the EDS spectral weight (). With these values at 30 K, we obtained the coupling constants (), which can be defined as . The coupling constants of the three samples are 459, 1287, and 14.2 for the samples with 0.01, 0.07, and 0.10, respectively), which seemed to be way too large. Hence, other unknown doping-related phenomena may exist in Ru-doped Sr-214, as in the Rh-doped Sr-214Clancy et al. (2014); Cao et al. (2016).
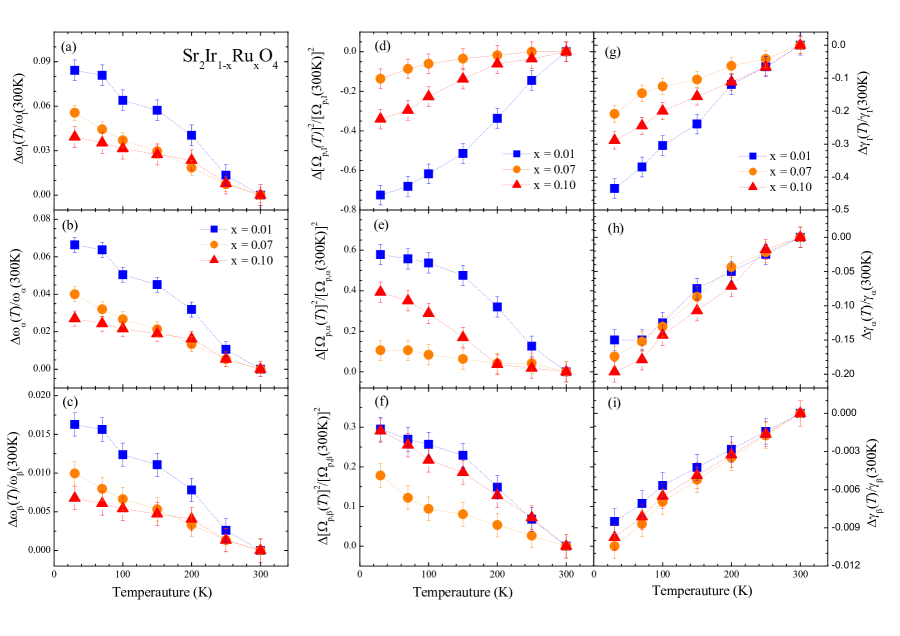
Fig. 7 shows the doping- and temperature-dependent fitting parameters of three Lorentz (, , and ) modes for the three samples. We took a relative value to the value at 300 K and normalized with the value at 300 K, i.e., , where is a representative quantity. The temperature-dependent properties of the and modes of undoped Sr-214 have been previously reported in the literatureMoon et al. (2009); Sohn et al. (2014). Our sample at the lowest doping concentration exhibited a similar temperature-dependence as that reported previously. As the temperature increases, the mode shifts to a lower frequency. The temperature-dependent trend remains the same as that of undoped Sr-214 (Fig. 7(b)). As the Ru-doping increases, the mode shifts to a lower frequency as well (see Table I). The and modes exhibit similar doping- and temperature-dependent trends as the mode. Similar doping-dependent shifts of the and modes were observed in a recent optical study on La-doped Sr-214Seo et al. (2017). We also observe that the temperature-dependent shift of the mode () is twice that of mode (), as reported in a previous paperSohn et al. (2014), i.e.,. A previous study proposed that the observed shift ratio between the two interband ( and ) transition energies is associated with the electron-phonon couplingSohn et al. (2014). This energy shift ratio between the and modes is not dependent on Ru-doping. We note that (see Table I). At each temperature, all three modes shifts to a lower frequency as the doping increases (see Table I). The normalized relative temperature-dependent strength () (d-f) and damping parameters (g-i) of the three Lorentz modes are shown in the right two columns in Fig. 7. We also provide all fitting parameters of the three Lorentz modes at 300 K in Table I. We observe systematic temperature-dependent trends of the strength and damping parameter. However, as we can see in Table I, the strength of the mode increases with the Ru-doping, while those of both and modes decrease, which are similar doping-dependent trends in the strengths of the three Lorentz modes observed in La-doped Sr-214 systemsSeo et al. (2017). With lowering the temperature, the intensity of mode decreases, while those of both and modes increase, indicating that the spectral weight of the mode shifts to the and modes. All three damping parameters monotonically decrease with lowering the temperature, which is a general temperature-dependent trend of the damping parameter.
| samples | |||||||||
|---|---|---|---|---|---|---|---|---|---|
| = 0.01 | 2970 | 3770 | 7675 | 9700 | 6050 | 17350 | 4600 | 2000 | 7060 |
| 0.07 | 2700 | 3750 | 7530 | 11300 | 4850 | 15200 | 4800 | 2300 | 5750 |
| 0.10 | 2550 | 3700 | 7400 | 11200 | 5550 | 12662 | 4500 | 2800 | 6150 |
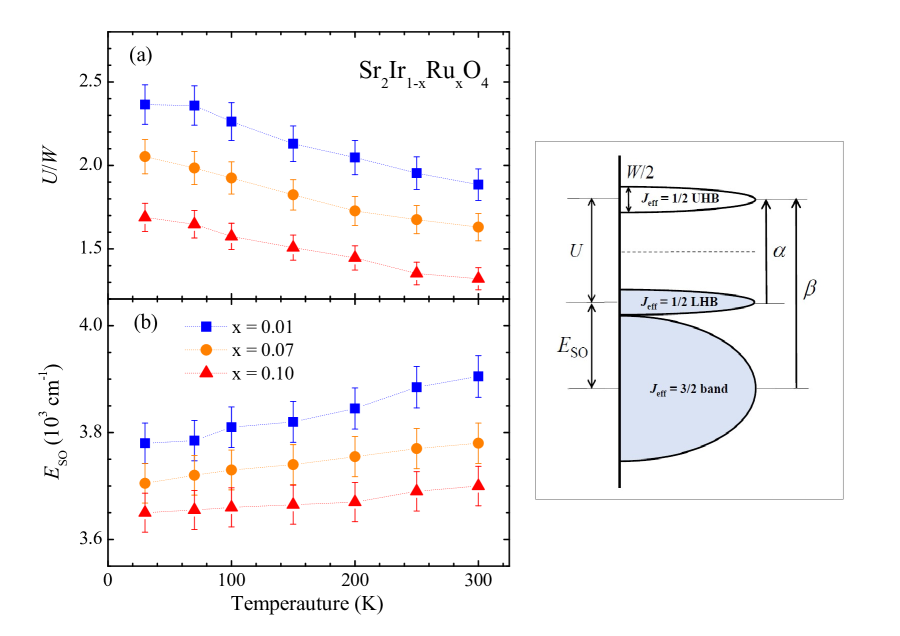
Fig. 8 shows the temperature-dependent ratio of the Coulomb repulsion to the bandwidth () and the spin-orbit coupling energy () for the three samples. As shown in the schematic band diagram in the right figure, is the same as the center frequency of the mode and is the same as the width of the mode. is obtained from the center frequencies of and modes, i.e., . The schematic band diagram is based on our optical results. As the temperature increases, decrease because the thermal broadening of the mode makes larger and the shifting to lower energy of the mode makes smaller (see Fig. 7(b) and (h)). As the doping increases, also significantly decreases because the center frequency of the mode decreases while its width increases with increasing the doping as shown in Table I. As the temperature increases, increases because the temperature-dependent changes between the and modes is different; the center frequency of the mode decreases less than that of the mode as we discussed in the previous paragraph, i.e., . As doping increases, decreases because the center frequency of the mode decreases more than that of the mode with increasing the doping as shown in Table I, which is consistent with a previously reported oneLee et al. (2012).
IV Conclusions
We measured reflectance spectra of three differently Ru-doped Sr-214 single crystal samples. We obtained the optical conductivity spectra of the three samples from the measured reflectance spectra using the Kramers-Kronig analysis. We fitted the optical conductivity spectrum with the well-known Drude-Lorentz model. The charge-carrier number per Ir atom estimated from the Drdue plasma frequency was significantly smaller than the expected value estimated from the nominal doping concentration. The origin of low charge-carrier number has not yet been understood. All three samples exhibited insulating temperature-dependent behavior, indicating that the electronic ground state is insulating. Three major interband optical transitions (, , and ) were observed. From the Drude-Lorentz fitting parameters, we obtained temperature- and Ru-doping-dependent and . With increasing temperature, the decreased while increased. With increasing doping, both and decreased. We hope that our experimental results will be useful for understanding the physical properties of Ru-doped Sr-214 systems.
Acknowledgements.
J.H. acknowledges financial support from the National Research Foundation of Korea (NRF-2017R1A2B4007387 and 2021R1A2C101109811). The work at Yonsei University was supported by the National Research Foundation of Korea (grant numbers NRF-2017R1A5A1014862 (SRC program: vdWMRC center), NRF-2019R1A2C2002601, and NRF-2021R1A2C1006375).References
- John J. Randall et al. (1957) J. John J. Randall, L. Katz, and R. Ward, J. Am. Chem. Soc. 79, 266 (1957).
- Cava et al. (1994a) R. J. Cava, B. Batlogg, K. Kiyono, H. Takagi, J. J. Krajewski, J. W. F. Peck, J. L. W. Rupp, and C. H. Chen, Phys. Rev. B 49, 11890 (1994a).
- Moon et al. (2008) S. J. Moon, H. Jin, K. W. Kim, W. S. Choi, Y. S. Lee, J. Yu, G. Cao, A. Sumi, H. Funakubo, C. Bernhard, and T. W. Noh, Phys. Rev. Lett. 101, 226402 (2008).
- Kim et al. (2008) B. J. Kim, H. Jin, S. J. Moon, J.-Y. Kim, B.-G. Park, C. S. Leem, J. Yu, T. W. Noh, C. Kim, S.-J. Oh, J.-H. Park, V. Durairaj, G. Cao, , and E. Rotenberg, Phys. Rev. Lett. 101, 076402 (2008).
- Moon et al. (2009) S. J. Moon, H. Jin, W. S. Choi, J. S. Lee, S. S. A. Seo, J. Yu, G. Cao, T. W. Noh, and Y. S. Lee, Phys. Rev. B 80, 195110 (2009).
- Kim et al. (2009) B. J. Kim, H. Ohsumi, T. Komesu, S. Sakai, T.Morita, H. Takagi, and T. Arima, Science 323, 1329 (2009).
- Lee et al. (2012) J. S. Lee, Y. Krockenberger, K. S. Takahashi, M. Kawasaki, and Y. Tokura, Phys. Rev. B 85, 035101 (2012).
- Ye et al. (2013) F. Ye, S. Chi, B. C. Chakoumakos, J. A. Fernandez-Baca, T. Qi, and G. Cao, Phys. Rev. B 87, 140406(R) (2013).
- Sohn et al. (2014) C. H. Sohn, M.-C. Lee, H. J. Park, K. J. Noh, H. K. Yoo, S. J. Moon, K. W. Kim, T. F. Qi, G. Cao, D.-Y. Cho, and T. W. Noh, Phys. Rev. B 90, 041105 (2014).
- Clancy et al. (2014) J. P. Clancy, A. Lupascu, H. Gretarsson, Z. Islam, Y. F. Hu, D. Casa, C. S. Nelson, S. C. LaMarra, G. Cao, and Y.-J. Kim, Phys. Rev. B 89, 054409 (2014).
- Cao et al. (2016) Y. Cao, Q. Wang, J. A. Waugh, T. J. Reber, H. Li, X. Zhou, S. Parham, S.-R. Park, N. C. Plumb, E. Rotenberg, A. Bostwick, J. D. Denlinger, T. Qi, M. A. Hermele, G. Cao, and D. S. Dessau, Nat. Commun. 7, 11367 (2016).
- (12) M. Subramanian, M. Crawford, R. Harlow, T. Ami, J. Fernandez-Baca, Z. Wang, and D. Johnston, Physica C: Superconductivity 235.
- Seo et al. (2017) J. H. Seo, G. H. Ahn, S. J. Song, X. Chen, S. D. Wilson, and S. J. Moon, Scientific Reports 7, 10494 (2017).
- Wang et al. (2018) K. Wang, N. Bachar, J. Teyssier, W. Luo, C. W. Rischau, G. Scheerer, A. de la Torre, R. S. Perry, F. Baumberger, and D. van der Marel, Phys. Rev. B 98, 045107 (2018).
- de la Torre et al. (2015) A. de la Torre, S. M. Walker, F. Y. Bruno, S. Ricco, Z. Wang, I. G. Lezama, G. Scheerer, G. Giriat, D. Jaccard, C. Berthod, T. K. Kim, M. Hoesch, E. C. Hunter, R. S. Perry, A. Tamai, and F. Baumberger, Phys. Rev. Lett. 115, 176402 (2015).
- Kim et al. (2016) Y. K. Kim, N. H. Sung, J. D. Denlinger, and B. J. Kim, Nat. Phys. 12, 37 (2016).
- Glamazda et al. (2014) A. Glamazda, W.-J. Lee, K.-Y. Choi, P. Lemmens, H. Y. Choi, N. Lee, and Y. J. Choi, Phys. Rev. B 89, 104406 (2014).
- Wooten (1972) F. Wooten, Optical Properties of Solids (Academic, New York, 1972) (Note: Key material on page 176).
- Tanner (2019) D. B. Tanner, Optical effects in solids (Cambridge Univ. Press, 2019).
- Cava et al. (1994b) R. J. Cava, B. Batlogg, K. Kiyono, H. Takagi, J. J. Krajewski, W. F. P. Jr., L. W. R. Jr., and C. H. Chen, Phys. Rev. B 49, 11890 (1994b).
- Torchinsky et al. (2015) D. H. Torchinsky, H. Chu, L. Zhao, N. B. Perkins, Y. Sizyuk, T. Qi, G. Cao, and D. Hsieh, Phys. Rev. Lett. 114, 096404 (2015).
- Homes et al. (1993) C. C. Homes, M. A. Reedyk, D. A. Crandles, and T. Timusk, Appl. Opt. 32, 2976 (1993).
- Uchida et al. (1991) S. Uchida, T. Ido, H. Takagi, T. Arima, Y. Tokura, and S. Tajima, Phys. Rev. B 43, 7942 (1991).
- Kuriyama et al. (2010) H. Kuriyama, J. Matsunoa, S. Niitaka, M. Uchida, D. Hashizume, A. Nakao, K. Sugimoto, H. Ohsumi, M. Takata, and H. Takagi, Appl. Phys. Lett. 96, 182103 (2010).
- Okazaki et al. (2006) K. Okazaki, S. Sugai, Y. Muraoka, and Z. Hiroi, Phys. Rev. B 73, 165116 (2006).
- Nichols et al. (2013) J. Nichols, J. Terzic, E. G. Bittle, O. B. Korneta, L. E. D. Long, J. W. Brill, G. Cao, and S. S. A. Seo, Appl. Phys. lett. 102, 141908 (2013).
- Bhandari et al. (2019) C. Bhandari, Z. S. Popovic, and S. Satpathy, New J. Phys. 21, 013036 (2019).
- Imada et al. (1998) M. Imada, A. Fujimori, and Y. Tokura, Rev. Mod. Phys. 70, 1039 (1998).
- Quijada et al. (1999) M. A. Quijada, D. B. Tanner, R. J. Kelley, M. Onellion, H. Berger, and G. Margaritondo, Phys. Rev. B 60, 14917 (1999).
- Hwang et al. (2008) J. Hwang, J. Yang, J. P. Carbotte, and T. Timusk, J. Phys. Condens. Matter 20, 295215 (2008).
- Basov et al. (2011) D. N. Basov, R. D. Averitt, D. van der Marel, M. Dressel, and K. Haule, Rev. Mod. Phys 83, 471 (2011).