Strangeness neutral equation of state with a critical point
Abstract:
We formulate a family of equations of state for Quantum Chromodynamics that exhibit critical features and obey the charge conservation conditions present in heavy-ion collisions (HICs). This construction utilizes the first-principle Lattice QCD (LQCD) results up to by matching the Taylor coefficients at each order. The criticality of the equation of state (EoS) is implemented based on the well-established principle of universal scaling behavior, where QCD belongs to the 3D Ising Model universality class. The critical point can be placed in a range of temperature and baryonic chemical potential relevant for the Beam Energy Scan II at RHIC. Furthermore, the strength of the critical features can be varied as well. This flexibility is embedded in four free parameters, that could potentially be constrained by the experimental data. We will discuss the features and versatility of our EoS, as well as present the relevant thermodynamic quantities which are important for hydrodynamical simulations of HICs.
1 Introduction
The equation of state (EoS) for Quantum Chromodynamics (QCD) plays a crucial role in the search for a proposed critical endpoint in the QCD phase diagram. The EoS is needed as input in the hydrodynamic simulations that describe the system created during HICs [1, 2]. The determination of the QCD equation of state and phase diagram at finite density from first principles is currently limited, due to the Fermi sign problem. To support the RHIC experimental effort, theoretical predictions on the location of the critical point [3, 4, 5, 6, 7, 8, 9, 10] and its effect on observables [11, 12, 13] have recently been developed and explored. Along those lines, a family of equations of state, which agree with the one from lattice QCD in the density regime where it is available,as well as including a critical point in the 3D Ising model universality class (the one expected for QCD) has been developed within the framework of the BEST collaboration [14, 15]. This approach provides an EoS in a region of the phase diagram relevant for Beam Energy Scan physics. Furthermore, the location of the critical point and the strength of the critical region can be chosen by the user. This approach can thus be constrained through comparisons with the experimental data from Beam Energy Scan II. This EoS has already been in use for the study of out-of-equilibrium approaches to the QCD critical point [16, 17], the sign of the kurtosis [12], and to calculate transport coefficients [18].
2 Methodology
In order to study the effect of a critical point on QCD thermodynamics, we utilized the principle of universality classes to map the critical behavior onto the phase diagram of QCD. The 3D Ising model is the correct choice for this approach because it exhibits the same scaling features in the vicinity of a critical point as QCD, which is to say that they belong to the same universality class [19, 20]. We implemented the non-universal mapping of the 3D Ising model onto the QCD phase diagram in such a way that the final pressure agrees with Lattice QCD results on the EoS where they are available. This prescription can be summarized as follows:
-
1.
Parametrize the 3D Ising model in the vicinity of the critical point, as previously done in the literature [21, 22, 23, 14],
(1) where the magnetization , the magnetic field , and the reduced temperature , are functions of the external parameters and . The normalization constants for the magnetization and magnetic field are and , respectively, and are critical exponents in the 3D Ising Model, and ).
-
2.
Map the critical point onto the QCD phase diagram via a linear map from {, } to {} at a location :
(3) (4) where and are the angles between the axes of the QCD phase diagram and the Ising model ones and and are scaling parameters for the Ising-to-QCD map.
-
3.
Reduce the number of free parameters in the non-universal mapping from six to four, by placing the critical point along the chiral phase transition line, such that the axis of the Ising model is tangent to the transition line of QCD at the critical point:
(5) The choice we made for the critical point here was {=143.2 MeV, =350 MeV}, with angular parameters =3.85°and =93.85°, and scaling parameters =1 and =2. It is important to note that such a choice of parameters only has an illustrative purpose. We do not, by making this choice, claim any prediction for the location of the critical point or the size of the critical region. Here, we seek to provide an estimate of the effect of critical features on heavy-ion-collision systems, and leave the freedom of choice of the parameters to the users. An additional comment regarding the scaling parameters is in order: varying the parameters and will increase or decrease the effects of the critical point [14, 24, 12]. In order to reduce the parameter space, we are relying on experimental data from the BES-II to constrain the parameters and narrow down the location of the critical point.
-
4.
Calculate the Ising model susceptibilities and perform the matching of the Taylor expansion coefficients order by order to Lattice QCD results at . This yields a non-Ising, or background, pressure, which is, by construction, the difference between the lattice and Ising contributions:
(6) 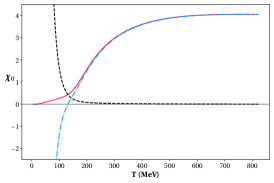
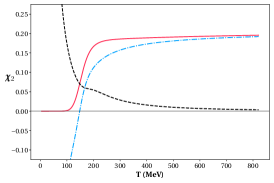
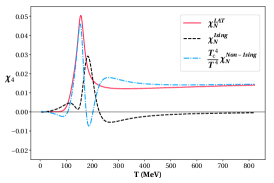
Figure 1: Taylor expansion coefficients of the pressure up to (). The critical contributions from the Ising Model (black, dashed lines) are compared to the lattice QCD results (red, solid lines), which determines the non-critical terms (blue, dot-dashed lines) as detailed in Eq. (6). -
5.
Reconstruct the full pressure as the sum of critical and non-critical components
(7) where is the singular part of pressure that has been mapped onto the QCD phase diagram as described in steps 1 and 2.
-
6.
Merge the full pressure from step 5 with the pressure from the ideal HRG model, calculated using the SMASH hadronic list, at low temperatures in order to smoothen any non-physical artifacts of the Taylor expansion. We utilize the hyperbolic tangent for this smooth merging:
(8) where acts as the switching temperature and is the overlap region where both pieces contribute. The merging is performed along a line parallel the QCD transition line with an overlap region of =17 MeV.
-
7.
Calculate thermodynamic quantities as derivatives of the pressure from step 6.
For a thorough description of this procedure, including an investigation of the parameter space and further discussion, we refer the reader to the original development of this EoS in Ref. [14]. More details on the implementation of strangeness neutrality can be found in Ref. [15].
We also calculate the correlation length as given in the 3D Ising model. For this quantity, we only provide the critical contribution as the authors are not aware of a calculation of the QCD correlation length on the lattice yet. We adopt the procedure from Refs. [25, 26, 22], which follows Widom’s scaling form in terms of Ising model variables:
| (9) |
where is a constant with the dimension of length, which we set to 1 fm, = 0.63 is the correlation length critical exponent in the 3D Ising Model, is the scaling function and the scaling parameter is =. This scaling function takes two forms in the -expansion and asymptotic formulations, which must be merged at an appropriate value of the scaling parameter, according to Ref. [22]. Further details on this procedure can be found in Ref. [15].
3 Results
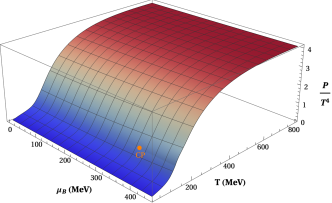
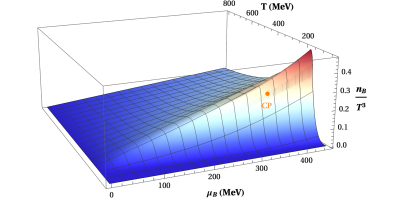
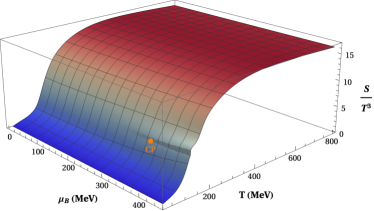
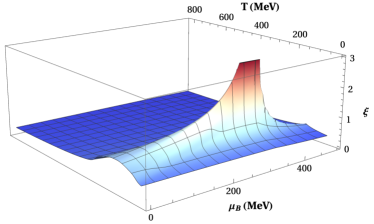
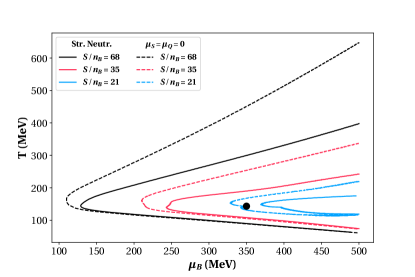
The results for the final thermodynamics are shown in Figs. 2 and 3 along with the calculation of the correlation length. The location of the critical point is indicated in each of the plots of the thermodynamics to guide the reader to the critical region. The pressure itself is a smooth function of {T,} in the crossover region and shows a slight kink for chemical potentials larger than . The derivatives of the pressure help to reveal the features of the critical region, as shown for the baryon density and entropy. In the right panel of Fig. 3, the critical contribution to the correlation length, calculated as described in section 2, is shown in the QCD phase diagram. The smoothly merged correlation length is uniform everywhere in the phase diagram, except in the critical region. Near the critical point the correlation length increases and then diverges at the critical point itself, following the expected scaling behavior. We also calculated the isentropic trajectories in the phase diagram, as shown in Fig. 4, and note that these curves, in particular, show the importance of incorporating the constraints on the conserved charges present in HICs.
4 Conclusions
We provide an equation of state that obeys the experimental conserved charge conditions of strangeness neutrality and fixed baryon-number-to-electric-charge ratio to be used in hydrodynamic simulations of HICs. In addition to probing the slice of the 4D QCD phase diagram covered by the experiments, the equation of state can also be coupled to the SMASH hadronic afterburner because it exclusively includes the hadronic list from that framework [27]. Furthermore, we provide a calculation of the critical correlation length, which exhibits the expected scaling behavior and is important for the calculation of the critical scaling of transport coefficients near the critical point.
5 Acknowledgments
This material is based upon work supported by the National Science Foundation under grants no. PHY1654219, PHY-2116686 and OAC-2103680 and the National Science Foundation Graduate Research Fellowship Program under Grant No. DGE-1746047, and by the US-DOE Nuclear Science Grant No. DE-SC0020633, and within the framework of the Beam Energy Scan Topical (BEST) Collaboration. We also acknowledge the support from the Center of Advanced Computing and Data Systems at the University of Houston. P.P. acknowledges support by the DFG grant SFB/TR55.
References
- [1] V. Dexheimer, J. Noronha, J. Noronha-Hostler, C. Ratti and N. Yunes, Future Physics Perspectives on the Equation of State from Heavy Ion Collisions to Neutron Stars, 2010.08834.
- [2] A. Monnai, B. Schenke and C. Shen, QCD Equation of State at Finite Chemical Potentials for Relativistic Nuclear Collisions, 2101.11591.
- [3] R. Critelli, J. Noronha, J. Noronha-Hostler, I. Portillo, C. Ratti and R. Rougemont, Critical point in the phase diagram of primordial quark-gluon matter from black hole physics, Phys. Rev. D 96 (2017) 096026 [1706.00455].
- [4] A. Bazavov et al., The QCD Equation of State to from Lattice QCD, Phys. Rev. D 95 (2017) 054504 [1701.04325].
- [5] M. D’Elia, G. Gagliardi and F. Sanfilippo, Higher order quark number fluctuations via imaginary chemical potentials in QCD, Phys. Rev. D 95 (2017) 094503 [1611.08285].
- [6] S. Borsányi, Z. Fodor, M. Giordano, S.D. Katz, A. Pasztor, C. Ratti et al., High statistics lattice study of stress tensor correlators in pure SU(3) gauge theory, Phys. Rev. D 98 (2018) 014512 [1802.07718].
- [7] Z. Fodor and S.D. Katz, Critical point of QCD at finite T and mu, lattice results for physical quark masses, JHEP 04 (2004) 050 [hep-lat/0402006].
- [8] C.S. Fischer and J. Luecker, Propagators and phase structure of Nf=2 and Nf=2+1 QCD, Phys. Lett. B 718 (2013) 1036 [1206.5191].
- [9] S. Borsanyi, Z. Fodor, J.N. Guenther, R. Kara, S.D. Katz, P. Parotto et al., QCD Crossover at Finite Chemical Potential from Lattice Simulations, Phys. Rev. Lett. 125 (2020) 052001 [2002.02821].
- [10] W.-j. Fu, J.M. Pawlowski and F. Rennecke, QCD phase structure at finite temperature and density, Phys. Rev. D 101 (2020) 054032 [1909.02991].
- [11] X. An, G. Başar, M. Stephanov and H.-U. Yee, Evolution of Non-Gaussian Hydrodynamic Fluctuations, 2009.10742.
- [12] D. Mroczek, J. Noronha-Hostler, A.R.N. Acuna, C. Ratti, P. Parotto and M.A. Stephanov, Quartic cumulant of baryon number in the presence of QCD critical point, Phys. Rev. C 103 (2021) 034901 [2008.04022].
- [13] M. Bluhm et al., Dynamics of critical fluctuations: Theory – phenomenology – heavy-ion collisions, Nucl. Phys. A 1003 (2020) 122016 [2001.08831].
- [14] P. Parotto, M. Bluhm, D. Mroczek, M. Nahrgang, J. Noronha-Hostler, K. Rajagopal et al., QCD equation of state matched to lattice data and exhibiting a critical point singularity, Phys. Rev. C 101 (2020) 034901 [1805.05249].
- [15] J.M. Karthein, D. Mroczek, A.R. Nava Acuna, J. Noronha-Hostler, P. Parotto, D.R.P. Price et al., Strangeness-neutral equation of state for QCD with a critical point, Eur. Phys. J. Plus 136 (2021) 621 [2103.08146].
- [16] T. Dore, J. Noronha-Hostler and E. McLaughlin, Far-from-equilibrium search for the QCD critical point, Phys. Rev. D 102 (2020) 074017 [2007.15083].
- [17] Y. Hama, T. Kodama and W.-L. Qian, Two-particle correlations at high-energy nuclear collisions, peripheral-tube model revisited, J. Phys. G 48 (2021) 015104 [2010.08716].
- [18] E. McLaughlin, J. Rose, T. Dore, P. Parotto, C. Ratti and J. Noronha-Hostler, Building a testable shear viscosity across the QCD phase diagram, 2103.02090.
- [19] R.D. Pisarski and F. Wilczek, Remarks on the Chiral Phase Transition in Chromodynamics, Phys. Rev. D 29 (1984) 338.
- [20] K. Rajagopal and F. Wilczek, Static and dynamic critical phenomena at a second order QCD phase transition, Nucl. Phys. B 399 (1993) 395 [hep-ph/9210253].
- [21] R. Guida and J. Zinn-Justin, 3-D Ising model: The Scaling equation of state, Nucl. Phys. B 489 (1997) 626 [hep-th/9610223].
- [22] C. Nonaka and M. Asakawa, Hydrodynamical evolution near the QCD critical end point, Phys. Rev. C 71 (2005) 044904 [nucl-th/0410078].
- [23] M. Stephanov, On the sign of kurtosis near the QCD critical point, Phys. Rev. Lett. 107 (2011) 052301 [1104.1627].
- [24] A. Bzdak, S. Esumi, V. Koch, J. Liao, M. Stephanov and N. Xu, Mapping the Phases of Quantum Chromodynamics with Beam Energy Scan, Phys. Rept. 853 (2020) 1 [1906.00936].
- [25] E. Brezin, J. Le Guillou and J. Zinn-Justin, Phase Transitions and Critical Phenomena, in Phase Transitions and Critical Phenomena.
- [26] B. Berdnikov and K. Rajagopal, Slowing out-of-equilibrium near the QCD critical point, Phys. Rev. D 61 (2000) 105017 [hep-ph/9912274].
- [27] H. Petersen, D. Oliinychenko, M. Mayer, J. Staudenmaier and S. Ryu, SMASH – A new hadronic transport approach, Nucl. Phys. A 982 (2019) 399 [1808.06832].