Decoherence and Revival in Attosecond Charge Migration Driven by Non-adiabatic Dynamics
Attosecond charge migration is a periodic evolution of the charge density of a molecule on a time scale defined by the energy intervals between the electronic states involved. Here, we report the observation of charge migration in neutral silane (SiH4) in 690 as, its decoherence within 15 fs, and its revival after 40-50 fs using X-ray attosecond transient absorption spectroscopy. The migration of charge is observed as pairs of quantum beats with a characteristic spectral phase in the transient spectrum. The decay and revival of the degree of electronic coherence is found to be a result of both adiabatic and non-adiabatic dynamics in the populated Rydberg and valence states. The experimental results are supported by fully quantum-mechanical ab-initio calculations that include both electronic and nuclear dynamics. We find that conical intersections can mediate the transfer of electronic coherence from an initial superposition state to another one involving a different lower-lying state. Operating on neutral molecules, our methods define a general approach to the key phenomena underlying attochemistry.
1 Introduction
Charge migration in molecules is a purely electronic process driven by a coherent superposition of electronic states, which can appear due to a broadband excitation (?, ?) or electron correlation (?, ?, ?). The time scales of charge migration are therefore directly defined by the inverse of the electronic states’ energy separations (?, ?). Since the electronic states constituting a superposition state typically have differently shaped potential-energy surfaces (PES), charge migration has been predicted to decohere rapidly because nuclear wavepackets evolving on different electronic states modulate the vertical energy interval or lose overlap in internal-coordinate or momentum space (?, ?, ?, ?). Decoherence of charge migration results in a fading of the periodic charge rearrangement, and thus, together with non-adiabatic population transfer, to a more permanent transfer of the charge (?, ?), which can lead to bond-specific dissociation (?, ?). As such, decoherence and non-adiabatic coupling are the key links between charge migration, that is by definition periodic in the few-states limit, and charge transfer, which is central to the further evolution of the induced dynamics and its final outcome (?, ?, ?, ?).
The experimental observation of molecular charge migration remains a formidable challenge. Previous experiments have reported the reconstruction of attosecond charge migration in ionized iodoacetylene from high-harmonic spectroscopy (?) and the observation of 4 fs quasi-periodic dynamics in the photofragmentation yield of ionized phenylalanine (?). These early results have triggered considerable theoretical activity (?, ?, ?), which has also studied the role of nuclear dynamics in charge migration (?, ?, ?, ?, ?).
Here, we describe the first observation of decoherence and revival of attosecond charge migration. We use the same carrier-envelope-phase-(CEP)-stable few-cycle laser pulse to both excite charge migration in a neutral molecule and generate a soft-X-ray (SXR) pulse that probes the dynamics through attosecond transient-absorption spectroscopy (ATAS, (?, ?, ?)). The choice of strong-field excitation was motivated by its sub-cycle time resolution and high excitation fractions, as compared to single-photon excitation. Whereas previous experiments on coherent superpositions of electronic states in neutral molecules have remained limited to the femtosecond time scale (?, ?) and charge-migration experiments have remained limited to molecular cations (?, ?), the present approach opens a pathway to studying charge migration in neutral molecules (?), while achieving sub-optical-cycle temporal resolution, thereby generalizing previous work on ground-state molecules (?) and doubly-excited states of helium (?). We find that the CEP-stable few-cycle pump pulse creates an electronic coherence between a valence- and a Rydberg-excited state, corresponding to a 690-as radial charge migration in SiH4. Due to the differences in the associated PES, this electronic coherence is lost in 15 fs as the vibrational wavepackets in different electronic states oscillate with different periods. The electronic coherence is found to revive after 40-50 fs, as the two nuclear wavepackets transiently recover position- and momentum-space overlap. Most interestingly, the electronic coherence is additionally found to partially transfer to a second pair of states, involving a dark valence and the same upper Rydberg-like state. Whereas the observed de- and recoherence of charge migration through electronically adiabatic vibrational dynamics have recently been predicted to occur in the iodoacetylene cation (?), we are not aware of a previous discussion of the transfer of electronic coherence, although it is related to the creation of electronic coherence at conical intersections (?, ?). Importantly, these results show that electronic coherence can not only revive after being suppressed due to nuclear motion, but can even be transferred to other electronic states through conical intersections.
2 Results and Discussion
2.1 Experimental Methodology and Results
Figure 1 presents the experimental scheme and ATAS results. A 5.2-fs CEP-stable laser pulse centered at 780 nm is used to excite silane (SiH4) molecules in the gas phase. The induced dynamics are probed by the transient absorption of an isolated attosecond pulse (with an estimated sub-200-as duration) covering the silicon L2,3-edge. The time delay between the two pulses is stabilized to 25 as using a dual laser- and white-light interferometer (?). Details on the experimental methods are given in the supplementary material (SM, Section S1).
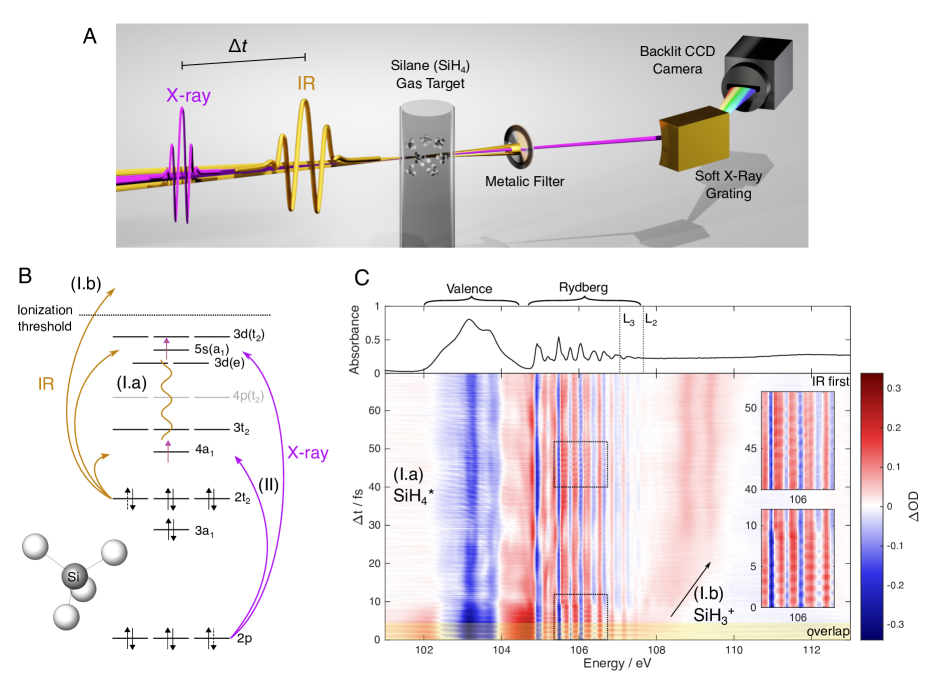
Figure 1B illustrates the excitation/probing scheme. The few-cycle pulse simultaneously excites (I.a) and ionizes (I.b) the sample. These two pathways are observed in different spectral regions, as illustrated in Fig. 1C. SiH is unstable in its electronic ground state and therefore dissociates to form SiH+H. This fragmentation process occurs within 25 fs, manifesting as the appearance of a new absorption feature centred at 108 eV which then moves to higher energy to form two absorption bands between 108.7 eV and 109.4 eV, corresponding to SiH.
Henceforth, we concentrate on pathway I.a, i.e. strong-field excitation of valence and Rydberg states of the molecule that lead to modulations of the absorption spectrum (top of Fig. 1C) between 102 and 107.5 eV. Our assignment of the static X-ray absorption spectrum of silane is based on core-valence-separated extended algebraic-diagrammatic construction through second order (CVS-ADC(2)-x) calculations shown as sticks in the top panel of Fig. 2A. The broad absorption band at 102-104 eV can be fit with four Gaussian functions, corresponding to the spin-orbit split excitations to 3t2 and 4a1 valence orbitals. The progression starting at 105 eV consists of d(e/t2)- and s-Rydberg series including vibrational structure (not included in our stick spectra), converging to the L2- and L3-edges. All of our assignments agree with previous work (?), except for the relative ordering of the 3d(e) and 5s Rydberg states.
The most remarkable observation in Fig. 1C is the clear oscillation of the optical density (OD) in the spectral regions of 102-104 eV and 105.5-107.5 eV with a period of 1.31-1.39 fs that is observed to survive from the delays where pump and probe pulses overlap (yellow shading) out to about 15 fs (lower dashed box and right-hand inset), and to transiently revive between 40 and 50 fs (upper dashed box and inset). These rapid oscillations are a signature of charge migration (?).
2.2 Identification of Quantum Beats
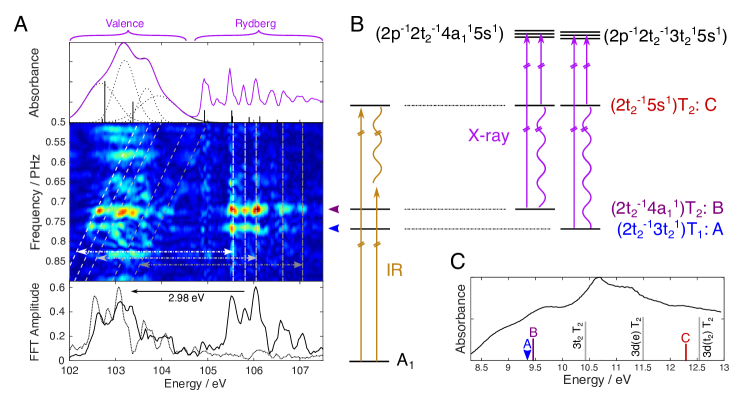
The quantum beats are spectrally analyzed in the central panel of Fig. 2A, which presents a fast Fourier transform (FFT) along the delay axis (for fs) of the ATAS results in Fig. 1C (for details, see Section S1.3). The FFT exhibits two distinct groups of frequencies at 0.720 and 0.765 PHz. Both consist of two similar sets of peaks separated by 3 eV. In ATAS, electronic coherences are expected to appear as pairs of peaks fulfilling the relation , where is the energy separation of the electronic states, the period and the frequency of the quantum beat. Using the peaks in the Rydberg region as references (vertical white-to-grey shaded lines in Fig. 2A) and tracing the corresponding diagonal lines according to , all strong FFT signals pair up. The line-out of the FFT amplitude at 0.72 PHz (bottom panel of Fig. 2A) demonstrates this more clearly. With the additional investigation of the phase of the quantum beats, discussed in section 2.5, we are able to definitively assign these quantum beats to molecular charge migration.
The spectral position of the FFT signals with respect to the ground-state absorption spectrum of silane (top of Fig. 2A) also reveals the electronic configurations of the pump-prepared electronic states. The spectral overlap of all FFT signals in the Rydberg region indicates that the higher-lying state of both the 0.72-PHz and the 0.765-PHz coherence can only consist of an excitation into the 5a1 orbital of 5s-Rydberg character. The observed spectral alignment is the consequence of the insensitivity of core-Rydberg transition energies to the valence electronic structure. By contrast, any states with 3d-Rydberg character would instead produce signals around 105.0 eV, which are not observed. The lower-lying states involved in the two coherences lie in the 102-104 eV spectral region, which uniquely identifies them as valence-excited states. Energetically, the 2t3t2 and 2t4a1 excitations are the only possible assignments, leading to the configurations given in Fig. 2B.
To relate these electronic configurations to specific valence-excited states, we performed equations-of-motion coupled-cluster singles-doubles (EOM-CCSD) calculations using an augmented correlation-consistent valence-triple-zeta (aug-cc-pVTZ) basis set (see SM, Section S2.1). The calculated electronic spectrum is compared to the measured valence-absorption spectrum of silane in Fig. 2C. The (2t5a) and (2t4a) configurations each give rise to a single state, with T2 symmetry, henceforth designated as C and B states, respectively. The (2t3t) configuration gives rise to a total of four electronic states of symmetries T1, E, A1 and T2. Among those, the T1 state is the only one to lie below the B state (see Fig. S5). Owing to its T1 symmetry, this state labelled A, is dark in the single-photon absorption spectrum. The contribution of all these valence states to the observed quantum beats is determined with the help of fully quantum simulations.
2.3 Fully Quantum Simulations of Electronic and Nuclear Dynamics
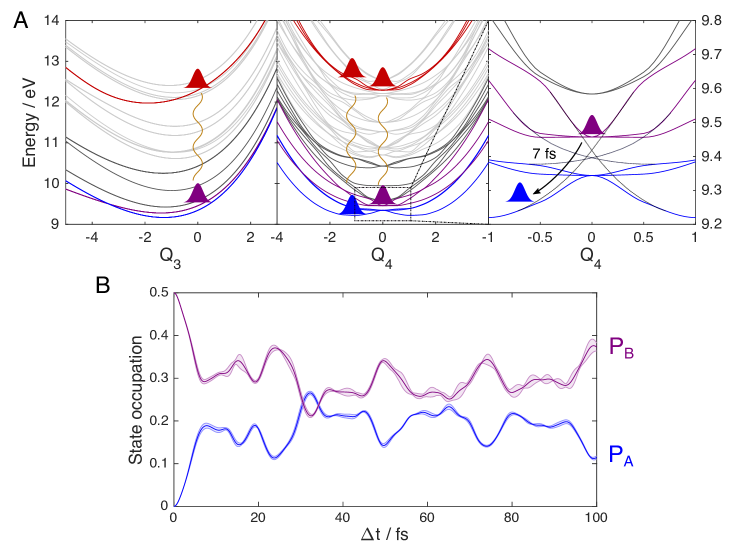
Multiconfigurational time-dependent Hartree (MCTDH) calculations (?, ?) (for details see SM, Section S2) were performed on a manifold of 15 electronic states, spanning all four vibrational stretching modes of silane. PES of the lowest 16 states were calculated (Fig. 3A) at the EOM-CCSD/aug-cc-pVTZ level. These PES were then used to fit the parameters of a second-order vibronic-coupling Hamiltonian (?) that includes both non-adiabatic and Jahn-Teller interactions. These calculations provide a fully quantum-mechanical description of electronic and nuclear dynamics. Details of these calculations are discussed in the SM, section S2.2.
The strong-field nature of the pump pulse requires a careful discussion of the influence of the initial populations on the outcome of the MCTDH calculations. Experimental fluctuations of the pump pulse were considered by varying the initial phase of the states (for details see Section S2.3) and are represented by the shaded areas in Fig. 3B and 4B. The less restrictive selection rules of multiphoton excitation compared to single-photon excitation were accounted for by studying two limiting cases. In the first case, all states contained in the MCTDH model were populated and in the second case, only the B and C states were initially populated. Details are given in the SM, Section S2.3. In both limiting cases the population in the C state remained constant over time. In the first case, the populations of the intermediate states were found to relax to the B and A states within 10 fs (Fig. S8). In addition to the BC and AC coherences, these calculations predicted additional coherences at 0.65 PHz and 0.58 PHz (see Fig. S8), which are not observed in the FFT shown in Fig. 2A. In the second limiting case, the population initially prepared in the B state, was found to relax to the A state in 7 fs (Fig. 3B). This B-A population transfer is mediated by conical intersections in the vibrational mode, shown in Fig. 3A (right) and visible in the dynamics of Movie S2. In agreement with the experiment (Fig. 2A), these calculations exclusively predict the appearance of BC and AC coherences. This comparison supports the predominant population of the B and C states by the pump pulse. The corresponding selectivity is consistent with few-cycle excitation in the strong-field regime, which results in spectral excitation windows (as further explained in SM Section S2.6), in analogy with strong-field ionization (?).
We therefore from hereon focus on the simplest model that reproduces the experimental observations – the initial population of the B and C states only. The calculated electronic coherences are shown in Fig. 4B. The BC coherence appears at , whereas the AC coherence progressively builds up, reaching a maximum around 7 fs. These results show that the electronic coherence between the B and C states is efficiently transferred to a coherence between the A and C states, mediated by the non-adiabatic population transfer from B to A.
2.4 Attosecond Charge Migration and its Revival
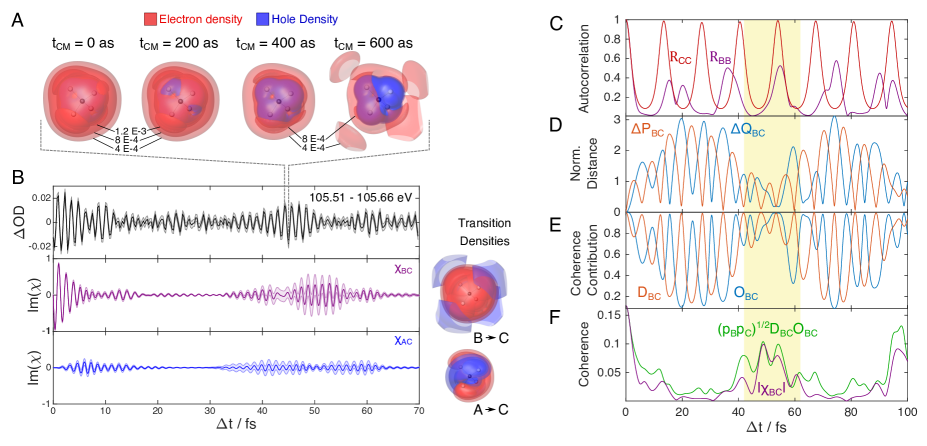
We now turn to the detailed analysis of the attosecond charge migration and its evolution on the femtosecond time scale. Figure 4B shows the OD signal averaged over the 105.51-105.66 eV energy window. The signal displays the 1.31-1.39 fs period quantum beats that have been identified in Fig. 2. The initial decoherence of the quantum beat and the revival between 40 and 55 fs are also evident. A direct comparison between the amplitudes of the experimental signal oscillation and the calculated electronic BC and AC coherences shows excellent agreement up to a small offset in the timing of the maximal revival.
The right-hand side of Fig. 4 elucidates the origin of this decay and revival of the BC coherence. Whereas it is clear that nuclear dynamics are responsible for the modulation of the coherence, the time scale of 50 fs is far longer than any vibrational periods included in the MCTDH model. As can be seen in Fig. 4C, the nuclear wavepackets in the different states complete multiple periods of vibration before the peak of the coherence revival. Whereas the dynamics on the C state are adiabatic and periodic, the wavepacket prepared on the B state exhibits non-adiabatic population transfer and therefore an autocorrelation function that does not return to its initial value.
For coherence between two electronic states and to exist, they must both hold significant populations () and their vibrational wavepackets must have a non-zero overlap not only in coordinate space (, where is the spatial separation), but also in momentum space (, where is the momentum separation). The amplitude of the total electronic coherence can indeed be expressed as (). Since these quantities are not directly accessible in the calculations, they were obtained within a Gaussian approximation to the vibrational wavepackets (?); the corresponding quantities are shown in panels D and E (for details see SM, Section S2.4). The product of the three terms () evolves similarly to the magnitude of the BC coherence, , from the MCTDH calculation but tends to slightly overestimate the latter (panel F). Furthermore, Movie S2 shows that the source of this effect is mainly the mode, as, unlike the mode, its minimum is far from the Frank-Condon region, resulting in large-amplitude motion and significant separation of the respective vibrational wavepackets. Our calculations thus show that, due to the relative curvature of the PES of the B and C states, it takes approximately 50 fs for the nuclear wavepackets to simultaneously regain coordinate- and momentum-space overlap, producing the revival.
Having identified the experimentally observed coherences, we can combine the MCTDH and EOM-CCSD calculations to reconstruct the electronic density as a function of time. The spatial shape of the charge migration is defined by the transition densities (, where is the EOM-CC density operator). The two most relevant ones are shown on the right-hand side of Fig. 4A. While the BC coherence causes charge to travel from the vicinity of the atoms to a diffuse cloud around the molecule, the AC coherence causes it to migrate between pairs of hydrogen atoms.
The time-dependent difference electron density with respect to the SiH4 ground state resulting from applying the MCTDH coherences to these transition densities is shown in Fig. 4A. has been chosen to correspond to times when the electron density is most strongly contracted around the molecule, resulting in an increase of core-Rydberg hole overlap and therefore the experimentally observed OD at 105.5 eV. The complete temporal evolution of charge migration is shown in a supplementary movie (Movie S1). The differently shaped transition densities can give rise to interesting phenomena - depending on the relative amplitude of the coherences (), the charge migration can transition from being radial to angular in nature, particularly noticeable at 40 and 60 fs in Movie S1.
2.5 Phase of Quantum Beats
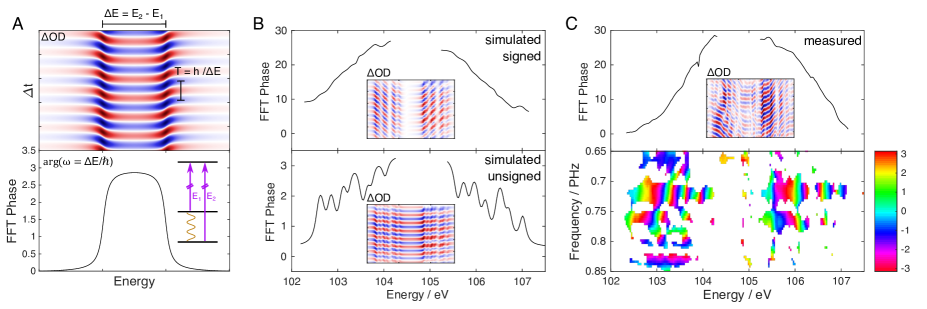
Finally, we turn to the phase of the observed electronic quantum beats and analyze their information content. Figure 5A shows the transient spectrum and associated FFT phase of a coherent 3-level system. Although the phase of the quantum beat of the two lines is equal at the peak of the OD amplitude, the phase to the sides of these maxima are mirrored, producing a characteristic ‘U’-shaped phase profile. Such a signal is clearly distinct from few-femtosecond oscillations found in XUV-pump-IR-probe ATAS measurements, where the phase is initially flat and steepens towards larger negative delays (this is most evident when a Gabor filter is applied to the data, which is discussed in section S1.3 and visible in Fig. S3).
Figure 5C shows the phase of the FFT of the BC coherence. In agreement with the 3-level system each quantum beat pair also displays mirrored phase profiles, identifying them as quantum beats. The much larger total variation of the phase in Fig. 5C compared to 5A is a result of the summation of the phase steps of spectrally adjacent core-valence transitions. The total phase variation therefore contains information, both on the number of final core-excited states and on the relative phases of the their transition-dipole moments, also known as the transition-dipole phase (TDP), a property of growing importance for attoscience (?). The signature of the TDP on the quantum beats also carries an important physical meaning; out-of-phase quantum beats are the experimental manifestation of the migration of charge. When electron-hole density migrates, its overlap with the different Rydberg orbitals changes, periodically modulating the probability of different core-valence excitation.
To demonstrate this property, ATAS simulations (?) have been performed based on the MCTDH results (Fig. 5B, see section S2.3 for details). The sensitivity of our experiment to the signs of the TDP is highlighted in Fig. 5B, which compares two simulations. The simulated transient spectra use the same absolute transition dipole values and transition energies for the A, B, and C to final core-excited state transitions, however, in the upper panel the signs of the transitions from the C state to the final states have been chosen to alternate as a function of energy (see Table S4), whereas equal signs have been used in the lower panel. Clearly, the sign alternation is required to reproduce the monotonic phase variation observed in the experiment. Moreover, the total phase variation is a signature of the number of final states. In our simulations, we have assumed 3 final states to be accessible from A, 7 from B, and all ten of them from C. This model calculation results in reasonable agreement with the experimental data, whereby the smaller calculated phase variation suggests that the number of final states is even larger in reality. This is not unexpected because of the doubly-excited (core+valence) character of the final states, but unfortunately beyond the capabilities of state-of-the-art quantum-chemical calculations. Nevertheless, this analysis demonstrates the sensitivity of ATAS to the TDP, an observable that is not accessible in conventional spectroscopy.
3 Conclusion
This work has uncovered some remarkable opportunities in molecular attosecond spectroscopy. ATAS is capable of capturing specific electronic coherences in spite of the nearly featureless valence absorption spectrum (Fig. 2C). This is a direct consequence of the high temporal resolution on one hand, and the selectivity of the SXR-ATAS observables on the other. On the observed time scales, structural dynamics are limited to a subset of high-frequency stretching modes, which enables the preparation and survival of a complex electronic wavepacket that shows decoherence and revival. This information can not be obtained from the frequency-domain spectra, which are complicated by large-amplitude motions, driven by the Jahn-Teller effect that take place on longer time scales and involve the bending modes. On the investigated time scales, the quantum system can be thought of as evolving under the action of a simplified Hamiltonian that only contains the electronic and high-frequency vibrational modes, resulting in qualitatively simpler dynamics. The specificity of the SXR-ATAS observables arises from the projection of the dynamics under scrutiny onto common sets of Rydberg-like core-excited states. Since this probe step involves core excitations from and into orbitals with weak electron correlation, they should be analogous to those of the unexcited molecule; a similarity which is key to the straightforward assignment of the dynamics. The present method can thus be expected to favorably scale towards more complex molecules, since both the time-scale and the spectral-simplification arguments are general.
Our results moreover show the possibility of preparing and observing charge migration in neutral molecules, while achieving a temporal resolution that lies significantly below the duration of the pump pulse. Specifically, we have observed the decoherence and revival of attosecond charge migration driven by structural and non-adiabatic dynamics. These results show that charge migration can not only survive coupled electron-nuclear dynamics, characteristic of excited-state dynamics in large molecules, but even be transferred to other electronic states. These observations also confirm the viability of the proposed control schemes over electronic degrees of freedom for manipulating chemical dynamics (?). An immediate extension of our results is the control over attosecond charge migration (?), its application to steer charge transfer to a desired outcome and to thereby control chemical reactivity. All of these pillars of attosecond chemistry have now come within reach of experimental capabilities.
Acknowledgments
We thank A. Schneider and M. Seiler for their technical support, D. Hammerland for laser support, D. Stefano for the coating of the Nb mirrors, J. Leitner and J. R. Mößinger for performing part of the test calculations, as well as V. Utrio Lanfaloni for the preparation of Fig. 1A. Funding D.T.M. and H.J.W. gratefully acknowledge funding from the ERC Consolidator Grant (Project No. 772797-ATTOLIQ), and from the Swiss National Science Foundation through projects 200021_172946 and the NCCR-MUST. V.D. and A.I.K. thank the DFG for the financial support provided through the QUTIF Priority Programme, and N.V.G. acknowledges the support by the Branco Weiss Fellowship—Society in Science, administered by the ETH Zürich. Authors contributions H.J.W. proposed the study. D.T.M. developed the experimental setup, performed the measurements and analyzed the data; V.D., N.V.G., and A.I.K. developed the theoretical models, and V.D. and N.V.G. carried out the calculations; H.J.W. supervised the experimental and A.I.K. the theoretical part of the project; H.J.W. and D.T.M. wrote the manuscript with input from all coauthors. Competing Interests None to declare. Data and materials availability All data needed to evaluate the conclusions in the paper are present in the paper or the supplementary materials.
Supplementary materials
Experimental methods
Theoretical modelling
Figs. S1 to S10
Tables S1 and S4
Caption for Movie S1: Electron density difference between the excited and unexcited molecule () as a function of the time delay since excitation, based on the results of the MCTDH and EOM-CCSD/aug-cc-pVTZ calculations. Nuclear motion is not displayed. The isosurfaces of the density difference have the same isovalues as in Fig. 3A. The periods of most intense attosecond charge migration are shown at a slower speed for clarity.
Caption for Movie S2: Projection of the vibrational wavepackets of all electronic states in the MCTDH model onto the symmetric and one asymmetric stretching modes. While the dynamics are clearly responsible for the diabatic population transfer, the wavepackets of this modes do not show significant motion and remain well overlapped arround the Frank-Condon region. Meanwhile, the dynamics are very periodic and show clear dephasing and then rephasing of the Rydberg and valence wavepackets around a delay of 50 fs.
References and Notes
- 1. H. Eyring, J. Walter, G. E. Kimball, Quantum chemistry (Wiley, 1944).
- 2. F. Remacle, R. D. Levine, PNAS 103, 6793 (2006).
- 3. L. S. Cederbaum, J. Zobeley, Chemical Physics Letters 307, 205 (1999).
- 4. A. I. Kuleff, L. S. Cederbaum, Journal of Physics B: Atomic, Molecular and Optical Physics 47, 124002 (2014).
- 5. P. M. Kraus, H. J. Wörner, Angew. Chem. Int. Ed. 57, 2 (2018).
- 6. H. J. Wörner, et al., Structural dynamics 4, 061508 (2017).
- 7. M. Vacher, L. Steinberg, A. J. Jenkins, M. J. Bearpark, M. A. Robb, Phys. Rev. A 92, 040502 (2015).
- 8. C. Arnold, O. Vendrell, R. Santra, Physical Review A 95, 033425 (2017).
- 9. V. Despré, N. V. Golubev, A. I. Kuleff, Physical Review Letters 121, 203002 (2018).
- 10. D. Jia, J. Manz, Y. Yang, The Journal of Physical Chemistry Letters 10, 4273 (2019).
- 11. S. Lünnemann, A. I. Kuleff, L. S. Cederbaum, Chemical Physics Letters 450, 232 (2008).
- 12. F. Remacle, R. Levine, M. A. Ratner, Chemical physics letters 285, 25 (1998).
- 13. L. Lehr, T. Horneff, R. Weinkauf, E. Schlag, The Journal of Physical Chemistry A 109, 8074 (2005).
- 14. P. M. Kraus, et al., Science 350, 790 (2015).
- 15. F. Calegari, et al., Science 346, 336 (2014).
- 16. V. Despré, et al., The Journal of Physical Chemistry Letters 6, 426 (2015).
- 17. K.-J. Yuan, A. D. Bandrauk, Phys. Chem. Chem. Phys. 19, 25846 (2017).
- 18. D. Jia, et al., Chemical Physics 482, 146 (2017).
- 19. M. Vacher, J. Meisner, D. Mendive-Tapia, M. J. Bearpark, M. A. Robb, J. Phys. Chem. A 119, 5165 (2014).
- 20. M. Lara-Astiaso, A. Palacios, P. Decleva, I. Tavernelli, F. Martín, Chemical Physics Letters 683, 357 (2017). Ahmed Zewail (1946-2016) Commemoration Issue of Chemical Physics Letters.
- 21. S. Sun, et al., The Journal of Physical Chemistry A 121, 1442 (2017). PMID: 28135094.
- 22. M. Vacher, M. J. Bearpark, M. A. Robb, J. a. P. Malhado, Phys. Rev. Lett. 118, 083001 (2017).
- 23. E. Goulielmakis, et al., Nature 466, 739 (2010).
- 24. H. Timmers, et al., Nature communications 10, 1 (2019).
- 25. Y. Kobayashi, K. F. Chang, T. Zeng, D. M. Neumark, S. R. Leone, Science 365, 79 (2019).
- 26. P. M. Kraus, et al., Phys. Rev. Lett. 111, 243005 (2013).
- 27. S. G. Walt, et al., Nat. Comm. 8, 15651 (2017).
- 28. A. D. Dutoi, L. S. Cederbaum, The Journal of Physical Chemistry Letters 2, 2300 (2011).
- 29. C. Neidel, et al., Physical Review Letters 111, 033001 (2013).
- 30. C. Ott, et al., Nature 516, 374 (2014).
- 31. M. Kowalewski, K. Bennett, K. E. Dorfman, S. Mukamel, Phys. Rev. Lett. 115, 193003 (2015).
- 32. D. Keefer, T. Schnappinger, R. de Vivie-Riedle, S. Mukamel, Proceedings of the National Academy of Sciences 117, 24069 (2020).
- 33. M. Huppert, I. Jordan, H. J. Wörner, Review of Scientific Instruments 86, 123106 (2015).
- 34. R. Püttner, M. Domke, D. Lentz, G. Kaindl, Physical Review A 56, 1228 (1997).
- 35. N. V. Golubev, J. Vaníček, A. I. Kuleff, Phys. Rev. Lett. 127, 123001 (2021).
- 36. G. Cooper, G. R. Burton, Wing Fat Chan, C. Brion, Chemical Physics 196, 293 (1995).
- 37. H.-D. Meyer, U. Manthe, L. S. Cederbaum, Chemical Physics Letters 165, 73 (1990).
- 38. H.-D. Meyer, F. Gatti, G. A. Worth, Multidimensional quantum dynamics: MCTDH theory and applications (John Wiley & Sons, 2009).
- 39. H. Köppel, W. Domcke, L. S. Cederbaum, Advances in Chemical Physics 57, 59 (1984).
- 40. S. Pabst, M. Lein, H. J. Wörner, Phys. Rev. A 93, 023412 (2016).
- 41. N. V. Golubev, T. Begušić, J. Vaníček, Phys. Rev. Lett. 125, 083001 (2020).
- 42. G. Yuan, et al., Structural Dynamics 6, 054102 (2019).
- 43. M. F. Kling, P. von den Hoff, I. Znakovskaya, R. de Vivie-Riedle, Phys. Chem. Chem. Phys. 15, 9448 (2013).
- 44. N. V. Golubev, A. I. Kuleff, Phys. Rev. A 91, 051401 (2015).