font=small \alsoaffiliationUniversity of Vienna, Faculty of Physics and Center for Computational Materials Sciences, A-1090 Vienna, Austria
Exploring librational pathways with on-the-fly machine-learning force fields: Methylammonium molecules in MAPb ( I, Br, Cl) perovskites
Abstract
Two seemingly similar crystal structures of the low-temperature (100 K) MAPb (=I,Br,Cl) perovskites, but with different relative Methylammonium (MA) ordering, have appeared as representatives of this orthorhombic phase. Distinguishing them by X-ray diffraction experiments is difficult and conventional first-principles based molecular-dynamics approaches are often too computationally intensive to be feasible. Therefore, to determine the thermodynamically stable structure, we use a recently introduced on-the-fly Machine-Learning Force Field method, which reduces the computation time from years to days. The molecules exhibit a large degree of anharmonic motion depending on temperature: i.e. rattling, twisting and tumbling. We observe the crystal’s ’librational pathways’ while slowly heating it in isothermal-isobaric simulations. Marked differences in the thermal evolution of structural parameters allow us to determine the real structure of the system via a comparison with experimentally determined crystal structures.
TOC Graphic
![[Uncaptioned image]](/html/2110.00321/assets/TOCBokdam-jpcl21.png)
1 Introduction
The crystal structure of hybrid halide-perovskites is a topic of study that has surfaced several times in the last four decades. X-ray powder diffraction experiments of Weber et.al. on Methylammonium(MA)-Pb with halogens = {I, Br, Cl}, have established a high temperature cubic phase for all 1. A perovskite structure is formed by Pb corner-sharing octahedra enclosing the MA molecules. In later years, the low temperature phases and librational modes of the MA molecule at various temperatures were studied2, 3, 4, 5, 6. The development of high efficiency solar cells based on these perovskites sparked a rival of interest in its structure characterization7, 8, 9, 10. It was shown by high-quality powder neutron-diffraction experiments9 that the low-temperature orthorhombic phase of MAPbI3 actually belongs to the space-group. This is the space group that was also determined for MAPbBr311 and MAPbCl312. The potential for opto-electronic applications raised new questions that are all (in)directly related to the atomic structure: the effect of MA rotation on charge dynamics13, 14, dynamic or permanent deformations of the Pb octahedra15, 16, 17, 18, the extent of electron-phonon coupling19, 20, 21 and the Rashba effect22, 23, 24, 25, 26, 27, to name a few. Considerable progress has been made, but consensus has not always been achieved. This is in part the result of differences in interpretation of the local microscopic structure. The disorder, be it static or dynamic, of the molecular C-N axes is a well-known problem for diffraction techniques, that makes it difficult to determine their precise orientation18, 28. First-principles (FP) methods such as density functional theory (DFT) have shown to be very useful for the determination of crystal structure by augmenting the experimentally resolved inorganic framework with the ordering of the molecules29, 30, 31, 32, 33, 34, 35, 36, 37. However, even though commonly used density functional approximations have the required chemical accuracy38, their computational complexity prohibits the large length & time scale molecular dynamics (MD) calculations necessary to resolve the free energy landscape and thereby the finite temperature crystal structure31. We will use the on-the-fly Machine-Learning Force Field (MLFF) method39, 40, which makes it possible to explore the full diversity of atomic structures while going through the entropy-driven phase transformations in hybrid perovskites. This method substantially reduces the computational cost while retaining near-FP accuracy. Recently, it has been shown to be capable to resolve the orthorhombic-tetragonal (Ort-Tet) and tetragonal-cubic (Tet-Cub) phase transitions in MAPbI3 and the inorganic halide perovskites CsPb in good agreement with experiment39. Furthermore, it can be systematically extended to describe mixed MAxFA1-xPbI3 perovskites under isothermal-isobaric conditions41.
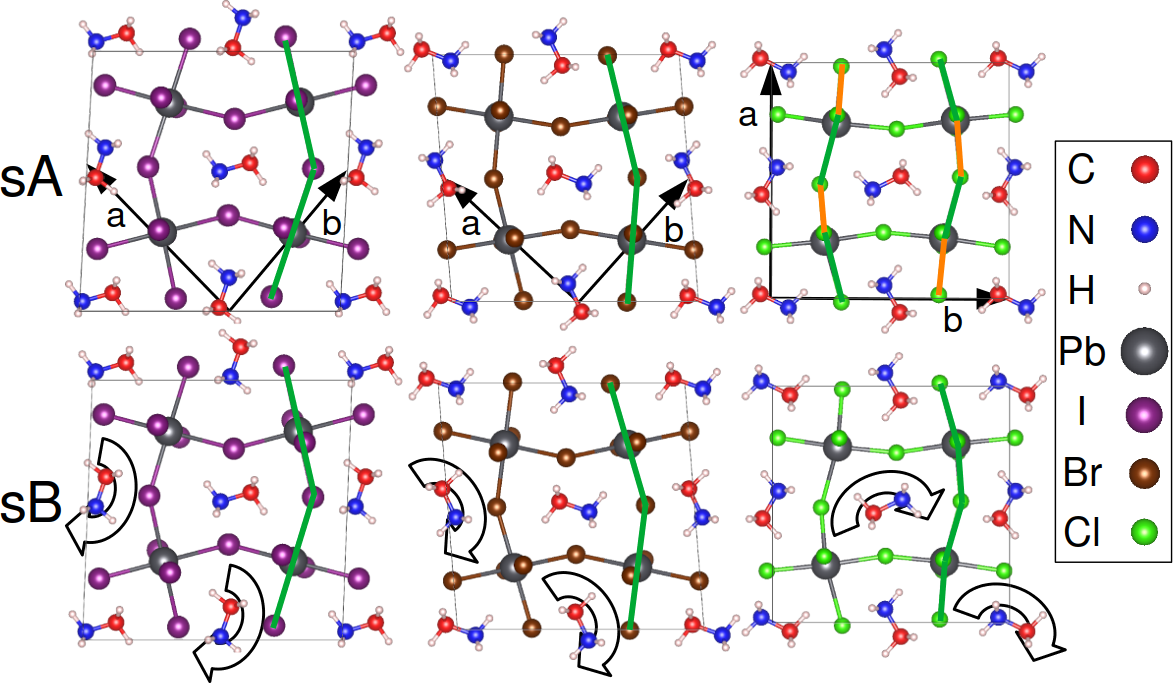
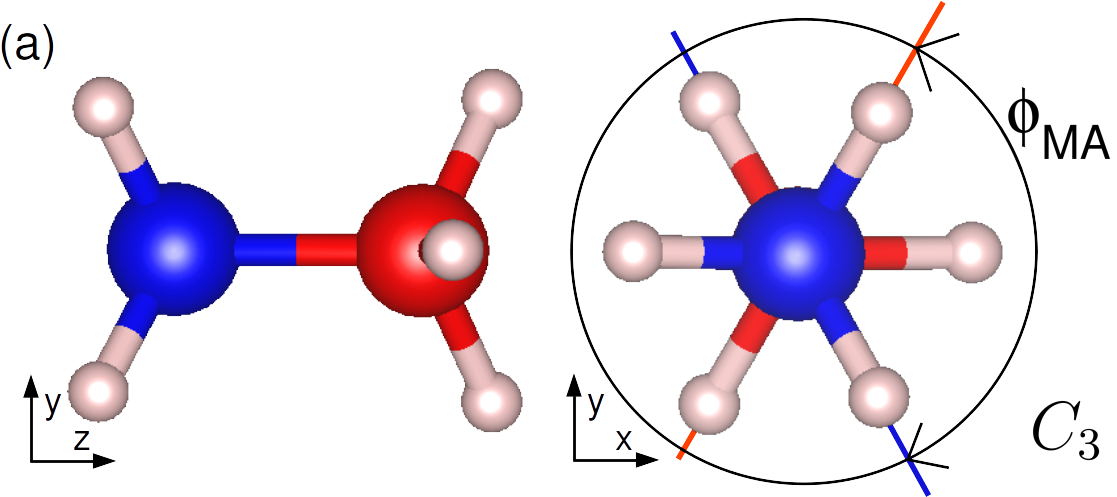
The starting point of our search for the low-temperature (100 K) orthorhombic structure of MAPb are two seemingly similar, but distinctly different structures: sA and sB. They have the same lattice vectors and inorganic coordinates, but a different molecular ordering pattern as sketched in Figure 1. We have labeled the lattice vectors such that the molecules lie in the -plane. sB is created out of sA by an in-plane rotation of half of the molecules by 180o as indicated by the curved arrows. Note that in both arrangements the neighboring molecules in the -direction (not shown in the figure) are anti-parallel. These structures have been prepared in a supercell, such that it accommodates the () basis of = I, Br as well as the () basis of = Cl, where is the pseudo-cubic lattice constant of the parent cell 12. The molecules in the often referenced experimental () structures for = I, Br and Cl of Refs 8, 11 and 12 are arranged as in the sB, sA and sA configuration, respectively. Other experimental works did not distinguish between these two arrangements7, 42, since refinement of the model structure by permuting N and C with respect to the measured diffraction spectra does not lead to significant improvements of the fit18. To date even for the extensively studied MAPbI3 perovskite, different studies report opposite arrangements: sA32, 43, 44 and sB29, 45, 46, 34. This is unexpected, because if we focus only on the dipole moment of the MA molecule and compute the total electrostatic energy in the point-dipole approximation, then the sB pattern is clearly favored. This pattern shows a closer resemblance to the ‘head-tails’ groundstate of a point-dipole model47.
In this work, we will analyze the ‘librational pathways’ of the MA molecules and Pb octahedra in MAPb, and use them to identify the most representative low-temperature orthorhombic structure. We sample structures of the crystal by slowly heating up two plausible low-temperature structures (sA and sB) in isothermal-isobaric MD simulations. Structures on the explored pathways through the structural phase space are thermodynamically linked to the starting configuration and result in marked differences in lattice and order parameters that are compared to temperature dependent diffraction studies.
2 Computational Details
The DFT calculations are performed with the projector augmented wave method48 as implemented in the VASP code49, 50 using the meta-gradient corrected SCAN51 density functional approximation (DFA), which has shown good performance when compared to high quality many-body perturbation theory reference calculations38. A plane-wave basis with a cutoff of 350 eV, Gaussian smearing with a width of 10 meV and 4 (I,Br) or 8 (Cl) k-points of the -centered 222 Monkhorst-Pack grid are set, which suffice to obtain the required accuracy of the calculations36. The computed lattice parameters as function of temperature should (qualitatively) agree with experiment over the whole temperature range. Therefore, by not limiting the study to a 0 K DFT based relaxation of the internal energy, biases related to the chosen DFA can be detected38. Before starting the MD simulations the starting structures of Fig. 1 were shortly relaxed by a conjugate gradient algorithm.
MLFFs are trained during MD simulations with VASP, based on calculated total energies, forces and stress tensors for automatically (on-the-fly) selected structures in the isothermal–isobaric ensemble. This approach is described in detail in Refs. 39, 40. In short, a Bayesian error estimation of the predicted forces is used to select either DFT or MLFF forces to propagate the structure in time (). Whenever the predicted errors exceed the threshold, a new reference structure is picked up, a DFT calculation is performed and the coefficients of the MLFF are re-optimized. In Figs. 3(c,f) a ’density-of-states’ like function of the temperature (note, equivalent to simulation time) shows when in the training MD most DFT calculations were performed. It is calculated by: , where is a Lorentzian function. This function is normalized to the total number of DFT reference structures picked up in training, . The automatically picked up reference structures form a minimal training database (containing total energies, forces, stress tensors and atomic coordinates) that is well spread over the available structural phase space. We have shared this database via the 4TU.DataBase repository52 to encourage development of ML potentials based on minimalistic datasets.
A variant of the GAP-SOAP53, 54 method is
used as a descriptor of the local atomic configuration around each atom. Within a cutoff of 7 Å a two-body radial probability distribution is build, as well as three-body angular distribution within a cutoff of 4 Å. The atomic coordinates are smeared in the distributions by placing Gaussians with a width of 0.5 Å. The obtained distributions are projected
on a finite basis set of spherical Bessel functions multiplied with spherical harmonics. The bessel functions are of the order 6 and 7 for the radial and angular part, respectively. Only the angular part has a maximal angular momentum of . The
coefficients of the projections are gathered in the descriptor vector . A kernel-based
regression method55 is applied to map the descriptor to a local atomic energy. The similarity between two local configurations is calculated by a polynomial kernel function:
3 Results & Discussion
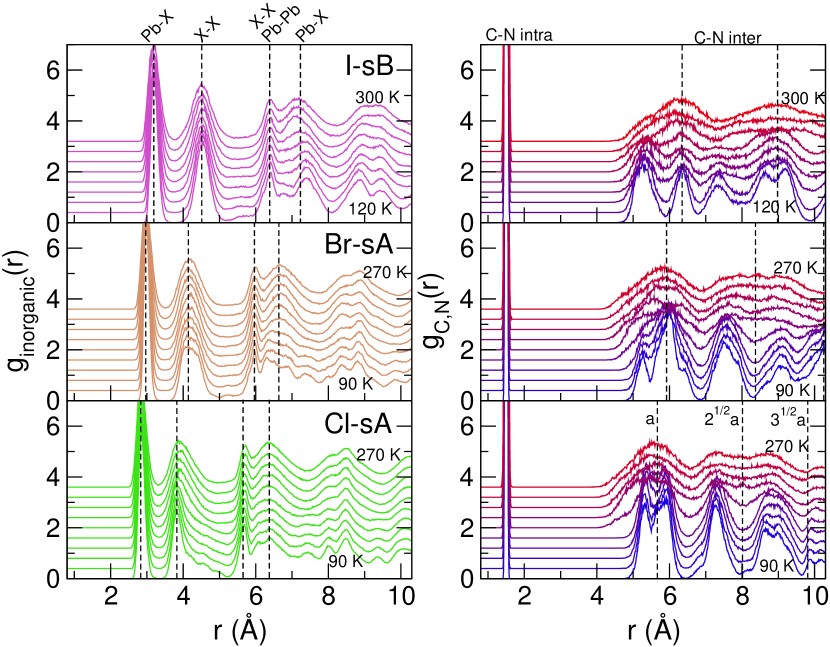
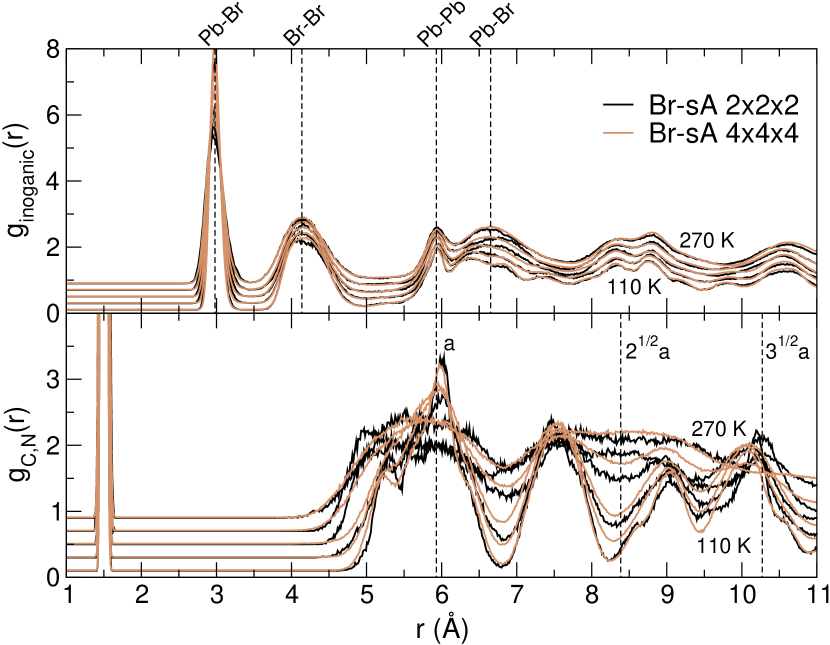
To introduce the librational pathways of MAPb we will illustrate them by weighted sums of pair distribution functions (PDFs) in Figure 2. The PDF for the atom types and is defined as
where and are the coordinates of the and atoms, , is the volume of the simulation box, and denotes the ensemble average. In , the pairs of framework components Pb-,-,Pb-Pb are included, and only the C-N pairs of the MA molecules are included in . For all halides , we see that retains most of its structure throughout the whole temperature range, and that shows a transition whereby part of the order is lost. The intra-molecular part ( Å) remains intact, but the inter-molecular pairs show dual peaks merging into a single broad peak centered around the nearest-neighbor distances of the consecutive cubic unit cells, ie. . This is the result of the unfreezing of the molecules whereby they reorient () rapidly4. Around room temperature, neighboring MA molecules are still dynamically correlated to their neighbors34. The differences in the DSF between the halides are, among other things, related to different Pb- bond lengths and to the relative orientation of the molecules in the low temperature phase. As we will show hereafter, the thermodynamically stable molecular configurations at low temperature (sA or sB) depends on the halide type .
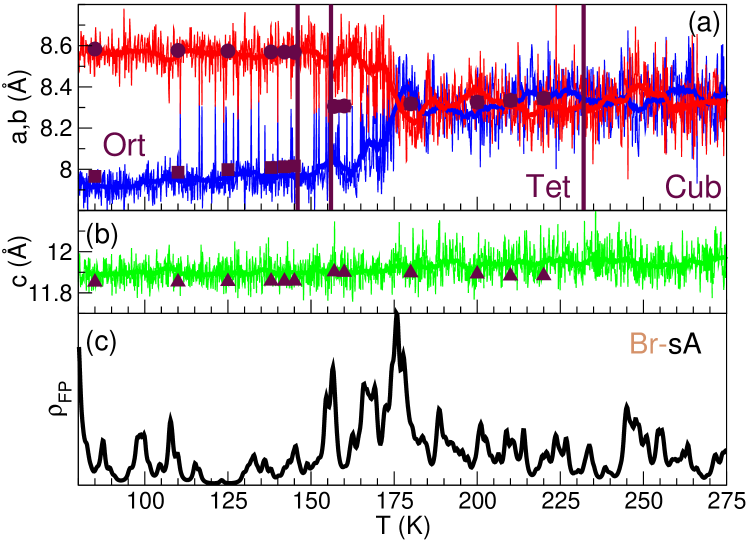
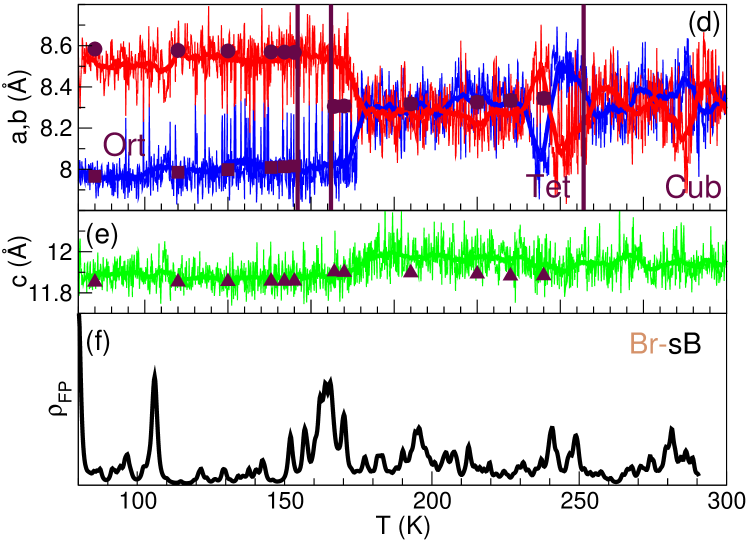
The starting structures (Fig. 1) are slowly heated at a rate of using DFT based MD with a Langevin thermostat and a time step of 2 fs. The PDFs at different temperatures have been obtained by partitioning the resulting trajectory in parts of equal length. In the ensemble all lattice degrees of freedom are allowed to change as shown for MAPbBr3 in Figure 3. The two plots correspond to the heating trajectories starting from the sA and sB structures. Thermal fluctuations in structural parameters are smoothed by applying running averages. To accelerate the MD a MLFF is trained on-the-fly as described in Refs. 39, 40. The algorithm switches between MLFF and DFT forces based on the predicted error of the MLFF. Structural reference configurations to train the MLFF are automatically picked up and by construction lie outside the already ’learned’ part of the phase space. This can be seen by the sharp increase in the density of first-principles calculations () shown in Figs. 3(c,f). The on-the-fly algorithm decides to do a large number of DFT calculations in the region between 150 and 170 K, ie. when the system undergoes the Ort-Tet phase transition. The total number of DFT reference structures picked up in training, , is and . This transition temperature is expected to be retarded, because the system is out of thermal equilibrium as a result of the still considerable heating rate. Even though, the agreement with the exp. lattice parameters shown by the symbols in Fig. 3 is remarkable. We show that the structural transformation and the related librational pathways of the molecules and octahedra (see Supplementary Movies) are accurately described in the on-the-fly heating MD. This opens up the possibility to explore many different perovskites, because only 1.000 out of the total of 150.000 MD steps per heating run were DFT calculations. This reduces the compute time from years to days.
3.1 Librational pathway analysis
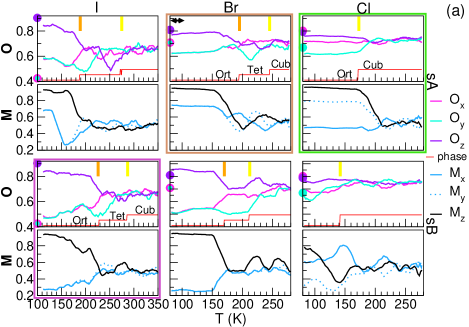
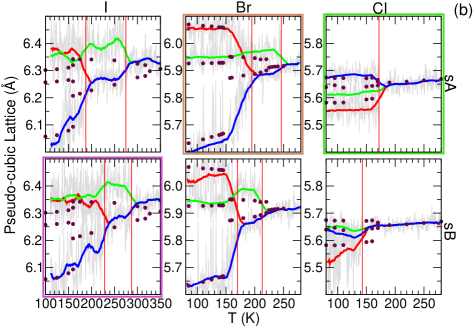
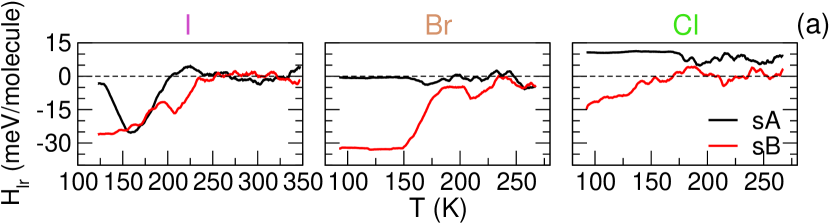
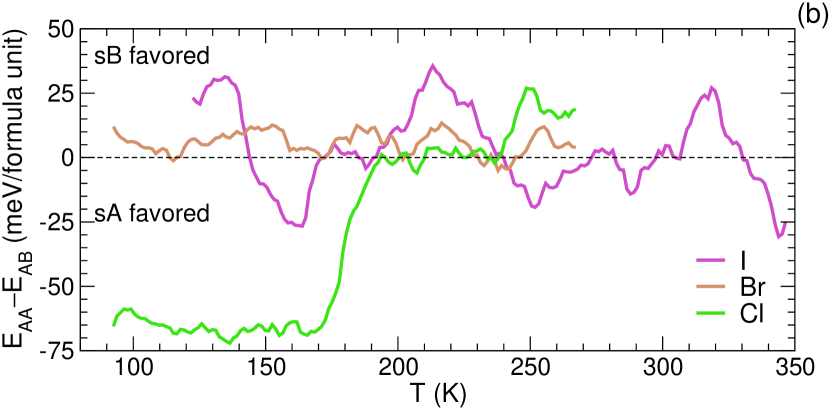
Figure 3 indicates that, apart from a small step in the lattice constant in the sB case, both trajectories qualitatively and quantitatively agree with the experimental data. This means that the lattice parameters alone provides insufficient information to select either the sA or the sB as the thermodynamically stable low-temperature structure. Therefore, we analyze the structural motif presented by the atomic coordinates in the six heating trajectories. First, we extract solely the orientation of the molecular C-N axes in time. The total electrostatic energy () corresponding to the dipole moments of the molecules is calculated47. In short, this point-dipole model assumes a fixed dipole moment on all molecules, no screening and includes all dipole-dipole interactions up to the third nearest-neighbor. In Figure 4(a) is plotted as function of temperature for the three halides starting from the sA (black lines) and sB (red lines) configurations. The sB configuration is clearly lower in energy. With increasing temperature the molecules flip/re-order and the stable arrangement is broken down, eventually leading to a disordered state with 56. For = I the sA pattern flips to the stable sB pattern before reaching the Ort-Tet phase transition, which shows that the initial structure was out of equilibrium. However, for = Br and Cl the pattern remains largely frozen-in until the phase transition. The sA configuration can only be stable at low-T if either a potential energy contribution arising from the inorganic framework or the entropy compensates this internal energy difference.
The DFT/MLFF calculated internal energy () is shown in Figure 4(b) as the energy difference () between the heating trajectory starting with the sA and the sB structure. At low temperature and ambient pressure, the volume and entropy contributions to the Gibbs free energy are small, and a sizable positive/negative would indicate that the sB/sA configuration is favored, respectively. For MAPbCl3 it is clear that the sA structure is favored even though its electrostatic energy in the dipole model was unfavored. Above K the difference between the two initial configurations has been lifted by thermally induced structural rearrangements. For MAPbI3 and MAPbBr3 the situation is less clear, at low temperature is positive, however it is of the size of the fluctuations. Even for the fully DFT relaxed (0 K) structures values are small: 33, and meV/formula-unit for I, Br and Cl, respectively. Increasing the precision of the calculation, by doubling the k-point grid density and applying the Tetrahedon method57 results in 33, and meV/f.u., respectively. This indicates that, especially for MAPbBr3, we cannot distinguish sA from sB based on the internal energy alone.
The changes of the structural motif as a function of the temperature are compared in Figure 5 and in the Supplementary Movies. Order parameters describing the inter-octahedral () and inter-molecular () order are shown for all heating trajectories in Fig. 5(a). The / order parameters are based on the dot products of -Pb-/C-N connection vectors located on nearest neighboring sites.
A detailed description can be found in Refs. 47, 39. Looking at for I-sA, we see that the molecular ordering pattern rapidly changes starting from and transforming to the same order observed for I-sB , in agreement with the previously seen change in . At the same time the inter-octahedral order parameter for the inorganic framework, , changes only little. The breakdown of the initial molecular order occurs at a lower temperature in the Br case and coincides with the orthorhombic-tetragonal phase transformation. This shows that the sA and sB molecular order are more energetically competitive in orthorhombic = Br than in I, and that an additional measure is required to determine the stable arrangement. The values for the experimental low temperature structures indicated by the circles in Fig. 5(a) provide this measure. Based on their comparison to the simulation the Br-sA is the stable low-temperature orthorhombic structure.
To automatically classify the instantaneous crystallographic phase of all structures within the MD trajectory, we applied a new approach based on the order parameter. This allows, for example, to still assign the orthorhombic phase to a structure that is strained in a box with . Whenever the variance of the components of is below a threshold it is classified as Cub, and otherwise it is Ort or Tet. We can then differentiate between the last two by counting the number (1Ort, 2Tet) of components larger than their mean value. The red line in Fig. 5(a) shows the result of this phase classification. Note that no Tet phase in MAPbCl3 is recognized. This could be caused by a very small temperature window in which the Tet phase is stable, or that the ratio is too small to be noticed in the supercell.
Lattice parameters as function of temperature are shown in Figure 5(b). The parameters are refined in the unit cell corresponding to the classified phase and converted to pseudo-cubic lattice parameters (). Experimentally obtained parameters are shown by the circles. Surprisingly, the plot for MAPbBr3 and MAPbCl3 show good to very good agreement with experiment. Especially for MAPbI3 we notice the effect of our limited MD setup, suppressing the Tet phase on the -axes. From our previous study we know that this can be improved with a lower heating rate and by applying a larger supercell. Still, it is noteworthy that, under the same computational settings, the Ort-Tet phase transition becomes more retarded going from Cl, Br to I.
Combining all the above presented analysis leads to the favored initial configurations, I: sB, Br: sA, Cl: sA. These configurations are highlighted by the colored rectangles in Fig. 5.
3.2 Training system size dependence
The PDFs in Fig. 2 are plotted beyond half of the simulation box width, since the supercell has an average width of . They are computed in supercells, which are created by replicating the original cell, and enables us to sample the PDF on the domain. These results are compared to a training run performed with a supercell. Specifically, we have made a test for MAPbBr3 starting in the sA configuration, and applied the same on-the-fly training directly on the supercell. In this supercell, the k-points of the k-grid (applied with the supercell) all fold-down on the Gamma point. For computational tractability we slightly lowered the plane-wave cut-off from 350 to 300 eV and retrained the cell with the same cut-off for a fair comparison. The smaller plane-wave basis results in higher Pulay stress, which slightly affects the volume, but does not qualitatively change the crystal structure36.
Figure 6 shows and for the standard supercell and the eight times larger one. The of the two systems are almost identical. The main deviations in are the result of a different temperature at which the system switches from the Ort to Tet phase. This is to be expected for simulations with finite system size. The MD trajectory is chaotic and the transition does not occur at the same temperature even when the initial conditions are the same. This very good agreement indicates that the applied supercell is large enough to capture the crystal symmetry. This is in agreement with a fully ab-initio MD study of the system size dependence of MAPbI3 going up to the supercell34.
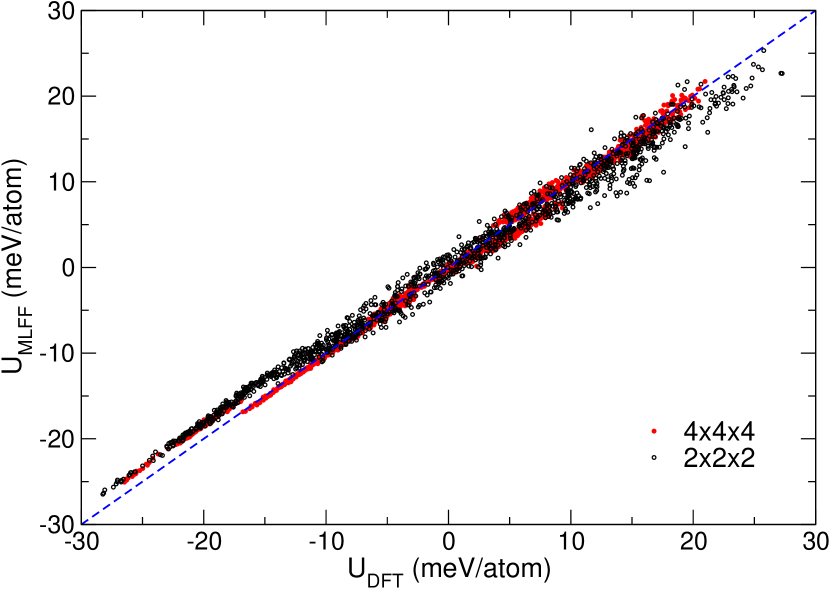
The accuracy of the MLFF model over the entire collected dataset of structures, which includes three different perovskite phases is very high. The DFT reference energy () and predicted MLFF energy () for the test systems are plotted in Figure 7, and show a clear linear relation over a large energy range. Note that both point clouds nicely overlap, whereby the larger variations are, as would be expected, observed for the smaller supercell. The overall root-mean-square (rms) error on the energy is only 1.7 and 0.88 meV/atom for the MLFF trained on the and supercells, respectively. This is small and of the same order of magnitude of state-of-the-art ML potentials (kernel-regression58, neural networks59, etc.). Furthermore, for the two system sizes the errors in the force are 0.081 and 0.077 eV/Å and in the stress 1.1 and 0.46 kB. These error estimates are typical for all MLFFs presented in this work. For instance, the rms errors in the energy of the six MLFFs (=I,Br,Cl/sA or sB) are all in the 1.2-1.8 meV/atom range.
3.3 Octahedra distortions: dynamic or permanent?
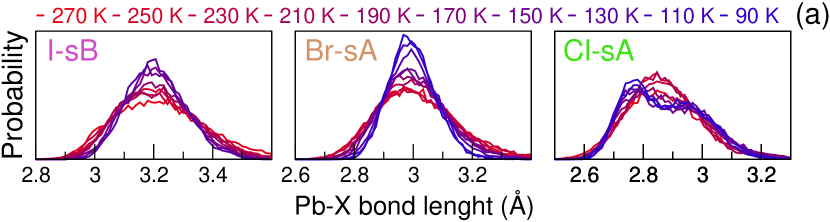
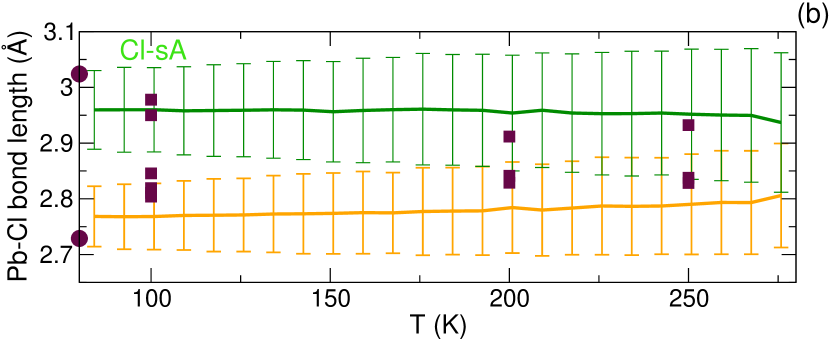
The central question remains, why is the sA configuration more stable in MAPbCl3 and to a less extent in MAPbBr3 as compared to sB? Chi.et.al. have already shown that the PbCl6 octahedra are distorted12. This polar distortion is highlighted in Fig. 1 by the green and orange lines indicating the difference between two Pb-Cl bond lengths (3.02 and 2.73 Å) in the crystallographic -direction, and is in good agreement with our simulations. However, we find no noticeable distortion of the PbI6 and PbBr6 octahedra above 80 K, as shown in Figure 8. Again, in agreement with experiments of Refs. 10, 11, however, opposite to the findings of Refs. 16, 17 where a permanent octahedra distortion is found in MAPbBr3 around room temperature. In Fig. 8(a) the distribution of the Pb- bond lengths as function of temperature are shown. The heating trajectories were cut in parts of equal length and all bond lengths in the -direction were added to the distribution. The low-temperature distribution for Pb-Cl has two peaks. This distortion is not observed when starting from the Cl-sB structure, nor when starting from the Br-sB or I-sA structures. The distribution is well described by a combination of two Gaussian distribution functions . For Cl-sA, the mean values () and the standard deviations () as function of temperature are shown in Fig. 8(b). These values have been obtained from a separate heating trajectory with the finished MLFF on a MAPbCl3 supercell. The so obtained distributions agree with Fig. 8(a) and improve statistical accuracy. Experimentally determined bond lengths from Refs.12 and 18 have been added to Fig. 8(b) and agree within the standard deviation. In the simulations a single Gaussian suffices above 175 K, ie. . At this temperature, the octahedral polar distortion is no longer observed on time average and the crystal is in the cubic phase. As for I and Br, instantaneous distortions of the octahedra do occur at these elevated temperatures.
The following scenario now becomes plausible, the sA ordered molecules are stabilized in the MAPbCl3 orthorhombic phase by an anti-ferroelectric stripes pattern of dipolar octahedra in the -direction. As argued in Refs. 12 the volume of the perovskite has to be sufficiently small to induce these distortions, whereby the ’hard’ MA deforms the ’soft’ octahedra. However, the stripes pattern cannot be the only stabilization mechanism, because no distortion is observed in Br-sA.
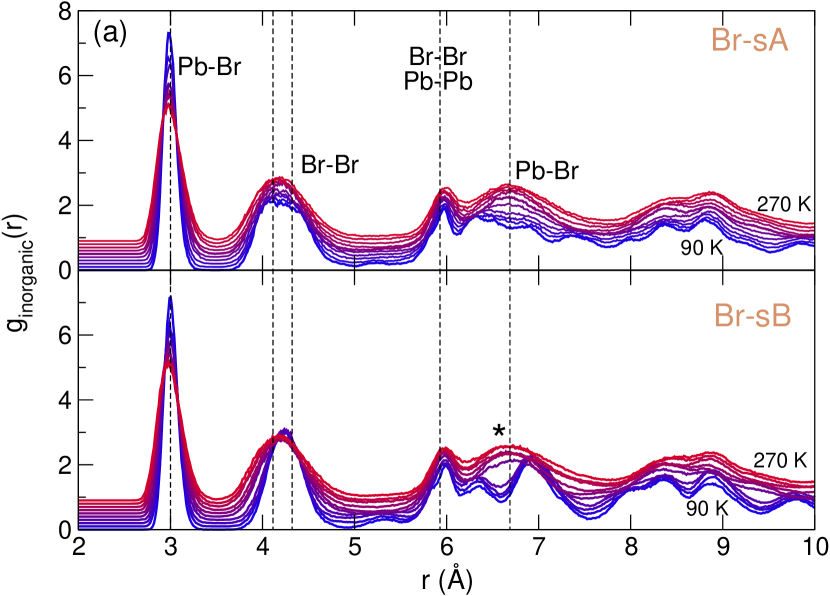
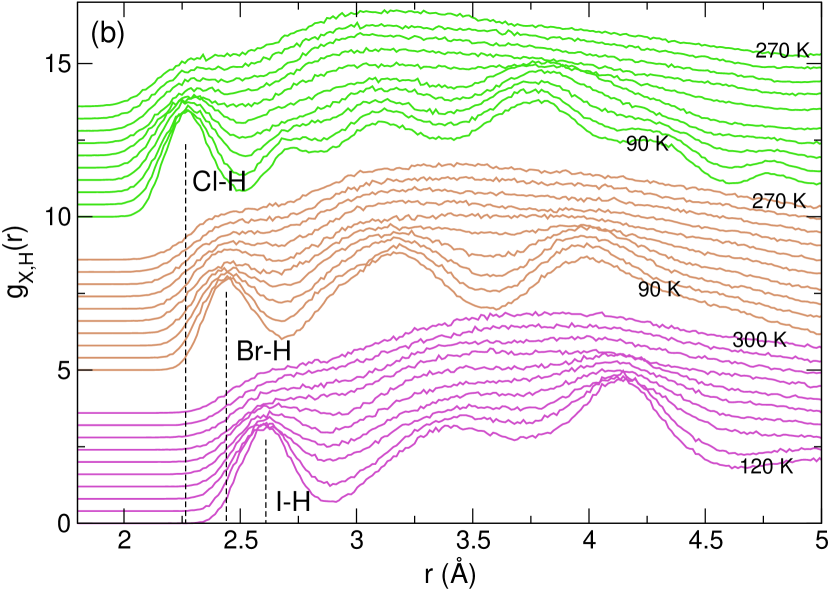
We would like to note that our ’ensemble average’ view on the structural model results in PDFs for MAPbBr3 that qualitatively agree with those obtained from X-ray diffraction experiments of Ref. 17. In Figure 9(a) has been plotted on the same length scale as Fig. 2 in Ref. 17, whereby the vertical dashed lines indicate the experimental peak positions. Starting from sA, we also do not observe any relevant structural change in the 150-280 K temperature range apart from thermal broadening of the peaks. However, our approach classifies tetragonal and cubic structures within this range, and does not indicate that an orthorhombic structure would be a better fit throughout this temperature range. Starting from sB results in structural changes (indicated by *) in disagreement with the PCF of Ref. 17. This is another indication that the sB pattern is not the stable low temperature structure. The different structural interpretation of the crystal at elevated temperatures becomes apparent in the H- bonding as shown by in Fig. 9(b). We find a halogen dependent first peak position. This finding is different from the 2.5 Å peak observed in the neutron PDFs of both MAPbBr3 and MAPbCl318.
3.4 MA dynamics
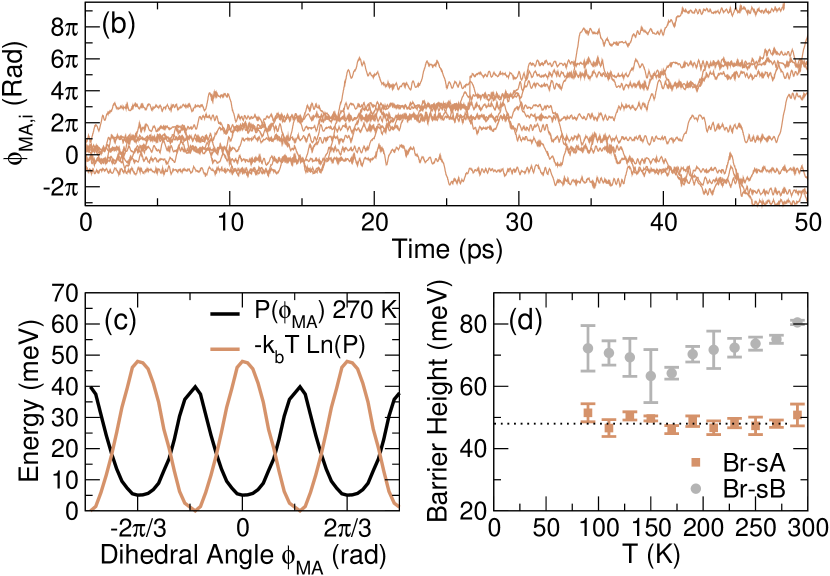
We would like to note that training of a very accurate MLFF for the hyrbid perovskites is not fully completed by the here performed single heating run. Precise values for phase transition temperatures, ratios, etc., were not the aim of this work, but can be obtained with an accurate MLFF which enables long MD trajectories on large supercells39. Limits to the accuracy can be seen in the torsion/rotation degree of freedom of the molecule, for example. Figure 10 shows the NH3 versus the CH3 group dihedral angle () of all MAs in MAPbBr3 in ensembles with the finished MLFF. Torsion () unfreezes at K60 and also rotations () occur around our starting temperature (80 K) of the on-the-fly training.
Fig. 10 (b) shows that of a single molecule shows step-like behavior, occasionally jumping between planes separated by 120o, and is superimposed by a fast oscillation. For each of the eight molecules in the supercell a probability distribution of as in Fig. 10(c) was made. We then calculate the rotational energy barrier in the two MLFFs of MAPbBr3 (sA and sB) by a Boltzmann inversion of the distribution. A barrier was only assigned at a temperature when the number of 120o rotations in the ps long MD trajectories exceeded the number of molecules in the supercell. The error bars in Fig. 10(d) correspond to , the standard deviation of the eight obtained barriers. The barrier is, within our statistical accuracy, temperature independent and, surprisingly, different between sA and sB. It is tempting to conclude that the sA structure for Br affords a more facile rotational degree of freedom compared to the sB structure within the orthorhombic phase. However, the difference should not persist in the high temperature cubic phase, in which the MAs are orientationally disordered. This should be a warning that training is not yet completed and the MLFF still shows a bias depending on the initial conditions.
We are able to measure the barriers of a single molecule in vacuum in the same manner. The absence a surrounding Pb-Br framework does not destabilize the molecule. Barriers obtained in this way are slightly lower than the DFT value of 105 meV for MA in vacuum. This value was calculated as the difference in internal energies of the optimized and molecule, for which all internal degrees of freedom were relaxed under the constraint of . Using these two structures the barriers for the Br-sA and Br-sB MLFFs are 78 and 89 meV, respectively.
Since both Br-sA and Br-sB show rotations at temperatures below the Ort-Tet phase transition temperature, we can conclude that the unfreezing of this motion does not drive it. This is in agreement with the findings of the computational study of Kieslich et.al.61. This phase transition is driven by an increase in configurational entropy of the molecules4. This, however, does not preclude the possibility that entropy related to dynamics is involved in this phase transition. Based on the observed initial condition dependence (sA or sB) of the barrier, we speculate that Br-sA is entropically stabilized by the torsion/rotation degree of freedom of the molecule, and thereby determines the orthorhombic structure below the phase transition temperature.
4 Conclusions
In conclusion, we have shown that on-the-fly machine-learning force fields are a very powerfull tool in determining atomic structure in dynamic, entropically stabilized solids. Already during the training-by-heating MD important structural characteristics are qualitatively correct and even quantitatively useful. As a prime example, the low-temperature ordering pattern of MA molecules in MAPb perovskites, which is not uniquely resolved by diffraction experiments, was studied. We determined the most likely structure by slow-heating DFT-based molecular dynamics and analyzing the librational pathways. By comparing this analysis with reported temperature dependent lattice parameters and refined structures, we show that the ordering of the molecules (sA or sB) in orthorhombic phases of MAPbBr3 and MAPbCl3 is similar (sA), while in MAPbI3 they are differently ordered (sB). This is unexpected, since the sA pattern is energetically unfavorable when considering solely the intrinsic dipole moment of the MA molecules. The sA order induces a permanent structural distortion of the PbCl6 octahedra at low temperature, resulting in an anti-ferroelectric stripes pattern in the crystallographic -direction. In the higher temperature cubic phase this distortion is no longer observed in the ensemble average, instead instantaneous dynamic distortions appear. No permanent distortion is observed in the PbBr, nor PbI, octahedra even down to the lowest simulated temperature of 80 K. We have presented indications that the sA order in low temperature, orthorhombic MAPbBr3 is stabilized by an entropic contribution to the free energy related to the dynamics of the MA molecules. We hope that this paper will stimulate combined experimental and MLFF studies of the structure of many other complex Dynamic Solids.
M.B. and J.L. gratefully acknowledge funding by the Austrian Science Fund (FWF): P 30316-N27. Computations were partly performed on the Vienna Scientific Cluster VSC3 and on the Dutch national e-infrastructure with the support of SURF Cooperative.
Supporting information can be downloaded from the website of the Journal of Physical Chemistry C (2021): 10.1021/acs.jpcc.1c06835
-
•
For each of the six on-the-fly heating trajectories a movie was generated. A running average (window size 25 K) over each atomic coordinate is computed to smoothen out high frequency movements. At high temperature, where the molecules rotate fast, this contracts the atoms in the molecule to a point. The video shows the supercell under periodic boundary conditions and from two perspectives (from the top and side).
-
•
The DFT-SCAN optimized (0 K) orthorhombic sA and sB structures for MAPbI3, MAPbBr3 and MAPbCl3 in .cif file format.
References
- Weber 1978 Weber, D. CH3NH3PbX3, ein Pb(II)-System mit kubischer Perowskitstruktur / CH3NH3PbX3, a Pb(II)-System with Cubic Perovskite Structure. Zeitschrift für Naturforschung B 1978, 33, 1443
- Wasylishen et al. 1985 Wasylishen, R.; Knop, O.; Macdonald, J. Cation rotation in methylammonium lead halides. Sol. State Comm. 1985, 56, 581–582
- Poglitsch and Weber 1987 Poglitsch, A.; Weber, D. Dynamic disorder in methylammoniumtrihalogenoplumbates (II) observed by millimeter-wave spectroscopy. J. Chem. Phys. 1987, 87, 6373–6378
- Onoda-Yamamuro et al. 1990 Onoda-Yamamuro, N.; Matsuo, T.; Suga, H. Calorimetric and IR spectroscopic studies of phase transitions in methylammonium trihalogenoplumbates (II). J. Phys. Chem. Sol. 1990, 51, 1383
- Kawamura et al. 2002 Kawamura, Y.; Mashiyama, H.; Hasebe, K. Structural Study on Cubic–Tetragonal Transition of CH3NH3PbI3. J. Phys. Soc. Jpn. 2002, 71, 1694–1697
- Mashiyama et al. 2007 Mashiyama, H.; Kawamura, Y.; Kubota, Y. The Anti-Polar Structure of CH3NH3PbBr3. J. Korean Phys. Soc. 2007, 51, 850–853
- Stoumpos et al. 2013 Stoumpos, C. C.; Malliakas, C. D.; Kanatzidis, M. G. Semiconducting Tin and Lead Iodide Perovskites with Organic Cations: Phase Transitions, High Mobilities, and Near-Infrared Photoluminescent Properties. Inorg. Chem. 2013, 52, 9019–9038
- Baikie et al. 2013 Baikie, T.; Fang, Y.; Kadro, J. M.; Schreyer, M.; Wei, F.; Mhaisalkar, S. G.; Graetzel, M.; White, T. J. Synthesis and crystal chemistry of the hybrid perovskite (CH3NH3)PbI3 for solid-state sensitised solar cell applications. J. Mater. Chem. A 2013, 1, 5628–5641
- Weller et al. 2015 Weller, M. T.; Weber, O. J.; Henry, P. F.; Di Pumpo, A. M.; Hansen, T. C. Complete structure and cation orientation in the perovskite photovoltaic methylammonium lead iodide between 100 and 352 K. Chem. Commun. 2015, 51, 4180–4183
- Govinda et al. 2016 Govinda, S.; Mahale, P.; Kore, B. P.; Mukherjee, S.; Pavan, M. S.; De, C.; Ghara, S.; Sundaresan, A.; Pandey, A.; Row, T. N. G. et al. Is CH3NH3PbI3 Polar? J. Phys. Chem. Lett. 2016, 7, 2412–2419
- Swainson et al. 2003 Swainson, I.; Hammond, R.; Soullière, C.; Knop, O.; Massa, W. Phase transitions in the perovskite methylammonium lead bromide, {CH3ND3PbBr3}. J. Solid State Chem. 2003, 176, 97–104
- Chi et al. 2005 Chi, L.; Swainson, I.; Cranswick, L.; Her, J.-H.; Stephens, P.; Knop, O. The ordered phase of methylammonium lead chloride {CH3ND3PbCl3}. J. Solid State Chem. 2005, 178, 1376 – 1385
- Gélvez-Rueda et al. 2016 Gélvez-Rueda, M. C.; Cao, D. H.; Patwardhan, S.; Renaud, N.; Stoumpos, C. C.; Schatz, G. C.; Hupp, J. T.; Farha, O. K.; Savenije, T. J.; Kanatzidis, M. G. et al. Effect of Cation Rotation on Charge Dynamics in Hybrid Lead Halide Perovskites. J. Phys. Chem. C 2016, 120, 16577–16585
- Fabini et al. 2017 Fabini, D. H.; Siaw, T. A.; Stoumpos, C. C.; Laurita, G.; Olds, D.; Page, K.; Hu, J. G.; Kanatzidis, M. G.; Han, S.; Seshadri, R. Universal Dynamics of Molecular Reorientation in Hybrid Lead Iodide Perovskites. J. Am. Chem. Soc. 2017, 139, 16875–16884
- Beecher et al. 2016 Beecher, A. N.; Semonin, O. E.; Skelton, J. M.; Frost, J. M.; Terban, M. W.; Zhai, H.; Alatas, A.; Owen, J. S.; Walsh, A.; Billinge, S. J. L. Direct Observation of Dynamic Symmetry Breaking above Room Temperature in Methylammonium Lead Iodide Perovskite. ACS Energy Lett. 2016, 1, 880–887
- Page et al. 2016 Page, K.; Siewenie, J. E.; Quadrelli, P.; Malavasi, L. Short-Range Order of Methylammonium and Persistence of Distortion at the Local Scale in MAPbBr3 Hybrid Perovskite. Angew. Chem. Int. Ed. 2016, 55, 14320–14324
- Bernasconi and Malavasi 2017 Bernasconi, A.; Malavasi, L. Direct Evidence of Permanent Octahedra Distortion in MAPbBr3 Hybrid Perovskite. ACS Energy Lett. 2017, 2, 863–868
- Bernasconi et al. 2018 Bernasconi, A.; Page, K.; Dai, Z.; Tan, L. Z.; Rappe, A. M.; Malavasi, L. Ubiquitous Short-Range Distortion of Hybrid Perovskites and Hydrogen-Bonding Role: the MAPbCl3 Case. J. Phys. Chem. C 2018, 122, 28265–28272
- Wright et al. 2016 Wright, A. D.; Verdi, C.; Milot, R. L.; Eperon, G. E.; Pérez-Osorio, M. A.; Snaith, H. J.; Giustino, F.; Johnston, M. B.; Herz, L. M. Electron–phonon coupling in hybrid lead halide perovskites. Nature Comm. 2016, 7, 11755
- Sendner et al. 2016 Sendner, M.; Nayak, P. K.; Egger, D. A.; Beck, S.; Müller, C.; Epding, B.; Kowalsky, W.; Kronik, L.; Snaith, H. J.; Pucci, A. et al. Optical phonons in methylammonium lead halide perovskites and implications for charge transport. Mater. Horiz. 2016, 3, 613–620
- Neukirch et al. 2016 Neukirch, A. J.; Nie, W.; Blancon, J.-C.; Appavoo, K.; Tsai, H.; Sfeir, M. Y.; Katan, C.; Pedesseau, L.; Even, J.; Crochet, J. J. et al. Polaron Stabilization by Cooperative Lattice Distortion and Cation Rotations in Hybrid Perovskite Materials. Nano Lett. 2016, 16, 3809–3816
- Stroppa et al. 2014 Stroppa, A.; Di Sante, D.; Barone, P.; Bokdam, M.; Kresse, G.; Franchini, C.; Whangbo, M.-H.; Picozzi, S. Tunable ferroelectric polarization and its interplay with spin-orbit coupling in tin iodide perovskites. Nature Comm. 2014, 5, 5900
- Azarhoosh et al. 2016 Azarhoosh, P.; McKechnie, S.; Frost, J. M.; Walsh, A.; van Schilfgaarde, M. Research Update: Relativistic origin of slow electron-hole recombination in hybrid halide perovskite solar cells. APL Materials 2016, 4, 091501
- Leppert et al. 2016 Leppert, L.; Reyes-Lillo, S. E.; Neaton, J. B. Electric Field- and Strain-Induced Rashba Effect in Hybrid Halide Perovskites. J. Phys. Chem. Lett. 2016, 7, 3683–3689
- Etienne et al. 2016 Etienne, T.; Mosconi, E.; De Angelis, F. Dynamical Origin of the Rashba Effect in Organohalide Lead Perovskites: A Key to Suppressed Carrier Recombination in Perovskite Solar Cells? J. Phys. Chem. Lett. 2016, 7, 1638–1645
- Hutter et al. 2017 Hutter, E. M.; Gelvez-Rueda, M. C.; Osherov, A.; Bulovic, V.; Grozema, F. C.; Stranks, S. D.; Savenije, T. J. Direct-indirect character of the bandgap in methylammonium lead iodide perovskite. Nature Mater. 2017, 16, 115–120
- Frohna et al. 2018 Frohna, K.; Deshpande, T.; Harter, J.; Peng, W.; Barker, B. A.; Neaton, J. B.; Louie, S. G.; Bakr, O. M.; Hsieh, D.; Bernardi, M. Inversion symmetry and bulk Rashba effect in methylammonium lead iodide perovskite single crystals. Nature Comm. 2018, 9, 1829
- Wiedemann et al. 2021 Wiedemann, D.; Breternitz, J.; Paley, D. W.; Schorr, S. Hybrid Perovskite at Full Tilt: Structure and Symmetry Relations of the Incommensurately Modulated Phase of Methylammonium Lead Bromide, MAPbBr3. J. Phys. Chem. Lett. 2021, 12, 2358–2362
- Filippetti et al. 2014 Filippetti, A.; Delugas, P.; Mattoni, A. Radiative Recombination and Photoconversion of Methylammonium Lead Iodide Perovskite by First Principles: Properties of an Inorganic Semiconductor within a Hybrid Body. J. Phys. Chem. C 2014, 118, 24843–24853
- Quarti et al. 2014 Quarti, C.; Mosconi, E.; Angelis, F. D. Interplay of Orientational Order and Electronic Structure in Methylammonium Lead Iodide: Implications for Solar Cell Operation. Chem. Mater. 2014, 26, 6557–6569
- Mattoni et al. 2015 Mattoni, A.; Filippetti, A.; Saba, M. I.; Delugas, P. Methylammonium Rotational Dynamics in Lead Halide Perovskite by Classical Molecular Dynamics: The Role of Temperature. J. Phys. Chem. C 2015, 119, 17421–17428
- Brivio et al. 2015 Brivio, F.; Frost, J. M.; Skelton, J. M.; Jackson, A. J.; Weber, O. J.; Weller, M. T.; Goñi, A. R.; Leguy, A. M. A.; Barnes, P. R. F.; Walsh, A. Lattice dynamics and vibrational spectra of the orthorhombic, tetragonal, and cubic phases of methylammonium lead iodide. Phys. Rev. B 2015, 92, 144308
- Bakulin et al. 2015 Bakulin, A. A.; Selig, O.; Bakker, H. J.; Rezus, Y. L.; Müller, C.; Glaser, T.; Lovrincic, R.; Sun, Z.; Chen, Z.; Walsh, A. et al. Real-Time Observation of Organic Cation Reorientation in Methylammonium Lead Iodide Perovskites. J. Phys. Chem. Lett. 2015, 6, 3663–3669
- Lahnsteiner et al. 2016 Lahnsteiner, J.; Kresse, G.; Kumar, A.; Sarma, D. D.; Franchini, C.; Bokdam, M. Room-temperature dynamic correlation between methylammonium molecules in lead-iodine based perovskites: An ab initio molecular dynamics perspective. Phys. Rev. B 2016, 94, 214114
- Carignano et al. 2017 Carignano, M. A.; Aravindh, S. A.; Roqan, I. S.; Even, J.; Katan, C. Critical Fluctuations and Anharmonicity in Lead Iodide Perovskites from Molecular Dynamics Supercell Simulations. J. Phys. Chem. C 2017, 121, 20729–20738
- Lahnsteiner et al. 2018 Lahnsteiner, J.; Kresse, G.; Heinen, J.; Bokdam, M. Finite-temperature structure of the perovskite: Comparing density functional approximations and force fields to experiment. Phys. Rev. Mat. 2018, 2, 073604
- Maheshwari et al. 2019 Maheshwari, S.; Fridriksson, M. B.; Seal, S.; Meyer, J.; Grozema, F. C. The Relation between Rotational Dynamics of the Organic Cation and Phase Transitions in Hybrid Halide Perovskites. J. Phys. Chem. C 2019, 123, 14652–14661
- Bokdam et al. 2017 Bokdam, M.; Lahnsteiner, J.; Ramberger, B.; Schäfer, T.; Kresse, G. Assessing Density Functionals Using Many Body Theory for Hybrid Perovskites. Phys. Rev. Lett. 2017, 119, 145501
- Jinnouchi et al. 2019 Jinnouchi, R.; Lahnsteiner, J.; Karsai, F.; Kresse, G.; Bokdam, M. Phase Transitions of Hybrid Perovskites Simulated by Machine-Learning Force Fields Trained on the Fly with Bayesian Inference. Phys. Rev. Lett. 2019, 122, 225701
- Jinnouchi et al. 2019 Jinnouchi, R.; Karsai, F.; Kresse, G. On-the-fly machine learning force field generation: Application to melting points. Phys. Rev. B 2019, 100, 014105
- Grüninger et al. 2021 Grüninger, H.; Bokdam, M.; Leupold, N.; Tinnemans, P.; Moos, R.; De Wijs, G. A.; Panzer, F.; Kentgens, A. P. M. Microscopic (Dis)order and Dynamics of Cations in Mixed FA/MA Lead Halide Perovskites. J. Phys. Chem. C 2021, 125, 1742–1753
- Whitfield et al. 2016 Whitfield, P.; Herron, N.; Guise, W. E.; Page, K.; Cheng, Y. Q.; Milas, I.; Crawford, M. K. Structures, Phase Transitions and Tricritical Behavior of the Hybrid Perovskite Methyl Ammonium Lead Iodide. Sci. Rep. 2016, 6, 35685
- Ali et al. 2018 Ali, I. O. A.; Joubert, D. P.; Suleiman, M. S. H. A theoretical investigation of structural, mechanical, electronic and thermoelectric properties of orthorhombic CH3NH3PbI3. Eur. Phys. J. B 2018, 91, 263
- Leveillee and Schleife 2019 Leveillee, J.; Schleife, A. Free-electron effects on the optical absorption of the hybrid perovskite from first principles. Phys. Rev. B 2019, 100, 035205
- Filip and Giustino 2014 Filip, M. R.; Giustino, F. quasiparticle band gap of the hybrid organic-inorganic perovskite : Effect of spin-orbit interaction, semicore electrons, and self-consistency. Phys. Rev. B 2014, 90, 245145
- Lee et al. 2016 Lee, J.-H.; Bristowe, N. C.; Lee, J. H.; Lee, S.-H.; Bristowe, P. D.; Cheetham, A. K.; Jang, H. M. Resolving the Physical Origin of Octahedral Tilting in Halide Perovskites. Chem. Mater. 2016, 28, 4259–4266
- Lahnsteiner et al. 2019 Lahnsteiner, J.; Jinnouchi, R.; Bokdam, M. Long-range order imposed by short-range interactions in methylammonium lead iodide: Comparing point-dipole models to machine-learning force fields. Phys. Rev. B 2019, 100, 094106
- Blöchl 1994 Blöchl, P. E. Projector augmented-wave method. Phys. Rev. B 1994, 50, 17953–17979
- Kresse and Furthmüller 1996 Kresse, G.; Furthmüller, J. Efficient iterative schemes for ab initio total-energy calculations using a plane-wave basis set. Phys. Rev. B 1996, 54, 11169–11186
- Kresse and Furthmüller 1996 Kresse, G.; Furthmüller, J. Efficiency of ab-initio total energy calculations for metals and semiconductors using a plane-wave basis set. Comp. Mat. Sci. 1996, 6, 15–50
- Sun et al. 2015 Sun, J.; Ruzsinszky, A.; Perdew, J. P. Strongly Constrained and Appropriately Normed Semilocal Density Functional. Phys. Rev. Lett. 2015, 115, 036402
- Bokdam 2021 Bokdam, M. Minimalistic MAPbX3 database for force field training. 2021,
- Bartók et al. 2010 Bartók, A. P.; Payne, M. C.; Kondor, R.; Csányi, G. Gaussian Approximation Potentials: The Accuracy of Quantum Mechanics, without the Electrons. Phys. Rev. Lett. 2010, 104, 136403
- Bartók et al. 2013 Bartók, A. P.; Kondor, R.; Csányi, G. On representing chemical environments. Phys. Rev. B 2013, 87, 184115
- Bishop 2006 Bishop, C. Pattern Recognition and Machine Learning (Information Science and Statistics); Springer-Verlag: New York, 2006
- Govinda et al. 2017 Govinda, S.; Kore, B. P.; Bokdam, M.; Mahale, P.; Kumar, A.; Pal, S.; Bhattacharyya, B.; Lahnsteiner, J.; Kresse, G.; Franchini, C. et al. Behavior of Methylammonium Dipoles in MAPbX3 (X = Br and I). J. Phys. Chem. Lett. 2017, 8, 4113–4121
- Blöchl et al. 1994 Blöchl, P. E.; Jepsen, O.; Andersen, O. K. Improved Tetrahedron Method for Brillouin-Zone Integrations. Phys. Rev. B 1994, 49, 16223–16233
- Bartók et al. 2018 Bartók, A. P.; Kermode, J.; Bernstein, N.; Csányi, G. Machine Learning a General-Purpose Interatomic Potential for Silicon. Phys. Rev. X 2018, 8, 041048
- Behler 0 Behler, J. Four Generations of High-Dimensional Neural Network Potentials. Chem. Rev. 0, 0, null
- Sharma et al. 2020 Sharma, V. K.; Mukhopadhyay, R.; Mohanty, A.; Tyagi, M.; Embs, J. P.; Sarma, D. D. Contrasting Behaviors of FA and MA Cations in APbBr3. J. Phys. Chem. Lett. 2020, 11, 9669–9679
- Kieslich et al. 2018 Kieslich, G.; Skelton, J. M.; Armstrong, J.; Wu, Y.; Wei, F.; Svane, K. L.; Walsh, A.; Butler, K. T. Hydrogen Bonding versus Entropy: Revealing the Underlying Thermodynamics of the Hybrid Organic–Inorganic Perovskite [CH3NH3]PbBr3. Chem. Mater. 2018, 30, 8782–8788