Real and counterfeit cores: how feedback expands halos and disrupts tracers of inner gravitational potential in dwarf galaxies
Abstract
The tension between the diverging density profiles in Lambda Cold Dark Matter (CDM) simulations and the constant-density inner regions of observed galaxies is a long-standing challenge known as the ‘core-cusp’ problem. We demonstrate that the SMUGGLE galaxy formation model implemented in the Arepo moving mesh code forms constant-density cores in idealized dwarf galaxies of 8 M☉ with initially cuspy dark matter halos of M☉. Identical initial conditions run with the Springel & Hernquist (2003; SH03) feedback model preserve cuspiness. Literature on the subject has pointed to the low density threshold for star formation, , in SH03-like models as an obstacle to baryon-induced core formation. Using a SMUGGLE run with equal to SH03, we demonstrate that core formation can proceed at low density thresholds, indicating that is insufficient on its own to determine whether a galaxy develops a core. We suggest that the ability to resolve a multiphase interstellar medium at sufficiently high densities is a more reliable indicator of core formation than any individual model parameter. In SMUGGLE, core formation is accompanied by large degrees of non-circular motion, with gas rotational velocity profiles that consistently fall below the circular velocity out to kpc. This may artificially mimic larger core sizes when derived from observable quantities compared to the size measured from the dark matter distribution ( kpc), highlighting the need for careful modeling in the inner regions of dwarfs to infer the true distribution of dark matter.
keywords:
galaxies: dwarf – galaxies: structure – galaxies: kinematics and dynamics – galaxies: haloes – dark matter – cosmology: theory1 Introduction
The difference between the structure of dark matter (DM) halos as predicted by the Lambda-Cold Dark Matter cosmological model (CDM) and that which is inferred by observations of gas rotational profiles in galaxies is a long-standing problem in modern cosmology (Moore, 1994; Flores & Primack, 1994) with a wide range of postulated solutions. The structure of DM halos as predicted by DM-only simulations (e.g. White & Rees, 1978; Springel et al., 2008) is characterized by steeply rising density profiles (‘cusps’) in the inner regions of halos, parameterized by the NFW profile (Navarro et al., 1996b) which gives a power-law slope of this inner profile of . Early measurements of rotation curves in dwarf galaxies have shown regions of constant density known as ‘cores’ with power-law slopes of (e.g. Burkert, 1995; de Blok et al., 2001; de Blok et al., 2008; Kuzio de Naray et al., 2008). While there is substantial evidence for the existence of cores in dwarf galaxies (e.g. Gilmore et al., 2007; Kormendy et al., 2009; Oh et al., 2011, 2015; Lelli et al., 2016), there is debate over the reliability of certain techniques for the inference of the true dark matter potential (Genina et al., 2018; Oman et al., 2019).
Another complication to this dilemma is that observed rotation curves in dwarf galaxies exhibit a wide variety of behavior, including rotation curves that rise more rapidly than the NFW profile, consistent with a contraction of the halo, and those that rise significantly more slowly, consistent with expansion. Despite their success in reproducing many observed properties of galaxies, both local and statistical, (Vogelsberger et al., 2020), hydrodynamical simulations of galaxy formation have consistently predicted a uniform shape for rotation curves, posing a problem in replicating the observed diversity (Oman et al., 2015; Oman et al., 2019; Read et al., 2016; Santos-Santos et al., 2018, 2020).
A theoretically appealing solution to these discrepancies is that the nature of DM is more complex than proposed in CDM. Proposed models include warm dark matter (Dodelson & Widrow, 1994; Bode et al., 2001) and self-interacting dark matter (SIDM, Yoshida et al., 2000; Spergel & Steinhardt, 2000; Vogelsberger et al., 2012, 2019; Rocha et al., 2013; Tulin & Yu, 2018). SIDM has been fairly successful in reproducing diverse rotation curves (e.g. Creasey et al., 2017; Ren et al., 2019; Kaplinghat et al., 2020) and explaining the diversity of MW satellites (Zavala et al., 2019). It is worth noting, however, that results for SIDM can depend strongly on the adopted cross-section. Another interesting proposal includes a new hypothetical ultra-light scalar particle with a de Broglie wavelength on astrophysical scales, forming a Bose-Einstein condensate the size of the DM halo, known as fuzzy dark matter (Hu et al., 2000; Mocz et al., 2017; Lancaster et al., 2020; Burkert, 2020). While these models prove viable alternatives to CDM with testable predictions (Robles et al., 2017; Bozek et al., 2019), they may remain difficult to distinguish from CDM on small scales, especially when the effects of galaxy formation are taken into account (Elbert et al., 2018; Fitts et al., 2019).
It has also been proposed that the feedback-driven motion of baryons within the halo can gravitationally perturb the dark matter potential, leading to expansion (Navarro et al., 1996a). The repeated outflow of gas following bursts of star formation (SF) has been demonstrated to be a more realistic mechanism for core formation than single, highly violent outbursts (Read & Gilmore, 2005; Governato et al., 2010). This framework was theoretically quantified by Pontzen & Governato (2012) who introduced an analytical model for core formation in which dark matter particles acquire energy and migrate to more distant orbits via repeated oscillations in the central gravitational potential, driven by supernova (SN) feedback.
Since the physics of star formation and feedback have not been fully constrained, different effective models of interstellar medium (ISM) physics implemented across the literature have produced different outcomes. For example, the Illustris simulations have been successful in reproducing many properties of galaxies (Genel et al., 2014; Vogelsberger et al., 2014a, c), but have not been able to produce DM cores (Chua et al., 2019). The EAGLE simulations (Schaye et al., 2015) have also been shown to not produce DM cores under their fiducial model (Schaller et al., 2015; Benítez-Llambay et al., 2019). Zoom-in simulations using the same prescriptions as EAGLE and Illustris have been performed and similarly demonstrate an inability to induce expansion in the DM halo (e.g. Bose et al., 2019), indicating that resolution is not responsible for this effect in these models. Meanwhile, other simulations, including Zolotov et al. (2012), the FIRE project (Hopkins et al., 2014, 2018; Chan et al., 2015; Wetzel et al., 2016; Fitts et al., 2017), and NIHAO (Wang et al., 2015; Tollet et al., 2016; Dutton et al., 2016), have been able to produce cores in dwarf galaxies that more closely match observations, indicating that the prediction of DM cores is model-dependent to some degree.
Differences in the modeling of baryonic physics have long been quantified by the SF density threshold, which is the minimum gas density required to form a star particle. Pontzen & Governato (2012) showed that cosmological zoom-in simulations run with the Gasoline code were unable to induce core formation when using a value of cm-3, but cores did indeed form when increased to cm-3, a value consistent with the observed densities of molecular clouds (Ferrière, 2001). Recent work has therefore focused heavily on this parameter, arriving at similar conclusions within the EAGLE simulations (Benítez-Llambay et al., 2019), and NIHAO (Dutton et al., 2019). It has long been reported that ‘bursty’ SF drives repeated outflows, thereby expanding the DM halo by driving mass to the outer regions (Brooks & Zolotov, 2014). Benítez-Llambay et al. (2019) conclude from their numerical tests on the density threshold that rapid fluctuations in gas content resulting from bursty SF are insufficient to alter the inner DM halo, but that gas must accrete to high levels of density, dominating the inner gravitational potential before being blown away in order to induce core formation. They also make note that there is no simple relation between SF history and core formation. Dutton et al. (2019) also find that a higher value of induces cores in the NIHAO simulations, but their analysis suggests that fluctuations in SF feedback (and therefore gas content) must occur on sub-dynamical timescales in order to induce core formation. Both authors agree that SF burstiness is insufficient to fully explain halo expansion, and that the density threshold is strongly indicative of a resulting flattened inner DM distribution.
The energetics of core formation discussed in Pontzen & Governato (2012) require rapid motion of sufficiently dense gas clouds in the inner regions of galaxies in order to perturb the gravitational potential and transfer DM to larger orbits. High resolution simulations that lack detailed physical modelling are unable to capture the small-scale effects of energetic coupling between SF and the ISM due to the use of low star formation threshold, often with , as well as effective equations of state rather than explicitly implemented cooling physics. Meanwhile, detailed ISM models that self-consistently treat a multiphase, structured ISM are relatively new and have not been directly applied to the problem of core formation. In short, the majority of models that have been used to study this problem are empirically calibrated to reproduce scaling relations of populations of galaxies and implemented in large-volume simulations. These models have been adapted to high resolution zoom-in simulations, with mixed results (Benítez-Llambay et al., 2019; Bose et al., 2019). Fewer studies have focused on studying core formation as a thoroughly small-scale problem, requiring both high resolution zoom-in simulations and models that capture the local details of physical processes relevant to the state of the ISM. More details of the varying approaches to galaxy modeling are given in a recent review of cosmological simulations (Vogelsberger et al., 2020).
While there is broad agreement in the literature that high thresholds induce cores (e.g. Governato et al., 2010; Macciò et al., 2012; Teyssier et al., 2013; Di Cintio et al., 2014, among the previously listed) and low thresholds do not do not (Oman et al., 2015; Schaller et al., 2015; Bose et al., 2019), there have been limited systematic investigations of the physical outcomes of modeling choices, including comparative analyses of parameters within the same overall modeling scheme. The consistency of models with similar does not rule out the possibility that other modeling choices contribute to halo expansion, including ones that cannot be neatly quantified by a single parameter.
Beyond the physical effects of baryons, difficulties in observing and modeling gas rotation curves in galaxies have led to speculation that large uncertainties might be partially responsible for the observed diversity of galactic rotation curves. While extensive work has been done to improve observational techniques for estimating velocity profiles (Kuzio de Naray et al., 2006, 2008; Adams et al., 2014), techniques based on alignment of metallicity populations (e.g. Walker & Peñarrubia, 2011) and tilted-ring modeling (e.g. Rogstad et al., 1974; Iorio et al., 2017) have been recently been demonstrated via application to the APOSTLE simulations to predict DM cores when none actually exist (Genina et al., 2018; Oman et al., 2019). This, combined with the large degenerecies in modeling rotational velocities in the presence of non-circular motions (Marasco et al., 2018; Santos-Santos et al., 2020) suggest that the observed diversity of rotation curves might not be solely a result of physical processes within galaxies, be they baryonic or dark.
In this study, we compare the novel Stars and MUltiphase Gas in GaLaxiEs (SMUGGLE) feedback model (Marinacci et al., 2019) to the classic Springel & Hernquist (2003; SH03 hereafter) model, as they represent two paradigms of galaxy formation modeling (i.e. top-down – SH03, and bottom-up – SMUGGLE) while implementing the same method of solving gravity+hydrodynamics (Arepo, Springel, 2010). We aim to investigate the differences in and relationship between galaxy formation and DM distribution within these two modeling paradigms in a controlled environment through the use of idealized simulations of a single dwarf galaxy. We also implement variations in model parameters (density threshold and local SH efficiency) within SMUGGLE to shed light on their relevance to core formation within this model, and how their differential effects within this model compare to previous numerical experiments.
The paper is organized as follows: in Section 2, we discuss the set up of our isolated dwarf galaxy simulations; in Section 3, we compare the phenomenological differences between an isolated dwarf galaxy ( M☉, M☉) run with each model, and then introduce variations in the SMUGGLE model to investigate the physical nature of core formation in Section 4. We conclude in Section 5 by examining the morphology of each run, including an investigation of the variation of rotational velocity curves of gas. We summarize our findings in Section 6.
2 Methods
We analyze a set of high-resolution, idealized simulations of isolated dwarf galaxies of M☉ in halos of mass M☉ run with the moving mesh code Arepo (Springel, 2010; Weinberger et al., 2020). This scale of stellar mass to halo mass has been demonstrated to form feedback-driven cores in other simulation codes (e.g. Di Cintio et al., 2014; Tollet et al., 2016).
Initial conditions were generated via the method described in Springel et al. (2005), while star formation and feedback were subsequently enabled via the SMUGGLE model (Marinacci et al., 2019). SMUGGLE implements a wide variety of sub-resolution processes, including gas heating and cooling from which a detailed, multiphase inter-stellar medium (ISM) emerges, a stochastic formation process for stars, and feedback via supernovae (SNe), radiation, and stellar winds.
Previous work with SMUGGLE includes Li et al. (2020), who study the formation of giant molecular clouds (GMCs) in Milky-Way mass galaxies, in particular the response of GMCs to various choices of the local star formation efficiency - a parameter we study here as well. They find that SMUGGLE is able to regulate star formation through feedback, with a 3-fold increase in star formation rate (SFR) in runs with no feedback processes enabled. This result is encouraging as it enables self-consistent prediction of kpc-scale galaxy properties. Further, they demonstrate that SN feedback disrupts the spatial correlation of GMCs on scales kpc, which is relevant to our discussion on core formation later on. In addition, the SMUGGLE has been further refined with the development of a state-of-the-art model for the treatment of radiation fields, dust physics, molecular chemistry, and metal cooling by Kannan et al. (2020). This model is able to produce a more complex picture of the ISM of galaxies while maintaining consistent global properties, such as SFR.
2.1 The SMUGGLE ISM Model
In this work, we implement the standard SMUGGLE model as described in Marinacci et al. (2019). Here we summarize the main physical modeling choices. The primary processes include gravitational hydrodynamics, which is solved by Arepo (Springel, 2010), gas heating and cooling which produce an emergent multiphase ISM, the stochastic formation of star particles, and feedback from stars and SNe.
2.1.1 Heating and cooling
One of the biggest differences in SMUGGLE compared to previously implemented ISM models in arepo (e.g. SH03, Vogelsberger et al., 2014a; Pillepich et al., 2018) is its ability to explicitly model a cold gas phase with temperatures falling below T K. First, a primordial mix of Hydrogen and Helium is modeled by a network of two-body processes including collisions, recombination, Compton cooling via CMB photons (Ikeuchi & Ostriker, 1986), and UV-background photoionization (Faucher-Giguère et al., 2009).
Cooling has two main regimes, metal-line cooling driving the gas temperature down to the warm phase (T K) – which was included in previous ISM models – while fine structure and molecular cooling implemented in SMUGGLE allows the gas to further cool to K. Cooling rates are calculated in a UV background with the Hopkins et al. (2018) fit as a function of temperature, metallicity, gas density, and redshift, with self-shielding taken into account at as in Rahmati et al. (2013). The calculated rates are then scaled to the metallicity of the gas cell. By default, metallicities are updated self-consistently as the simulation evolves in arepo. However, for idealized set-ups metallicity can be fixed to offset the lack of replenishment of pristine gas from cosmological infall. For simplicity, in this paper we fix the metallicity of our idealized runs to the solar value.
2.1.2 Star formation
Star particles representing single stellar populations with a Chabrier (2001) initial mass function are formed probabilistically in cold, dense gas. Gas is determined to be eligible for star formation based on several criteria. The first is the gas density threshold, below which no gas can be converted into a star particle. SMUGGLE adopts a value of 100 cm-3, in line with observations of giant molecular clouds (Ferrière, 2001). Star formation is also restricted to gravitationally self-bound regions (see Hopkins et al., 2018). Additionally, star formation rates may be computed according to the H2 fraction, though it is usually in sufficiently dense gas.
The probability of an eligible gas cell to be turned into stars is determined via , where is the gravitational dynamical time of the gas and its star formation rate. In its default mode, the local SF efficiency parameter is assigned a value of 0.01 to match the low efficiencies measured in observations (Smith et al., 2018), although Hopkins et al. (2018) showed that the exact level of feedback-regulated star formation is independent of . We explore in Section 4 the effect of on our SMUGGLE simulations.
In addition to the default mode described above, SMUGGLE can also be run using the variable efficiency model (vareff), which implements a variable star formation timescale (). This quantity, defined as = / , is varied for each grid cell according to its virial parameter (), which quantifies the cell’s ability to resist gravitational collapse via thermal support and gas pressure. The exact parameterization is given by Eqn. 1 below (Padoan et al., 2012; Semenov et al., 2016).
| (1) |
This model prioritizes star formation efficiency in highly dense regions. In Section 4.1, we investigate both a variable efficiency model, and one that maximizes the local star formation efficiency. Note that since , a parameterization on is equivalent to a parameterization of the efficiency , all other quantities being the same for a given cell.
2.1.3 Feedback
Stellar feedback is modeled locally according to several sources including stellar winds, radiation from young stars and supernovae (SNe). Stellar winds due to massive OB and AGB stars contribute to the mass return to the ISM and are taken into account during the pre-processing of the gas. Cumulative mass loss from OB stars, as well as energy and momentum returned from both OB and AGB stars are determined via the parameterizations presented in Hopkins et al. (2018), while AGB wind mass transfer is given by Vogelsberger et al. (2013). All the properties determined from the different feedback channels are then injected with corresponding metallicity to the surrounding gas in the rest frame of the star. Stellar winds are a continuous process, and are thus treated continuously across each time step for each star particle.
Radiative feedback from young stars change the ionization, thermal, and dynamical state of the ISM, pre-processing the media where later SNe will go off. SMUGGLE includes a treatment of photoionization aimed at capturing the formation of HII regions by young, massive stars. Ionizing photon rates from young stellar particles are calculated by choosing a mass-to-light ratio and average ionizing photon ( eV) energy to correspond with a K blackbody spectrum, consistent with OB type stars. The number of available photons in a given timestep is used to stochastically photoionize neighboring gas cells after accounting for the expected number of recombinations. Photoionized cells are then updated to be fully ionized and placed at a temperature K. In addition to photoionization, young stars exert radiation pressure on neighboring gas cells, which is calculated according to their optical depth and position within the kernel. Multiple IR scattering is included, by assuming an average opacity cm2 g-1 (Hopkins et al., 2018). In the regime of small mass galaxies explored here, photoionization is expected to dominate among the radiation effects on the ISM, lowering the density of gas in the neighborhood of massive stars (Sales et al., 2014; Hopkins et al., 2018).
Lastly, we stochastically model the injection of energy and momentum by discrete SN events onto neighbouring gas cells. It is important to note that SMUGGLE resolves individual SN explosions, and as such, the injected rates of energy and momentum are not continuous. The temporal distribution of individual Type Ia events is found by integrating the delay time distribution, which accounts for the approximate lifespan of an 8 M☉ main sequence star, with rates and energetics consistent with observations (Greggio, 2005) as well as previous implementations in Arepo (Vogelsberger et al., 2013), with each event releasing the same mass of ejecta (Thielemann et al., 2003). The total number of Type II SNe is found by integrating the Chabrier IMF of each stellar particle. If necessary, we account for PdV work in the (unresolved) Sedov-Taylor phase by applying a momentum boost to match the terminal momentum per SN, which depends primarily on local density and metallicity (e.g. Cioffi et al., 1988). Energy and momentum are distributed to surrounding gas cells following a kernel weighting and a maximum coupling radius, as described in detail in Marinacci et al. (2019).
| Name | [pc] | [M☉] | Model description | |
|---|---|---|---|---|
| SMUGGLE / fiducial | 431.3 | 7.76 M⊙ | default SMUGGLE model | |
| SH03 | 160.2 | 4.29 M⊙ | Springel & Hernquist (2003) model | |
| rho0.1 | 324.2 | 9.69 M⊙ | SMUGGLE with reduced gas density threshold, cm-3 | |
| eSF100 | 490.7 | 8.39 M⊙ | SMUGGLE with maximized local SF efficiency, | |
| vareff | 528.3 | 9.12 M⊙ | SMUGGLE with the variable efficiency model, see Sec. 2.1.2 |
2.1.4 Variations on the fiducial SMUGGLE model
We will explore in Section 4 the effect of changing some of the default choices in SMUGGLE and how this affects the formation of dark matter cores and the properties of our simulated dwarfs. The changes will be inspired by results presented previously in the literature, including Read et al. (2016); Benítez-Llambay et al. (2019); Bose et al. (2019). More specifically, we choose to vary the star formation gas density threshold and the local star formation efficiency .
Table 1 summarizes our runs, which include the fiducial SMUGGLE run, SH03, and three variations on SMUGGLE as discussed in Section 4.1: (i) rho0.1, using a reduced star formation density threshold of cm-3; (ii) eSF100, which maximizes the local star formation efficiency to 100 per cent, ; and (iii) vareff, a variable efficiency model which chooses a value between and depending on the density of the surrounding ISM. The fiducial SMUGGLE model implements these parameters with values of cm-3 and .
2.2 The Springel and Hernquist Model
In addition to the fiducial SMUGGLE model, we run a simulation with the SH03 model (Springel & Hernquist, 2003), which forms the basis for the ISM treatments in Illustris (Vogelsberger et al., 2014a, c), Auriga (Grand et al., 2017) simulations, EAGLE (Schaye et al., 2015), APOSTLE (Sawala et al., 2016), HorizonAGN (Dubois et al., 2014), SIMBA (Davé et al., 2019), and others. The SH03 model, also run with the Arepo gravity and hydrodynamics solver, uses an equation of state treatment of cold gas modelled with a two-fluid approach (cold clouds embedded in a lower density hot gas bath) to describe the interstellar medium. This approach, which has been demonstrated to be successful at modeling the kpc-scale properties of galaxies, has been found to not form dark matter cores (Vogelsberger et al., 2014b; Bose et al., 2019).
We explicitly include stellar winds in the SH03 run with the wind velocity calculated directly from the energy and momentum summation of all SN in a given timescale and independent of halo properties. This is different from, for instance, the Illustris or Auriga projects, where the wind velocity is scaled to the dark matter velocity dispersion of the subhalo. Although such scheme is de-facto closer to the scalings expected for momentum-driven winds (Murray et al., 2005) and shown to more accurately reproduce some galaxy and CGM observables (e.g. Davé et al., 2011), we choose a simpler wind model where no pre-assumptions are made with respect to the properties of the host halo, in an attempt to establish a fairer comparison with the SMUGGLE runs where no input information is required about the galaxy host. Ultimately, the impact of the exact modeling of the winds in our SH03 run is subdominant to the differences imprinted by the modeling of the ISM itself. As is the case in Illustris, Auriga, and other projects mentioned above, the wind particles in the SH03 model are artificially decoupled from the hydrodynamics for a short period of time, while such a treatment is not necessary in our new SMUGGLE prescription where outflows naturally arise from the kinematics and thermodynamics of stellar winds and SN explosions.
2.3 Isolated Galaxy Setup
Throughout this paper, we analyze simulations run with different ISM models applied to the same initial conditions (ICs). We initialize an isolated, idealized dwarf galaxy with M☉ using the method outlined in Springel et al. (2005). The distribution of dark matter is initialized according to a Hernquist profile (Hernquist, 1990),
| (2) |
where is a concentration-dependent scale length. This model is identical to the widely used NFW profile (Navarro et al., 1996b) at small radii (), while the power law exponent differs at large radii: versus . Both models have been shown to accurately describe the distribution of DM for halos in a cosmological context.
The galaxy itself is initialized with an exponential disk of scale length for both stars and gas, in addition to a spherical stellar bulge modeled by the Hernquist profile. See Section 2 of Springel et al. (2005) for more details on the model galaxy setup. We choose parameters for our model galaxy consistent with the ‘Dwarf/SMC’ setup described in Hopkins et al. (2011), which gives a DM dominated dwarf galaxy similar to the pre-infall Small Magellanic Cloud with total baryonic mass M☉, gaseous disk with M☉, and DM halo with M☉ and concentration parameter .
The partitioning of cells in the initial conditions is done by setting the number of gas particles, , with , , and . For the runs analyzed herein, we choose , resulting in a particle mass of M☉. We choose the same value of gravitational softening for all particle types, with pc. We have also run a set of simulations with an order of magnitude lower resolution ( pc) for convergence testing. We find excellent agreement between the two resolution levels tested, as shown in Figure 12.
3 Forming Dark Matter cores in SMUGGLE
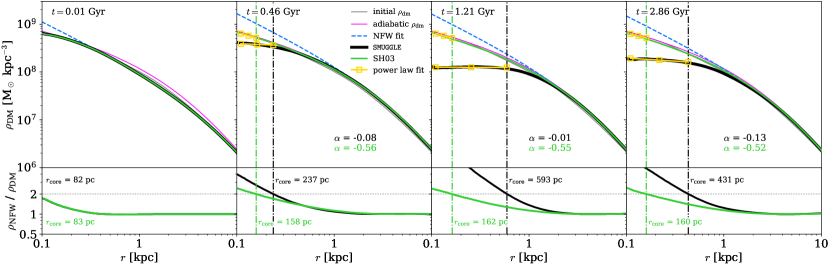
We explore the evolution of the dark matter density profile in our simulated dwarf galaxy in Figure 2, where each panel corresponds to different times, as labeled. The results of the default SMUGGLE model are shown in the solid black line, which demonstrates a clear flattening in the inner regions corresponding to the formation of a dark matter core in our initially cuspy halo. For reference, we include the initial dark matter distribution in each panel with a solid gray line.
3.1 A consistent method for core size measurements
3.1.1 Caveats & numerical effects
Figure 2 shows density profiles for various runs implementing the same ICs. We find the best fit NFW profile to the outer ( kpc) dark matter distribution. The bottom panels in Figure 2 show the ratio between the analytic NFW fit and the measured DM density in the fiducial SMUGGLE simulations (solid black lines). Although in the outskirts the simulated profiles are very well described by the NFW fits (), in the inner regions the analytic profile clearly overestimates the dark matter density in all cases. This is partially due to adiabatic contraction, demonstrated by the magenta line. In the case of SH03, feedback is not capable of producing further changes in the DM distribution, resulting in a profile almost identical to the adiabatic run, while the SMUGGLE model is able to produce an extended region of constant density by later times. Additionally, the shape of the galaxy can affect the resultant DM distribution. In the case of disks, this can lead to shallower central profiles (Burger & Zavala, 2021).
We note that numerical effects can spuriously transfer kinetic energy between particles of different masses, such as our gas and DM particles (Ludlow et al., 2019a). A thorough investigation of the effects of gravitational softening and ‘numerical feedback’ have been presented in Ludlow et al. (2019b); Ludlow et al. (2020). While we adopt softening on the order suggested by van den Bosch & Ogiya (2018) – approximately three times lower than the convergence radius – it is possible that spurious energy transfer between DM and baryonic particles via 2-body interactions contributes to the observed halo expansion. However, our tests are designed to isolate the effects of feedback. Numerical effects will be present in all our simulations, including the adiabatic and SH03 runs, but the methods of feedback coupling to the ISM vary. As such, our claims are about the differential effects between feedback implementations, not predictions of the absolute core sizes expected within dwarf galaxies in a cosmological context.
3.1.2 Core size measurement
Following Benítez-Llambay et al. (2019), we define as the location where the simulated dark matter density is a factor of 2 lower than the extrapolated best-fit NFW profile, . However, we note that the authors compare against a low-threshold run rather than an NFW. Hydrodynamic relaxation may lead to a difference in predicted core radius. The measured is indicated with a vertical dashed line and listed in the lower panels.
This definition is robust to variations on in the range kpc (see Figure 13 in the Appendix). Figure 2 shows that the density profile within for the fiducial SMUGGLE run is nearly flat at later times. We quantify this by finding the slope of a power-law fit to the dark matter density between the convergence radius and , where is defined as the radius containing 200 DM particles (as in Klypin et al., 2001; Hopkins et al., 2018), and is typically around 50 pc in size. For reference, the measured slopes are quoted in each panel.
While the initial DM distributions of our simulations follow a Hernquist profile, we find no difference in measured core radius when using Hernquist or NFW parameterizations, consistent with the intended similarity between the fits for . While some choices of our methodology are arbitrary, we find that it consistently produces an accurate characterization of the physical extent and slope of the constant density inner regions. We show in the Appendix that core formation is well converged and robust to numerical choices, such as resolution and (see Figs. 12 and 13).
3.2 Halo response to SMUGGLE versus SH03 models
Interestingly, and in contrast to previous results of model implementations within Arepo (e.g. Marinacci et al., 2014; Chua et al., 2019; Bose et al., 2019), we find that the new SMUGGLE model develops a well-defined constant-density core with radius pc in our idealized M☉ dwarf halo. In comparison, the same initial setup run with the SH03 model does not robustly form a core.
In practice, our method suggests pc (see bottom panels) for the SH03 run, although this is more consistent with a relaxation effect than a true dark matter core achieved by repeated perturbation of the potential. This is further supported by the inner slope , which is far from being a flat constant density distribution () as found for our fiducial SMUGGLE run and instead remains steep (), consistent with that of the initial condition over a similar distance range. In addition, we have run an adiabatic (i.e. no star formation or feedback) version of the same initial setup for Gyr. By our methods, we calculate time-averaged values of pc and for the adiabatic run, indicating that the behavior seen in SH03 is consistent with relaxation and is not representative of a feedback-induced core. Note the similarity between the green SH03 and magenta adiabatic curves in Figure 2.
We therefore find that the SH03 ISM treatment does not create a core, in agreement with previous studies implementing similar models (e.g. Marinacci et al., 2014; Bose et al., 2019) while the new ISM treatment SMUGGLE results in clear halo expansion. The measured core extends over several hundred pc, which is well beyond the gravitational softening for the dark matter pc or the convergence radius pc.
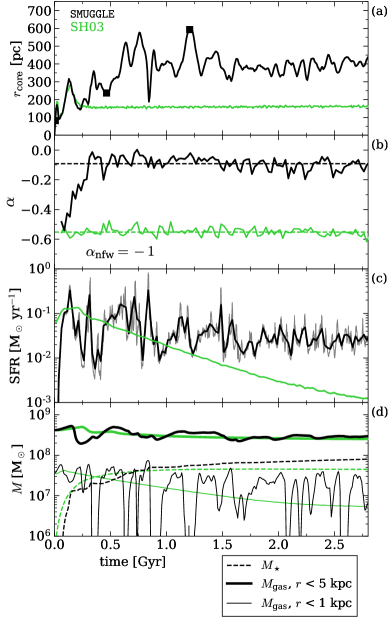
A more detailed description of the time evolution for the core is shown in the panels (a) and (b) of Figure 3, showing the core radius and the power law slope of the inner region of the dark matter density profile. In SMUGGLE, the core radius grows during the first Gyr, after which it settles on an average pc with fluctuations. The slope flattens from to in the first half Gyr, where it remains for the rest of the simulation. In contrast, SH03 relaxes into a stable density distribution with pc and no significant change in slope, resulting in a cusp rather than a core.
Panel (c) of Figure 3 compares the star formation histories in the SMUGGLE and SH03 runs. The rapid fluctuations in the SMUGGLE run are sustained throughout the Gyr of run time, though with decreased burstiness after Gyr. This contrasts the smoother SFR from the SH03 ISM model. In fact, SH03 shows a declining SFR, likely due to the lack of cold inflows and depletion of all eligible star forming gas. The cooling implementation of SH03 results in an effective temperature floor of K, such that, with the lack of cold inflows, no new gas is able to condense to sufficiently high densities to fuel star formation. As a result, the final stellar mass formed in SMUGGLE is larger compared to SH03.
Note that this burstiness in the star formation of SMUGGLE is associated to fluctuations on the gas mass in the inner 1 kpc (Figure 3, panel d), while SH03 simply depletes the gas content in this region. As discussed in Pontzen & Governato (2012), such mass fluctuations in short timescales can cause the local gravitational potential to non-adiabatically change resulting in the expansion of dark matter orbits and, consequently, on the formation of a lower density core. In the case of SMUGGLE, although the gas content is changing very abruptly in the very inner regions (thin) and less so outwards, the mass fluctuation can be discerned quite far out into the main body of the galaxy, kpc.
What is driving these differences between the ISM models? Discussions in the literature have cited rapid fluctuations of the potential in the inner regions (Navarro et al., 1996a; Pontzen & Governato, 2012), burstiness of star formation rates (Madau et al., 2014; Chan et al., 2015; Tollet et al., 2016; Dutton et al., 2019), and high gas densities such that it dominates the central potential (Benítez-Llambay et al., 2019). These features are all present in the SMUGGLE treatment but not in the SH03-like models, explaining why core formation is achieved in SMUGGLE but not in previous ISM treatments in Arepo.
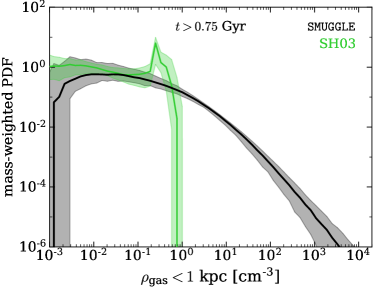
Figure 4 shows the time-averaged gas density distribution within 1 kpc for each run. This distribution is calculated with equal logarithmically spaced bins between and at each snapshot. The median gas density is then calculated for each bin to construct the final gas density distribution, with standard deviation about the median shown as shaded regions.
As a result of the molecular cooling and other physics modeled in SMUGGLE, the typical gas densities achieved in SMUGGLE can be several orders of magnitude higher than in SH03. This run results in very few gas particles denser than cm-3 (green curve) while about half of the gas in the SMUGGLE run is above that threshold and up to cm-3. The high gas densities achieved by SMUGGLE are instrumental in gravitationally perturbing the dark matter to create cores, while the wide range of densities reached in the inner 1 kpc indicates repeated disruption of dense gas from feedback in central star forming regions, maintaining a multi-phase nature that compares well with observations of real galaxies. While models based on an equation of state ISM treatment might be able to reproduce and predict statistical properties of galaxy populations as well as large-scale structure with remarkable success (e.g. Vogelsberger et al., 2014a; Marinacci et al., 2014; Schaye et al., 2015; Sawala et al., 2016; Grand et al., 2017; Pillepich et al., 2018), they cannot capture the interplay between DM and baryons on small scales, where the contribution of baryons to the gravitational potential is significant.
4 The Effect of the ISM Model Parameters
4.1 Variations on SMUGGLE
In addition to the fiducial SMUGGLE model and SH03, we have run three simulations using the same initial conditions with variations on key parameters in the SMUGGLE ISM model: (i) rho0.1 reduces the star formation gas density threshold111The H2 star formation requirement discussed in Section 2.1 was lifted to allow the density threshold to take full effect. from the fiducial value of = 100 cm-3 to = 0.1 cm-3 to mimic the value used in simulations such as SH03 and EAGLE (Vogelsberger et al., 2013; Crain et al., 2015, respectively); (ii) eSF100 increases the star formation efficiency from the fiducial value of = 0.01 to = 1 to compare with FIRE (Hopkins et al., 2018); and (iii) vareff, which parameterizes (see Section 2.1.4, Eqn 1) to maximize star formation in dense, self-gravitating gas clouds. Table 1 summarizes these runs and their key features.
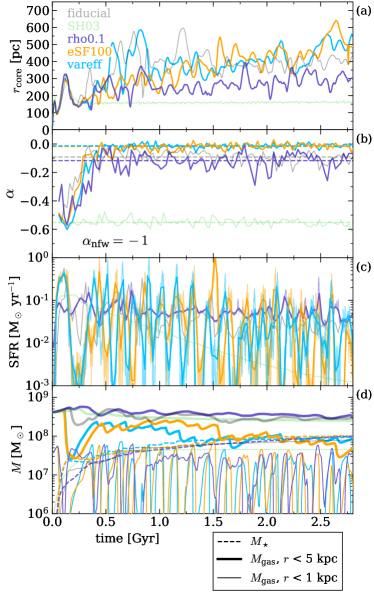
Figure 5 shows time-dependent properties of the variations on SMUGGLE, with the original two runs shown in faded, thin lines. The core radius and slope are shown in Panels (a) and (b). We find that all SMUGGLE runs form clearly defined cores, with shallow slopes and core sizes larger than demonstrated in SH03. We find that time-averaged ( Gyr) values of vary from pc in extent, with slopes of . This is within the range of core sizes observed for dwarf galaxies in the literature, with typical values of (de Blok et al., 2001; Oh et al., 2011, 2015).
We find variation between the different SMUGGLE runs. The low threshold rho0.1 forms the smallest , as expected, though much more of a robust core than the mild expansion seen in SH03. Interestingly, the high efficiency run eSF100 appears to form its core slower than fiducial, but ends up with a larger core by the final time. The variable efficiency run vareff forms its core early on – similar to fiducial – but continues to grow at later times. These variations, however, are relatively minor. The primary distinction between the fiducial SMUGGLE model and its two increased efficiency variations appears to the continued growth of the core over time as a result of the sustained burstiness of their star formation. This is likely due to the increased energy injection into the ISM via the efficient star formation and SN feedback. That is, a much higher fraction of gas that is eligible to turn into star particles is converted. For contrast, the fiducial SMUGGLE model only turns 1 per cent of the eligible gas into stars (on an average, not per-particle basis), in accordance with observations of GMCs (Smith et al., 2018). These strong blow-outs represent a somewhat different, more violent mode of core formation than exhibited in the fiducial run, which experiences smaller, more frequent outbursts. Convergence among runs to universally shallow slopes is notable. However, we do still observe that the higher efficiency runs eSF100 and vareff form slightly shallower cores with , while rho0.1 and fiducial form cores with .
Panels (c) and (d) of Figure 5 show the SFR, stellar mass, and gas mass versus time for all runs. The SFRs we observe in the new SMUGGLE models are within expectation. The rho0.1 run maintains a higher average SFR due to a lower , which effectively increases the amount of gas that is eligible for SF at any given timestep. Meanwhile, the higher efficiency runs see extremely bursty star formation histories due to a cycle of intense star formation, feedback that blows gas out of the inner regions, and re-accretion of gas to eligible SF densities. Despite these differences in star formation, we find excellent convergence in for all SMUGGLE runs, with all runs reaching a final value within 20% of one another.
However, we do find differences in gas content and nature of outflows between these runs. We see that rho0.1 retains more of its gas within 5 kpc than fiducial while also undergoing fewer and shallower outflows (seen as dips in the gas mass). In stark contrast, the highly efficient runs lose a majority of their initial gas content by the end of the simulation, undergoing frequent and larger outflows than either rho0.1 or fiducial, retaining only 20% of their original gas mass by Gyr.
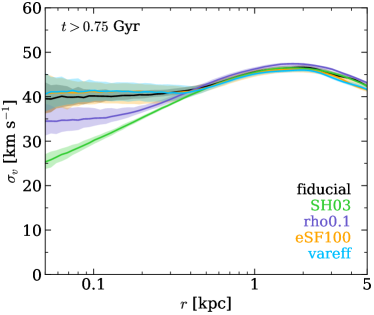
Figure 6 shows the DM velocity dispersion for all runs, averaged over the final 0.5 Gyr of the simulations. We find results roughly as expected: the velocity dispersion of SH03 is consistent with a cuspy NFW profile, while the SMUGGLE runs form ever-flatter inner profiles, approaching the constant- signature of an isothermal profile with the higher efficiency runs, as expected from self-interacting dark matter models (Vogelsberger et al., 2012; Rocha et al., 2013; Tulin & Yu, 2018; Burger & Zavala, 2019). While it is interesting to see isothermal velocity dispersion profiles generated as a result of baryonic feedback, these results are not identical with expectation from SIDM. For example, profiles in SIDM are isothermal to much larger radii, then immediately decline, whereas the contribution from baryons results in a sizable bump at intermediate radii with a smoother tail. This may a possible avenue to distinguish SIDM from baryonic feedback (Fitts et al., 2019). Additionally, the isothermal profiles seen in the SMUGGLE runs demonstrate that they are not in dynamical equilibrium, an effect we discuss in Section 5.2.
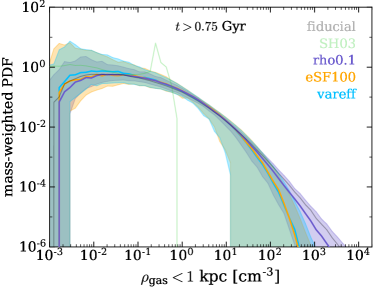
As discussed previously, examining average gas densities can be a useful exercise to understand the behavior of both the DM and the baryons. Figure 7 shows the same time-averaged gas density calculation as Figure 4, but for all runs, including shaded regions for standard deviations. Interestingly, we find that rho0.1 is able to produce gas densities well above its star formation threshold of cm-3, with an almost identical distribution to fiducial, though slightly favoring lower densities. In contrast, the runs with higher efficiencies (eSF100 and vareff) are limited to gas densities at or near the standard value of = 100 cm-3, with slightly lower values in the fully efficient eSF100 than in the selectively efficient vareff. The changes in the high-density tail between fiducial SMUGGLE model and eSF100 are consistent with results from Li et al. (2020), who investigated the effects of this parameter on GMCs in MW-mass galaxies.
4.2 The role of modeling parameters
As discussed in Section 3, we find that the same isolated galaxy setup run with the SH03 feedback model does not form cores due to its relatively low density gas and its lack of bursty star formation. It is generally claimed that these features are governed by the choice of in the model (Pontzen & Governato, 2012; Bose et al., 2019; Benítez-Llambay et al., 2019), however, the clear differences between SH03 and rho0.1, both of which implement a low density threshold of = 0.1 cm-3, demonstrate that the physics of core formation is dependent on factors beyond this parameter.
The physical differences between these runs is clear: rho0.1 has somewhat bursty star formation, dense gas, and SN-driven outflows of gas from the central regions, while SH03 has monotonically decreasing SFR, sparse gas, and no discernible feedback-driven outflows. If both runs implement = 0.1 cm-3 yet achieve such different outcomes, other differences in subgrid physics must be to blame. The unstructured ISM of the SH03 feedback model is a result of its conception as a model for large-scale structure simulations, and is not particularly well suited for studying small-scale structures of galaxies and their halos, such as DM cores. The detailed ISM model implemented in SMUGGLE is able to achieve much higher gas densities, resolving multiple physical gas phases at smaller scales, as well as achieving the bursty star formation necessary to form cores.
The difference in density achieved by these two runs (Figure 7) therefore points to two facts: (1) the physical gas density achieved by a simulation is not solely governed by , especially when using local star formation efficiencies lower than 100 per cent and (2) gas density and star formation burstiness (which drive outflows and subsequently core formation) are a product of the subgrid physics model as a holistic enterprise, including processes such as cooling physics and self-shielding, as well as resolution to the extent that such processes are resolution-dependent, rather than any individual parameter. However, changes in relevant parameters, as demonstrated here and in many other works, (e.g. Pontzen & Governato, 2012; Benítez-Llambay et al., 2019, , Burger et al. in prep.) do indeed produce observable differences within the same overall modeling scheme.
In their seminal work, Pontzen & Governato (2012) compare cosmological zoom simulations run with the SPH gasoline code (Wadsley et al., 2004; Stinson et al., 2006) run with two different value of , corresponding to our fiducial value of = 100 cm-3 and a low threshold run with = 0.1 cm-3, as in our rho0.1 run. They find that the low threshold run does not form a core, yet the high threshold run does, comparing the same overall ISM model in both cases. They point out that fluctuations in potential result in the expansion of the orbits of DM particles in the inner halo. We emphasize in this discussion that it is the ability of a model to create these physical density fluctuations that matters in producing DM cores.
As noted by Benítez-Llambay et al. (2019), it is indeed surprising that few systematic tests of the star formation density threshold have been conducted by this time. The authors investigate the effect of a variety of values for spanning 0.1 cm-3 up to 640 cm-3 for cosmological halos in the EAGLE simulations (Crain et al., 2015). They find that core formation is maximized for values between 1 cm-3 and 160 cm-3, but find smaller cores for smaller values of due to the lack of gravitationally dominant gas, and also for larger values due to the inefficiency of EAGLE’s feedback model in this regime. They identify that core formation in dwarf galaxies is not sufficiently explained by either burstiness of star formation or strong outflows of gas within the EAGLE model. Instead, they point to features in the SFH of different halos that produce differences in outcomes of core sizes.
A similar investigation, though over a smaller range of threshold values, was conducted by Dutton et al. (2019, 2020) for the NIHAO simulation project (Wang et al., 2015). They find that, of their halos run with = 0.1 cm-3, 1 cm-3, and 10 cm-3, only those with = 10 cm-3 and stellar mass to halo mass ratio of 0.1–1% underwent strong expansion, in agreement with the trend pointed out in Di Cintio et al. (2014). Further, they identify that variability in star formation feedback must occur at sub-dynamical time-scales to produce expansion of the DM halo.
In the case of gasoline, a change in density threshold was able to predictably alter the outcome of core formation. The picture is somewhat more complex for EAGLE and NIHAO, which find that core formation, while increasing with , is further dependent on SFH, timescale of burstiness, and halo mass, among other things. All these studies examined cosmological simulations. Our idealized numerical experiments seek to eliminate the complexities of cosmological runs, which produce substantial halo-to-halo variations in /, SFH, merger histories, gas fractions, etc. These are all important factors in understanding the diversity of observed galaxies, but can serve to obscure the impact of modeling choices.
Our idealized SMUGGLE runs produced cores for both the fiducial threshold of = 100 cm-3 and the lowered threshold of = 0.1 cm-3, though rho0.1 did produce a somewhat smaller core radius ( pc, versus pc for the fiducial run). When compared to the cuspy profiles of SH03, the core size within these two variations of SMUGGLE can be considered quite similar. This similarity in core size and shape between the two SMUGGLE variations makes sense in light of their achieved physical gas density distributions (Figure 7) versus the highly truncated distribution of SH03, which is incapable of producing cm-3. With an initial mean DM density of 4 cm-3 within 1 kpc, it is clear that, even if SH03 produced fluctuations in gas mass within this region, it would be insufficient to perturb the DM potential.
Another factor that impacts the physics of core formation is the ability of the gravity solver to resolve the free-fall timescale of gas in the centermost star-forming regions of the galaxy. When larger softening lengths are used, the collapse of gas into dense clouds is delayed, and the resulting star formation process will be smoothed out. This leads to fewer discrete star formation events, and a reduction in both the burstiness of star formation and maximum gas density achieved in star forming regions, limiting the growth of cores.
We emphasize that it is the ability of a model to produce both sufficiently dense gas and sufficient variation in baryonic mass in the inner regions of a halo that will allow it to form cores. The ability of to affect these physical phenomena depends (i) on how the chosen modeling prescriptions modulate the effect of that parameter on star formation, (ii) on how energy injection and dissipation distribute energy throughout the ISM, and (iii) on the interplay between resolution and all of the above. In short, the precise role of in core formation is model-dependent. For example, SMUGGLE produces similar inner gas density distributions regardless of the adopted value of , and forms a feedback-induced core in all our explored variations. While the density threshold parameter is a commonly used parameter in ISM models, making it an appealing avenue for study, more attention must be given to the differences between modeling prescriptions with respect to their resulting physical properties (such as the gas density distribution and fluctuations in baryonic mass) before the effects of individual parameters can be understood in proper context.
For example, most treatments of star formation use relatively low values when implementing fixed local star formation efficiencies: (Stinson et al., 2006; Wang et al., 2015). As in our rho0.1, the density threshold is therefore not necessarily an accurate tracer of the actual density achieved by the gas. The actual distribution of gas density will depend more complexly on modeling prescriptions (i.e. realistic versus effective cooling treatments) when using . For this reason, comparing simulations run with distinct modeling treatments but similar does not make sense when considering the dependence of core formation on , as the resulting distribution of gas density and its sensitivity to feedback can vary substantially between models.
5 Galaxy Structure
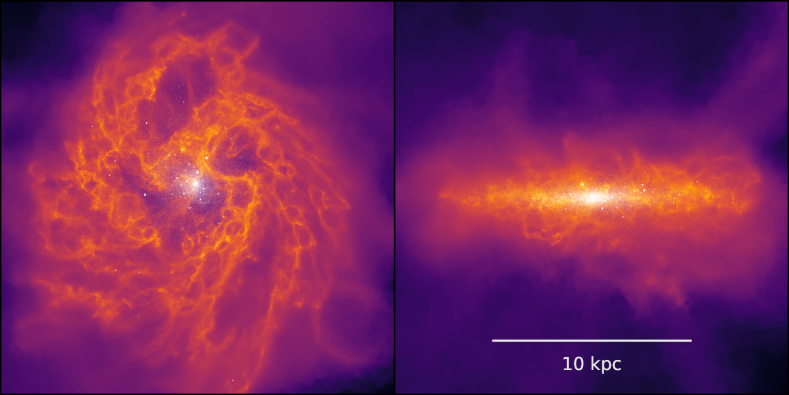
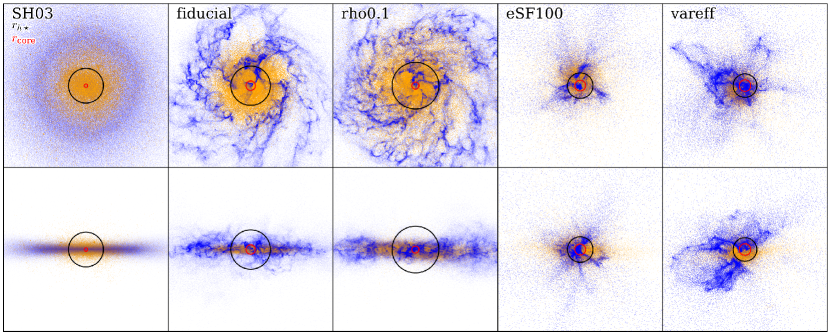
Figure 8 shows face-on and edge-on projections of the four alterations of the SMUGGLE model we consider, with the stellar half-mass radius () shown in green and shown in magenta. The SH03 model shows a uniform disk with an unstructured ISM, along with large and small , while fiducial and rho0.1 show a much more structured ISM, with clear fragmentation containing regions of both dense and rarefied gas. In addition, small pockets representing SN shock fronts can be seen in the face-on image. The disk remains well-behaved, with clear rotation and a roughly even distribution of gas throughout the disk. The ISM of fiducial is somewhat less evenly distributed than rho0.1, resulting in larger pockets of dense and rarefied gas, with an overall more centrally concentrated ISM (as seen in the edge-on projections), though it does maintain a disk morphology with clear cohesive rotation. Conversely, both eSF100 and vareff have highly disturbed gaseous components with no clear rotation and strong radial outflows from more energetic SN feedback. Even the edge-on projections show little traditional disk structure, with the galaxies appearing irregular in structure. In addition, they are much more compact, with roughly half the size of those of SH03 or rho0.1. The core radii of the three SMUGGLE models are larger than that of the SH03 model (as shown previously).
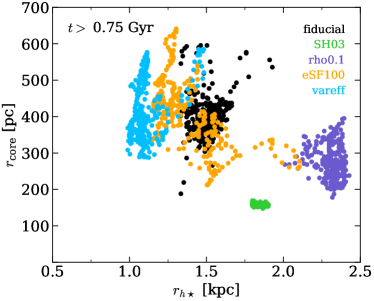
5.1 Morphology and cores
Figure 9 shows the core radius versus the half stellar mass radius for each run at Gyr. We find a fair degree of stratification of the runs with , indicating the effects of different modeling choices on galaxy structure. The variable efficiency run demonstrates the most compact galaxy size overall, mostly hovering aroung = 1 kpc. This concentrated morphology is a result of the maximized star formation efficiency in dense regions (which tend to be near the center of the galaxy) used in this model. The globally maximized star formation efficiency in eSF100 produces a more concentrated galaxy than the fiducial SMUGGLE model, though it also has more variation. This run experienced a large burst of star formation at early times, expanding the initial galaxy, only contracting at later times. This expansion and contraction is seen in the orange dots that extend to the right of = 1.5 kpc, overlapping somewhat with our largest galaxy, rho0.1.
Interestingly, the large core sizes and compact galaxies seen in eSF100 and vareff are contrary to the observed trend in which large cores are expected in low surface-brightness galaxies (Santos-Santos et al., 2020). This may indicate that cores can form in high surface brightness galaxies, but have not yet been detected (either due to incompleteness or the disruption of gas kinematics in systems that may mimic these runs), or it may indicate that high star formation efficiency is not an empirically consistent modeling choice. The latter may be more likely, since most ISM treatments that calibrate this parameter to observed data choose values in the range 0.01 – 0.1 (Stinson et al., 2006; Wang et al., 2015), while models that implement such high efficiencies have other strict criteria on star formation (Hopkins et al., 2014). Again, the effect of this parameter is indeed model-dependent. At least within SMUGGLE, an increased local SF efficiency parameter produces a trend counter to what is currently expected from observational data.
The large extent of rho0.1 is a result of the reduced density threshold, which allows more rarefied gas in the outskirts of the galaxy to form stars, rather than concentrating star formation to the dense gas which collects near the center. The fiducial SMUGGLE model balances each of these effects, producing an intermediate-size galaxy, with kpc throughout its evolution. Each SMUGGLE model produces variation in both the core size and stellar half-mass radius. The SH03 model on the other hand maintains the same core radius and galaxy size throughout its evolution, forming a tight cluster of points. We note again that SH03 did not form a robust feedback-induced core. We include the data here only for contrast with our SMUGGLE runs which did form robust cores.
The variation in both core size and half stellar mass radius is worth noting. Observed galaxies can effectively only be measured at one point in their evolution. While a large sample of observed galaxies helps to sample the variation, it is still impossible to take into account the variation in these properties over a given galaxy’s lifetime. It is certainly possible that extreme values of inner DM density from highly overdense cusps to underdense cores represent local maxima or minima in their fluctuations. We emphasize that a given observation is not necessarily representative of the property’s expectation value. Numerically constraining the predicted fluctuation in such properties like DM core sizes may be a worthwhile addition to the discussion on diversity of rotation curves.
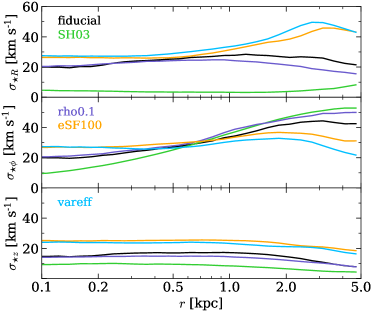
To quantify differences in the kinematic structure between our runs, Figure 10 shows time-averaged (for Gyr) stellar velocity dispersion profiles in cylindrical coordinates, with (radial direction) on the top panel, (direction of disk rotation) in the center, and (direction perpendicular to the disk plane) on the bottom panel. We see that all four SMUGGLE runs have higher than SH03. The grouping of models echos that of their density distributions in Figure 7: fiducial and rho0.1 have similar profiles, and smaller than both eSF100 and vareff, which are also similar to each other. This is a natural result of their higher star formation efficiencies, which results in stronger feedback, disturbing the ISM and causing increased radial motion into the gas due to increase SN activity. The center panel shows , representing the rotation of the disk. Disks with coherent rotation exhibit a typical “S”-shaped curve, such as that of SH03, indicating a smooth increase in rotational velocity towards the outskirts of the galaxy. We see that fiducial and rho0.1 exhibit this characteristic shape, but to a lesser degree as a result of their increased feedback. Naturally, the high efficiency models with their disrupted morphology show a near-constant profile, indicating little to no rotational support. We observe a similar stratification of behavior in the bottom panel, where SH03 shows little gas motion in the -direction, while fiducial and rho0.1 show an increased amount, and eSF100 and vareff show a stronger increase in gas disruption in this direction as a result of the strong feedback that injects a large amount of momentum in the local radial direction, resulting in increased gas velocity dispersions in all directions. Due to the broad similarity in core formation between the four SMUGGLE runs, this implies that the choice of star formation efficiency has little impact on the dark matter content while drastically affecting the gas content and morphology of dwarf galaxies.
5.2 Diversity of rotation curves
Figure 11 shows the rotational velocity of the gas as well as = for each run, averaged over the final 0.5 Gyr of each run. We find that the ISM of SH03 traces the potential of the galaxy remarkably well. In contrast, the high efficiency SMUGGLE runs eSF100 and vareff are so kinematically disrupted that there is little to no measurable rotation. El-Badry et al. (2018) found similarly dispersion-supported gas in dwarf galaxies within the FIRE simulations (Hopkins et al., 2018), and that rotational support increases with increasing mass. Further, they find that the majority of FIRE galaxies across 6.3 < < 11.1 have little rotational support, and while the higher mass galaxies have morphological gas discs, only a fraction of the dwarf galaxies ( M☉) host this feature.
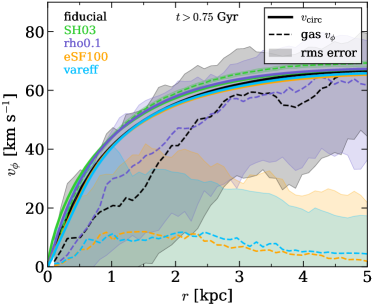
It is notable that even within the ‘well-behaved’ variations on SMUGGLE, we find that the rotational velocity of the gas does not accurately trace the implied by the gravitational potential. A naive reading of the gas distribution in Figure 11 could suggest a core radius of 2 kpc for the fiducial SMUGGLE model and rho0.1, while our method of core size measurement relying only on DM density profiles (see Section 3) results in values of a few hundred parsecs. Interestingly, this 2 kpc figure is consistent with the fiducial radius used to compare well-resolved rotation curves between simulations and observations (as in Santos-Santos et al., 2018; Oman et al., 2019). This result supports the notion that non-circular motion of gas in the inner regions of galaxies limits the ability of observational analyses to accurately recreate the DM profile, potentially contributing to the diversity of rotation curves in observed galaxies (Oman et al., 2015; Oman et al., 2019; Santos-Santos et al., 2020).
The variability in the distribution indicates another problem of time sampling bias. The measured gas rotational velocity is subject to frequent and substantial variation as a result of energy injection via feedback, as depicted by the shaded regions on Figure 11 representing the RMS error due to time-averaging. Measurements of the distribution taken at the extrema of the error range could either produce rapidly rising rotation curves implying a mass distribution consistent with CDM, or a slowly rising rotation curve implying an inner mass deficit and substantial core.
Figure 15 plots the individual profiles for each snapshot of the fiducial SMUGGLE run over the final 0.5 Gyr. Here we see that, while the majority of rotation curves are below the actual DM , there are a handful of profiles that demonstrate rotation speeds faster than the DM in the inner regions, i.e. profiles that would be interpreted as cuspy. Based on the number of snapshots with rotation curves that rise faster than an NFW, we place an upper limit on the presence of highly cuspy rotation curves at approximately 10 per cent. While this is an unlikely result, it indicates that cuspy profiles as a result of gas kinematics are indeed possible.
The discrepancy between the rotational velocity profile and the circular velocity profile indicates that the rotation of gas is rarely an accurate tracer of the DM potential in dwarf galaxies due to its sensitivity to energy injection via feedback. Our simulations predict that substantial diversity of rotation curves should be expected within the same dwarf galaxy across time. The variability of gas content and velocity in the inner regions of the galaxy on timescales Myr poses a challenge to the assumption of virial equilibrium (i.e. ‘steady-state’) that underlies the inference of DM distributions from gas velocity profiles. As suggested by Read et al. (2016), expanding bubbles of HI can be used to identify post-starburst galaxies which are likely out of equilibrium. Collisionless stars may be a better tracer of the inner gravitational potential than gas.
Overall, SMUGGLE produces rotational profiles that systematically underestimate the DM content of the inner regions, consistent with previous attempts to reconcile the observed diversity of rotation curves with baryonic physics (Oman et al., 2015; Oman et al., 2019; Read et al., 2016; Tollet et al., 2016; Santos-Santos et al., 2018, 2020). This indicates either that our understanding of small-scale ISM physics within galaxies is incomplete, or that another mechanism is responsible for creating rapidly rising rotation curves. It is possible that higher mass systems with stronger potentials are less susceptible to this effect, but we emphasize that this must be demonstrated explicitly rather than taken as an assumption.
The above considerations are only a result of ISM kinematics within an idealized, non-cosmological simulation and do not take into account additional bias introduced by observational measurement techniques, such as tilted-ring modeling and Jeans modeling, nor do they take into account evolutionary histories consistent with real galaxies or effects of cosmological environments such as mergers and infall of cold gas from filaments. Rather, these idealized tests isolate the effects of ISM modeling from other complex phenomena, allowing us to directly test the effects of baryonic feedback on the dark matter distribution of dwarf galaxies.
6 Summary & Conclusions
We study the behavior of the SMUGGLE (Marinacci et al., 2019) feedback and ISM model for the Arepo (Springel, 2010) moving mesh simulation code. In particular, we investigate the formation of dark matter ‘cores’ in idealized (non-cosmological) dwarf galaxies with 8 M☉ and 2 M☉ by comparing runs with identical initial conditions under both SMUGGLE and the SH03 model (Springel & Hernquist, 2003), a precursor to the model used in Illustris and Auriga (Vogelsberger et al., 2014a; Grand et al., 2017) simulations, among others. We develop a self-consistent method of measuring the core radius to track its evolution over time. We define the core radius to be the location where the actual DM density falls below the predicted DM density of an NFW profile fit to the outer regions of the halo ( kpc) by a factor or 2 (Figure 2). We then measure the slope of a power law fit to the resolved region within the measured core radius. Tracing these metrics over time, we find that SH03 does not produce a constant-density DM core, while the fiducial SMUGGLE model creates a flattened core of radius 350 pc within the first 0.75 Gyr. We show that the origin of these cores is linked to the successful self-regulation of the star formation history in SMUGGLE which establishes a bursty star formation mode. These bursty cycles then create significant variations in the enclosed gas mass within 1 kpc, resulting in non-adiabatic expansion of the inner DM distribution. Contrary to the self-regulation seen in SMUGGLE, SH03 produces a steadily declining SFH, with a constant mass of gas reached after most of the originally eligible gas for star formation has been transformed into stars. This equilibrium state then preserves the steep inner density profiles that have been reported previously in the literature (Figure 3).
In addition, we run three simulations of identical initial set up including alterations to key feedback parameters: (i) rho0.1 changes the star formation density threshold from the fiducial value of cm-3 to a reduced value of cm-3; (ii) eSF100 changes the local star formation efficiency (the mass fraction of eligible star forming gas that is converted into stars) from the fiducial value of to an increased value of ; and (iii) vareff, which implements a parameterization of the star formation efficiency based on the virial parameter (a measure of local self-gravitation; see Section 2.1.4). We find that the formation of a core is robust to these changes in SMUGGLE (though rho0.1 does form a per cent smaller core, and the high efficiency models exhibit stronger growth over time).
It is significant that rho0.1 forms a feedback-induced core while SH03 does not. Since both implementations use the same star formation density threshold cm-3, this is an indication that the density threshold alone is not a good predictor of core formation for detailed ISM models such as SMUGGLE. It is important to note that while SH03 does not generate a core through feedback, it does experience a halo expansion due to relaxation effects and the influence of the baryonic component (Burger & Zavala, 2021). Its expansion was smaller than in all SMUGGLE runs and was shown to be consistent with an adiabatic run, indicating that feedback was not a relevant factor. In contrast, rho0.1 demonstrates large fluctuations of baryonic matter in the inner regions of the halo, linking feedback to core formation.
We find that the ability to resolve dense gas ( cm-3; see Figure 7) is more predictive of core formation, in agreement with findings from (Benítez-Llambay et al., 2019). For example, rho0.1 resolves gas up to cm-3 while SH03 only resolves gas up to cm-3. This indicates that the SF density threshold is not a good proxy for actual gas density when using low local star formation efficiencies . This then allows the dense gas to linger around and affect locally the gravitational potential even if the density threshold for star formation is nominally low. Note that this is different from predictions in other ISM implementations, such as NIHAO (Dutton et al., 2019, 2020).
Our high efficiency runs eSF100 and vareff have more bursty star formation than fiducial or rho0.1, yet they do not form substantially larger cores (Figure 5). This indicates that core size and burstiness are not tightly correlated, but that sufficiently bursty star formation, like sufficiently high gas density, are necessary conditions for core formation, as predicted previously (Pontzen & Governato, 2012; Benítez-Llambay et al., 2019; Dutton et al., 2019). All SMUGGLE variations also demonstrate mild time-dependence over the course of our runs, indicating that core expansion should continue over cosmological timescales. We hypothesize that the source of this continued expansion is the continued bursty star formation in these runs. The core evolution in the fiducial SMUGGLE run is inconclusive in its time-dependence due to the short runtime of these simulations. Density profiles of the SMUGGLE variations can be found in Figure 14.
While there is broad agreement in core formation between the SMUGGLE variations, there are still differences between the models: rho0.1 forms the smallest core of the SMUGGLE models, with 300 pc by final time, while vareff and eSF100 reach final core radii of 500 pc. Despite this difference, we maintain that rho0.1 does indeed form a comparable core due to its highly flattened inner slope consistent with the fiducial SMUGGLE model. Interestingly, the fluctuations in gas mass within 1 kpc for all SMUGGLE runs are comparable (though with rho0.1 having less frequent outflows). This is likely the source of the similarity in core sizes and shapes between the runs.
This similarity between variations of SMUGGLE indicates that the physical consequences of changing parameters such as the SF density threshold are highly model dependent. As mentioned, is not an accurate tracer of physical gas densities achieved by simulations when using empirically calibrated models that limit the local SF efficiency to values . Local gas densities will be highly dependent on implementations of subgrid physics. In particular, molecular and fine-structure cooling allows gas to naturally reach temperatures far lower than K and achieve densities comparable to or higher than the average density of DM in the inner regions. The implemented modes of feedback-driven energy injection into the ISM allow this dense gas to be disrupted and flow to outer regions of the halo, repeatedly perturbing the DM potential as suggested by Pontzen & Governato (2012). That is to say, changes in model parameters must result in the required physical changes within the simulation to accurately capture the details of baryon-induced core formation. Simulations that do not produce sufficiently dense gas (due either to modeling choices or resolution) are simply unable to follow the physics expected to lead to core formation.
We also investigate the implications various modeling choices have on morphology. The fiducial SMUGGLE model and rho0.1 both form rotationally supported disks with structured ISMs, while SH03 naturally produces a stable galaxy with featureless ISM (see Figures 8 and 10). On the other hand, the high efficiency models produce dispersion-dominated spheroid galaxies with lower gas fractions. This is a natural result of the increased burstiness and feedback of these models, and is in agreement with the FIRE simulations (Hopkins et al., 2018), which implement and also observe dwarf galaxies with spheroid morphology and dispersion supported ISM (El-Badry et al., 2018). Interestingly, we find that the most compact galaxies (eSF100 and vareff) form the largest cores, while the most diffuse galaxies (rho0.1) form the smallest cores (Figure 9), in agreement with Burger & Zavala (2021).
Our examination of the rotational velocity () profiles of the gas content (Figure 11) indicates that the ISM does not trace the potential of the DM in the inner regions ( kpc). This is true for all SMUGGLE variations, though the fiducial model and rho0.1 are better able to trace the DM in the outskirts, while eSF100 and vareff demonstrate almost no rotational velocity component of the gas at any radius. Further, we find significant variations in the profiles across time, suggesting that a diverse morphology of rotation curves can be observed at different times within the same galaxy. We find that individual profiles can vary between exceeding the expected DM circular velocity and drastically underestimating it (Figure 15). However, we find that the ISM in SMUGGLE systematically falls below the of the halo within the inner regions, consistent with previous work (Santos-Santos et al., 2020; Oman et al., 2019), further indicating that the baryon-induced core formation scheme struggles to reproduce the steep end of the diversity of rotation curves problem.
Our analysis indicates that feedback-induced core formation is fundamentally a small-scale problem. Its effects may be observed on the scale of a few kpc, but the physics which generates these observables occur on the scales of star formation and feedback, i.e. pc, as well as sub-pc processes that are yet unresolved and only implemented through sub-grid modeling. Lack of cores in models which are not able (and do not attempt) to produce this microphysics is not evidence against the validity of baryon-induced core formation, but evidence against the suitability of such models to study this process.
Finally, our results suggest that even if perfect observations of gas rotation curves are obtained, these do not necessarily trace the DM potential in non-equilibrium systems such as dispersion-dominated dwarf galaxies. Caution is needed when attempting to infer DM distributions from gas rotation. It is important to investigate the assumption of equilibrium for dwarf galaxies, whose small sizes make them susceptible to large fluctuations in gas content and velocity.
Acknowledgements
EDJ and LVS acknowledge support from the NASA ATP 80NSSC20K0566, NSF AST 1817233 and NSF CAREER 1945310 grants. FM acknowledges support through the program "Rita Levi Montalcini" of the Italian MIUR. MV acknowledges support through NASA ATP grants 16-ATP16-0167, 19-ATP19-0019, 19-ATP19-0020, 19-ATP19-0167, and NSF grants AST-1814053, AST-1814259, AST-1909831, AST-2007355 and AST-2107724. PT and JQ acknowledge support from NSF grants AST-200849. PT acknowledges support from NASA ATP grant 80NSSC20K0502. AS and HL acknowledge support for Program numbers HST-HF2-51421.001-A and HST-HF2-51438.001-A provided by NASA through a grant from the Space Telescope Science Institute, which is operated by the Association of Universities for Research in Astronomy, Incorporated, under NASA contract NAS5-26555. JB acknowledges support by a Grant of Excellence from the Icelandic Center for Research (Rannís; grant number 173929) JZ acknowledges support by a Grant of Excellence from the Icelandic Research fund (grant number 206930).
Data Availability
The data that support the findings of this study are available from the corresponding author, upon reasonable request.
References
- Adams et al. (2014) Adams J. J., et al., 2014, ApJ, 789, 63
- Benítez-Llambay et al. (2019) Benítez-Llambay A., Frenk C. S., Ludlow A. D., Navarro J. F., 2019, MNRAS, 488, 2387
- Bode et al. (2001) Bode P., Ostriker J. P., Turok N., 2001, ApJ, 556, 93
- Bose et al. (2019) Bose S., et al., 2019, MNRAS, 486, 4790
- Bozek et al. (2019) Bozek B., et al., 2019, MNRAS, 483, 4086
- Brooks & Zolotov (2014) Brooks A. M., Zolotov A., 2014, ApJ, 786, 87
- Burger & Zavala (2019) Burger J. D., Zavala J., 2019, MNRAS, 485, 1008
- Burger & Zavala (2021) Burger J. D., Zavala J., 2021, arXiv e-prints, p. arXiv:2103.01231
- Burkert (1995) Burkert A., 1995, ApJ, 447, L25
- Burkert (2020) Burkert A., 2020, ApJ, 904, 161
- Chabrier (2001) Chabrier G., 2001, ApJ, 554, 1274
- Chan et al. (2015) Chan T. K., Kereš D., Oñorbe J., Hopkins P. F., Muratov A. L., Faucher-Giguère C. A., Quataert E., 2015, MNRAS, 454, 2981
- Chua et al. (2019) Chua K. T. E., Pillepich A., Vogelsberger M., Hernquist L., 2019, MNRAS, 484, 476
- Cioffi et al. (1988) Cioffi D. F., McKee C. F., Bertschinger E., 1988, ApJ, 334, 252
- Crain et al. (2015) Crain R. A., et al., 2015, MNRAS, 450, 1937
- Creasey et al. (2017) Creasey P., Sameie O., Sales L. V., Yu H.-B., Vogelsberger M., Zavala J., 2017, MNRAS, 468, 2283
- Davé et al. (2011) Davé R., Oppenheimer B. D., Finlator K., 2011, MNRAS, 415, 11
- Davé et al. (2019) Davé R., Anglés-Alcázar D., Narayanan D., Li Q., Rafieferantsoa M. H., Appleby S., 2019, MNRAS, 486, 2827
- Di Cintio et al. (2014) Di Cintio A., Brook C. B., Macciò A. V., Stinson G. S., Knebe A., Dutton A. A., Wadsley J., 2014, MNRAS, 437, 415
- Dodelson & Widrow (1994) Dodelson S., Widrow L. M., 1994, Phys. Rev. Lett., 72, 17
- Dubois et al. (2014) Dubois Y., et al., 2014, MNRAS, 444, 1453
- Dutton et al. (2016) Dutton A. A., et al., 2016, MNRAS, 461, 2658
- Dutton et al. (2019) Dutton A. A., Macciò A. V., Buck T., Dixon K. L., Blank M., Obreja A., 2019, MNRAS, 486, 655
- Dutton et al. (2020) Dutton A. A., Buck T., Macciò A. V., Dixon K. L., Blank M., Obreja A., 2020, MNRAS, 499, 2648
- El-Badry et al. (2018) El-Badry K., et al., 2018, MNRAS, 473, 1930
- Elbert et al. (2018) Elbert O. D., Bullock J. S., Kaplinghat M., Garrison-Kimmel S., Graus A. S., Rocha M., 2018, ApJ, 853, 109
- Faucher-Giguère et al. (2009) Faucher-Giguère C.-A., Lidz A., Zaldarriaga M., Hernquist L., 2009, ApJ, 703, 1416
- Ferrière (2001) Ferrière K. M., 2001, Reviews of Modern Physics, 73, 1031
- Fitts et al. (2017) Fitts A., et al., 2017, MNRAS, 471, 3547
- Fitts et al. (2019) Fitts A., et al., 2019, MNRAS, 490, 962
- Flores & Primack (1994) Flores R. A., Primack J. R., 1994, ApJ, 427, L1
- Genel et al. (2014) Genel S., et al., 2014, MNRAS, 445, 175
- Genina et al. (2018) Genina A., et al., 2018, MNRAS, 474, 1398
- Gilmore et al. (2007) Gilmore G., Wilkinson M. I., Wyse R. F. G., Kleyna J. T., Koch A., Evans N. W., Grebel E. K., 2007, ApJ, 663, 948
- Governato et al. (2010) Governato F., et al., 2010, Nature, 463, 203
- Grand et al. (2017) Grand R. J. J., et al., 2017, MNRAS, 467, 179
- Greggio (2005) Greggio L., 2005, A&A, 441, 1055
- Hernquist (1990) Hernquist L., 1990, ApJ, 356, 359
- Hopkins et al. (2011) Hopkins P. F., Quataert E., Murray N., 2011, MNRAS, 417, 950
- Hopkins et al. (2014) Hopkins P. F., Kereš D., Oñorbe J., Faucher-Giguère C.-A., Quataert E., Murray N., Bullock J. S., 2014, MNRAS, 445, 581
- Hopkins et al. (2018) Hopkins P. F., et al., 2018, MNRAS, 480, 800
- Hu et al. (2000) Hu W., Barkana R., Gruzinov A., 2000, Phys. Rev. Lett., 85, 1158
- Ikeuchi & Ostriker (1986) Ikeuchi S., Ostriker J. P., 1986, ApJ, 301, 522
- Iorio et al. (2017) Iorio G., Fraternali F., Nipoti C., Di Teodoro E., Read J. I., Battaglia G., 2017, MNRAS, 466, 4159
- Kannan et al. (2020) Kannan R., Marinacci F., Vogelsberger M., Sales L. V., Torrey P., Springel V., Hernquist L., 2020, MNRAS, 499, 5732
- Kaplinghat et al. (2020) Kaplinghat M., Ren T., Yu H.-B., 2020, J. Cosmology Astropart. Phys., 2020, 027
- Klypin et al. (2001) Klypin A., Kravtsov A. V., Bullock J. S., Primack J. R., 2001, ApJ, 554, 903
- Kormendy et al. (2009) Kormendy J., Fisher D. B., Cornell M. E., Bender R., 2009, ApJS, 182, 216
- Kuzio de Naray et al. (2006) Kuzio de Naray R., McGaugh S. S., de Blok W. J. G., Bosma A., 2006, ApJS, 165, 461
- Kuzio de Naray et al. (2008) Kuzio de Naray R., McGaugh S. S., de Blok W. J. G., 2008, ApJ, 676, 920
- Lancaster et al. (2020) Lancaster L., Giovanetti C., Mocz P., Kahn Y., Lisanti M., Spergel D. N., 2020, J. Cosmology Astropart. Phys., 2020, 001
- Lelli et al. (2016) Lelli F., McGaugh S. S., Schombert J. M., 2016, AJ, 152, 157
- Li et al. (2020) Li H., Vogelsberger M., Marinacci F., Sales L. V., Torrey P., 2020, MNRAS, 499, 5862
- Ludlow et al. (2019a) Ludlow A. D., Schaye J., Schaller M., Richings J., 2019a, MNRAS, 488, L123
- Ludlow et al. (2019b) Ludlow A. D., Schaye J., Bower R., 2019b, MNRAS, 488, 3663
- Ludlow et al. (2020) Ludlow A. D., Schaye J., Schaller M., Bower R., 2020, MNRAS, 493, 2926
- Macciò et al. (2012) Macciò A. V., Stinson G., Brook C. B., Wadsley J., Couchman H. M. P., Shen S., Gibson B. K., Quinn T., 2012, ApJ, 744, L9
- Madau et al. (2014) Madau P., Shen S., Governato F., 2014, ApJ, 789, L17
- Marasco et al. (2018) Marasco A., Oman K. A., Navarro J. F., Frenk C. S., Oosterloo T., 2018, MNRAS, 476, 2168
- Marinacci et al. (2014) Marinacci F., Pakmor R., Springel V., 2014, MNRAS, 437, 1750
- Marinacci et al. (2019) Marinacci F., Sales L. V., Vogelsberger M., Torrey P., Springel V., 2019, MNRAS, 489, 4233
- Mocz et al. (2017) Mocz P., Vogelsberger M., Robles V. H., Zavala J., Boylan-Kolchin M., Fialkov A., Hernquist L., 2017, MNRAS, 471, 4559
- Moore (1994) Moore B., 1994, Nature, 370, 629
- Murray et al. (2005) Murray N., Quataert E., Thompson T. A., 2005, ApJ, 618, 569
- Navarro et al. (1996a) Navarro J. F., Eke V. R., Frenk C. S., 1996a, MNRAS, 283, L72
- Navarro et al. (1996b) Navarro J. F., Frenk C. S., White S. D. M., 1996b, ApJ, 462, 563
- Oh et al. (2011) Oh S.-H., de Blok W. J. G., Brinks E., Walter F., Kennicutt Robert C. J., 2011, AJ, 141, 193
- Oh et al. (2015) Oh S.-H., et al., 2015, AJ, 149, 180
- Oman et al. (2015) Oman K. A., et al., 2015, MNRAS, 452, 3650
- Oman et al. (2019) Oman K. A., Marasco A., Navarro J. F., Frenk C. S., Schaye J., Benítez-Llambay A., 2019, MNRAS, 482, 821
- Padoan et al. (2012) Padoan P., Haugbølle T., Nordlund Å., 2012, ApJ, 759, L27
- Pillepich et al. (2018) Pillepich A., et al., 2018, MNRAS, 473, 4077
- Pontzen & Governato (2012) Pontzen A., Governato F., 2012, MNRAS, 421, 3464
- Rahmati et al. (2013) Rahmati A., Pawlik A. H., Raičević M., Schaye J., 2013, MNRAS, 430, 2427
- Read & Gilmore (2005) Read J. I., Gilmore G., 2005, MNRAS, 356, 107
- Read et al. (2016) Read J. I., Iorio G., Agertz O., Fraternali F., 2016, MNRAS, 462, 3628
- Ren et al. (2019) Ren T., Kwa A., Kaplinghat M., Yu H.-B., 2019, Physical Review X, 9, 031020
- Robles et al. (2017) Robles V. H., et al., 2017, MNRAS, 472, 2945
- Rocha et al. (2013) Rocha M., Peter A. H. G., Bullock J. S., Kaplinghat M., Garrison-Kimmel S., Oñorbe J., Moustakas L. A., 2013, MNRAS, 430, 81
- Rogstad et al. (1974) Rogstad D. H., Lockhart I. A., Wright M. C. H., 1974, ApJ, 193, 309
- Sales et al. (2014) Sales L. V., Marinacci F., Springel V., Petkova M., 2014, MNRAS, 439, 2990
- Santos-Santos et al. (2018) Santos-Santos I. M., Di Cintio A., Brook C. B., Macciò A., Dutton A., Domínguez-Tenreiro R., 2018, MNRAS, 473, 4392
- Santos-Santos et al. (2020) Santos-Santos I. M. E., et al., 2020, MNRAS, 495, 58
- Sawala et al. (2016) Sawala T., et al., 2016, MNRAS, 457, 1931
- Schaller et al. (2015) Schaller M., et al., 2015, MNRAS, 451, 1247
- Schaye et al. (2015) Schaye J., et al., 2015, MNRAS, 446, 521
- Semenov et al. (2016) Semenov V. A., Kravtsov A. V., Gnedin N. Y., 2016, ApJ, 826, 200
- Smith et al. (2015) Smith A., Safranek-Shrader C., Bromm V., Milosavljević M., 2015, MNRAS, 449, 4336
- Smith et al. (2017) Smith A., Bromm V., Loeb A., 2017, MNRAS, 464, 2963
- Smith et al. (2018) Smith M. C., Sijacki D., Shen S., 2018, MNRAS, 478, 302
- Spergel & Steinhardt (2000) Spergel D. N., Steinhardt P. J., 2000, Phys. Rev. Lett., 84, 3760
- Springel (2010) Springel V., 2010, MNRAS, 401, 791
- Springel & Hernquist (2003) Springel V., Hernquist L., 2003, MNRAS, 339, 289
- Springel et al. (2005) Springel V., Di Matteo T., Hernquist L., 2005, MNRAS, 361, 776
- Springel et al. (2008) Springel V., et al., 2008, MNRAS, 391, 1685
- Stinson et al. (2006) Stinson G., Seth A., Katz N., Wadsley J., Governato F., Quinn T., 2006, MNRAS, 373, 1074
- Teyssier et al. (2013) Teyssier R., Pontzen A., Dubois Y., Read J. I., 2013, MNRAS, 429, 3068
- Thielemann et al. (2003) Thielemann F. K., et al., 2003, in Hillebrandt W., Leibundgut B., eds, From Twilight to Highlight: The Physics of Supernovae. p. 331, doi:10.1007/10828549_46
- Tollet et al. (2016) Tollet E., et al., 2016, MNRAS, 456, 3542
- Tulin & Yu (2018) Tulin S., Yu H.-B., 2018, Phys. Rep., 730, 1
- Vogelsberger et al. (2012) Vogelsberger M., Zavala J., Loeb A., 2012, MNRAS, 423, 3740
- Vogelsberger et al. (2013) Vogelsberger M., Genel S., Sijacki D., Torrey P., Springel V., Hernquist L., 2013, MNRAS, 436, 3031
- Vogelsberger et al. (2014a) Vogelsberger M., et al., 2014a, MNRAS, 444, 1518
- Vogelsberger et al. (2014b) Vogelsberger M., Zavala J., Simpson C., Jenkins A., 2014b, MNRAS, 444, 3684
- Vogelsberger et al. (2014c) Vogelsberger M., et al., 2014c, Nature, 509, 177
- Vogelsberger et al. (2019) Vogelsberger M., Zavala J., Schutz K., Slatyer T. R., 2019, MNRAS, 484, 5437
- Vogelsberger et al. (2020) Vogelsberger M., Marinacci F., Torrey P., Puchwein E., 2020, Nature Reviews Physics, 2, 42
- Wadsley et al. (2004) Wadsley J. W., Stadel J., Quinn T., 2004, New Astron., 9, 137
- Walker & Peñarrubia (2011) Walker M. G., Peñarrubia J., 2011, ApJ, 742, 20
- Wang et al. (2015) Wang L., Dutton A. A., Stinson G. S., Macciò A. V., Penzo C., Kang X., Keller B. W., Wadsley J., 2015, MNRAS, 454, 83
- Weinberger et al. (2020) Weinberger R., Springel V., Pakmor R., 2020, ApJS, 248, 32
- Wetzel et al. (2016) Wetzel A. R., Hopkins P. F., Kim J.-h., Faucher-Giguère C.-A., Kereš D., Quataert E., 2016, ApJ, 827, L23
- White & Rees (1978) White S. D. M., Rees M. J., 1978, MNRAS, 183, 341
- Yoshida et al. (2000) Yoshida N., Springel V., White S. D. M., Tormen G., 2000, ApJ, 544, L87
- Zavala et al. (2019) Zavala J., Lovell M. R., Vogelsberger M., Burger J. D., 2019, Phys. Rev. D, 100, 063007
- Zolotov et al. (2012) Zolotov A., et al., 2012, ApJ, 761, 71
- de Blok et al. (2001) de Blok W. J. G., McGaugh S. S., Bosma A., Rubin V. C., 2001, ApJ, 552, L23
- de Blok et al. (2008) de Blok W. J. G., Walter F., Brinks E., Trachternach C., Oh S. H., Kennicutt R. C. J., 2008, AJ, 136, 2648
- van den Bosch & Ogiya (2018) van den Bosch F. C., Ogiya G., 2018, MNRAS, 475, 4066
Appendix A Additional Material
To demonstrate the resolution convergence of the SMUGGLE model, Figure 12 shows our standard high resolution run with M☉ compared to a run at times lower resolution ( M☉). We find good agreement in all measured quantities. The lower resolution run demonstrates marginally less bursty star formation rates. We also find stronger time dependence in the measured core radius and power law slope in the lower resolution run, but good agreement in values for these quantities across the run time. A notable similarity between the runs is their rapid fluctuations in gas mass within kpc.
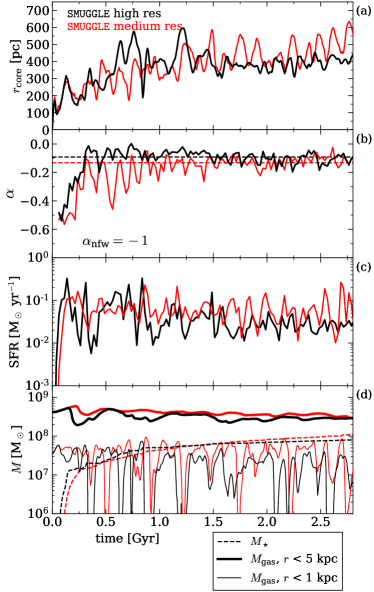
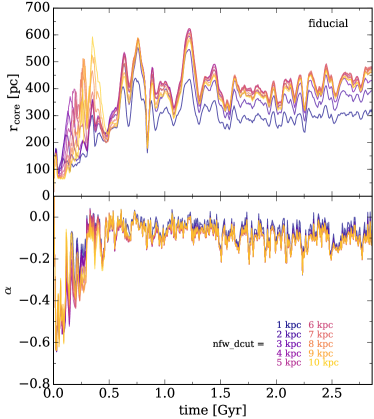
Figure 13 shows the measured values of core radius and inner power law slope for the fiducial SMUGGLE model with different values of radial cutoff for the fitted NFW profile (see Section 3.1). We find that the measured values of and inner slope are robust to choice of NFW radial fitting cutoff in the range kpc.
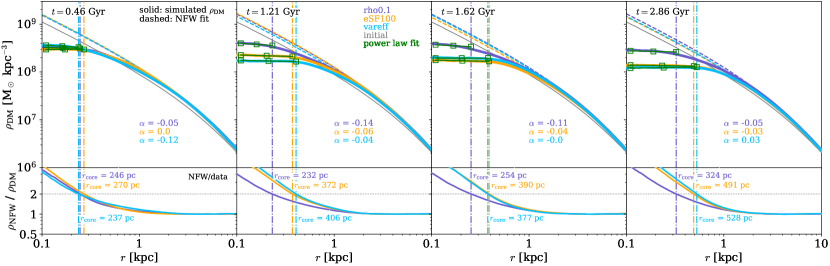
Figure 14 depicts density profiles for the three SMUGGLE variations we explore in Section 4.1, similar to Figure 2. Each panel shows a different timestamp of the simulation, including the final snapshot in the rightmost panel. The bottom panels, as in Figure 2, show the ratio of densities of the fitted NFW profile to the physical DM density achieved in the simulation. The NFW profile is fitted to kpc, and the core radius is chosen as the radial distance where . The core radius is depicted as a vertical dash-dot line, and its value at each timestamp is listed on the bottom panels. We find that eSF100 and vareff, models with increased local star formation efficiency, demonstrate large, flattened core. Our run with density threshold of cm-3 (rho0.1), forms a core that is somewhat smaller than those of the high efficiency runs, though it is still consistent with the fiducial SMUGGLE model, and clearly distinct from the lack of core found in SH03, as discussed in Section 4.1.
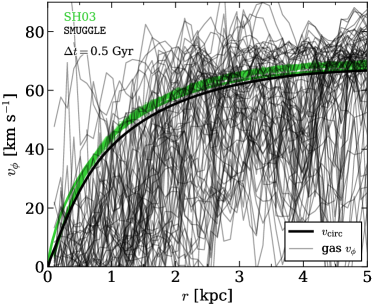
We plot the rotational velocity profiles of gas for both the fiducial SMUGGLE model and SH03 (Springel & Hernquist, 2003) for each snapshot of the final Gyr of run time in Figure 15. The median gas profile for all models is shown in Figure 11. We plot these individual profiles to explicitly show the variety of shapes that can be produced through feedback effects on the gas in SMUGGLE, and the uniformity of profiles achieved in SH03. We find that a handful of profiles (no more than 10 per cent) demonstrate steeply rising inner velocity profiles, suggesting that baryonic feedback can account for some of the observed diversity of rotation curves. Overall, we find rotational velocity profiles that tend to underestimate the circular velocity (thicker lines). These rotational profiles can also demonstrate strong fluctuations with radius, as well as time, indicating a gaseous component that is in a constant state of flux.