Highly luminous supernovae associated with gamma-ray bursts
II. The Luminous Blue Bump in the Afterglow of GRB 140506A
Abstract
Context. The supernovae (SNe) associated with gamma-ray bursts (GRBs) are generally seen as a homogenous population, but at least one exception exists, both in terms of luminosity as well as Spectral Energy Distribution (SED). However, this event, SN 2011kl, was associated with an ultra-long GRB 111209A. Do such outliers also exist for more typical GRBs?
Aims. Within the context of a systematic analysis of photometric signatures of GRB-associated SNe, we found an anomalous bump in the late-time transient following GRB 140506A. We hereby aim to show this bump is significantly more luminous and blue than usual SNe following GRBs.
Methods. We compile all available data from the literature, and add a full analysis of the Swift UVOT data, which allows us to trace the light curve from the first minutes all the way to the host galaxy, as well as construct a broad SED of the afterglow that extends the previous SED analysis based on ground-based spectroscopy.
Results. We find robust evidence for a late-time bump/plateau following the afterglow which shows evidence for a strong colour change, with the spectral slope becoming flatter in the blue region of the spectrum. This bump can be interpreted as a luminous SN bump which is spectrally dissimilar to typical GRB-SNe. Correcting it for the large line-of-sight extinction results in extreme values which make the SN associated with GRB 140506A the most luminous detected so far. Even so, it would be in agreement with a luminosity-duration relation of GRB-SNe.
Conclusions. While not supported by spectroscopic evidence, it is likely the blue bump following GRB 140506A is the signature of a SN which is spectrally dissimilar to classical GRB-SNe and more similar to SN 2011kl – while being associated with an average GRB, indicating the GRB-SN population is more diverse than thought so far, and can reach luminosities comparable to those of superluminous SNe.
Key Words.:
Gamma-Ray Bursts: Individual: GRB 140506A1 Introduction
The link between “long GRBs” (usually exhibiting a duration of s, but see Ahumada et al. 2021; Zhang et al. 2021; Rossi et al. 2021), also labelled “Type II GRBs” in a more physically motivated, duration-independent classification scheme (Zhang et al. 2009; Kann et al. 2011), and the explosive deaths of massive stars has now been firmly established (see Woosley & Bloom 2006; Cano et al. 2017 for reviews). Beginning with the prototypical, well-studied SN 1998bw associated with the low-luminosity, nearby GRB 980425 (Galama et al. 1998; Clocchiatti et al. 2011), all GRB-SNe that have been studied well have been found to be explosions of highly-stripped stars (so-called broad-lined Type Ic SNe), missing signatures of hydrogen and helium in their spectra. Perhaps surprisingly, these SNe have been shown to be very similar to each other, in terms of luminosity, ejecta and nickel masses, and energy release (Melandri et al. 2014), whether they have been associated with a spectrally soft, low-luminosity X-ray flash such as XRF 060218 (e.g. Pian et al. 2006; Mazzali et al. 2006), a moderately soft and energetic GRB such as GRB 030329 (e.g. Hjorth et al. 2003; Matheson et al. 2003; Stanek et al. 2003), or a highly luminous and spectrally hard “true cosmological” GRB like GRB 130427A (Xu et al. 2013; Melandri et al. 2014).
However, a decade ago, a startling outlier was discovered. GRB 111209A was a GRB of extreme duration in gamma-rays (Golenetskii et al. 2011; Gendre et al. 2013; Stratta et al. 2013), leading, together with the “Christmas Burst” GRB 101225A (Thöne et al. 2011), to the establishment of the ultra-long duration GRB class (Levan et al. 2014). GRB 111209A was found to be associated with a well-detected SN, SN 2011kl, which exhibited properties very different from usual GRB-SNe, being both more luminous, bluer, and spectrally dissimilar to typical Type Ic GRB-SNe, and closer in resemblance, spectroscopically, to superluminous SNe (SLSNe Greiner et al. 2015; Mazzali et al. 2016). Excepting its extreme duration, both GRB 111209A and its afterglow are not unprecedented (Kann et al. 2018), but a detailed study shows SN 2011kl differing from GRB-SNe in many aspects (Kann et al. 2019).
This discovery immediately opened multiple new lines of inquiry:
-
•
Are all ultra-long GRBs associated with anomalous GRB-SNe, and if so, are they similar to SN 2011kl or outliers in other aspects?
-
•
Are such peculiar, highly luminous GRB-SNe exclusively associated with ultra-long GRBs or can they also occur following “standard” GRBs?
So far, the lack of further detailed studies of ultra-long GRBs (which are very rare) has prevented us from exploring the first question further. However, we here establish a second, tentative, data point in pursuit of the second question, coming to an answer of “Likely, no.” In the context of a systematic study of late-time emission in GRB afterglows at (Kann et al. 2022A, in prep.), we have found that the per se unremarkable (at high energies) GRB 140506A, which has been studied in detail stemming from its peculiar line-of-sight in terms of extinction and spectral features (Fynbo et al. 2014; Heintz et al. 2017), exhibits a bump at late times which shows a strong colour change from very red to much bluer. This bump is significantly brighter than the final host-galaxy magnitudes, making the interpretation as a late-time SN component compelling. We furthermore analyse the afterglow SED, determine the dust extinction along the line-of-sight, and thereby place the potential SN in a larger context of extinction-corrected GRB-SNe.
The paper is organized as follows: In Sect. 2 we will present GRB 140506A as well as our observations of the afterglow. We discuss our analysis and our results in Sect. 3, and place the event in context in Sect. 4 before concluding in Sect. 5.
In our calculations we assume a flat Universe with a matter density , a cosmological constant , and a Hubble constant km s-1 Mpc-1 (Spergel et al. 2003), to remain in agreement with our older sample papers. Errors are given at the , and upper limits at the level for a parameter of interest. For temporal and spectral power-laws, we assume , therefore temporally decaying light curves and spectra rising in brightness toward the red (the typical situation for GRB afterglows) have positive and values.
2 Observations of GRB 140506A
2.1 GRB 140506A
GRB 140506A triggered the Neil Gehrels Swift Observatory (Swift hereafter, Gehrels et al. 2004) at 21:07:36 UT on 6 May 2014 (Gompertz et al. 2014). The satellite slewed immediately, localising the event precisely with X-ray and UV/optical detections. It was a moderately bright GRB consisting of an initial spike followed by several fainter emission episodes, and it also triggered Fermi/GBM (Jenke 2014) and Konus-Wind (Golenetskii et al. 2014). The 111The timespan over which 90% of the integrated counts are emitted, beginning 5% after the start of detection and ending at 95%. This is a general duration measure used for GRBs. derived by Swift was s (Markwardt et al. 2014) so clearly not of ultra-long duration222 from Konus-Wind and Fermi/GBM are about half this value.. Tsvetkova et al. (2017) report a detailed analysis of the Konus-Wind detection of GRB 140506A, deriving a fluence in the keV energy band of erg cm-2, and a spectrum that is best fit by a cut-off power-law with and keV. Using these parameters and the redshift (Fynbo et al. 2014), we deduce (following Agüí Fernández et al. 2021) an isotropic energy release in the rest-frame 1 keV to 100 MeV band of , implying GRB 140506A is an average GRB, neither particularly sub- nor superluminous.
Nonetheless, the GRB features one interesting aspect, namely a peculiar, red and strongly curved afterglow spectrum, leading to a detailed spectroscopic and photometric analysis by Fynbo et al. (2014), which was followed by a host-galaxy study (Heintz et al. 2017). In the late-time data presented in Fynbo et al. (2014), the afterglow decay flattened considerably, seemingly implying the host-galaxy level had been reached, however, Heintz et al. (2017) show this to be incorrect, finding further significant decay between months and a year post-burst. They even remark that the earlier plateau phase is similar to what one would expect from a GRB-SN but do not pursue the topic further.
2.2 Observations
Fynbo et al. (2014) present ground-based photometric observations starting 0.33 d after the GRB, with detections spanning from the GROND band to the GROND band. The last detection epoch is 68 d post-burst. Heintz et al. (2017) add host-galaxy data spanning from to the Spitzer IRAC1 band (at m) taken about a year after the GRB, when any transient is expected to have faded.
To expand this afterglow data set both temporally and spectrally, we analysed the Swift UltraViolet/Optical Telescope (UVOT, Roming et al. 2005) data. UVOT began settled observations of the field of GRB 140506A 108 s after the Swift/BAT trigger, with initial results reported in Siegel & Gompertz (2014). The data (in AB mags) are given in Table LABEL:obslog. The last low-significance detection is at 1.8 d, with upper limits until 30 d. We note that Fynbo et al. (2014) also analysed the UVOT data and claim detections only for , with a low-S/N detection in . While definitely low-S/N (), we also report multiple early detections in and .
Before extracting count rates from the event lists, the astrometry was refined following the methodology of Oates et al. (2009). The source counts were extracted initially using a source region of 5″ radius. When the count rate dropped to below 0.5 counts/s, we used a source region of 3″ radius. In order to be consistent with the UVOT calibration, these count rates were then corrected to 5″ using the curve of growth contained in the calibration files. Background counts were extracted using three circular regions of radius 10″ located in source-free regions. The count rates were obtained from the event and image lists using the Swift tools uvotevtlc and uvotsource, respectively. They were converted to magnitudes using the UVOT photometric zero points (Poole et al. 2008; Breeveld et al. 2011). To improve the signal-to-noise ratio, the count rates in each filter were binned using , leading to longer but deeper exposures at later times. The early event-mode and finding charts were bright enough to be split into multiple exposures.
3 Results
3.1 The Afterglow
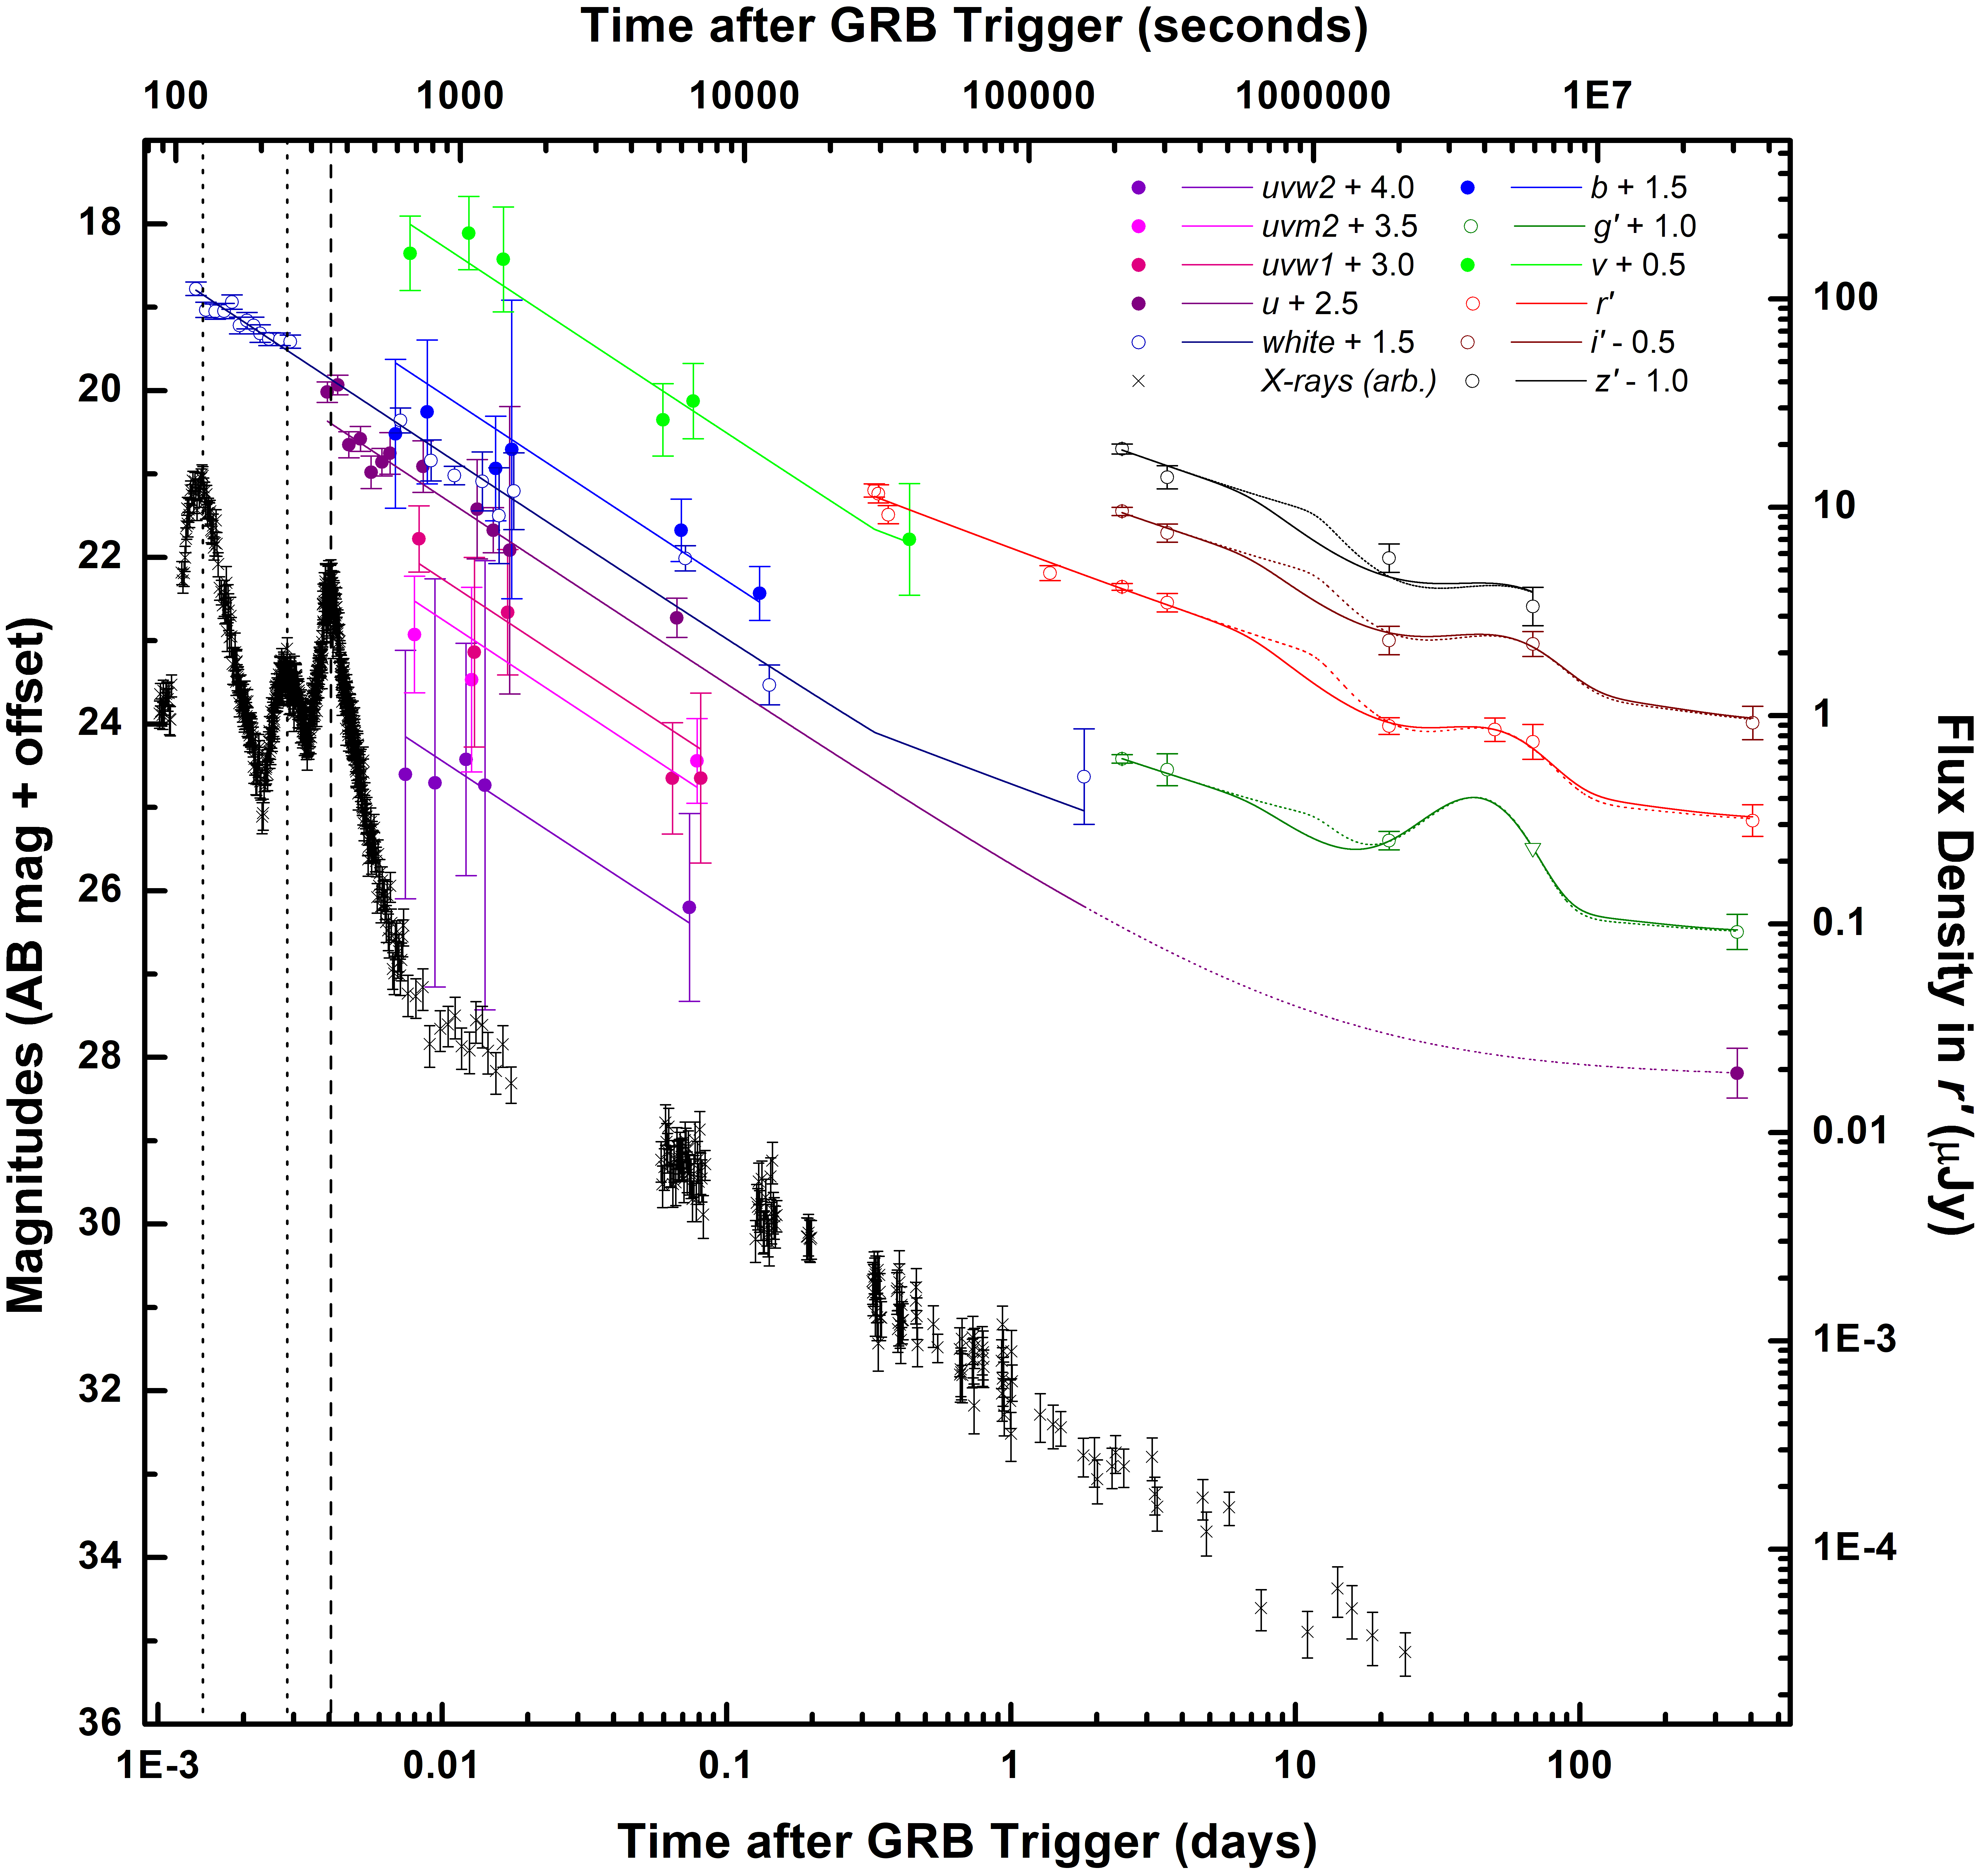
The afterglow observations of GRB 140506A are shown in Fig. 1. We do not add UVOT upper limits for sake of legibility, and data (Fynbo et al. 2014) as they do not contribute notably to the afterglow fit. They are used in the SED, however (see Sect. 3.2). The early UVOT data, despite showing, for the most part, low S/N detections with large errors, agree well with a single power-law fit over all bands and the complete time span. The one exception are the first two data points derived from the event-mode finding chart observation at s, these lie above the rest of the data. The Swift X-ray telescope (XRT, Burrows et al. 2005) data at this time, as given333https://www.swift.ac.uk/xrt_curves/00598284/ on the XRT repository (Evans et al. 2007, 2009), indeed show a strong flare taking place right at this time, linking the elevated emission to an additional component, likely stemming from internal shocks. However, an even more powerful earlier X-ray flare, peaking at s, is not visible in the time-resolved finding chart (Fig. 1). We find that the entire UVOT data are well-fit () by a simultaneous multi-band single power-law fit with decay . This assumes that the evolution of the afterglow is achromatic. While we just reported a prompt-emission flare that may have a different underlying spectrum, it only affects two data points, and the X-ray light curve shows no further evidence for flaring. The fit equation determines the afterglow magnitude in each band (all data have been corrected for Galactic extinction following Schlafly & Finkbeiner 2011) which yields the UVOT-data SED.
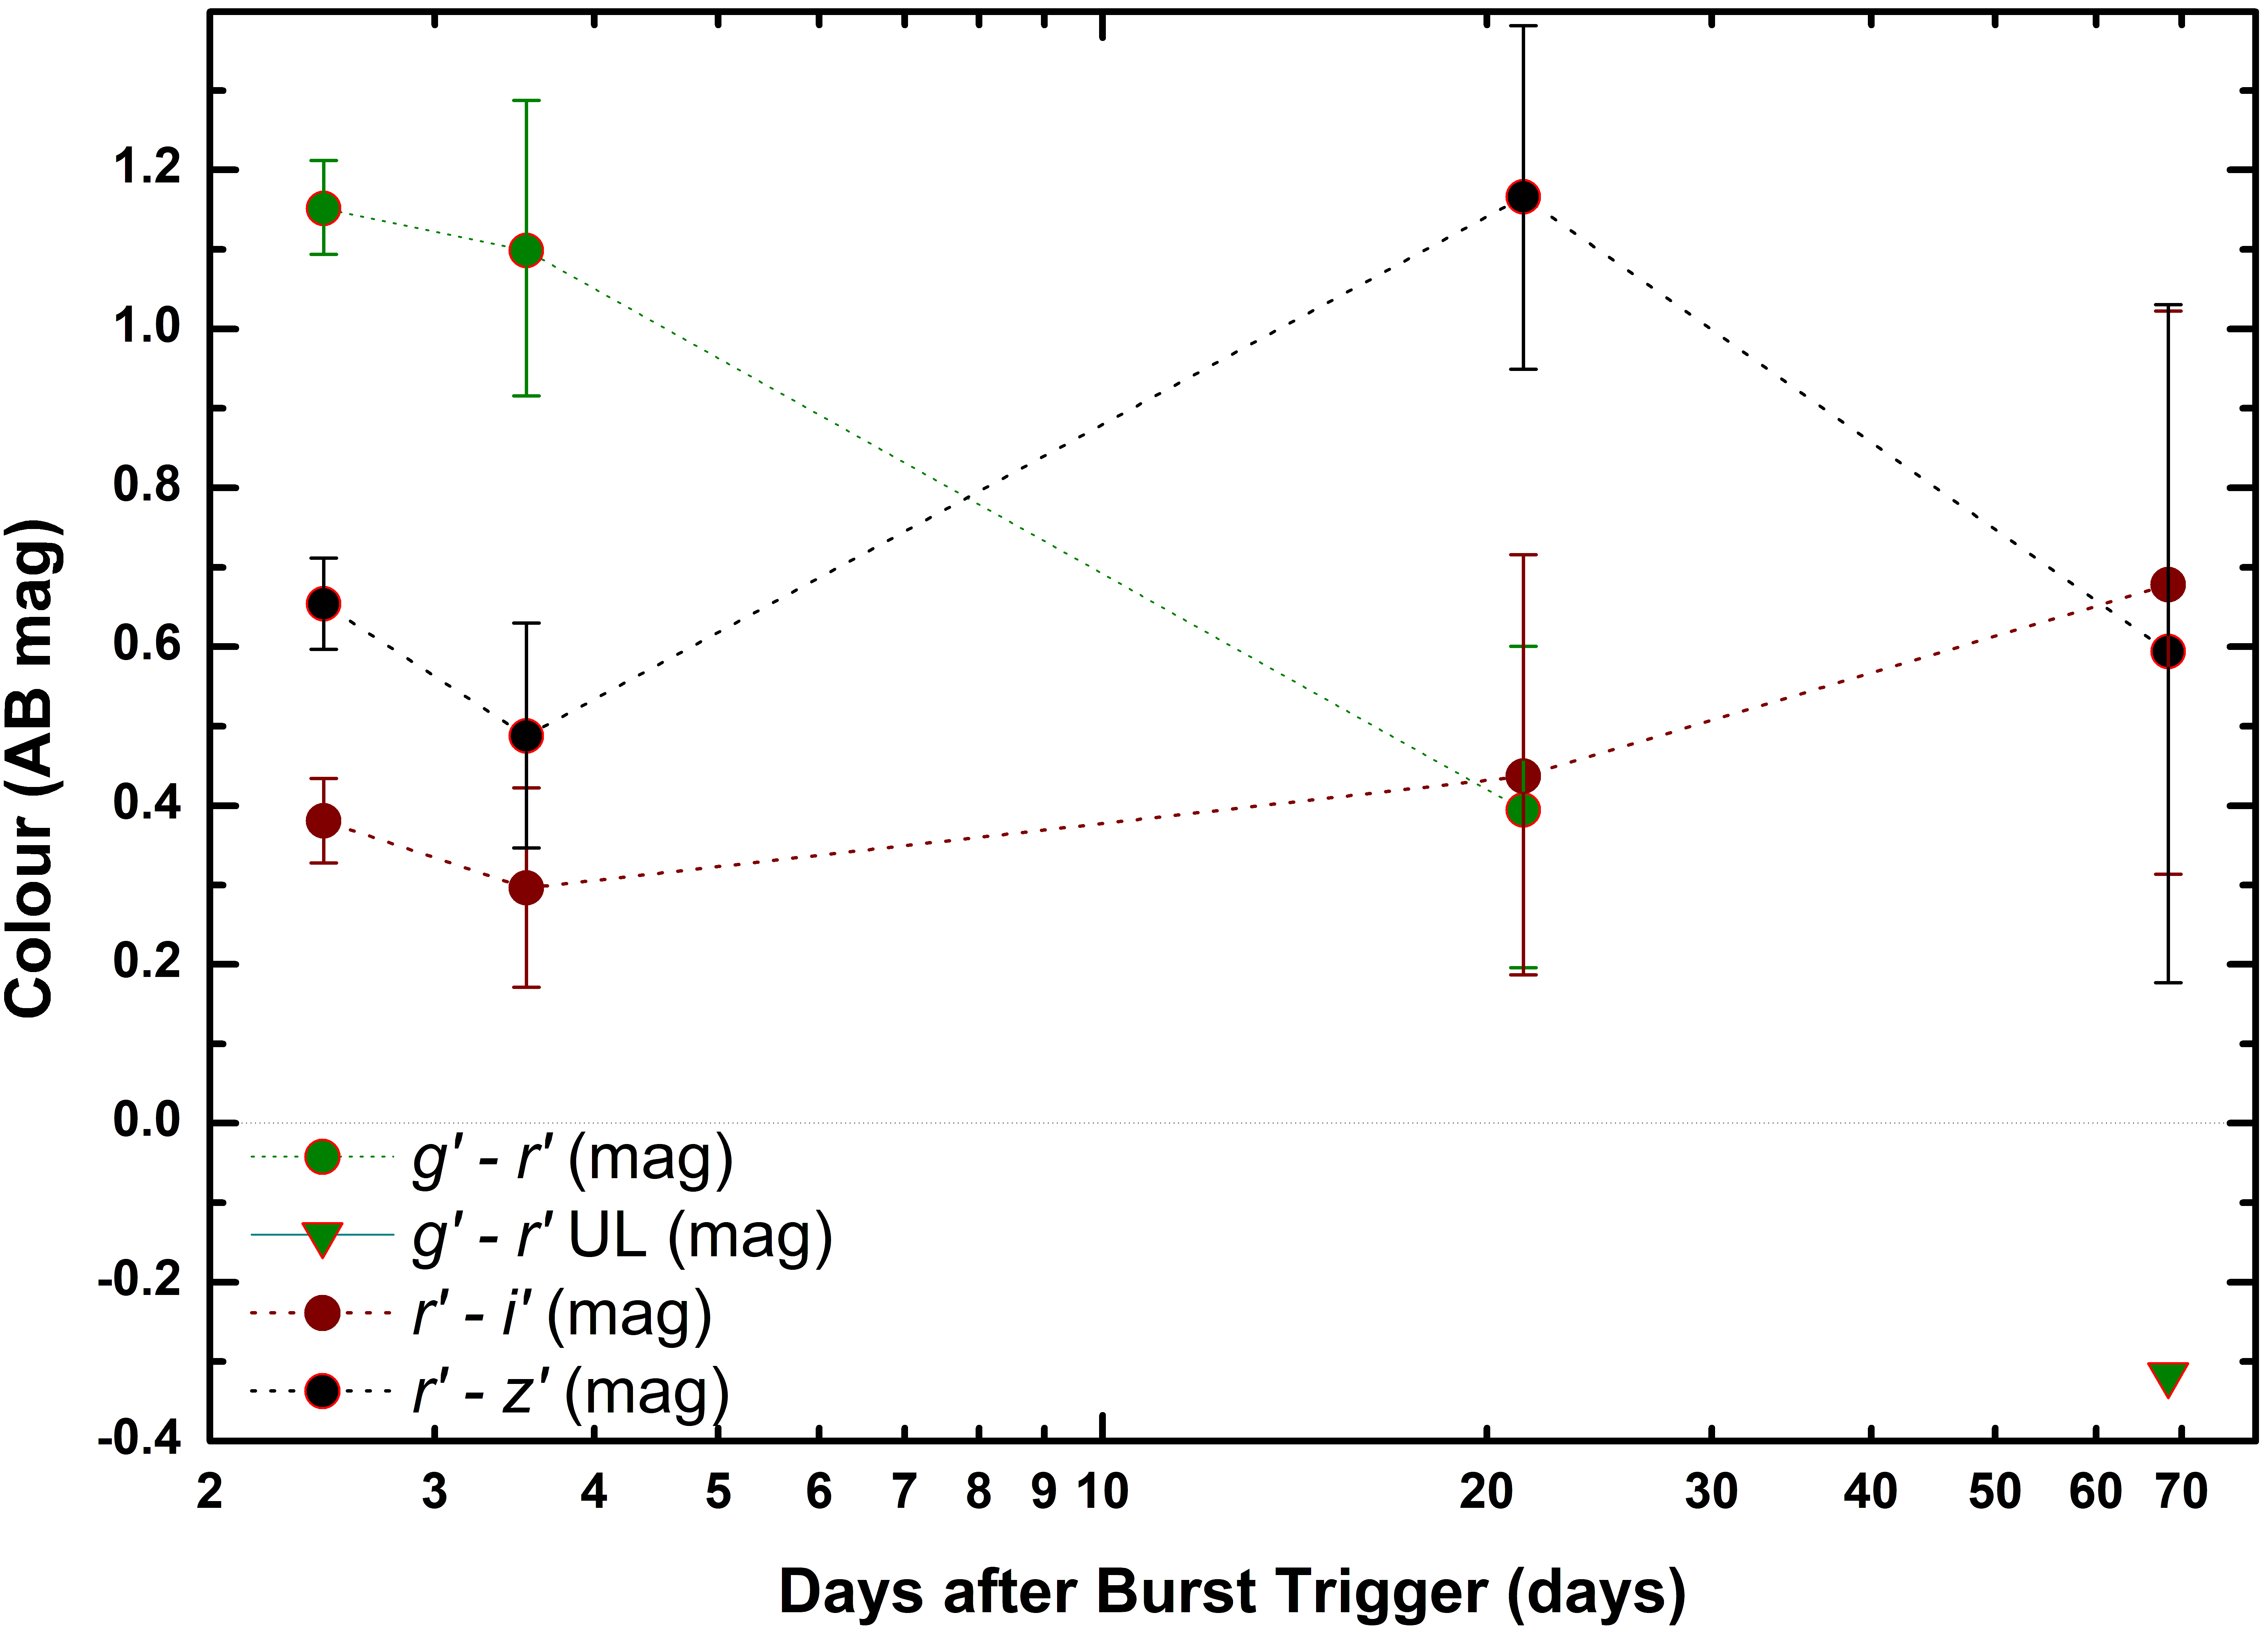
The reddened and relatively faint afterglow implies that it is hardly detected beyond d, and therefore there is no useful overlap with the ground-based data set from Fynbo et al. (2014). We therefore fitted that data independently. It clearly shows a shallower decay than before, an unusual but not unprecedented phenomenon. The data extending from 0.33 to 3.5 days were again fit by single decay for which we find . There follows a large data gap and then two further epochs (as well as a single unfiltered point, calibrated to , inbetween) at 21 and 68 days (as well as the host-galaxy observations about a year after the GRB). A simple extrapolation of the decay showed that at 21 days, the fit strongly overestimated the actual data, therefore, a break must have occurred, likely a jet break. However, as the following “plateau” is clearly not the host-galaxy level, this would imply either a strong, long-lasting flattening of the afterglow, which is very unlikely, or a new emission component. Despite the high redshift and the large line-of-sight extinction, the most natural explanation is a SN following GRB 140506A, as Heintz et al. (2017) already speculate. Another piece of evidence that this bump is due to a new component is that clear colour evolution is now seen, as shown in Fig. 2. While colour evolution during afterglows is not an unknown phenomenon, it is relatively rare, and usually only detectable in case of dense coverage, some such examples being GRB 091127 (Filgas et al. 2011), GRB 111209A (Kann et al. 2018), and GRB 130427A (Perley et al. 2014) – all of these also showed colour evolution within the first hours and not weeks after the GRB. The late-time SNe following GRBs, however, show a thermally-dominated spectrum that is very different from the non-thermal synchrotron afterglow spectrum, which automatically implies colour evolution.
The SN components associated with GRBs were first studied systematically by Zeh et al. (2004), who introduced the context. Based on the detailed light curves of the prototypical GRB-SN 1998bw (Galama et al. 1998; Clocchiatti et al. 2011), assuming that the general shape of GRB-SN light curves is identical, they developed an analytical equation (see Klose et al. 2019) which allows templates of SN 1998bw to be created at other redshifts, taking cosmological effects such as -correction into account. These templates can then be altered based on the luminosity factor , with implying the GRB-SN is just as luminous as SN 1998bw would be at the specific GRB redshift in the specific rest-frame band corresponding to the observer-frame band the measurements were taken in. Furthermore, without changing its fundamental shape, the light curve temporal evolution can be compressed () or stretched () with the stretch factor . This model fits almost all GRB-SN light curves very well (Kann et al. 2022A, in prep.), and in particular that of SN 2011kl, despite this SN being overluminous compared to SN 1998bw (Kann et al. 2019).
We derived template light curves for SN 1998bw at the redshift of GRB 140506A, . At this redshift, the observer-frame bands lie between and , between and , between and , and at about in the rest-frame, respectively. SN 1998bw was observed densely in and with less follow-up in . To emulate bands that lie blueward of in the rest-frame, a simple power-law with was assumed, as GRB-SNe typically show strong UV line damping (with SN 2011kl being a big exception, Greiner et al. 2015; Mazzali et al. 2016). Therefore, we caution here that results derived from the band come with a caveat of uncertainty. As the data are sparse, with only having three data points during the SN-dominated epochs, we fixed to be a shared parameter between bands, and then performed a simultaneous afterglow+SN+host fit, where the afterglow evolved achromatically but the SN can have different values for each band, and the host-galaxy magnitudes were also individual for each band (for , we estimated a host magnitude based on the SED plot of Heintz et al. 2017).
The large data gap from 3 to 21 days implied that the break time and post-break decay slope were degenerate and could not be both left as free parameters in the fit. To study how the choice of a break time affects the discussion of the SN, we fitted two cases, an early break at 7 d and a late break at 12 d. These two choices lead to two very different results for the post-break decay slope, namely for 7 d, and for 12 d, respectively. Fig. 1 shows both fits, and that the SN fit is essentially unaffected in shape by the choice of break time (but not in intrinsic luminosity). Of course, these two choices do not map out the complete possible parameter region, for example, a break at 7 d (or even earlier) followed by a steep decay is also possible, which would make the SN even more luminous. A late break with a shallow post-break decay would be in disagreement with the data at 21 days, however. We note the pre-break decay slope was not influenced by our choice in break time, and the SEDs derived from these fits were only marginally influenced (different SN contribution at different times, but the effect was small) by the break-time choice. We will continue working with the result with a break at 7 d. We also note that the X-ray light curve shows a deviation downward at d. However, the flux has recovered by 14 d and the further decay is in agreement with the earlier afterglow decay. Such an evolution is very atypical for GRB afterglows, but something similar is seen in the X-ray light curve of GRB 111209A. Kann et al. (2019) speculate this might be a jet break (which is detected in the UV/optical for GRB 111209A) combined with rising X-ray emission associated with SN 2011kl. A similar phenomenon may be visible here, associated with the extremely luminous and blue SN (see Sect. 3.3). However, the sparse data means this remains speculation.
3.2 The Spectral Energy Distribution

| (mag) | dust model | ||
|---|---|---|---|
| — | N/A | 6.09 | |
| MW | 1.04 | ||
| LMC | 1.65 | ||
| SMC | 4.21 |
The equation used to fit the afterglow+SN+host uses overlapping components, therefore, the normalisations which define the afterglow magnitudes at 1 / 7 d are pure afterglow values and directly represent the SEDs at these times, and the afterglow fits themselves, being achromatic, imply that these SEDs are valid over the fitting epochs. However, as stated, the UVOT and ground-based data overlap only marginally, therefore we produced two SEDs. However, still assuming the underlying spectrum remains constant, we could fit the two SEDs simultaneously, sharing the intrinsic spectral slope and the extinction, but allowing the normalisation of the two SEDs to vary independently.
The result is shown in Fig. 3, and values are given in Table 1. A fit without dust results in a very red slope and a bad fit. Fits with dust (based on Pei 1992) improve the fit significantly, but the shape of the double SED is not simple. The usual dust that fits GRB afterglows well, that of the Small Magellanic Cloud (SMC) manages to fit the ground-based SED quite well, but fails to fit the UVOT SED, strongly underestimating the ultraviolet emission. The dust of the Large Magellanic Cloud (LMC) represents a strong improvement, but it results in a negative spectral slope which is very unlikely. The best fit is given by using Milky Way (MW) dust with a strong 2175 Å bump but shallow UV slope, only this dust type is capable of modelling the whole double SED satisfactorally. Intriguingly, the derived values are very similar to the those from the SMC dust fit, but the MW model agrees fully with the data. An upturn in the bluest region of the X-shooter spectrum is also reported by Fynbo et al. (2014, but see ), as would be expected from a MW dust extinction model. Such a high extinction value is similar to several other sightlines featuring a 2175 Å bump, such as those toward GRB 070802 (Krühler et al. 2008; Elíasdóttir et al. 2009; Kann et al. 2010; Zafar et al. 2012), GRB 120119A (Morgan et al. 2014, Kann et al. 2021, in prep.), GRB 180325A (Zafar et al. 2018a, Kann et al. 2021, in prep.), and GRB 190114C (Kann et al., 2022A, in prep., Thöne et al., 2022, in prep.)
Fynbo et al. (2014) report an intrinsic spectral slope of the late (post-prompt emission flares) X-ray spectrum of . This is a hard spectrum already, but assuming a cooling break between X-rays and optical implies , in excellent agreement with our result. Fynbo et al. (2014) also verify the cooling break lies between the X-ray and optical band. For such a spectrum and the parametrisation of Fitzpatrick & Massa (2007), Fynbo et al. (2014) find mag, close to our result. They furthermore report their spectrum cannot be fit with a MW extinction law, however, they simply assume mag, significantly lower than the value we derive. We have independently analysed the X-ray to optical SED and confirm the X-ray results of Fynbo et al. (2014), with a cooling break lying in the extreme UV. A fit purely with X-ray and UVOT data also finds results in agreement with the UV/optical/NIR-only fits within errors.
Heintz et al. (2017) present strongly binned spectra from the first two X-shooter epochs (Fynbo et al. 2014). They find that a subtraction of their X-shooter host-galaxy spectrum (taken over a year after the GRB, so there is no SN contribution any more) removes essentially all flux at wavelengths Å, i.e. the upturn seen in the X-shooter afterglow spectra at bluest wavelengths was essentially pure host contribution. They use this as evidence to rule out the “extreme 2175 Å bump” model and derive a dust extinction model with an extremely strong UV extinction. However, this is in contrast with our clear UVOT detection and our UVOT-based SED which shows a relatively flat colour which agrees with the existence of a 2175 Å bump, as well as the lower S/N detection in the UVOT lenticular filters, which should all be extremely damped if the Heintz et al. (2017) dust model is correct. Additionally, from the GROND SED, we do not detect a strong downturn yet in the observer-frame band, bluer than the Å downturn Fynbo et al. (2014) and Heintz et al. (2017) derive from their X-shooter spectra. We do not readily have a solution for this conundrum.
Independent of whether the extinction curve is an extreme 2175 Å bump model as suggested by Fynbo et al. (2014) or the extreme UV extinction model presented by Heintz et al. (2017), the SN results we report in Sect. 3.3 are robust. The extinction Fynbo et al. (2014) find is similar to our result, and the model of Heintz et al. (2017) also leads to a strong correction for extinction, they find mag, even closer to our result. Furthermore, for the SN, only the data are important, and the two extinction models are similar in this observer-frame wavelength range.
3.3 The Supernova
| Fit model | (fitted) | (corrected) | |
|---|---|---|---|
| 7 day break | |||
| 12 day break | |||
| 7 day break | |||
| Two points | |||
The light-curve fit presented in Sect. 3.1 also includes a fit using a SN contribution based on redshifted and -corrected SN 1998bw template light curves, the results are shown in Table 2. The sparsity of the data forced us to make the stretch factor a shared parameter, whereas each band has the luminosity as a free parameter. The fits are indistinguishable in quality, for both we get . We note this fit uses only the data point at 21 d and not the upper limit at 68 d; however, the upper limit is not in disagreement with the SN 1998bw light-curve shape (see Fig. 1).
The first thing to note is that despite the relatively large difference in the chosen break time, the derived values are very similar to each other, the break time (within reasonable limits) has only a minor influence on the SN. The second aspect is that the resulting values are large. Generally, detecting a SN component at a redshift of is not expected and needs either a bright SN or a very faint host galaxy. The contrast between the SN component and the moderately bright host is immediately visible (Heintz et al. 2017), implying a bright SN. This is true in particular for the observer-frame band, where the value exceeds (though it is in agreement within errors) even that of the very blue SN 2011kl (Kann et al. 2019).
However, the value found for SN 2011kl is derived after correcting the measured value for the (relatively small) extinction measured from the GRB 111209A afterglow (Kann et al. 2018, 2019). In the case of GRB 140506A, the extinction is clearly very large (Fynbo et al. 2014; Heintz et al. 2017, and Sect. 3.2). From our SED fit, we derive extinction correction factors of , , , and . Using these corrections and summing the errors in quadrature, we come to final values given in Table 2.
These values are extreme, and significantly larger than even for SN 2011kl. We note that that GRB had a somewhat lower redshift (, Kann et al. 2018) and therefore the observer-frame bands (which are identical) are not the same in the rest frame compared to GRB 140506A. The observer-frame band of GRB 140506A roughly agrees with the observer-frame band for GRB 111209A, both being close to the rest-frame band (where the SN 1998bw template is well-defined as well). In this case, it is versus . Therefore, the SN associated with GRB 140506A is the most luminous detected so far, however, the error bars are large and the difference is only slightly above .
The result is especially remarkable and we must note several caveats. As mentioned, the SN 1998bw template is based on an extrapolation into a spectral regime for which no actual SN 1998bw observations exist. The SN 1998bw template peaks at mag (AB) at 22 days, whereas it is mag (AB) at 24.5 d, mag (AB) at 26 d. This clearly shows the strong UV damping seen in SN 1998bw (and other typical GRB SNe), which was not seen in SN 2011kl (Greiner et al. 2015; Mazzali et al. 2016), and is likely also lacking for the SN associated with GRB 140506A. This SN is highly luminous but the extreme value needs to be seen relative to SN 1998bw.
A second point is that the value is based on fitting a single data point. This is a bright detection and shows a clear evolution to the blue (Fig. 2), so it is irrefutable that the SN is luminous and very blue. However, we can muse how the luminosity would change if the transient had also been detected at 68 days in . The upper limit measured is significantly bluer than even the host-subtracted colour measured at 21 d. What would the luminosity be if the SN were detected in at a fainter magnitude? As we have no real grasp of the colour evolution, we assumed the remains constant, and derived a magnitude at 68 d based on the host-subtracted detection and the colour measured at 21 d. We then added the host-galaxy flux to the value, which ended up being 0.1 mag fainter in total than the upper limit, and redid the fit (with a break time fixed to 7 d) with the different host-galaxy magnitudes included, as before. Results for this fit are shown in the last block of Table 2. Hence, the SN has become fainter in (as expected), but actually slightly more luminous in the other bands; the fit is essentially unchanged in quality, . The main result, however, is that the SN in is not much fainter than it was before, only by 5%.
Overall, the detection of an extremely blue component in this late-time transient is very robust and independent of the choice of break time or colour evolution within reasonable bounds.
4 Discussion
Fynbo et al. (2014) report on a spectrum taken at 52 d post-GRB which they call a host-galaxy spectrum, however, it was taken during the SN phase (which was not recognised by Fynbo et al. 2014). The spectrum only covers the wavelength range of Å, missing the blue part that might show interesting SN features (which are covered in the X-shooter spectrum of GRB 111209A/SN 2011kl, Greiner et al. 2015; Mazzali et al. 2016). Furthermore, it is of low S/N, and only a host-galaxy emission line is detected. Therefore, while it is a spectrum taken during the SN phase, it cannot count as an actual SN spectrum. This implies that the SN following GRB 140506A is bump-only, and with an “Evidence” of only D following Hjorth & Bloom (2012)444“A bump, but the inferred SN properties are not fully consistent with other GRB-SNe or the bump was not well sampled or there is no spectroscopic redshift of the GRB.” (Hjorth & Bloom 2012).
Fynbo et al. (2014) also report on a small but definite shift in the location of the steep flux depression from their first to their second spectrum. We cannot check for a respective colour change as there is no multi-colour photometry during the first epoch. Heintz et al. (2017) point out that this effect may be linked to the emission region in the second epoch being significantly larger. The very high collimation of GRB afterglows at very early times implies that if dust destruction were to be induced in a dust curtain near the GRB, the affected area would be significantly smaller than the emission region at later times. Morgan et al. (2014) report the signature of dust destruction in the very early afterglow of GRB 120119A, however, even after the extinction becomes constant, it is still very high, mag (Morgan et al. 2014; Japelj et al. 2015; Zafar et al. 2018b, Kann et al. 2021, in prep.), similar to our result for GRB 140506A. The colour evolution induced by dust burning is only detected in the first rest-frame s, however, in the case of GRB 120119A. At such times, the only data we have for GRB 140506A are the unfiltered UVOT data beginning 56 rest-frame s post-trigger (though we note the existence of several further strong X-ray flares, Fig. 1). While these few data points do not show a flatter evolution or even rise (emergence from a dusty envelope was a model suggested for the light-curve behaviour of GRB 030418, Rykoff et al. 2004), the lack of any colour evolution allows us to set no constraints on the potential existence of dust burning, or lack thereof.
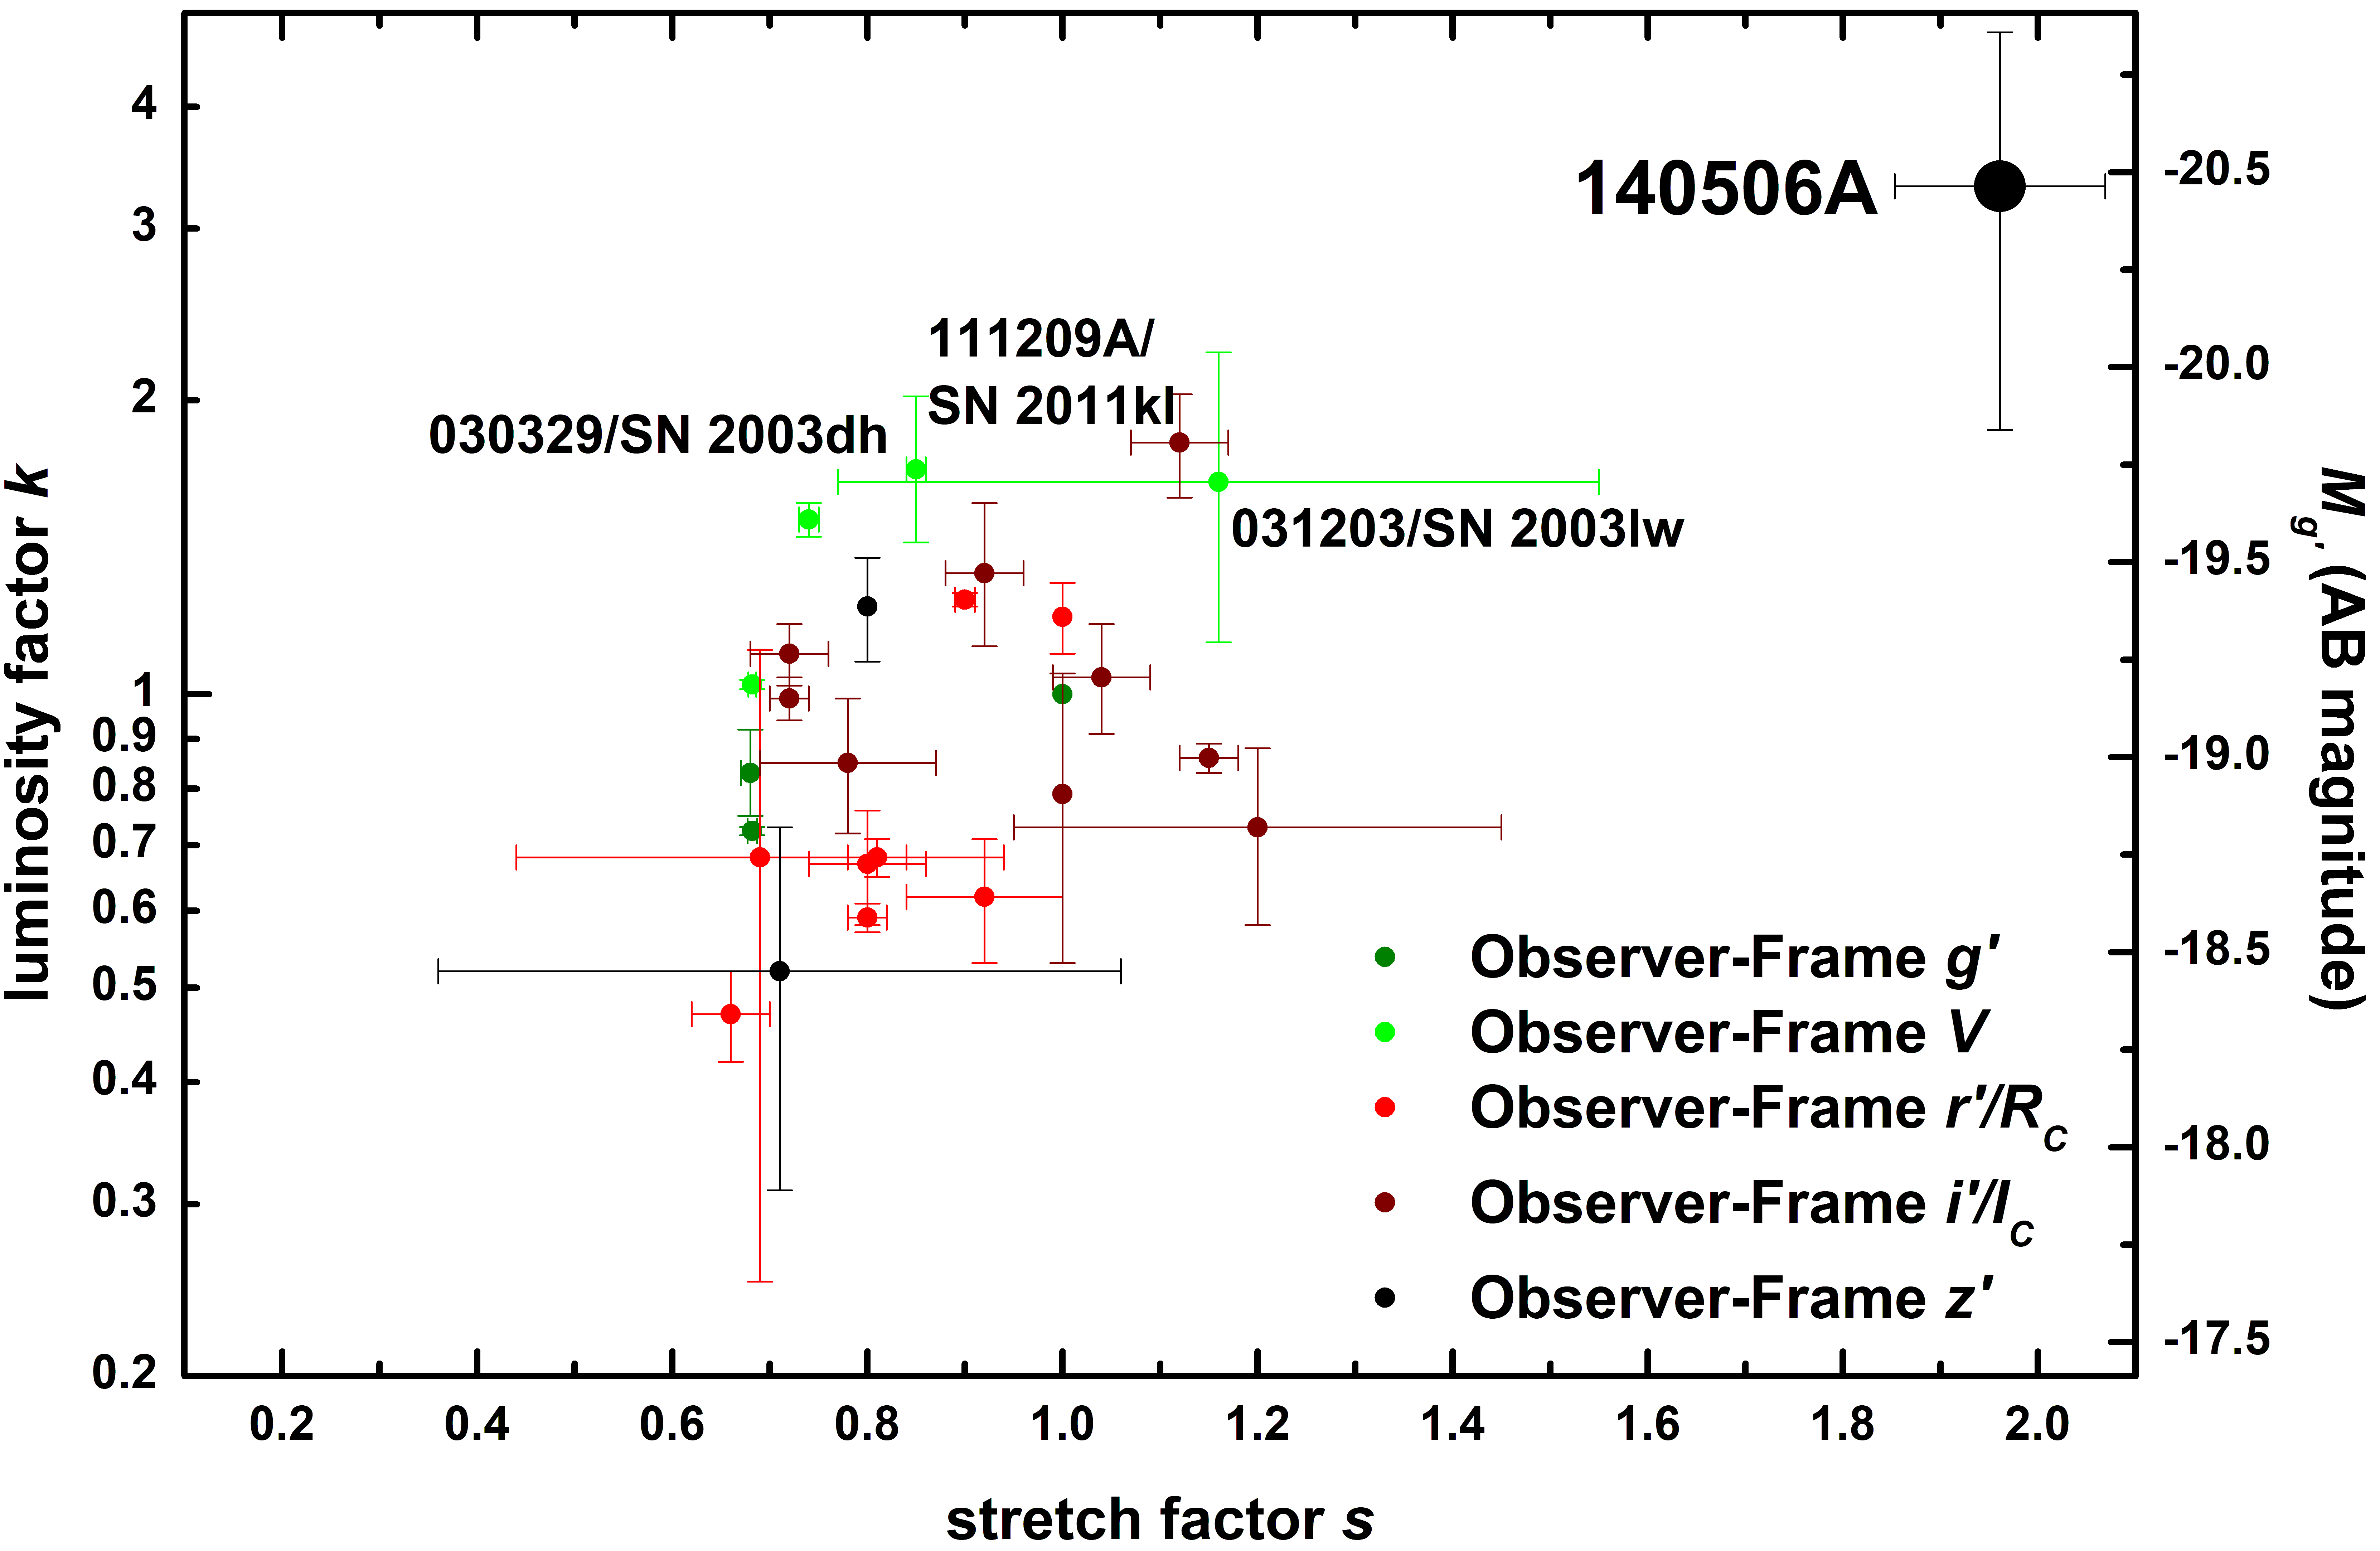
There has been discussion on the use of GRB-SNe as standard candles, with an initial study done by Schulze et al. (2014, their figure 11), and expanded upon by Cano (2014); Cano & Jakobsson (2014); Li & Hjorth (2014); Li et al. (2014). To place the SN of GRB 140506A into such a context, we collect data from the samples of (Ferrero et al. 2006; Thöne et al. 2011; Klose et al. 2019, Kann et al. 2022A, in prep.) and use, similar to Schulze et al. (2014), a “Quasi rest-frame band”, using () values where the observer-frame band corresponds reasonably to the rest-frame band. This is an imprecise process and more detailed studies are in preparation (Kann et al. 2022A,2022B), but it is sufficient to yield a qualitative result. We show the resulting data in Fig. 4. We colour-code the observer-frame bands in which the SNe were fit, this acts as a rough redshift measure. The GRB 140506A SN is immediately seen to be a strong outlier compared to the other GRB-SNe, even GRB 111209A/SN 2011kl, being both far more luminous and far slower in terms of light-curve evolution. However, the combination of these two extremes places the GRB 140506A-SN on the extension of the “GRB-SN Phillips Relation” first discussed by Schulze et al. (2014). A more quantitative analysis will be performed in future work. In Fig. 4, we also show the absolute magnitude in on the right y axis. We took the of SN 1998bw, corrected it for host-galaxy extinction Kann et al. (2019), and estimated mag. We note the data points do not agree exactly with this scale, as they are only close to the rest-frame band.
5 Conclusions
We have studied the light curve, afterglow SED, and potential SN of the ordinary GRB 140506A, that so far had only been remarkable for its high line-of-sight extinction, peculiar dust law, and spectral features (Fynbo et al. 2014; Heintz et al. 2017).
We find that despite clear strong reddening, the afterglow is detected all the way into the UV at early times, allowing us to create a broadband SED which confirms the high extinction and favours a MW-type extinction law with a clear 2175 Å bump.
The late-time transient shows a clear colour change and a long plateau phase before reaching a fainter host-galaxy level, which we interpret as the SN following GRB 140506A. This is a remarkable result, especially the strong detection in the observer-frame band, considering the high redshift of (the highest redshift at which GRB-SNe have been detected so far is , Della Valle et al. 2003; Masetti et al. 2005). It becomes even more remarkable once the strong extinction is corrected for, resulting in the most luminous (but also most slowly evolving) GRB-SN detected so far. The SED is very dissimilar to that of the template GRB-SN, SN 1998bw, which showed strong suppression in the UV, whereas this event remains luminous deep into the UV, similar to GRB 111209A/SN 2011kl. The latter event was, however, associated with a remarkable, ultra-long GRB (Gendre et al. 2013; Greiner et al. 2015; Mazzali et al. 2016; Kann et al. 2018, 2019), whereas GRB 140506A is unremarkable in terms of both duration and energetics.
The very luminous but also very slowly evolving SN of GRB 140506A hints that a luminosity-peak time correlation for GRB-SNe, which would have implications for cosmological measurements, exists and extends all the way into a part of the parameter space that has so far not been populated. It makes clear that late-time follow-up of GRB afterglows at can always yield interesting surprises (unless the host galaxy is too bright and masks the SN emission, which can happen even at significantly lower redshifts like in the case of the faint SN accompanying XRF 100418A, Niino et al. 2012; de Ugarte Postigo et al. 2018). More overly luminous SNe like the one associated with GRB 140506A need to be found to allow the use of GRB-SNe as robust cosmological tracers.
Acknowledgements.
DAK acknowledges support from Spanish National Research Project RTI2018-098104-J-I00 (GRBPhot). AdUP and CCT acknowledge support from Ramón y Cajal fellowships RyC-2012-09975 and RyC-2012-09984 and the Spanish Ministry of Economy and Competitiveness through projects AYA2014-58381-P and AYA2017-89384-P, AdUP furthermore from the BBVA foundation. AR acknowledges support from the INAF project Premiale Supporto Arizona & Italia. SK acknowledges support by the Thüringer Ministerium für Bildung, Wissenschaft und Kultur under FKZ 12010-514 and by grants DFG Kl 766/16-1 and 766/16-3. This work made use of data supplied by the UK Swift Science Data Centre at the University of Leicester.References
- Agüí Fernández et al. (2021) Agüí Fernández, J. F., Thöne, C. C., Kann, D. A., et al. 2021, arXiv e-prints, arXiv:2109.13838
- Ahumada et al. (2021) Ahumada, T., Singer, L. P., Anand, S., et al. 2021, Nature Astronomy [arXiv:2105.05067]
- Breeveld et al. (2011) Breeveld, A. A., Landsman, W., Holland, S. T., et al. 2011, in American Institute of Physics Conference Series, Vol. 1358, American Institute of Physics Conference Series, ed. J. E. McEnery, J. L. Racusin, & N. Gehrels, 373–376
- Burrows et al. (2005) Burrows, D. N., Hill, J. E., Nousek, J. A., et al. 2005, Space Sci. Rev., 120, 165
- Cano (2014) Cano, Z. 2014, ApJ, 794, 121
- Cano & Jakobsson (2014) Cano, Z. & Jakobsson, P. 2014, MNRAS, submitted (arXiv:1409.3570) [arXiv:1409.3570]
- Cano et al. (2017) Cano, Z., Wang, S.-Q., Dai, Z.-G., & Wu, X.-F. 2017, Advances in Astronomy, 2017, 8929054
- Cardelli et al. (1989) Cardelli, J. A., Clayton, G. C., & Mathis, J. S. 1989, ApJ, 345, 245
- Clocchiatti et al. (2011) Clocchiatti, A., Suntzeff, N. B., Covarrubias, R., & Candia, P. 2011, AJ, 141, 163
- de Ugarte Postigo et al. (2018) de Ugarte Postigo, A., Thöne, C. C., Bensch, K., et al. 2018, A&A, 620, A190
- Della Valle et al. (2003) Della Valle, M., Malesani, D., Benetti, S., et al. 2003, A&A, 406, L33
- Elíasdóttir et al. (2009) Elíasdóttir, Á., Fynbo, J. P. U., Hjorth, J., et al. 2009, ApJ, 697, 1725
- Evans et al. (2009) Evans, P. A., Beardmore, A. P., Page, K. L., et al. 2009, MNRAS, 397, 1177
- Evans et al. (2007) Evans, P. A., Beardmore, A. P., Page, K. L., et al. 2007, A&A, 469, 379
- Ferrero et al. (2006) Ferrero, P., Kann, D. A., Zeh, A., et al. 2006, A&A, 457, 857
- Filgas et al. (2011) Filgas, R., Greiner, J., Schady, P., et al. 2011, A&A, 535, A57
- Fitzpatrick & Massa (2007) Fitzpatrick, E. L. & Massa, D. 2007, ApJ, 663, 320
- Fynbo et al. (2014) Fynbo, J. P. U., Krühler, T., Leighly, K., et al. 2014, A&A, 572, A12
- Galama et al. (1998) Galama, T. J., Vreeswijk, P. M., van Paradijs, J., et al. 1998, Nature, 395, 670
- Gehrels et al. (2004) Gehrels, N., Chincarini, G., Giommi, P., et al. 2004, ApJ, 611, 1005
- Gendre et al. (2013) Gendre, B., Stratta, G., Atteia, J. L., et al. 2013, ApJ, 766, 30
- Golenetskii et al. (2014) Golenetskii, S., Aptekar, R., Frederiks, D., et al. 2014, GRB Coordinates Network, 16223
- Golenetskii et al. (2011) Golenetskii, S., Aptekar, R., Mazets, E., et al. 2011, GCN Circulars, 12663
- Gompertz et al. (2014) Gompertz, B. P., Burrows, D. N., Cenko, S. B., et al. 2014, GRB Coordinates Network, 16214
- Greiner et al. (2015) Greiner, J., Mazzali, P. A., Kann, D. A., et al. 2015, Nature, 523, 189
- Heintz et al. (2017) Heintz, K. E., Fynbo, J. P. U., Jakobsson, P., et al. 2017, A&A, 601, A83
- Hjorth & Bloom (2012) Hjorth, J. & Bloom, J. S. 2012, The Gamma-Ray Burst - Supernova Connection, 169–190
- Hjorth et al. (2003) Hjorth, J., Sollerman, J., Møller, P., et al. 2003, Nature, 423, 847
- Japelj et al. (2015) Japelj, J., Covino, S., Gomboc, A., et al. 2015, A&A, 579, A74
- Jenke (2014) Jenke, P. 2014, GRB Coordinates Network, 16220
- Kann et al. (2011) Kann, D. A., Klose, S., Zhang, B., et al. 2011, ApJ, 734, 96
- Kann et al. (2010) Kann, D. A., Klose, S., Zhang, B., et al. 2010, ApJ, 720, 1513
- Kann et al. (2018) Kann, D. A., Schady, P., Olivares, E. F., et al. 2018, A&A, 617, A122
- Kann et al. (2019) Kann, D. A., Schady, P., Olivares E., F., et al. 2019, A&A, 624, A143
- Klose et al. (2019) Klose, S., Schmidl, S., Kann, D. A., et al. 2019, A&A, 622, A138
- Krühler et al. (2008) Krühler, T., Küpcü Yoldaş, A., Greiner, J., et al. 2008, ApJ, 685, 376
- Levan et al. (2014) Levan, A. J., Tanvir, N. R., Starling, R. L. C., et al. 2014, ApJ, 781, 13
- Li & Hjorth (2014) Li, X. & Hjorth, J. 2014, A&A, submitted (arXiv:1407.3506) [arXiv:1407.3506]
- Li et al. (2014) Li, X., Hjorth, J., & Wojtak, R. 2014, ApJ, 796, L4
- Markwardt et al. (2014) Markwardt, C. B., Barthelmy, S. D., Baumgartner, W. H., et al. 2014, GRB Coordinates Network, 16218
- Masetti et al. (2005) Masetti, N., Palazzi, E., Pian, E., et al. 2005, A&A, 438, 841
- Matheson et al. (2003) Matheson, T., Garnavich, P. M., Stanek, K. Z., et al. 2003, ApJ, 599, 394
- Mazzali et al. (2006) Mazzali, P. A., Deng, J., Nomoto, K., et al. 2006, Nature, 442, 1018
- Mazzali et al. (2016) Mazzali, P. A., Sullivan, M., Pian, E., Greiner, J., & Kann, D. A. 2016, MNRAS, 458, 3455
- Melandri et al. (2014) Melandri, A., Pian, E., D’Elia, V., et al. 2014, A&A, 567, A29
- Morgan et al. (2014) Morgan, A. N., Perley, D. A., Cenko, S. B., et al. 2014, MNRAS, 440, 1810
- Niino et al. (2012) Niino, Y., Hashimoto, T., Aoki, K., et al. 2012, PASJ, 64, 115
- Oates et al. (2009) Oates, S. R., Page, M. J., Schady, P., et al. 2009, MNRAS, 395, 490
- Pei (1992) Pei, Y. C. 1992, ApJ, 395, 130
- Perley et al. (2014) Perley, D. A., Cenko, S. B., Corsi, A., et al. 2014, ApJ, 781, 37
- Pian et al. (2006) Pian, E., Mazzali, P. A., Masetti, N., et al. 2006, Nature, 442, 1011
- Poole et al. (2008) Poole, T. S., Breeveld, A. A., Page, M. J., et al. 2008, MNRAS, 383, 627
- Roming et al. (2005) Roming, P. W. A., Kennedy, T. E., Mason, K. O., et al. 2005, Space Sci. Rev., 120, 95
- Rossi et al. (2021) Rossi, A., Rothberg, B., Palazzi, E., et al. 2021, arXiv e-prints, arXiv:2105.03829
- Rykoff et al. (2004) Rykoff, E. S., Smith, D. A., Price, P. A., et al. 2004, ApJ, 601, 1013
- Schlafly & Finkbeiner (2011) Schlafly, E. F. & Finkbeiner, D. P. 2011, ApJ, 737, 103
- Schulze et al. (2014) Schulze, S., Malesani, D., Cucchiara, A., et al. 2014, A&A, 566, A102
- Siegel & Gompertz (2014) Siegel, M. H. & Gompertz, B. P. 2014, GRB Coordinates Network, 16219
- Spergel et al. (2003) Spergel, D. N., Verde, L., Peiris, H. V., et al. 2003, ApJS, 148, 175
- Stanek et al. (2003) Stanek, K. Z., Matheson, T., Garnavich, P. M., et al. 2003, ApJ, 591, L17
- Stratta et al. (2013) Stratta, G., Gendre, B., Atteia, J. L., et al. 2013, ApJ, 779, 66
- Thöne et al. (2011) Thöne, C. C., de Ugarte Postigo, A., Fryer, C. L., et al. 2011, Nature, 480, 72
- Tsvetkova et al. (2017) Tsvetkova, A., Frederiks, D., Golenetskii, S., et al. 2017, ApJ, 850, 161
- Woosley & Bloom (2006) Woosley, S. E. & Bloom, J. S. 2006, ARA&A, 44, 507
- Xu et al. (2013) Xu, D., de Ugarte Postigo, A., Leloudas, G., et al. 2013, ApJ, 776, 98
- Zafar et al. (2018a) Zafar, T., Heintz, K. E., Fynbo, J. P. U., et al. 2018a, ApJ, 860, L21
- Zafar et al. (2012) Zafar, T., Watson, D., Elíasdóttir, Á., et al. 2012, ApJ, 753, 82
- Zafar et al. (2018b) Zafar, T., Watson, D., Møller, P., et al. 2018b, MNRAS, 479, 1542
- Zeh et al. (2004) Zeh, A., Klose, S., & Hartmann, D. H. 2004, ApJ, 609, 952
- Zhang et al. (2009) Zhang, B., Zhang, B.-B., Virgili, F. J., et al. 2009, ApJ, 703, 1696
- Zhang et al. (2021) Zhang, B.-B., Liu, Z. K., Peng, Z. K., et al. 2021, Nature Astronomy [arXiv:2105.05021]
| t (days) | mag | filter |
|---|---|---|
| 0.007419 | ||
| 0.009423 | ||
| 0.012113 | ||
| 0.014116 | ||
| 0.073942 | ||
| 0.016118 | UL | |
| 0.018121 | UL | |
| 0.195006 | UL | |
| 0.535097 | UL | |
| 0.795653 | UL | |
| 5.834459 | UL | |
| 13.803396 | UL | |
| 17.937837 | UL | |
| 0.007986 | ||
| 0.012679 | ||
| 0.078682 | ||
| 0.009999 | UL | |
| 0.014680 | UL | |
| 0.016684 | UL | |
| 0.062059 | UL | |
| 0.340650 | UL | |
| 2.361840 | UL | |
| 2.529452 | UL | |
| 6.797721 | UL | |
| 10.725055 | UL | |
| 18.395811 | UL | |
| 22.595256 | UL | |
| 26.761876 | UL | |
| 30.580328 | UL | |
| 0.008277 | ||
| 0.012966 | ||
| 0.016978 | ||
| 0.064437 | ||
| 0.081058 | ||
| 0.014971 | UL | |
| 0.348816 | UL | |
| 0.465948 | UL | |
| 0.734638 | UL | |
| 3.201317 | UL | |
| 7.797540 | UL | |
| 11.663524 | UL | |
| 15.791810 | UL | |
| 0.003941 | ||
| 0.004288 | ||
| 0.004691 | ||
| 0.005154 | ||
| 0.005618 | ||
| 0.006137 | ||
| 0.006546 | ||
| 0.008560 | ||
| 0.013254 | ||
| 0.015102 | ||
| 0.017261 | ||
| 0.066808 | ||
| 0.083428 | UL | |
| 0.400859 | UL | |
| 0.484796 | UL | |
| 0.743324 | UL | |
| 4.798999 | UL | |
| 8.223336 | UL | |
| 20.363598 | UL | |
| 24.395194 | UL | |
| 28.659326 | UL | |
| 0.006843 | ||
| 0.008847 | ||
| 0.015394 | ||
| 0.017547 | ||
| 0.069184 | ||
| 0.130621 | ||
| 0.013540 | UL | |
| 0.084803 | UL | |
| 0.411421 | UL | |
| 0.663690 | UL | |
| 0.007704 | ||
| 0.012396 | ||
| 0.016400 | ||
| 0.059688 | ||
| 0.076311 | ||
| 0.009704 | UL | |
| 0.014398 | UL | |
| 0.330130 | UL | |
| 0.592875 | UL | |
| 0.802144 | UL | |
| 0.001360 | ||
| 0.001476 | ||
| 0.001591 | ||
| 0.001707 | ||
| 0.001823 | ||
| 0.001939 | ||
| 0.002055 | ||
| 0.002170 | ||
| 0.002286 | ||
| 0.002458 | ||
| 0.002689 | ||
| 0.002920 | ||
| 0.007126 | ||
| 0.009129 | ||
| 0.011030 | ||
| 0.013822 | ||
| 0.015823 | ||
| 0.017829 | ||
| 0.071559 | ||
| 0.141189 | ||
| 1.806576 | ||
| 0.417553 | UL | |
| 0.672448 | UL | |
| 0.966973 | UL | |
| 1.265749 | UL | |
| 1.468435 | UL | |
| 1.976269 | UL |