compat=1.1.0
Exclusion limits on Dark Matter-Neutrino Scattering Cross-section
Abstract
We derive new constraints on combination of dark matter - electron cross-section () and dark matter - neutrino cross-section () utilising the gain in kinetic energy of the dark matter (DM) particles due to scattering with the cosmic ray electrons and the diffuse supernova neutrino background (DSNB). Since the flux of the DSNB neutrinos is comparable to the CR electron flux in the energy range , scattering with the DSNB neutrinos can also boost low-mass DM significantly in addition to the boost due to interaction with the cosmic ray electrons. We use the XENON1T as well as the Super-Kamiokande data to derive bounds on and . While our bounds for are comparable with those in the literature, we show that the Super-Kamiokande experiment provides the strongest constraint on for DM masses below a few MeV.
I Introduction
The presence of dark matter (DM) in the universe and its dominance over luminous matter is well-established. DM is known to be non-relativistic and very weakly interacting with the Standard Model (SM) particles. The existence of DM has been inferred only via their gravitational interactions, and both the DM mass and their exact interaction strengths with the SM particles are unknown (see Bauer and Plehn (2019); Bertone et al. (2005); Lisanti (2017); Profumo (2013) for reviews).
The DM-proton and DM-electron interaction strengths have been constrained severely by various direct detection (DD) experiments Aprile et al. (2020a, b); Crisler et al. (2018); Angloher et al. (2016); Agnes et al. (2018). Their basic working principle is to measure the recoil energy of electron/nucleus once the incoming DM particles scatter of them. But one major limitation of this method is that these DD experiments lose sensitivity rapidly for low mass DM (below DM mass of 5 GeV for DM-proton cross-section Aprile et al. (2016), and below DM mass of 5 MeV for DM-electron cross-section Essig et al. (2012)) since very light DM particles cannot produce enough recoil to be detected. The most stringent constraints on DM-electron scattering cross-section comes from the SENSEI experiment: for Abramoff et al. (2019).
In the past few decades many other novel detection strategies have been developed: employing the energy deposition in white dwarfs or neutron starsBaryakhtar et al. (2017); Dasgupta et al. (2019); Bose et al. (2021); Guha and Sen (2021); Sen and Guha (2021); Acevedo et al. (2021); Leane and Smirnov (2021); Garani et al. (2021); Joglekar et al. (2020a, b), from Big Bang NucleosynthesisGreen and Rajendran (2017); Baumann et al. (2016); Krnjaic and McDermott (2020), DM production in astrophysical objects McKeen et al. (2020), cooling of stars and supernovaeRaffelt (2008, 1999); Kadota and Silk (2014); Dreiner et al. (2014); Guha et al. (2019), colliders searches etc. Bai and Rajaraman (2011); Cohen et al. (2015). Cosmological observations have also been used to constrain interactions of low mass DM Ali-Haïmoud (2021); Nguyen et al. (2021). For example, CMB spectral distortion excludes DM-electron scattering cross-section above for Ali-Haïmoud (2021) if the cross section is momentum independent.
The DM-neutrino cross-section (), which is the focus of our study, cannot be independently constrained by the DD experiments since matter is not made of neutrinos. However, as we will discuss later, the DD experiments can be used to constrain a function of and (for more details refer to Sec. IV). Independent bound on does however exist from Planck and large scale structure experiments: if the cross section is momentum independent Wilkinson et al. (2014). Such constraints are especially important for those models where DM interact with leptons and dominant interaction is with neutrinos Brune and Päs (2019); Blennow et al. (2019).
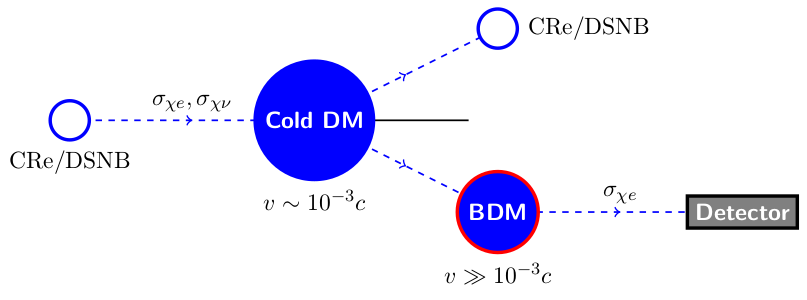
In order to recover the sensitivity of the DD experiments for low mass DM, the idea of Boosted Dark Matter (BDM) has been explored in recent years. In this scenario, the DM is boosted to higher velocity due to scattering with various cosmic ray components (see Fig. 1 for a schematic diagram) This idea has been explored using CR protons Bringmann and Pospelov (2019); Cappiello et al. (2019); Cappiello and Beacom (2019), helium nuclei Bringmann and Pospelov (2019), cosmic electrons Ema et al. (2019); Cappiello et al. (2019); Cappiello and Beacom (2019); Dent et al. (2021); Jho et al. (2020); Bramante et al. (2021), and neutrinos from various astrophysical sources Farzan and Palomares-Ruiz (2014); Argüelles et al. (2017); Yin (2019); Jho et al. (2021); Das and Sen (2021).
Our Universe is abundant in MeV energy neutrinos emerging from massive stars going supernova, right from the epoch of first star formation. Similarly, our galaxy also has energetic electron flux. We consider that the DM in the Milky Way halo experiences scattering with the DSNB neutrinos as well as the cosmic electrons, and gets boosted to velocities . Such upscattered low-mass DM can leave interesting signatures in low-energy recoil experiments like XENON1T (where detectable electron recoil energies are of the order of few keV because it is based on the scintillation process), as well as in high-energy recoil experiments like Super-Kamiokande (where detectable electron recoil energies are of the order of few MeV because Super-K relies on Cherenkov radiation).
In earlier studies, CR electrons and DSNB were separately considered as the particles transferring kinetic energy to the DM. However, as shown in Fig. 2, the fluxes for CR electrons and DSNB neutrinos are comparable in the energy range motivating us to include both these contributions to the DM boost. Note that, while studying , can in principle be set to zero but the vice versa cannot be done since, for the detection of the DM signal, the existence of is crucial. And once is non-zero, it will also contribute to boost the DM and must be taken into account in a consistent analysis. In this work, we have thus taken into account contributions to the DM boost due to the CR electrons as well as the DSNB neutrinos, and used the XENON1T Aprile et al. (2020b) and Super-Kamiokande Bays et al. (2012) data to provide exclusion limit on the DM-neutrino and DM-electron interactions. To our knowledge, we are the first to use the Super-Kamiokande data to constrain the DM-neutrino cross-section, and we show that it provides the strongest direction detection bound in the DM mass range below MeV.
The paper is organized as follows. In Sec. II, we discuss the DSNB and cosmic ray electron flux as a function of energy. In Sec. III, we calculate the flux of boosted dark matter which is used to calculate rate of scattering (Sec. IV) in different detectors. This rate is then compared and analyzed with the observations of Xenon1T and Super Kamiokande using statistics in section V. In Sec. VI, we discuss our results and conclude.
II Cosmic ray electron and neutrino flux
CR electron flux can be described by certain parameterization of the local interstellar spectrum Boschini et al. (2018) given as
| (1) |
where the unit of is given in and the kinetic energy () of the CR electrons is in MeV. The above parameterization is in accordance with Fermi-LAT Ackermann et al. (2012); Abdo et al. (2009); Ackermann et al. (2010); Abdollahi et al. (2017), AMS-02 Aguilar et al. (2014), PAMELA Adriani et al. (2011, 2017), and Voyager Cummings et al. (2016); Stone et al. (2013) data.
On the other hand, the DSNB flux can be calculated from the knowledge of the rate of core-collapse supernovae () Beacom (2010); Horiuchi et al. (2009)
| (2) |
The is a function of star formation rate and has been calculated following Lunardini (2016). The observable effective spectra of the neutrinos emitted from supernovae, is assumed to be of Fermi-Dirac form and approximately given for each flavour as Beacom (2010); Lunardini (2016)
| (3) |
where is the total energy released in the supernova explosion in the form of neutrinos. is the temperature of the neutrinos. Supernova simulations and Super-Kamiokande observations suggest the estimates of the temperatures to be for , for and for Lunardini (2016); Zhang et al. (2015). is the observed energy at earth due to redshift . The maximum redshift is generally taken to be . The Hubble function is given by , where, . and are the vacuum and matter contribution to the energy density of the Universe, respectively Aghanim et al. (2020).
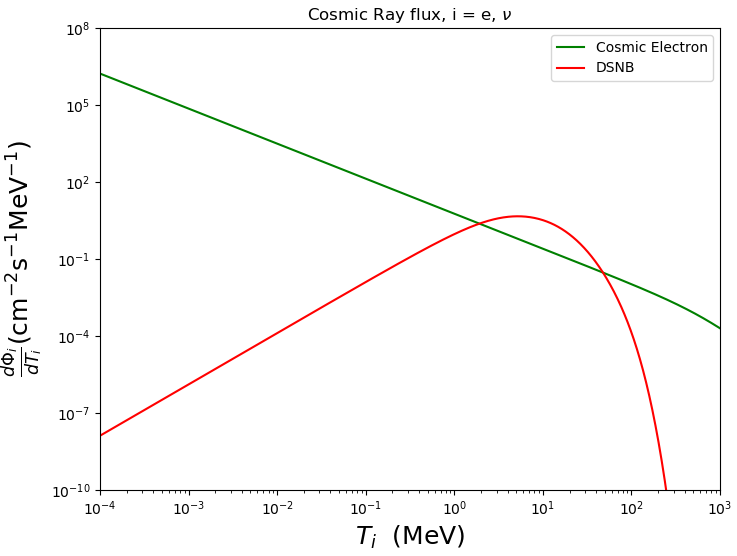
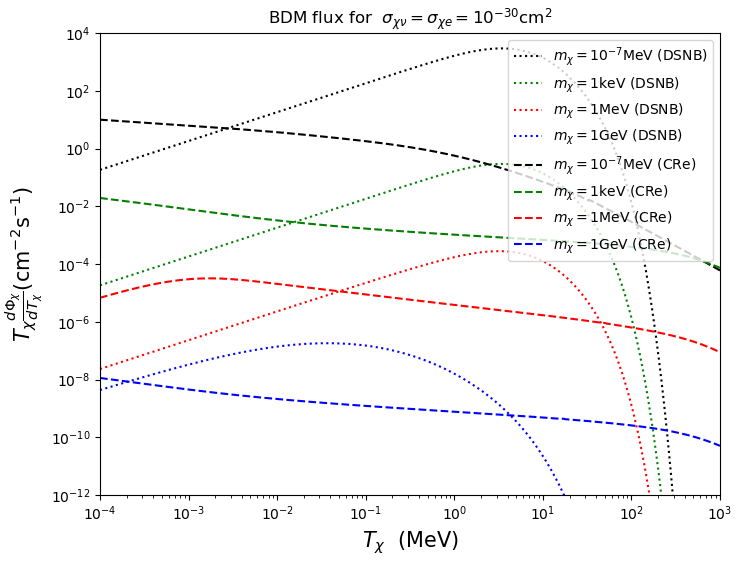
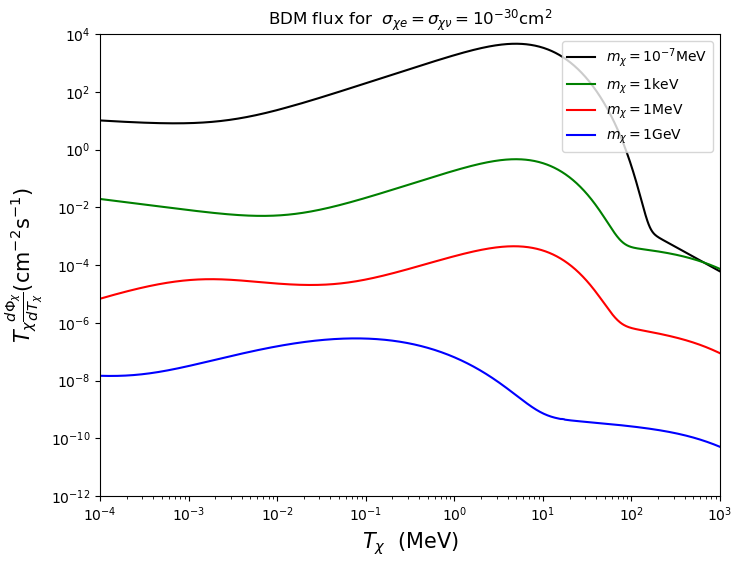
Fig. 2 shows the cosmic ray electron flux along with the flux of neutrinos coming from supernovae. As can be observed from this figure, for , both the fluxes are of similar order and this range is crucial for boosting DM with mass below MeV. This fact inspire us to consider both the fluxes to derive bounds on and for light DM case considered here.
III Boosted Dark matter flux
Cold dark matter (DM) particles get boosted after getting hit by cosmic ray electrons and DSNB. We assume that the DM-electrons or DM-neutrinos scattering cross-section is constant as a function of center of mass energy. We calculated the flux of the boosted DM using the cosmic ray electron and neutrino fluxes discussed at Sec. II following Bringmann and Pospelov (2019); Ema et al. (2019); Cappiello et al. (2019).
For -DM scattering (), the energy transfer to the cold DM by the CR electron/DSNB is given by
| (4) |
where is the scattering angle at the centre of momentum frame.
Solving Eq. 4 we get the minimum required energy of the electrons/neutrinos to produce a certain amount of kinetic energy of the boosted DM
| (5) |
The and sign in Eq. (5) are applicable for and , respectively.
For the elastic scattering cross-section , the collision rate of - per unit volume, having kinetic energy of the particle in the range , is given by
| (6) |
Where, is the Local Interstellar Spectrum for the particle . The solid angle subtended by a small facet having flat surface area , orientation and distance from the viewer is
| (7) |
If is very large, .
We consider that the incoming electrons/neutrinos with kinetic energy are contained within . Let be the length at which is spread along and be the area vector of the flat surface. In that case, and is the area of the sphere of radius around the DM particles.
Electrons/neutrinos are going out from to all direction. But we are interested only those who are directed towards the DM. Therefore, induced DM flux is given by
| (8) | |||||
Now we have to integrate over all possible line segment along the line of sight. Let be the effective distance out to which all the electrons/neutrinos have to be taken into account. So, for homogeneous and isotropic distribution of DM and
| (9) |
In our present work, we consider the effective distance for the DSNB to be and for the incoming cosmic ray electrons . As an independent variable, if is having flat distribution (i.e., can take any value in the range with equal probability), we can write,
| (10) |
But and both are functions of , and in that case can be written as
Thus,
| (11) |
The heaviside step function inside the integration ensures that , where is a random variable having a flat distribution. In that way turns the above integral to a more meaningful one . In other words, the function ensures that cannot take any value independent of and has a minimum value to produce a particular . So finally Eq.(11) can be rewritten as
| (12) |
Putting everything together, we get the following expression for the -boosted DM flux from Eq.(11)
| (13) |
Using Eq. (13), we obtain the BDM fluxes and show them Fig. 3. The bumps in the right panel of Fig. 3 are due to the behaviour of DSNB spectrum. We also notice that the flux of boosted sub-GeV DM peaks at energies greater than a MeV due to DSNB. Thus, DSNB contribution could be important in the context of Super-Kamiokande (where recoil energies are of order of a MeV’s)
IV Rate equation
| (14) |
where, and are obtained using Eqs. (4) and (5) with the simple replacements and , respectively. As different experiments provide the event rate in different units, we incorporate this fact in a single expression (Eq. 14) via parameter . Thus, the recoil spectrum for XENON1T is obtained by taking , where is atomic number of Xenon and is the mass of a single Xenon atom. In case of the SK-I data, this factor corresponds to the total number of electrons, Bays et al. (2012); Ema et al. (2019); Cappiello and Beacom (2019).
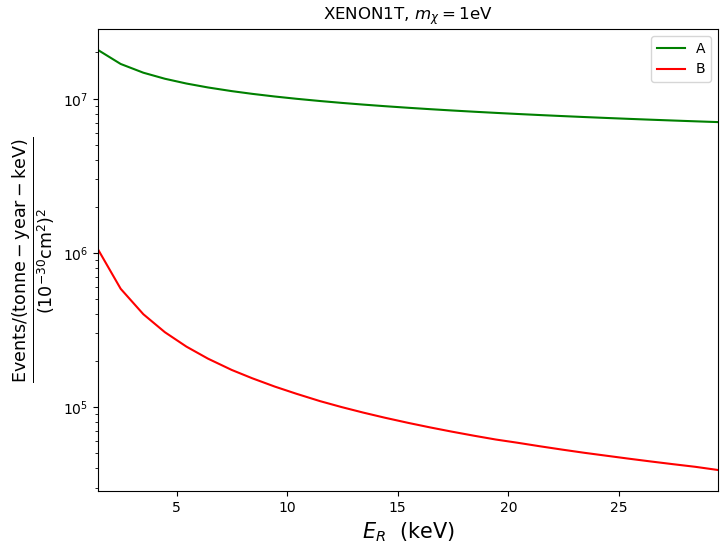
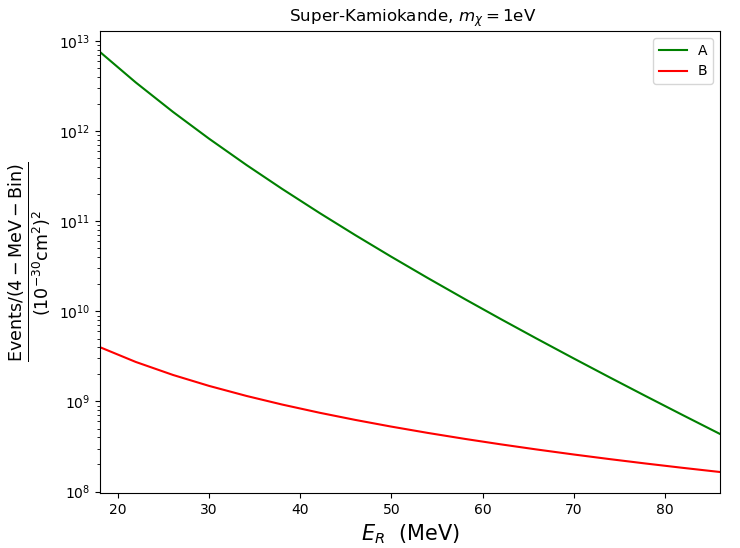
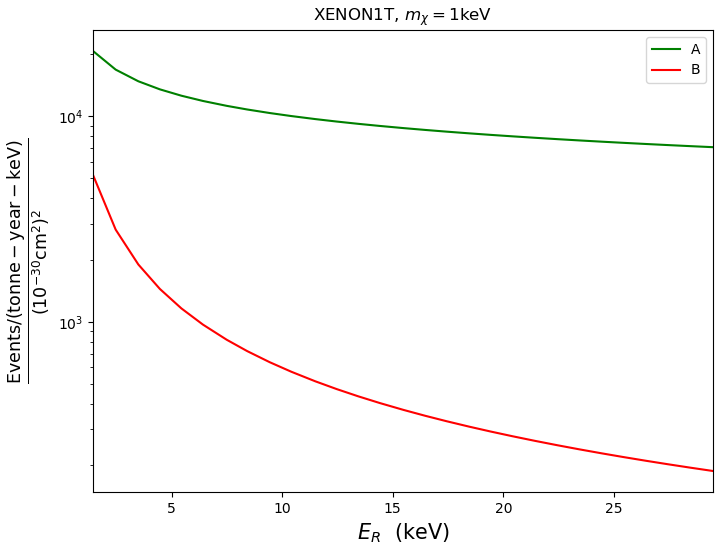
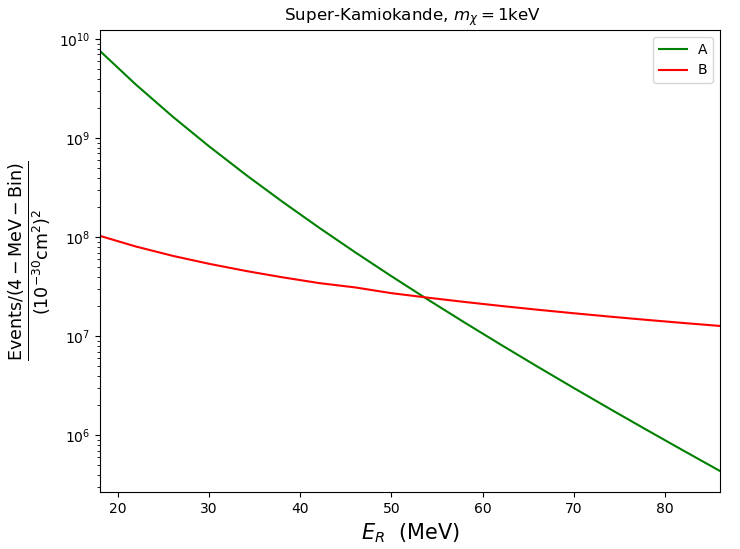
Following Eq.(14) we expand the recoil spectra for XENON1T and Super-Kamiokande to obtain
| (15) |
with
and
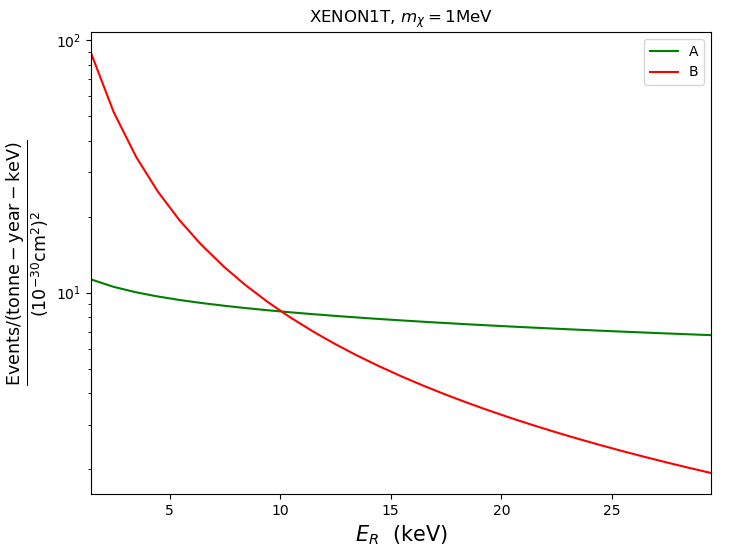
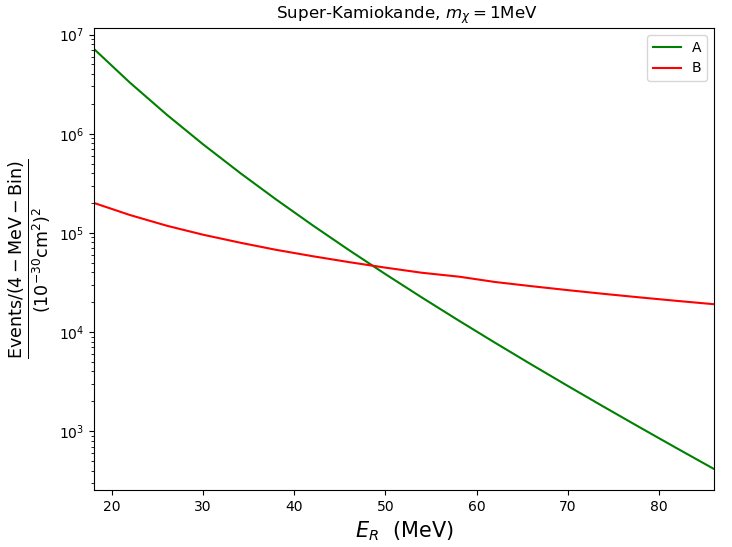
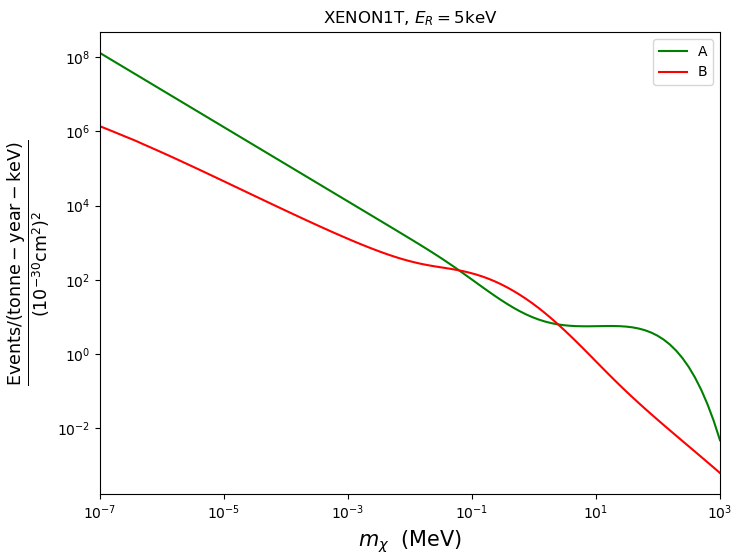
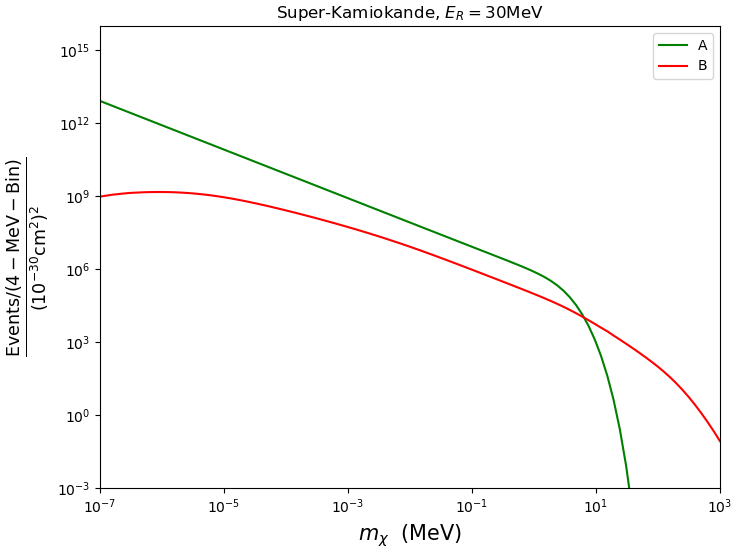
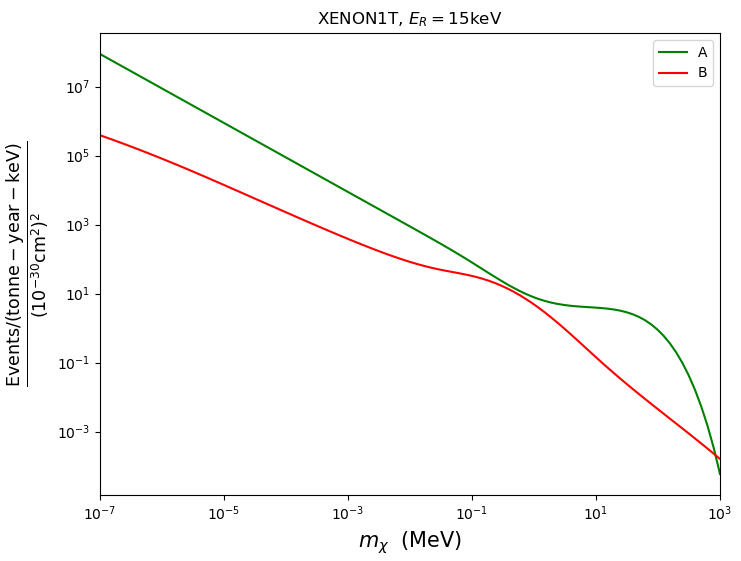
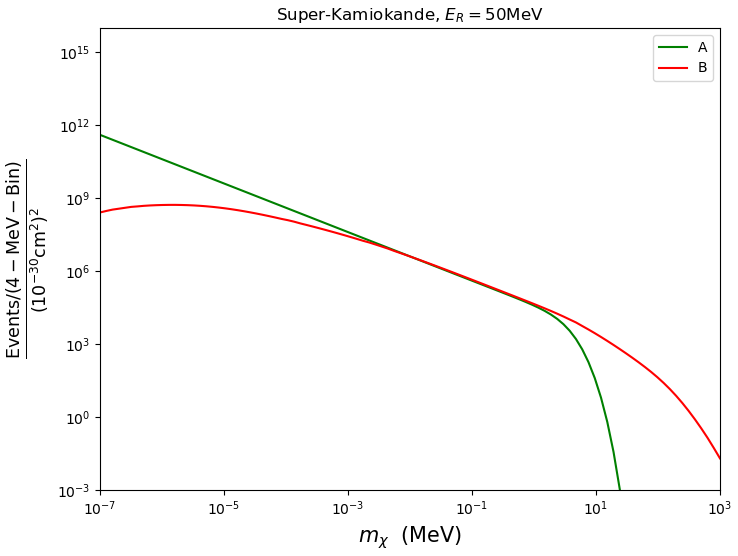
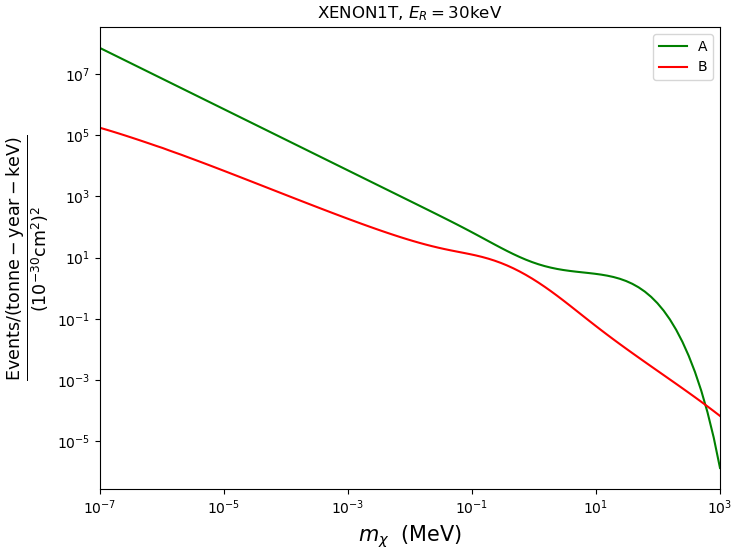
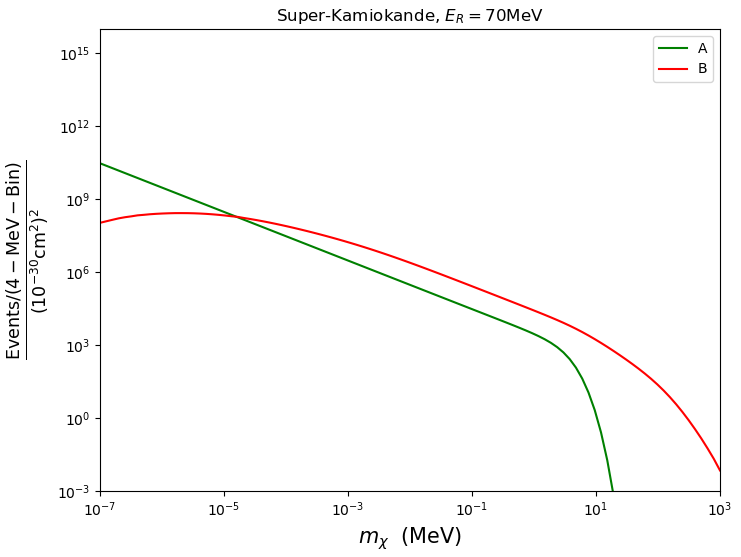
where and are functions of DM mass and electron recoil energy. In Fig. 4, the coefficients A and B of Eq. 15 have been plotted as a function of the recoil energy for three different DM masses, for both the experiments, XENON1T (left panel) and Super-Kamiokande (right panel). In Fig. 5, on the other hand, variations in A and B are shown as a function of the DM mass for three different recoil energies. As it can be noticed from Fig. 4, for sub-MeV DM mass regime, dominates over . Thus, the right side of Eq. 15 gets most of the contribution from the term. This implies, for that mass range, the boost due to the scattering with DSNB neutrinos play the dominant role. This will also be clear in the next section.
V analysis
To find the best-fit point and the exclusion region, we perform a analysis using the following definitions
| (18) | |||||
| (19) |
where, are the observed number of events, are the expected number of events and is uncertainty in the measured data. For the case, to calculate the values, we sum the BDM signal and the background for each energy bin.
Xenon1T
The XENON1T experiment is operated using a dual-phase liquid-xenon time projection chamber. The detector is capable of producing both prompt scintillation (S1) and delayed electroluminescence (S2) signals. The S2/S1 ratio is further used to distinguish electronic recoils from nuclear recoils. The XENON collaboration, last year, reported a excess of events in the electron recoil range of with 285 events over the backgrounds of events. This data was acquired in total 277 days of live-time, which is referred to as Science Run 1 (SR1) Aprile et al. (2018, 2020b). We use this data for the analysis to obtain the best-fit point as well as the exclusion region in () plane. In Fig. 6, we have shown the SR1 data (in red) along with the predicted background (in blue). The expected no.of events from boosted DM for the best-fit point along with the corresponding total number of events including the background are also shown.
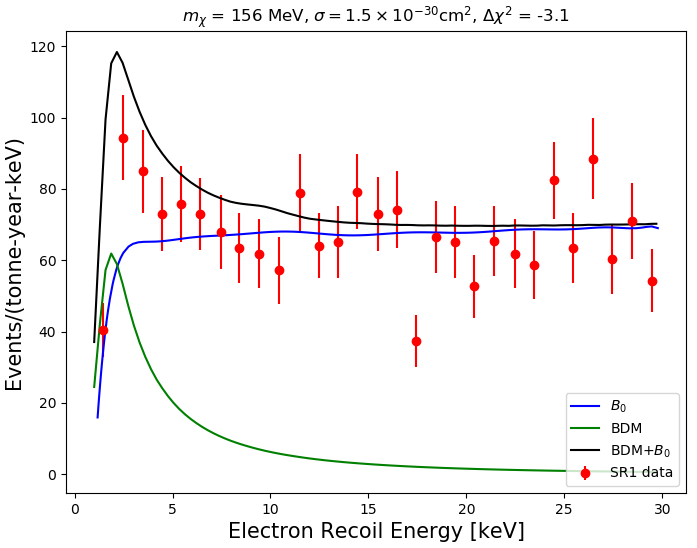
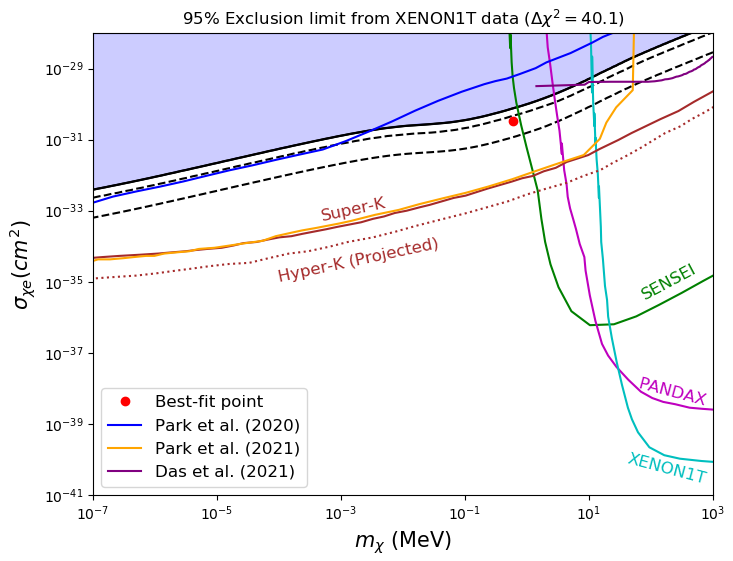
As it is evident from Fig. 6, the expected background () can not explain the SR1 data. We estimated to be . Clearly, if the BDM contribution explains SR1 data, must be less than commensurate with a better fit. To derive the exclusion limit with the 95% confidence, we demand that corresponds to 27 degrees of freedom. We present the obtained exclusion region in the plane assuming in Fig. 7. Our results agree very well with the one presented in Jho et al. (2020) providing a good cross-check of our analysis. The best-fit point marked with red is given by corresponding to . The constraints from various experiments searching for light cold DM such as SENSEI Barak et al. (2020), PANDAX II Cheng et al. (2021), XENON1T Aprile et al. (2019) are also shown for comparison. The results of Ref. Jho et al. (2020) and Ref. Cappiello and Beacom (2019), which derive limits on CRe boosted DM from XENON1T and Super-K data respectively, are also given.
Further, we explore the scenario where and assume the flux of DSNB neutrinos is the sole contributor to the DM boost i.e., in Eq.(15). To do this, we repeat the above analysis and obtain a bound on as a function of DM mass. The results are shown in Fig. 8 and we compare these with the results of Ref. Das and Sen (2021) which is analogous to the considered case and of Ref. Jho et al. (2021) in which stellar neutrinos instead of DSNB neutrinos, boost the DM. Note that our results are consistent with Ref. Das and Sen (2021) for large values. Also note that XENON1T sets bound for whereas bounds from SN1987A on new particles that have feeble interactions with electrons in addition to stronger-than-weak interactions with neutrinos allows Boehm et al. (2013); Bertoni et al. (2015)111We thank anonymous referee for pointing out these bounds. Therefore, the best-fit point obtained for case is ruled out.
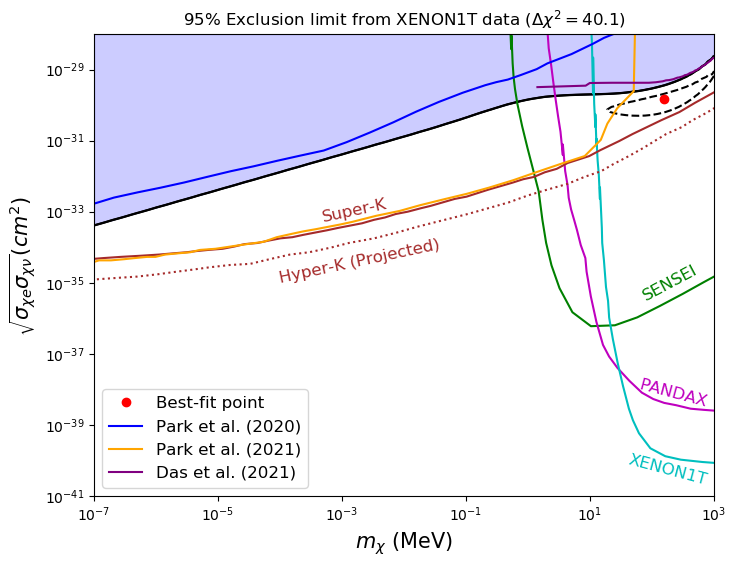
As we mentioned earlier, the flux of DSNB neutrinos is comparable to the flux of CRe in that energy range which provides visible recoil energy due to light DM scattering off electron. Therefore, next, we consider contribution of both the fluxes. We assume and derive the exclusion region, presented in Fig. 9.
Note that the exclusion region in Fig. 7 and Fig. 8 is derived from and term of Eq. 15 respectively. In the current case, both terms are combined to set the exclusion limit. For lighter , term wins over , shown in Fig. 4. Thus, the numbers in Fig. 8 and Fig. 9 are similar.
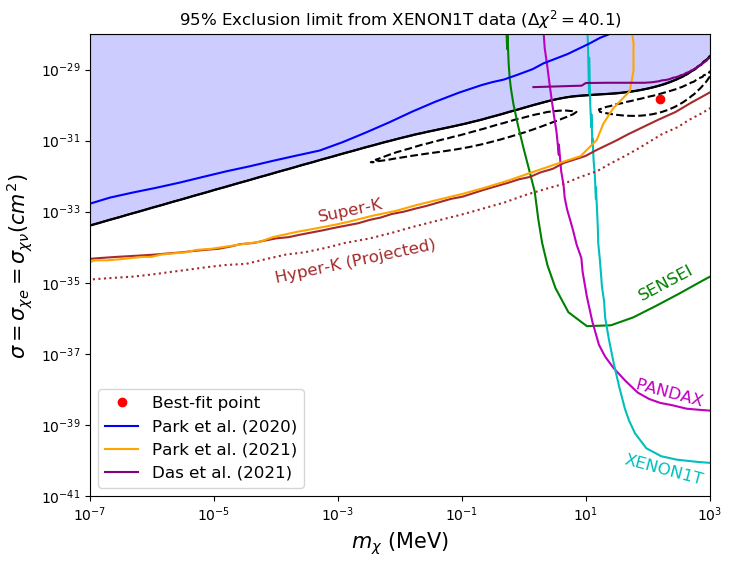
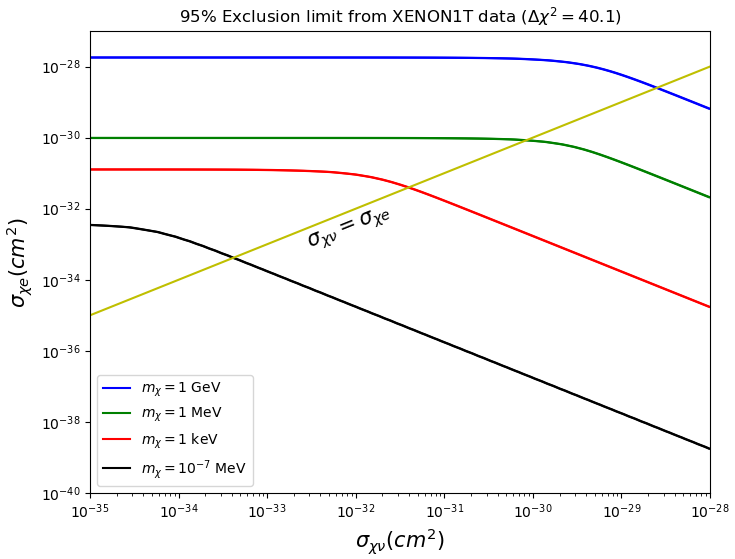
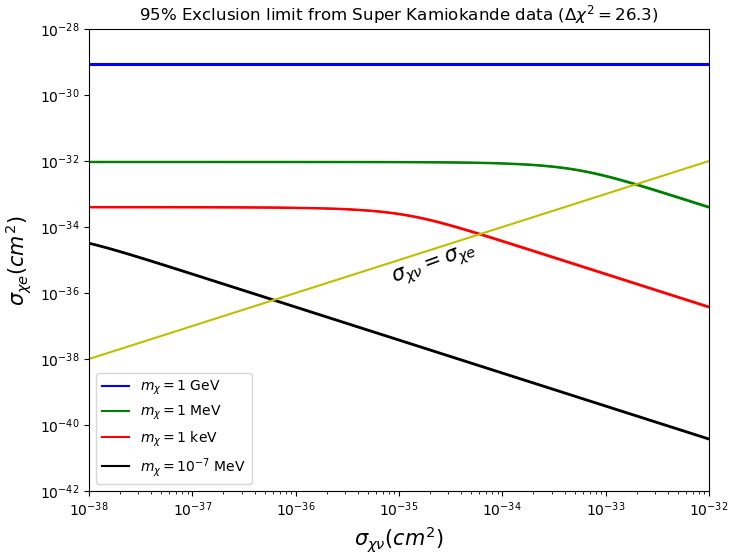
We also present the exclusion contours in plane for different values of in Fig. 10. The region above the lines is excluded at the 95% confidence level. In the regime , the first term in Eq. 15 dominates which implies and thus is the nature of the curve. For , the second term in Eq. 15 dominates and we obtain a contour independent of . Also, area excluded increases with decreasing DM mass because lighter DM is boosted more and hence it is more constrained.
Super Kamiokande
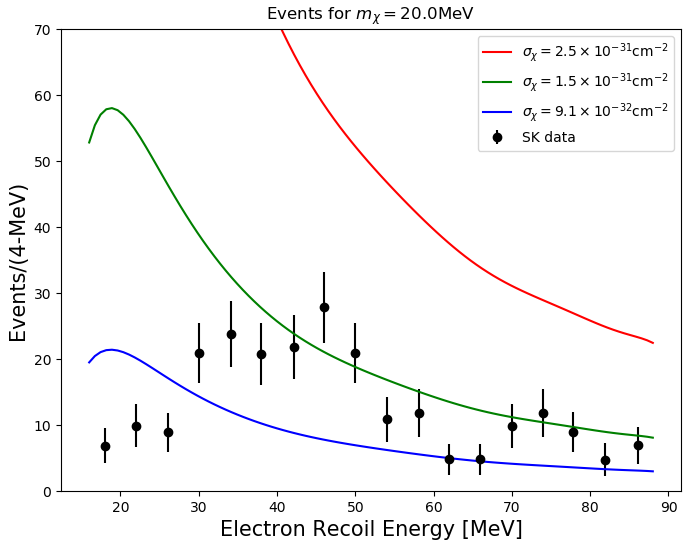
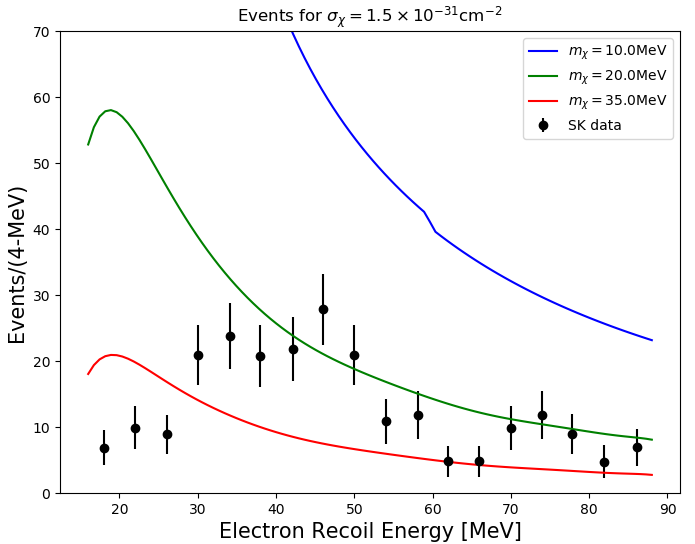
Super-K is a 50 kiloton water Cherenkov detector build at the Kamioka mine in Japan. The data used for this analysis is referred to as the SK-I data, which was taken for total 1497 days of live-time. The detector directly looks for the DSNB events via inverse beta decay . In the present work, we assume that the observed events are consistent with the background and hence the signal due to DM should be consistent with the data within the uncertainity. Since an estimate of the background is not found in the literature (to our knowledge), we take for SK-I data. In Fig. 11, we have shown the SK-I data along with the predicted no. of events for CRe + DSNB boosted DM for different values of . Also shown are BDM-induced recoil spectra for different values of for MeV.
We follow the analysis similar to XENON1T case to obtain the constraints on the parameter space. We, first, consider the scenario when and present the results in Fig. 12. Here, the excluded region satisfies which corresponds to exclusion limit for 16 degrees of freedom. As it is evident from Fig. 12, our results agree very well with that of Ref. Cappiello and Beacom (2019).
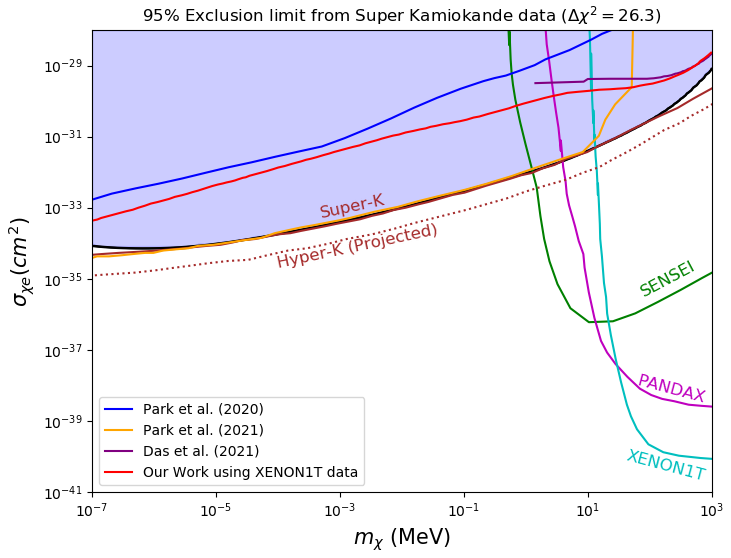
In Fig. 13, we show the exclusion region assuming in Eq.(15) or the flux of DSNB neutrinos is the only contributor to the DM boost. To best of our knowledge, there is no previous study where the exclusion limits on are derived using SK-I data. Also, these bounds are stronger than those obtained in earlier studies for different detectors.
It should be noticed that the exclusion region extends beyond 1 GeV in Fig. 12 which correspond to the CRe boosted DM scenario whereas it is limited to 10 MeV in the case of DSNB boosted DM (Fig. 13). This owes to the fact that DSNB flux decline very rapidly for whereas cosmic electron spectra is comparatively significant at larger kinetic energy.
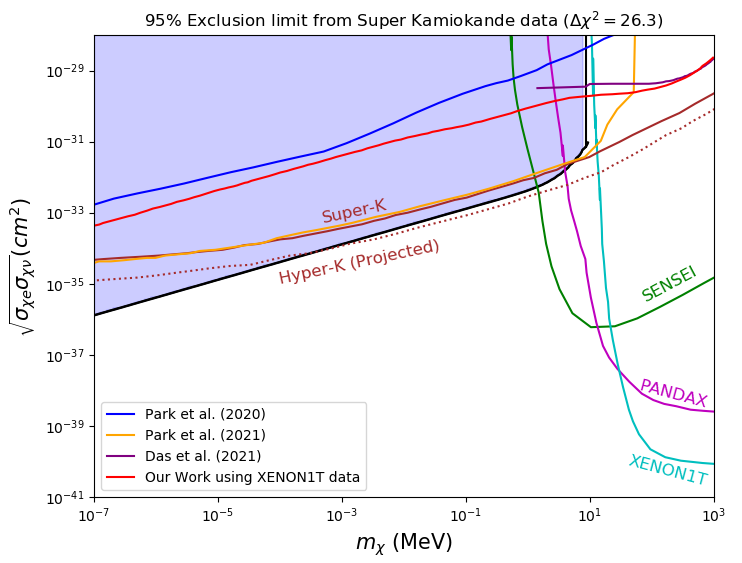
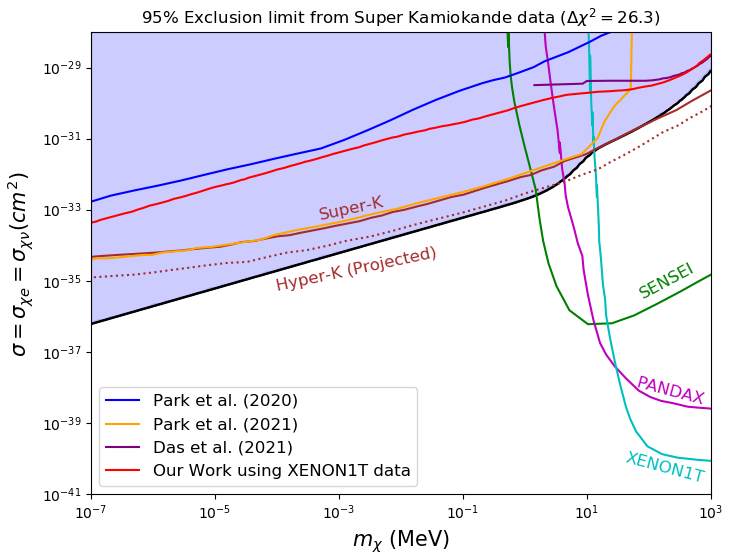
Next, we consider the DSNB + CRe flux which boost the DM and derive the most general exclusion limits. Assuming , we present the exclusion regions and contours in Fig. 14 and Fig. 15 respectively. Note that numbers obtained in this case are comparable to that of Fig. 12 for larger masses whereas are similar to DSNB boosted DM case (Fig. 13) for . To understand this, we follow Fig. 4 for SK I data. We observe that term of Eq. 15 dominates over term for DM of mass less than a few MeV, for . Not only does it dominate in certain energy range, its magnitude is very large. Therefore, bounds obtained in Fig. 14 for replicate the bounds in Fig. 13.
VI Conclusions
In this work, we implemented the idea of boosted DM to set exclusion limits on a combination of DM-electron and DM-neutrino cross-sections for low-mass DM. To register events in the detectors of such DM particle interacting with neutrinos, obviously, we need to assume non-zero interaction strength between DM and the electrons. Therefore we can not ignore the boost due to scattering of DM with CRe while constraining DM-neutrino interactions. Furthermore, we also noted that the flux of the DSNB boosted-DM and the CRe boosted-DM are comparable for light DM in the energy range relevent for XENON1T and Super-Kamiokande. We perform a analysis to obtain novel limits in the plane using XENON1T (a low energy recoil experiment) and Super-K (a high energy recoil experiment) data. We also find the best-fit points explaining the reported excess events by XENON1T collaboration. We systematically study the following cases: (i) cosmic electron boosted DM where only DM-electron interaction is considered, (ii) a scenario where DM particles get boosted only due to their interactions with the neutrinos, and (iii) DM is boosted due to interactions with cosmic electron as well as DSNB. To our knowledge, we are the first to use Super-K data to derive bounds on . We found that Super-Kamiokande, in fact, sets the strongest bound on for , as shown in Fig. 13 and Fig. 14. It should be noted that while the DSNB neutrino contribution dominate the Super-K limits, the stellar neutrino contribution to boosted DM (given in Ref. Jho et al. (2021)) flux can lead to a non-negligible improvement in bounds obtained via XENON1T since it is a low-energy recoil experiment and stellar neutrino flux peaks at energies in keV range. However, we leave a dedicated analysis on CRe+DSNB+Stellar neutrino, a combined effect, for future work.
We believe that large part of the parameter space for light boosted DM could also be probed with other low-energy recoil experiments like SENSEI Barak et al. (2020), CRESST-II Angloher et al. (2016), PandaX Cheng et al. (2021) etc., the experiments which usually probe cold DM. Similarly, it would be interesting to see how other neutrino experiments/detectors like Borexino Bellini et al. (2011), DUNE Acciarri et al. (2015), JUNO An et al. (2016), Hyper-Kamiokande Abe et al. (2018), MiniBooNE Aguilar-Arevalo et al. (2018) could be utilized to rule out the models of boosted DM.
acknowledgments
DG and DS acknowledge support through the Ramanujan Fellowship and MATRICS Grant of the Department of Science and Technology, Government of India. DS has in-part received funding from the European Union’s Horizon 2020 research and innovation programme under grant agreement No 101002846, ERC CoG “CosmoChart“. DG and AG would like to thank Arun Thalapillil for discussions at the early stage of the work. A.G. acknowledges support from the National Research Foundation of Korea (NRF-2019R1C1C1005073). A.G. also wants to thank Jong-Chul Park for useful discussions.
References
- Bauer and Plehn (2019) M. Bauer and T. Plehn, Yet Another Introduction to Dark Matter: The Particle Physics Approach, Lecture Notes in Physics, Vol. 959 (Springer, 2019) arXiv:1705.01987 [hep-ph] .
- Bertone et al. (2005) G. Bertone, D. Hooper, and J. Silk, Phys. Rept. 405, 279 (2005), arXiv:hep-ph/0404175 .
- Lisanti (2017) M. Lisanti, in Theoretical Advanced Study Institute in Elementary Particle Physics: New Frontiers in Fields and Strings (2017) pp. 399–446, arXiv:1603.03797 [hep-ph] .
- Profumo (2013) S. Profumo, in Theoretical Advanced Study Institute in Elementary Particle Physics: Searching for New Physics at Small and Large Scales (2013) pp. 143–189, arXiv:1301.0952 [hep-ph] .
- Aprile et al. (2020a) E. Aprile et al. (XENON), Eur. Phys. J. C 80, 785 (2020a), arXiv:2003.03825 [physics.ins-det] .
- Aprile et al. (2020b) E. Aprile et al. (XENON), Phys. Rev. D 102, 072004 (2020b), arXiv:2006.09721 [hep-ex] .
- Crisler et al. (2018) M. Crisler, R. Essig, J. Estrada, G. Fernandez, J. Tiffenberg, M. Sofo haro, T. Volansky, and T.-T. Yu (SENSEI), Phys. Rev. Lett. 121, 061803 (2018), arXiv:1804.00088 [hep-ex] .
- Angloher et al. (2016) G. Angloher et al. (CRESST), Eur. Phys. J. C 76, 25 (2016), arXiv:1509.01515 [astro-ph.CO] .
- Agnes et al. (2018) P. Agnes et al. (DarkSide), Phys. Rev. Lett. 121, 111303 (2018), arXiv:1802.06998 [astro-ph.CO] .
- Aprile et al. (2016) E. Aprile et al. (XENON), JCAP 04, 027 (2016), arXiv:1512.07501 [physics.ins-det] .
- Essig et al. (2012) R. Essig, A. Manalaysay, J. Mardon, P. Sorensen, and T. Volansky, Phys. Rev. Lett. 109, 021301 (2012), arXiv:1206.2644 [astro-ph.CO] .
- Abramoff et al. (2019) O. Abramoff et al. (SENSEI), Phys. Rev. Lett. 122, 161801 (2019), arXiv:1901.10478 [hep-ex] .
- Baryakhtar et al. (2017) M. Baryakhtar, J. Bramante, S. W. Li, T. Linden, and N. Raj, Phys. Rev. Lett. 119, 131801 (2017), arXiv:1704.01577 [hep-ph] .
- Dasgupta et al. (2019) B. Dasgupta, A. Gupta, and A. Ray, JCAP 08, 018 (2019), arXiv:1906.04204 [hep-ph] .
- Bose et al. (2021) D. Bose, T. N. Maity, and T. S. Ray, (2021), arXiv:2108.12420 [hep-ph] .
- Guha and Sen (2021) A. Guha and D. Sen, JCAP 09, 027 (2021), arXiv:2106.10353 [hep-ph] .
- Sen and Guha (2021) D. Sen and A. Guha, Mon. Not. Roy. Astron. Soc. 504, 3 (2021), arXiv:2104.06141 [hep-ph] .
- Acevedo et al. (2021) J. F. Acevedo, J. Bramante, A. Goodman, J. Kopp, and T. Opferkuch, JCAP 04, 026 (2021), arXiv:2012.09176 [hep-ph] .
- Leane and Smirnov (2021) R. K. Leane and J. Smirnov, Phys. Rev. Lett. 126, 161101 (2021), arXiv:2010.00015 [hep-ph] .
- Garani et al. (2021) R. Garani, A. Gupta, and N. Raj, Phys. Rev. D 103, 043019 (2021), arXiv:2009.10728 [hep-ph] .
- Joglekar et al. (2020a) A. Joglekar, N. Raj, P. Tanedo, and H.-B. Yu, Phys. Rev. D 102, 123002 (2020a), arXiv:2004.09539 [hep-ph] .
- Joglekar et al. (2020b) A. Joglekar, N. Raj, P. Tanedo, and H.-B. Yu, Phys. Lett. B, 135767 (2020b), arXiv:1911.13293 [hep-ph] .
- Green and Rajendran (2017) D. Green and S. Rajendran, JHEP 10, 013 (2017), arXiv:1701.08750 [hep-ph] .
- Baumann et al. (2016) D. Baumann, D. Green, and B. Wallisch, Phys. Rev. Lett. 117, 171301 (2016), arXiv:1604.08614 [astro-ph.CO] .
- Krnjaic and McDermott (2020) G. Krnjaic and S. D. McDermott, Phys. Rev. D 101, 123022 (2020), arXiv:1908.00007 [hep-ph] .
- McKeen et al. (2020) D. McKeen, M. Pospelov, and N. Raj, Phys. Rev. Lett. 125, 231803 (2020), arXiv:2006.15140 [hep-ph] .
- Raffelt (2008) G. G. Raffelt, Lect. Notes Phys. 741, 51 (2008), arXiv:hep-ph/0611350 .
- Raffelt (1999) G. G. Raffelt, Ann. Rev. Nucl. Part. Sci. 49, 163 (1999), arXiv:hep-ph/9903472 .
- Kadota and Silk (2014) K. Kadota and J. Silk, Phys. Rev. D 89, 103528 (2014), arXiv:1402.7295 [hep-ph] .
- Dreiner et al. (2014) H. K. Dreiner, J.-F. Fortin, C. Hanhart, and L. Ubaldi, Phys. Rev. D 89, 105015 (2014), arXiv:1310.3826 [hep-ph] .
- Guha et al. (2019) A. Guha, P. S. B. Dev, and P. K. Das, JCAP 02, 032 (2019), arXiv:1810.00399 [hep-ph] .
- Bai and Rajaraman (2011) Y. Bai and A. Rajaraman, (2011), arXiv:1109.6009 [hep-ph] .
- Cohen et al. (2015) T. Cohen, M. Lisanti, and H. K. Lou, Phys. Rev. Lett. 115, 171804 (2015), arXiv:1503.00009 [hep-ph] .
- Ali-Haïmoud (2021) Y. Ali-Haïmoud, Phys. Rev. D 103, 043541 (2021), arXiv:2101.04070 [astro-ph.CO] .
- Nguyen et al. (2021) D. Nguyen, D. Sarnaaik, K. K. Boddy, E. O. Nadler, and V. Gluscevic, (2021), arXiv:2107.12380 [astro-ph.CO] .
- Wilkinson et al. (2014) R. J. Wilkinson, C. Boehm, and J. Lesgourgues, JCAP 05, 011 (2014), arXiv:1401.7597 [astro-ph.CO] .
- Brune and Päs (2019) T. Brune and H. Päs, Phys. Rev. D 99, 096005 (2019), arXiv:1808.08158 [hep-ph] .
- Blennow et al. (2019) M. Blennow, E. Fernandez-Martinez, A. Olivares-Del Campo, S. Pascoli, S. Rosauro-Alcaraz, and A. V. Titov, Eur. Phys. J. C 79, 555 (2019), arXiv:1903.00006 [hep-ph] .
- Bringmann and Pospelov (2019) T. Bringmann and M. Pospelov, Phys. Rev. Lett. 122, 171801 (2019), arXiv:1810.10543 [hep-ph] .
- Cappiello et al. (2019) C. V. Cappiello, K. C. Y. Ng, and J. F. Beacom, Phys. Rev. D 99, 063004 (2019), arXiv:1810.07705 [hep-ph] .
- Cappiello and Beacom (2019) C. V. Cappiello and J. F. Beacom, Phys. Rev. D 100, 103011 (2019), [Erratum: Phys.Rev.D 104, 069901 (2021)], arXiv:1906.11283 [hep-ph] .
- Ema et al. (2019) Y. Ema, F. Sala, and R. Sato, Phys. Rev. Lett. 122, 181802 (2019), arXiv:1811.00520 [hep-ph] .
- Dent et al. (2021) J. B. Dent, B. Dutta, J. L. Newstead, I. M. Shoemaker, and N. T. Arellano, Phys. Rev. D 103, 095015 (2021), arXiv:2010.09749 [hep-ph] .
- Jho et al. (2020) Y. Jho, J.-C. Park, S. C. Park, and P.-Y. Tseng, Phys. Lett. B 811, 135863 (2020), arXiv:2006.13910 [hep-ph] .
- Bramante et al. (2021) J. Bramante, B. J. Kavanagh, and N. Raj, (2021), arXiv:2109.04582 [hep-ph] .
- Farzan and Palomares-Ruiz (2014) Y. Farzan and S. Palomares-Ruiz, JCAP 06, 014 (2014), arXiv:1401.7019 [hep-ph] .
- Argüelles et al. (2017) C. A. Argüelles, A. Kheirandish, and A. C. Vincent, Phys. Rev. Lett. 119, 201801 (2017), arXiv:1703.00451 [hep-ph] .
- Yin (2019) W. Yin, EPJ Web Conf. 208, 04003 (2019), arXiv:1809.08610 [hep-ph] .
- Jho et al. (2021) Y. Jho, J.-C. Park, S. C. Park, and P.-Y. Tseng, (2021), arXiv:2101.11262 [hep-ph] .
- Das and Sen (2021) A. Das and M. Sen, (2021), arXiv:2104.00027 [hep-ph] .
- Bays et al. (2012) K. Bays et al. (Super-Kamiokande), Phys. Rev. D 85, 052007 (2012), arXiv:1111.5031 [hep-ex] .
- Boschini et al. (2018) M. J. Boschini et al., Astrophys. J. 854, 94 (2018), arXiv:1801.04059 [astro-ph.HE] .
- Ackermann et al. (2012) M. Ackermann et al. (Fermi-LAT), Phys. Rev. Lett. 108, 011103 (2012), arXiv:1109.0521 [astro-ph.HE] .
- Abdo et al. (2009) A. A. Abdo et al. (Fermi-LAT), Phys. Rev. Lett. 102, 181101 (2009), arXiv:0905.0025 [astro-ph.HE] .
- Ackermann et al. (2010) M. Ackermann et al. (Fermi-LAT), Phys. Rev. D 82, 092004 (2010), arXiv:1008.3999 [astro-ph.HE] .
- Abdollahi et al. (2017) S. Abdollahi et al. (Fermi-LAT), Phys. Rev. D 95, 082007 (2017), arXiv:1704.07195 [astro-ph.HE] .
- Aguilar et al. (2014) M. Aguilar et al. (AMS), Phys. Rev. Lett. 113, 221102 (2014).
- Adriani et al. (2011) O. Adriani et al. (PAMELA), Phys. Rev. Lett. 106, 201101 (2011), arXiv:1103.2880 [astro-ph.HE] .
- Adriani et al. (2017) O. Adriani et al. (CALET), Phys. Rev. Lett. 119, 181101 (2017), arXiv:1712.01711 [astro-ph.HE] .
- Cummings et al. (2016) A. C. Cummings, E. C. Stone, B. C. Heikkila, N. Lal, W. R. Webber, G. Jóhannesson, I. V. Moskalenko, E. Orlando, and T. A. Porter, Astrophys. J. 831, 18 (2016).
- Stone et al. (2013) E. C. Stone, A. C. Cummings, F. B. McDonald, B. C. Heikkila, N. Lal, and W. R. Webber, Science 341, 150 (2013).
- Beacom (2010) J. F. Beacom, Ann. Rev. Nucl. Part. Sci. 60, 439 (2010), arXiv:1004.3311 [astro-ph.HE] .
- Horiuchi et al. (2009) S. Horiuchi, J. F. Beacom, and E. Dwek, Phys. Rev. D 79, 083013 (2009), arXiv:0812.3157 [astro-ph] .
- Lunardini (2016) C. Lunardini, Astropart. Phys. 79, 49 (2016), arXiv:1007.3252 [astro-ph.CO] .
- Zhang et al. (2015) H. Zhang et al. (Super-Kamiokande), Astropart. Phys. 60, 41 (2015), arXiv:1311.3738 [hep-ex] .
- Aghanim et al. (2020) N. Aghanim et al. (Planck), Astron. Astrophys. 641, A6 (2020), [Erratum: Astron.Astrophys. 652, C4 (2021)], arXiv:1807.06209 [astro-ph.CO] .
- Aprile et al. (2018) E. Aprile et al. (XENON), Phys. Rev. Lett. 121, 111302 (2018), arXiv:1805.12562 [astro-ph.CO] .
- Barak et al. (2020) L. Barak et al. (SENSEI), Phys. Rev. Lett. 125, 171802 (2020), arXiv:2004.11378 [astro-ph.CO] .
- Cheng et al. (2021) C. Cheng et al. (PandaX-II), Phys. Rev. Lett. 126, 211803 (2021), arXiv:2101.07479 [hep-ex] .
- Aprile et al. (2019) E. Aprile et al. (XENON), Phys. Rev. Lett. 123, 251801 (2019), arXiv:1907.11485 [hep-ex] .
- Boehm et al. (2013) C. Boehm, M. J. Dolan, and C. McCabe, JCAP 08, 041 (2013), arXiv:1303.6270 [hep-ph] .
- Bertoni et al. (2015) B. Bertoni, S. Ipek, D. McKeen, and A. E. Nelson, JHEP 04, 170 (2015), arXiv:1412.3113 [hep-ph] .
- Bellini et al. (2011) G. Bellini et al., Phys. Rev. Lett. 107, 141302 (2011), arXiv:1104.1816 [hep-ex] .
- Acciarri et al. (2015) R. Acciarri et al. (DUNE), (2015), arXiv:1512.06148 [physics.ins-det] .
- An et al. (2016) F. An et al. (JUNO), J. Phys. G 43, 030401 (2016), arXiv:1507.05613 [physics.ins-det] .
- Abe et al. (2018) K. Abe et al. (Hyper-Kamiokande), PTEP 2018, 063C01 (2018), arXiv:1611.06118 [hep-ex] .
- Aguilar-Arevalo et al. (2018) A. A. Aguilar-Arevalo et al. (MiniBooNE DM), Phys. Rev. D 98, 112004 (2018), arXiv:1807.06137 [hep-ex] .