Modeling Interactions of Autonomous Vehicles and Pedestrians with Deep Multi-Agent Reinforcement Learning for Collision Avoidance
Abstract
Reliable pedestrian crash avoidance mitigation (PCAM) systems are crucial components of safe autonomous vehicles (AVs). The nature of the vehicle-pedestrian interaction where decisions of one agent directly affect the other agent’s optimal behavior, and vice versa, is a challenging yet often neglected aspect of such systems. We address this issue by modeling a Markov decision process (MDP) for a simulated AV-pedestrian interaction at an unmarked crosswalk. The AV’s PCAM decision policy is learned through deep reinforcement learning (DRL). Since modeling pedestrians realistically is challenging, we compare two levels of intelligent pedestrian behavior. While the baseline model follows a predefined strategy, our advanced pedestrian model is defined as a second DRL agent. This model captures continuous learning and the uncertainty inherent in human behavior, making the AV-pedestrian interaction a deep multi-agent reinforcement learning (DMARL) problem. We benchmark the developed PCAM systems according to the collision rate and the resulting traffic flow efficiency with a focus on the influence of observation uncertainty on the decision-making of the agents. The results show that the AV is able to completely mitigate collisions under the majority of the investigated conditions and that the DRL pedestrian model learns an intelligent crossing behavior.
I Introduction
While the advent of modern artificial intelligence (AI)-based methods holds promise to solve many problems in autonomous driving (AD), e.g., the perception of the vehicle’s environment through AI-based computer vision, decision making in safety-relevant driving situations remains challenging. Particularly critical situations are vehicle-pedestrian interactions where the vehicle is moving forward on a collision path with a pedestrian attempting to cross a street.
According to a study by the Insurance Institute for Highway Safety [1], there were around 330,000 crashes involving pedestrians between 2005 and 2009 in the U.S. with 224,000 cases related to situations where the pedestrian was hit by the front of a car; pedestrians were crossing a street in 95 % of these accidents. Modern cars are equipped with pedestrian crash avoidance mitigation (PCAM) systems to avoid such collisions, making them a crucial component of future autonomous vehicles (AVs). In [2], a modern PCAM system is developed on the basis of reachability analysis in conjunction with a situation-aware trajectory planner. This method necessitates the use of a reliable dynamic model for the movement of the pedestrian posing real-world challenges and neglecting the simultaneous decision-making processes of the AV and the pedestrian. Deep reinforcement learning (DRL) offers the possibility to reflect that the AV ’s action directly influences the pedestrian’s reaction, and vice versa. After successful applications in game-related environments [3], recent research interest is shifting to real-world applications as DRL methods offer attractive generalization ability without the need for prior domain information.
The study of Chae et al. [4] is the first publication in which a DRL-based PCAM system was developed. Although successfully preventing collisions, the AV agent is limited to braking actions which neglects that controlled acceleration can also help to prevent dangerous situations. In a broader sense, Papini et al. [5] extend the work of Chae et al. by proposing a DRL-based system which restricts an AV agent by a learned speed limit. This limit ensures that a collision can always be prevented when a distracted pedestrian decides to cross. In [6], a grid-based state representation is proposed that allows the PCAM system to account for multiple pedestrians simultaneously. While the trained agent is evaluated in CARLA and its advantages are discussed, the system’s real-world applicability remains open as the influence of uncertainty, e.g., measurement noise and random pedestrian behavior, is not reflected. We address this challenge in our work by conducting an extensive study on the influence of uncertainty on the agents’ performance. The recent work of Deshpande et al. [7] introduces multi-objective DRL to the interaction of AVs with pedestrians but focuses more on the navigation of the AV than the pedestrian crossing decision. A general overview of DRL in AD can be found in [8].
Crucially, the mentioned previous works only use simple pedestrian models that raise the question of how realistic the crossing decisions of the pedestrians in the proposed systems are. Behavioral research provides some clues as to what factors influence pedestrians’ crossing decisions. In general, the time-to-collision (TTC) value is a key indicator [9]. A typical limit is a TTC value of less than 3s, which makes it unlikely for pedestrians to attempt a crossing [10]. While this property is often used to model pedestrian behavior, it is necessary to also consider the social aspects of AD. Millard-Ball [11] refers to a situation which he calls crosswalk chicken: As pedestrians know that AVs will stop if necessary, they perceive a low level of risk and cross more recklessly.
We propose a new perspective on modeling pedestrian crossing behavior by developing an AV PCAM system through a deep multi-agent reinforcement learning (DMARL)-based solution that exploits the continued interaction of two independent, learning agents. In this approach, the PCAM policy is optimized while the pedestrian learns to cross the street safely at the same time. Additionally, the following contributions are made in this work:
-
•
The proposed PCAM system’s driving capability is extended beyond similar works with the AV’s action space to include braking and acceleration actions; no additional local trajectory planer is needed.
-
•
We introduce several pedestrian models of different intelligence levels, i.e., we compare DRL and DMARL settings to evaluate the influence of a learning pedestrian model on the behavior of the AV.
-
•
An extensive study on the influence of observation noise on the agents’ performance is conducted, and a behavioral analysis shows the robustness of the developed algorithms in the face of uncertainty.
-
•
Our approach is generalized over different scenarios with varying values of the initial TTC value, street width, and pedestrian walking speed.
II System Model
The proposed PCAM system is developed in a simulated driving scenario of an AV facing a single pedestrian at an unmarked crosswalk. Note that a large number of crosswalks are unmarked; studies [12] found no links between increased pedestrian safety and marked crosswalks. There is no priority given to the pedestrian in our scenario and we neglect the presence of other road users. The heterogeneous agents are described as follows:
-
•
AV: Vehicle with fully autonomous driving capabilities (level-5); equipped with high-quality sensors, i.e., measurement noise is reduced to minimal levels. Properties of the AV are labeled by superscript .
-
•
Pedestrian: Attempts to cross the street from the left or right sidewalk with state estimations of limited reliability accounting for variability in human perception. Superscript marks the pedestrian’s variables.
One AV-pedestrian interaction episode is over after time steps, where the time horizon is discretized into equal time slots of length seconds. We define the simulation in 2D-space, i.e., the AV’s position is and is the pedestrian’s position, respectively. When an episode starts, the AV is facing the crosswalk in front and is positioned at the middle of the right lane of a two-lane street of width . Its velocity is a single component in the vehicle’s longitudinal direction. The pedestrian attempts to cross either from the left or the right sidewalk with walking speed ; its initial distance to the curb is . When the AV has passed the crosswalk by a distance of , the vehicle’s goal position is reached. The pedestrian’s episode is over when its position is at a safety distance of from the street as visualized in Figure 1.
A collision is defined as the event when the pedestrian, simulated as a point with no dimensions, is inside of the collision area of the vehicle which is the AV’s dimension plus an additional safety margin around all sides of the AV. The inequality
| (1) |
is fulfilled in case of a collision. Note that we calculate the TTC value from the AV’s center point to the pedestrian’s position for simplicity, i.e., a collision can occur at a TTC value marginally larger than zero.
To describe a realistic scenario, measurement noise disturbs the agents’ observations according to a multiplicative noise model. Let be the true state signal, then the observation function is described by
| (2) |
with as the disturbed state observation, and as the realization of the random noise variable which follows a Gaussian distribution . As we later investigate several scenarios with different scales of , the definition of (2) is advantageous since it introduces similar levels of uncertainty among sensor signals of different scale through the single choice of .
As any collision of an AV with a pedestrian is considered to be unacceptable in reality, we use the collision rate as the main performance measure. Both agents also act self-interested with the motivation to reach their goal position as quickly as possible. This property is reflected by the second performance indicator traffic flow efficiency, which describes the average duration of an AV-pedestrian interaction episode. This description is formalized by the utility function
| (3) |
of each agent with . and describe the time required by the respective agent to reach its goal position. The optimization problem with respect to the trajectory of joint actions over steps is then given by
| (4) |
III Methodology
III-A Scenarios
We investigate the effects of modeling the behavior of the street-crossing pedestrian differently by considering the following agents characterized by their level of intelligence:
-
•
Level-1 describes rationally acting agents. They can adapt their behavior by perceiving their environment continuously but follow a predefined strategy.
-
•
Agents of level-2 can learn from their experiences, behave rationally, and explore new strategies.
We use these levels to define several settings for the AV’s PCAM system using DRL and DMARL, respectively. Detailed descriptions of the pedestrian and AV models follow in subsection III-B and subsection III-C.
III-A1 Setting-1
The level-1 pedestrian model is evaluated in conjunction with a learning AV agent of level-2 in a partially observable Markov decision process (POMDP) (see subsubsection III-D1) system formulation. Most publications (e.g., [6]) up to now have only considered this setting.
III-A2 Setting-2
Instead of relying on predefined policies, we use a learning agent of level-2 to model the pedestrian. Since the AV is also implemented as a DRL agent, the system is now a multi-agent system (MAS) modeled as a partially observable Markov game (POMG) (see subsubsection III-D2). To the authors’ best knowledge, this is the first approach to use DMARL in the context of vehicle-pedestrian interactions. The proposed MAS features heterogeneous agents acting in a semi-cooperative manner to prevent collisions, but they also aim to fulfill their individual objective of reaching their respective goal position. There is no direct communication between agents, but indirect communication via specific actions or behavior signals might be learned.
III-A3 Setting-X
Another setting is introduced for benchmarking the DRL and DMARL-based approaches by defining both the pedestrian and the AV as level-1 agents.
III-B Pedestrian Models
III-B1 Level-1
To resemble a basic but rational human crossing behavior [10], we define a pedestrian policy which evaluates the TTC value at each time step according to
| (5) |
Once the pedestrian decides to take action to walk, the walking speed is kept until the pedestrian’s goal state is reached. Note that the agent will also start walking when the AV has passed the crossing by 4m.
III-B2 Level-2
The learning pedestrian is a DRL agent based on a deep Q-network (DQN) (see subsection III-E). The pedestrian’s state at time is defined as the vector
| (6) |
with nine components described as follows:
-
•
represents the current TTC value
-
•
is the pedestrian’s current absolute velocity
-
•
is the pedestrian’s constant absolute walking speed once the agent decides to start walking
-
•
describes the absolute velocity of the AV
-
•
is the absolute acceleration of the AV
-
•
measures the two-dimensional position of the pedestrian relative to the AV’s center point
-
•
is defined as the remaining crossing distance for the pedestrian to reach its goal position
-
•
is the width of the street
-
•
indicates from which street side the pedestrian will start crossing.
The state is an element of the state space , while the discrete actions space allows for two choices:
| (7) |
When the pedestrian decides to walk at time , its velocity at the next time step is set to . The pedestrian’s reward function with the reward is based on
| (8) |
The first term penalizes each time step taken; we set . If a collision occurs, a penalty of is added. While it is important to keep a balance between the two penalty terms, the choice of absolute values is justified empirically with the aim to minimize training instabilities. In summary, the pedestrian’s goal is to reach the other street side as quickly as possible without risking a collision.
III-C AV Models
III-C1 Level-1
Derived from a best response analysis, the AV’s best velocity is calculated at time according to
| (9) |
with as the pedestrian’s theoretical crossing duration. The longitudinal distance from the AV’s front to the pedestrian is given by . As it is not possible to set in the simulation directly due to the AV’s dynamic model, an acceleration value with is set to reach in minimal time instead. The list of the possible, discrete acceleration values is given by the action space with
| (10) |
III-C2 Level-2
This model of the AV uses the DQN algorithm to enable the agent to learn from interaction with its environment. The AV’s state at time is element of the state space , and the components of form a vector
| (11) |
See subsubsection III-B2 for a description of these components. The AV’s action space is equivalent to (10); its reward function with reward is described by
| (12) | ||||
At each time step, the constant penalty is given; is the collision penalty. The speed penalty is subtracted when the AV drives faster than the speed limit . The intention in this context is that the AV should learn to follow the traffic rules but the possibility to pass the speed limit should be given in emergency situations.
III-D System Formulation
III-D1 Partially observable Markov decision process
For the DRL case in setting-1, we define a POMDP with tuple as follows:
-
•
States , see (11), are elements of a state space .
-
•
Due to the partial observability of the states, the AV observes which is described by the observation function according to (2) instead of .
-
•
is the action space of the AV as introduced in (10).
-
•
is the state transition function defined by the mapping of the current state to the probability of transitioning to the next state .
-
•
Based on the reward function presented in (12), the AV receives the scalar reward .
-
•
The discount factor is used to weigh the importance of immediate to future rewards.
III-D2 Partially observable Markov game
The system formulation as a POMDP is not sufficient for the DMARL approach in setting-2. Therefore, we introduce a POMG for the agents which is described by the tuple with following components:
- •
-
•
The observation function , see (2), defines the observations of the AV as and for the pedestrian.
- •
-
•
is the joint state transition function with mapping the current joint state to the probability of the next state taking action .
- •
-
•
The same discount factor is introduced for all agents.
III-E Deep Q-Networks
All DRL agents in this work are modeled by DQNs. As introduced in [3], a DQN is an off-policy method using a neural network (NN) to learn the Q-function of an optimization problem iteratively. An enhanced version, called double deep Q-network (DDQN) [13], has the training target
| (13) |
which decouples the action selection and evaluation. are the trainable parameters at training step of the target network, the parameters of the decision network, respectively. The action of the next time step in (13) is given through
| (14) |
A sampling-based strategy is used in practice to estimate the error between the bootstrapped target and the prediction over a batch of training samples. The experience replay buffer is a data container storing the last experience . To update , a batch of experiences are randomly sampled from , the loss between predictions and targets calculated, and updated by gradient descent. For inference, the agent’s behavioral policy is obtained by means of the greedy policy
| (15) |
and an -greedy policy is used for exploration: At each time step , a random action is chosen with probability ; we decrease exponentially. Early results in this work have shown that the AV’s unbalanced action space, i.e., the deceleration values are higher than the acceleration values (causing the AV to stand still in expectation with initially uniformly random actions after a finite number of time steps), introduces instability into the learning process. We overcome this issue by moving the probability mass so that acceleration values are selected with higher probability. In our implementation, we improve the DDQN [13] method by using the combined replay buffer [14], multi-step learning [15], and dueling heads [16] extensions. Additionally, gradients larger than 10 are clipped for numerical stability, and the Huber loss is used with a linear slope starting at to calculate the error. The DQN is updated each time step a new experience is generated in our simulation.
The independent learning scheme is used for implementation of the DMARL case: From the perspective of a single agent, the other agent is assumed to be part of the environment, allowing the use of the single-agent DQN method as introduced earlier. This approach harms the assumption of a stationary environment; successful implementation in other works and simplicity motivate the use here.
III-F Simulation Setup
The initial longitudinal velocity of the AV is sampled from a uniform distribution , reflecting the typical velocities driven in urban areas in Germany. The initial TTC value is randomly sampled with , defining the AV’s initial position with a distance to the crossing of . The goal state of the AV is reached when the AV has passed the crosswalk by . We take into account the German speed limit of in urban areas. The pedestrian’s initial street side position depends on a random variable drawn uniformly from . The variability of pedestrians’ walking speed is reflected by selecting uniformly from , representing typical pedestrian walking speeds [17]. A value of is used for the safety margin . Additional variability in the environment is introduced by selecting the street width uniformly from .
A collision occurs when the inequality (1) is fulfilled, we set the collision margin to . Analysis of early results showed that increasing the safety zone to during training leads to a reduction of the collision rate during evaluation. We use this strategy for the training of all level-2 agents. A good trade-off between a reasonable fast control input frequency and high computational costs is achieved by setting the time constant to . Further computational costs associated with simulating potentially non-terminating training episodes are avoided by setting a timeout for the maximal episode duration.
IV Results
For investigation of our proposed pedestrian models, all agents learn over 8,000 episodes with 800 episodes used for exploration (the first 250 episodes are completely random). Regarding the architecture of the DQNs, a fully-connected NN and a replay buffer size of 50,000 experiences is selected; hyperparameters were obtained after a limited parameter search. We use the exact same training settings for the DMARL approach of setting-2 for both agents. When we present results, the median value of 8 complete, independent training runs with different seeds are reported. The deviation between runs is indicated in form of an 80%-confidence interval spanning from the 10%-quantile to the 90%-quantile.
IV-A Performance Evaluation
The effect of uncertainty in form of measurement noise, see (2), is evaluated with a fixed noise level for the AV and over for the pedestrian. We focus on the AV’s response under uncertain pedestrian behavior as the pedestrian’s estimations of its environment are unreliable, i.e., the pedestrian is likely to make a wrong crossing decision.
Figure 2 visualizes the performance of the DRL-based PCAM system in setting-1. It can be seen that the AV learns a flawless behavior without any collision when the pedestrian behavior is certain, i.e., the collision rate at and is . A higher degree of uncertainty increases the collision rate as expected. Remarkably, the AV is still able to mitigate most collisions when the pedestrian acts nearly unpredictably at with a collision rate. Increasing the degree of noise makes the pedestrian more likely to cross leading to a reduced episode duration for the pedestrian. The AV accounts for this difficult-to-predict pedestrian behavior; its episode duration increases by approximately 23% from 4.663s to 5.722s.
The results of the novel DMARL approach with the learning AV and pedestrian models are presented in Figure 3. It is evident that the agents learn in presence of low uncertainty, i.e., and , to avoid collisions completely. The highest median collision rate is obtained at with a rate of 0.125%; the highest upper bound of the collision rate’s confidence interval occurs at with 0.304%. From a noise level of and higher, the agents achieve a reduction in collision rate again despite the higher uncertainty. Analysis of the agents’ behavior shows that this effect is due to the pedestrian who tends to cross the street recklessly, expecting the AV to react to avoid a collision. This situation correlates with the crosswalk chicken problem mentioned in [11] as the pedestrian learns to dominate the AV’s strategy. From the AV’s perspective, it is easier to adapt to this quasi-deterministic policy instead of the pedestrian’s strategies learned at lower noise levels.
For performance comparison, Figure 4 presents the collision rates under uncertainty for the three introduced settings. First, all agents learn to avoid collisions without mistakes for and . While the benchmark case of setting-X shows comparable results, the DRL and DMARL-based settings outperform it for the two highest uncertainty levels. It can be reasoned that these agents are able to learn a noise model implicitly, thereby following a more conservative but safer strategy. Note that the best model at is the PCAM system using DMARL but otherwise the DRL-based approach of setting-1 is superior with respect to the collision rates.
The authors assume that applied to the real world, the DMARL approach would outperform the single-agent PCAM system as the policy is learned in response to a wider range of behaviors.
IV-B Behavior Analysis of Setting-2
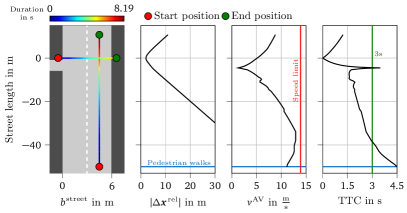
As demonstrated in Figure 5, the AV model learns a policy that reduces the episode duration efficiently while keeping the speed limit and minimizing collisions. Although a real-world validation should be conducted in the future, the authors suspect that there are several situations in which the learning pedestrian model exhibits similarities to real human behavior, e.g., the pedestrian starts walking immediately in cases of a high initial distance of over 45m (see Figure 5). Another discovery is that the pedestrian’s crossing decision is less reckless when starting from the left street side as the distance to the AV’s lane is greater leading to a higher risk.
V Conclusion
We have presented a new PCAM system for AVs, introducing a novel DMARL-based approach to model the vehicle-pedestrian interaction at crosswalks and analyzing the influence of observation uncertainty on the decision-making of the agents. Results show that while the DRL-based approach paired with a deterministic pedestrian model achieves reliable performance over a large spectrum of uncertainty levels, the system using DMARL is exposed to a larger diversity of pedestrian behaviors retaining reliable collision avoidance even under uncertain pedestrian behavior. Subsequent works should validate similarities of the learned pedestrian behavior to real human behavior; our initial analysis indicates similar characteristics. To improve the proposed PCAM system further, a more complex simulator (e.g., CARLA) should be used while extending the scenario to multiple road users. It may also be of interest to improve the independent DMARL training scheme in the future.
References
- [1] J. S. Jermakian and D. S. Zuby, Primary Pedestrian Crash Scenarios: Factors Relevant to the Design of Pedestrian Detection Systems, Insurance Institute for Highway Safety, 2011.
- [2] M. Schratter, M. Hartmann, and D. Watzenig, “Pedestrian collision avoidance system for autonomous vehicles,” SAE International Journal of Connected and Automated Vehicles, vol. 2, no. 4, 2019.
- [3] V. Mnih, K. Kavukcuoglu, D. Silver, A. A. Rusu, J. Veness, M. G. Bellemare, A. Graves, M. Riedmiller, A. K. Fidjeland, G. Ostrovski et al., “Human-level control through deep reinforcement learning,” Nature, vol. 518, no. 7540, pp. 529–533, 2015.
- [4] H. Chae, C. M. Kang, B. Kim, J. Kim, C. C. Chung, and J. W. Choi, “Autonomous braking system via deep reinforcement learning,” in IEEE 20th International Conference on Intelligent Transportation Systems (ITSC), 2017.
- [5] G. P. R. Papini, A. Plebe, M. Da Lio, and R. Donà, “A reinforcement learning approach for enacting cautious behaviours in autonomous driving system: Safe speed choice in the interaction with distracted pedestrians,” IEEE Transactions on Intelligent Transportation Systems, 2021.
- [6] N. Deshpande, D. Vaufreydaz, and A. Spalanzani, “Behavioral decision-making for urban autonomous driving in the presence of pedestrians using deep recurrent Q-network,” in 16th International Conference on Control, Automation, Robotics and Vision (ICARCV), 2020, pp. 428–433.
- [7] ——, “Navigation in urban environments amongst pedestrians using multi-objective deep reinforcement learning,” in 2021 IEEE International Intelligent Transportation Systems Conference (ITSC), 2021, pp. 923–928.
- [8] B. R. Kiran, I. Sobh, V. Talpaert, P. Mannion, A. A. Al Sallab, S. Yogamani, and P. Pérez, “Deep reinforcement learning for autonomous driving: A survey,” IEEE Transactions on Intelligent Transportation Systems, 2021.
- [9] A. Rasouli and J. K. Tsotsos, “Autonomous vehicles that interact with pedestrians: A survey of theory and practice,” IEEE Transactions on Intelligent Transportation Systems, vol. 21, no. 3, pp. 900–918, 2020.
- [10] S. Schmidt and B. Färber, “Pedestrians at the kerb – Recognising the action intentions of humans,” Transportation Research Part F: Traffic Psychology and Behaviour, vol. 12, no. 4, pp. 300–310, 2009.
- [11] A. Millard-Ball, “Pedestrians, autonomous vehicles, and cities,” Journal of Planning Education and Research, vol. 38, pp. 6–12, 2018.
- [12] C. Zegeer, J. R. Stewart, H. H. Huang, P. A. Lagerwey, J. Feaganes, and B. J. Campbell, Safety Effects of Marked versus Unmarked Crosswalks at Uncontrolled Locations: Final Report and Recommended Guidelines, U.S. Department of Transportation Federal Highway Administration, 2005.
- [13] H. Van Hasselt, A. Guez, and D. Silver, “Deep reinforcement learning with double Q-learning,” in Proceedings of the Thirtieth AAAI Conference on Artificial Intelligence, 2016, pp. 2094––2100.
- [14] S. Zhang and R. S. Sutton, “A deeper look at experience replay,” arXiv preprint arXiv:1712.01275, 2017.
- [15] R. S. Sutton, “Learning to predict by the methods of temporal differences,” Machine Learning, vol. 3, no. 1, pp. 9–44, 1988.
- [16] Z. Wang, T. Schaul, M. Hessel, H. Hasselt, M. Lanctot, and N. Freitas, “Dueling network architectures for deep reinforcement learning,” in Proceedings of the 33rd International Conference on International Conference on Machine Learning, 2016, pp. 1995–2003.
- [17] A. Willis, N. Gjersoe, C. Havard, J. Kerridge, and R. Kukla, “Human movement behaviour in urban spaces: Implications for the design and modelling of effective pedestrian environments,” Environment and Planning B: Planning and Design, vol. 31, no. 6, pp. 805–828, 2004.