Microscopic dynamics of lithium diffusion in single crystal of the solid-state electrolyte La2/3-xLi3xTiO3 () studied by quasielastic neutron scattering
Abstract
Quasi-elastic neutron scattering (QENS) measurements combined with first principles based molecular-dynamics calculations were conducted to study the dynamics of Li+ ions in a solid-state electrolyte La2/3-xLi3xTiO3 (LLTO) with . By using a large 7Li-enriched single crystal sample, a QENS signal was clearly observed along the three principal axes [110], [111], and [001] at a temperature () of 600 K. Wave vector dependence of the line width of the QENS signal along each direction was explained well using the Chudley-Elliot model for jumps between the sites of the perovskite lattice through the bottleneck square, which was also supported by molecular dynamics calculations. At K, the estimated self-diffusion coefficient of Li+ () in the -plane [cm2/s] was slightly larger than that along the axis [cm2/s], suggesting quasi-isotropic diffusion, that is, the three-dimensional diffusion of Li+ ions. The decrease in with decreasing was reasonably explained by a thermal activation process with the activation energy determined from ionic-conductivity measurements. Furthermore, the estimated values of the self-diffusion coefficient of Li+ ions are comparable to those in the sulfide-based Li+ ion conductor, Li7P3S11, although its ionic conductivity is 10 times larger than that for LLTO. The obtained microscopic information on Li+ diffusion in LLTO clarifies how to understand the Li conduction mechanism in LLTO and Li7P3S11 in a unified manner and can provide a way to increase the Li+ ionic conductivity in oxide-based solid electrolytes.
I Introduction
An all-solid-state lithium-ion battery has been heavily investigated as a next-generation energy storage system [1, 2], because both the energy density and safety of such all-solid-state batteries are expected to be drastically improved by replacing an organic solvent-based liquid electrolyte with a solid electrolyte. Sulfide-based Li+ ionic conductors, such as Li10GeP2S12 (LGPS), are considered to be promising candidates for a solid electrolyte because of their extremely high Li+ ionic conductivity () ranging approximately S/cm at room temperature, which is comparable to the of typical liquid electrolytes [3]. By contrast, of oxide-based Li+ ionic conductors is more than one order of magnitude lower than that of sulfide-based Li+ ionic conductors such as LGPS, Li3PS4, and Li7P3S11 as summarized in Table 1. Because oxide-based Li+ ionic conductors have an excellent stability in air, it is highly desirable to develop oxide-based Li+ ionic conductors with a high .
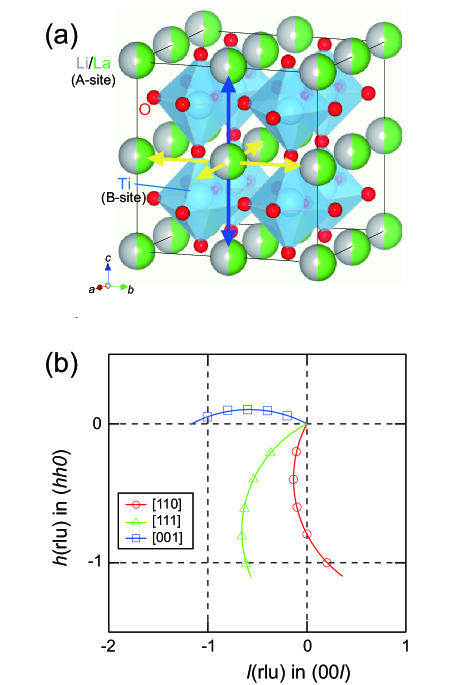
Among the many oxide-based Li+ ionic conductors, La2/3-xLi3xTiO3 (LLTO) exhibits the highest at room temperature [4, 5, 6]. Since LLTO poses a simple double-perovskite structure [see Fig. 1(a)], LLTO is considered an ideal system for studying the relationship between the Li+ conduction mechanism and structural properties in solids. Previous extensive structural studies on LLTO revealed the following key features on [5, 7, 8, 9, 10, 11, 12, 13]. First, is closely related to the La and defect contents at the site in a double-perovskite lattice, in which the La-rich and La-poor layers are stacked alternately along the axis. Li+ ions mainly conduct through the La-poor layer, when the Li concentration is low (or ) [5, 9, 10, 11, 12]. The difference in the La occupancy between the La-rich and La-poor layers decreases with the Li content. A nearly three-dimensional diffusion is expected for an Li-rich composition. Second, strongly depends on the size of the “bottleneck” square surrounded by oxygen ions. The potential barrier of is dominated by the repulsion energy from oxygen ions [11, 13].
Unfortunately, these findings are based on the time-averaged structure and do not provide direct information on the dynamics of Li+ ions. However, neutron scattering can detect the motion of Li+ ions as quasielastic neutron scattering (QENS). When a neutron is scattered by a mobile Li+ ion, neutron energy is transferred to, or from, the Li+ ions, resulting in broadening of the elastic signal. The wave vector () dependence of the line-width of the QENS provides detailed information on the dynamical conduction path of Li+ on a microscopic scale, such as the residence time () and jump vector (). Furthermore, if a single crystal is available, directional information of Li+ jump can be obtained. However, such a detailed QENS study using a single crystal has not been reported thus far perhaps owing to a lack of sufficiently large single crystals and weak QENS signals from mobile Li+ ions.
In this paper, we present a QENS study on the dynamics of Li+ ions using a single crystal of LLTO and a state-of-the-art neutron backscattering spectrometer. Combined with a molecular dynamics (MD) simulation using first-principles calculations, the dynamical conduction path and direction dependent self-diffusion coefficient of Li+ ions () at a microscopic scale have been directly extracted from QENS data.
| Systems | (S/cm) | (eV) | (cm2/sec) | ||||
| LGPS | [3] | 0.25 [3] |
|
||||
| Li3PS4 | [15] | 0.35 [15] |
|
||||
| Li7P3S11 (glass) | [17] | 0.44 [17] | ( K) [18] | ||||
| LLTO | [5] |
|
|
II Experimental Details
A powder sample of 7Li-enriched LLTO was synthesized using a solid-state reaction technique for the stoichiometric mixtures of 7Li-enriched Li2CO3 (99.9%, Cambridge Isotope Laboratories, Inc.), La2O3 (99.9%, Miike Smelting Co., Ltd.), and TiO2 (99.9%, Toho Titanium Co., Ltd.). The quality of the obtained LLTO powder was confirmed by powder x-ray diffraction measurements (SmartLab, Rigaku Corporation), as shown in Fig. S1 in the Supplemental Material [19]. Bulk single crystals of 7Li-enriched LLTO were grown using a directional solidification method under a growth condition recently reported for LixLa(1-x)/3NbO3 [21]. The sample is stable in the air with no reaction to moisture. The composition of the sample was determined as using an inductivity-coupled plasma optical emission spectrometer. The obtained LLTO crystals were cut perpendicular to the growth direction to create a disk with a 20 mm diameter and 1.5 mm thickness. The orientation of each disk was checked in 5 mm steps using an x-ray Laue diffractometer. Six disks consisting of only a single domain with the same crystal orientation were stacked and fixed using hydrogen-free glue (CYTOP). The total weight and volume of the stacked discs were 6.7 g and cc, respectively. Multiple scattering effect was not considered because the fraction of multiple scattering was as small as 10% estimated by approximating a cylindrical sample shape [22]. Resolution-limited Bragg peaks were confirmed by neutron experiments, which guarantees a bulk single grain of the stacked disk-shape crystals.
All first-principles calculations were conducted within a generalized gradient approximation revised for solids, as developed by Perdew, Burke, and Ernzerhof [23], within the framework of the density functional theory [24, 25], using the plane-wave basis projector augmented wave (PAW) method [26]. For the PAW potentials, and electrons for O, , , and electrons for Ti, and , , , , and electrons for La were explicitly treated as valence electrons, with a plane-wave cutoff energy of 500 eV. Unit cells of the tetragonal (La0.5,Li0.5)TiO3 [(La1,Li1)Ti2O6 ]() structure were assumed and relaxed using a -point mesh within the Brillouin zones generated using the Monkhorst-Pack scheme, and a convergence criterion for residual forces of 0.01 eV/Å. In this study, all first-principles molecular dynamics (FPMD) simulations were performed by Vienna ab initio simulation package (VASP) code [27, 28]. Supercells for FPMD simulations for the Li migration trajectory were constructed from unit cells of the relaxed tetragonal () structure with one Li vacancy for Li migration. The total number of electrons for the FPMD supercell was adjusted to keep the system insulating. FPMD production runs were performed within the canonical ensemble (constant volume, temperature and number of atoms) using a Nosé-Hoover thermostat [29] at temperatures () of 1000 K, with a time step of 1 fs. The calculated temperature, ion-electron energy, and kinetic energy were stable as a function of the simulation steps, demonsrating the stability of FPMD simulations (Figs. S2-S4 in the Supplemental Material [19]). The structures were relaxed for 2 ps (2000 steps) to ensure that thermodynamic equilibrium had been reached before applying production runs of 40 ps (40,000 steps) for the Li migration trajectory.
QENS measurements were conducted using a time-of flight near-backscattering spectrometer, DNA installed at the J-PARC MLF [30]. The final neutron energy of meV was selected using Si (111) analyzers and a Bragg angle of 87.5∘. A pulse shaping chopper rotating at 300 Hz with 3 cm slit provided an elastic resolution of 2.5 eV and an energy transfer () range of eV. Neutron scattering data were obtained using the UTSUSEMI software [31]. The stacked single crystal sample was sealed in an aluminum can with air and mounted to access the () horizontal scattering plane. There are some controversies in the structure of LLTO. For the high Li-doped sample near , tetragonal cell with ()()(), [32] where is a lattice parameter of cubic unit cell, simple tetragonal cell with ()()(), [33] and orthogonal cell with ()()() [20, 11] have been proposed. Throughout this paper, we label the momentum transfer in units of the reciprocal lattice vectors Å-1 and Å-1 in the orthogonal notation. Figure 1(b) shows three scan trajectories in the horizontal scattering plane (). The sample was rotated to make scattering trajectories nearly parallel to the three principal axes [110], [111], and [001] below Å-1. The scattering intensity along the vertical direction was integrated for r.l.u. in ().
III Results
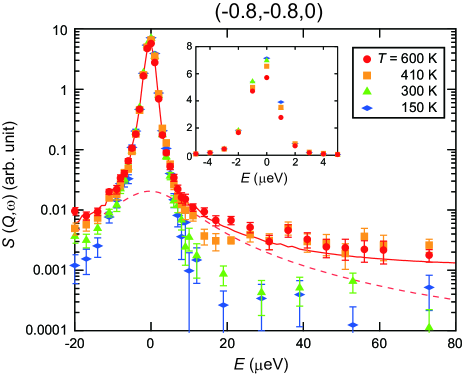
The QENS spectra at (-0.8,-0.8,0) at various ’s are plotted in the logarithmic scale in Fig. 2. Because Li+ ions are expected to be immobile at K, we assume that the spectrum at K corresponds to a delta function convoluted with the instrumental resolution. A similar resolution-limited spectrum is also obtained at K, suggesting that the Li+ ions are still immobile even at K within the energy or time resolution of the current setup (2.5 eV GHz ns). At K, the intensity of the elastic peak decreases with increasing (see the inset of Fig. 2), whereas the scattering intensities for eV are enhanced with . This suggests the dynamic nature of Li+ ions at K. These spectra were fitted with the sum of a Lorentzian and a delta function convoluted with the resolution function estimated from the K data in addition to a flat background. Although the QENS component, i.e., the Lorentzian component, is 1000 times weaker than the elastic peak, the QENS component, represented by a dotted line in Fig. 2, is clearly extracted, mainly owing to the low background of the DNA spectrometer. Note that the half width at half maximum () of a Lorentz function was eV, which is comparable to for a sulfide-based Li ionic conductor Li7P3S11 obtained using DNA [13].
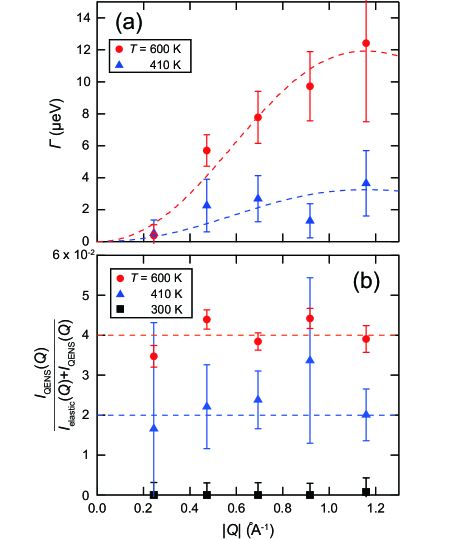
From the fits at , -0.8, -0.6, -0.4, -0.2 (rlu) along the scan trajectory of [110] [Fig. 1(b)], the dependence of was obtained at and 600 K [Fig. 3(a)], where is the magnitude of a wave vector from the origin. Because increases quadratically with and saturates at a high , the obtained result suggests a translational jump diffusion of Li+ for K.
In the Chudley-Elliot (CE) model for the translational jump diffusion in Bravais lattices, the scattering function is given by [34]
| (1) |
where is the Debye-Waller factor. Here, is written as
| (2) |
where is the residence time, is the jump vector, and is the number of sites. Because when , for the [110] direction reflects the Li+ jumps in the plane.
To infer the candidates of the in the plane, we conducted MD simulations using first-principles calculations of LLTO. The simulated trajectories of Li+ ions in the La-poor (La2) layer on the plane are shown in Fig. 4. For simplicity, we also assumed the absence of La ions at the La2 site in the simulations. Li+ ions move around the sites, and the trajectories form a square shape with edges toward the or directions. The square trajectories are consistent with the distribution of Li+ ions determined from reverse Monte Carlo simulations based on the x-ray and neutron diffraction data [12, 13]. Note that some of the Li+ ions jump to the neighboring site through the bottle neck structure, suggesting that the jump toward the vacant site is the key pathway of Li+ diffusion.

Based on the information obtained from the MD calculations, Li+ ions are found to jump along the [100] and [010] directions in the plane. Therefore, Eq. (2) is rewritten as
| (3) |
The observed for the [110] direction are reproduced well by this model with ns and Å as indicated by the broken lines in Fig. 3(a). Note that the obtained is equivalent to the -axis length of the cubic perovskite (Å) within the error bar. This is consistent with the result of the MD calculations, in which Li+ ions jump to the neighboring site through the bottle neck.
For a small parallel to the jump vector, Eq. (2) is converted into the following:
| (4) |
where is a self-diffusion coefficient of Li+ ions. Thus, is estimated as cm2/s at K directly from . Because the jump distance is roughly independent of , and are easily estimated at K (see Table 2). Inaguma et al. reported the thermal activation energy () of 0.15 eV at above 400 K from the bulk conductivity measurements [5]. The decrease in is in good agreement with the Arrhenius law with of 0.15 eV. It is interesting to compare the present with that for Li7P3S11 estimated from the QENS data obtained with DNA: that is, for Li7P3S11, cm2/s at K [18]. For LLTO, at K is estimated from at 600 K and eV as cm2/s, which is close to that for Li7P3S11 (Table 1). This means that a fast Li+ diffusion is achieved even in oxide-based Li+ ionic conductors, as well as in the sulfide-based conductors, from a microscopic perspective.
In addition to (), a fraction of the QENS component to the total intensity (), defined as
| (5) |
provides useful information on the Li+ dynamics. Here, () and () are the integrated intensities of the QENS and elastic signal, respectively. For the translational diffusion, because only the Debye-Waller factor depends on in both () and (), such dependence is canceled out. Therefore, is also independent of and is a good indicator for the number of mobile Li+ ions. In fact, is roughly independent of , as shown in Fig. 3(b), which confirms the self-diffusive nature of the observed QENS signal at K and 410 K. The mobile Li+ ion fraction can be obtained by multiplying by the ratio of the incoherent scattering cross section of 7Li to the sum of from all elements contained in LLTO, as summarized in Table 2. The reduction in the fraction of mobile Li+ ions at lower indicates the decrease in the number of mobile Li+ ions detectable in the time window of the current experimental setup.
| Direction | (K) | (Å) | (ns) | ( cm2/s) | Ratio of mobile Li+ ions(%) | ( m-3) |
|---|---|---|---|---|---|---|
| [110] | 600 | |||||
| [110] | 410 | 3.9 fix | ||||
| [001] | 600 |
Next, to determine the anisotropy of Li+ dynamics, the in-plane ([110])-QENS spectrum is compared with the out-of-plane ([001])-QENS spectrum at the same Å-1. Figure 5 shows the spectra measured at and 600 K. At K, the [110]-QENS component is similar to the [001]-QENS component, indicating a nearly three-dimensional motion of Li+ ions. In fact, the two QENS spectra are well reproduced by the common of eV, whereas the QENS intensity of the in-plane motion is slightly larger than that of the out-of-plane motion.
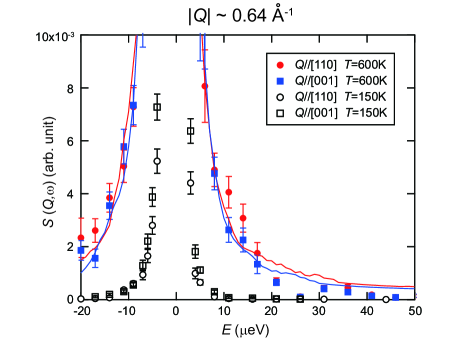
Figure 6 shows the curves at 600 K along the [110], [001], and [111] directions. For the [001] direction, is described as
| (6) |
with Å and ns (Table 2). The jump length along the [001] direction () is close to the -axis length of the cubic cell, suggesting the jumps between the -sites of the neighboring Li/La planes [Fig. 1(a)]. Because is slightly larger than , . The () curve along the [111] direction is explained well by the coexistence of both jumps in the plane and along the axis using the obtained QENS parameters for each direction.

IV Discussion
Returning to the Nernst-Einstein equation, is related to the ionic conductivity as
| (7) |
where is the elementary charge, is the density of mobile Li+ ions, and denotes the Boltzmann constant. is estimated as m-3 from the product of the mobile Li+ ion fraction and the number of Li+ ions () per cubic perovskite unit cell m-3 (Table 2). The microscopic (hereafter denoted as ) at K is calculated as S/cm and S/cm for the in-plane and out-of-plane directions, respectively. The spatial average of the S/cm agrees with that of S/cm at K reported from bulk conductivity measurements for LLTO with slightly lower Li content () [5].
Table 1 summarizes , , and for the sulfide-based Li+ ion conductors and LLTO. The of LLTO is one or two orders of magnitude lower than that of the sulfur-based ones with relatively large . The for LGPS and Li7P3S11 are the reported values obtained from pulsed field gradient nuclear magnetic resonance measurements (PFG-NMR), and they are considerably smaller than those of LLTO and Li7P3S11 despite their higher conductivity. Presumably, this is because QENS capture the dynamics of the smallest Li dynamic path, whereas PFG-NMR detects dynamics with longer length scale. Comparing the measured by QENS between LLTO and Li7P3S11, the fact that for LLTO is comparable to that for Li7P3S11, despite the difference in , leads to the following question: what is the predominant factor for the difference in between LLTO and Li7P3S11? The for Li7P3S11 is 0.23 at K [35] and the fraction of mobile Li+ ions is 23%, which is similar to that for LLTO (Table 2). Then, is obtained as m-3 by multiplying a Li ion density m-3 for Li7P3S11. for LLTO at K is m-3, estimated from a linear interpolation between and 600 K, which is 1.7 times smaller than that of Li7P3S11. Consequently, for Li7P3S11 is expected to be 3.2 times larger than that for LLTO according to the Nernst-Einstein equation. This is the most reasonable explanation for the difference in between LLTO and Li7P3S11 at the microscopic scale.
Since the discovery of fast Li+ ionic conduction in sulfide-based Li+ ionic conductors [36], sulfide ions are considered to play a significant role in enhancing the mobility of Li+ ions through a large polarization. However, the fact that for LLTO is comparable to that of Li7P3S11 indicates the possibility of better oxide-based Li+ ionic conductors by seeking materials with a larger Li density in the unit cell. Regarding the microscopic mechanism of fast Li+ diffusion, a coupling between the rotational motion of the PS tetrahedra and was indicated in the sulfide-based Li+ ionic conductors [37]. In LLTO, structural instabilities of the tilting modes of TiO6 tetrahedra are suggested from first-principles calculations [38]. Further studies on the dynamics of the host lattice of Li+ ionic conductors will be required to understand the mechanism of fast Li+ ionic conduction in solids.
V Conclusion
We studied the dynamics of Li+ ions in a solid-state electrolyte LLTO () using QENS and first-principles MD simulations. We observed clear QENS signals along the three principal axes [110], [111], and [001] at K by using the large 7Li-enriched single crystal. Directional information of the Li+ jump, such as the residence time and jump vector determined at the microscopic scale, reveals the dynamical conduction paths of Li+ ions: jumps of Li+ ions to the neighboring site through the bottle neck structure, which are supported by the first-principles MD simulations. The self-diffusion coefficients of Li+ ions are found to be quasi-isotropic, suggesting the nearly three-dimensional diffusion of Li+ ions. Furthermore, the estimated self-diffusion coefficients of Li+ are comparable to those of the sulfide-based Li+ ion conductor Li7P3S11, although the ionic conductivity of LLTO is 10 times smaller than that of Li7P3S11. This microscopic information on Li+ diffusion can provide a way to increase Li+ ionic conductivity in oxide-based solid electrolytes.
VI Acknowledgement
The neutron experiments were performed with the approval of J-PARC MLF (No. 2019A0306). We are grateful to K. Mori, M. Kofu, and J. Sugiyama for helpful discussions. We also thank M. Fujita and Y. Ikeda for their help with crystal alignment using a x-ray Laue diffractometer. The crystal structures in Fig. 1(a) are produced by VESTA software[39].
References
- Tarascon and Armand [2001] J. M. Tarascon and M. Armand, Nature 414, 171 (2001).
- Armand and Tarascon [2008] M. Armand and J.-M. Tarascon, Nature (London) 451, 652 (2008).
- Kamaya et al. [2011] N. Kamaya, K. Homma, Y. Yamakawa, M. Hirayama, R. Kanno, M. Yonemura, T. Kamiyama, Y. Kato, S. Hama, and K. Kawamoto, Nat. Mater. 10, 682 (2011).
- Latie et al. [1984] L. Latie, G. Villeneuve, D. Conte, and G. Le Flem, J. Solid State Chem. 51, 293 (1984).
- Inaguma et al. [1993] Y. Inaguma, C. Liquan, M. Itoh, T. Nakamura, T. Uchida, H. Ikuta, and M. Wakihara, Solid State Commun. 86, 689 (1993).
- Inaguma [2006] Y. Inaguma, J. Ceram. Soc. Jpn. 114, 1103 (2006).
- Fourquet et al. [1996] J. L. Fourquet, H. Duroy, and M. P. Crosnier-Lopez, J. Solid State Chem. 127, 283 (1996).
- Harada et al. [1998] Y. Harada, T. Ishigaki, H. Kawai, and J. Kuwano, Solid State Ionics 108, 407 (1998).
- Ibarra et al. [2000a] J. Ibarra, A. Várez, C. León, J. Santamaría, L. M. Torres-Martínez, and J. Sanz, Solid State Ionics 134, 219 (2000a).
- [10] D. Mazza, S. Ronchetti, O. Bohnké, H. Duroy, and J. L. Fourquet, .
- Inaguma et al. [2006] Y. Inaguma, T. Katsumata, M. Itoh, Y. Morii, and T. Tsurui, Solid State Ionics 177, 3037 (2006).
- Ohara et al. [2010] K. Ohara, Y. Kawakita, L. Pusztai, L. Temleitner, S. Kohara, N. Inoue, and S. Takeda, J. Phys. Condens. Matter 22, 404203 (2010).
- Mori et al. [2014] K. Mori, S. Tomihira, K. Iwase, and T. Fukunaga, Solid State Ion. 268, 76 (2014).
- Kuhn et al. [2013] A. Kuhn, V. Duppel, and V. B. Lotsch, Energy Environ. Sci. 6, 3548 (2013).
- Hayashi et al. [2001] A. Hayashi, S. Hama, H. Morimoto, M. Tatsumisago, and T. Minami, J. Am. Ceram. Soc. 84, 477 (2001).
- Stöffler et al. [2018] H. Stöffler, T. Zinkevich, M. Yavuz, A. Senyshyn, J. Kulisch, P. Hartmann, T. Adermann, S. Randau, F. H. Richter, J. Janek, et al., J. Phys. Chem. C 122, 15954 (2018).
- Onodera et al. [2012] Y. Onodera, K. Mori, T. Otomo, M. Sugiyama, and T. Fukunaga, J. Phys. Soc. Jpn 81, 044802 (2012).
- Mori et al. [2015] K. Mori, K. Enjuji, S. Murata, K. Shibata, Y. Kawakita, M. Yonemura, Y. Onodera, and T. Fukunaga, Phys. Rev. Appl. 4, 054008 (2015).
- [19] See Supplemental Material for the details of the powder x-ray diffraction and the stability of FPMD simulations, which includes Refs. [11] and [20].
- Chung and Cheong [1999] H.-T. Chung and D.-S. Cheong, Solid State Ionics 120, 197 (1999).
- Fujiwara et al. [2016] Y. Fujiwara, K. Hoshikawa, and K. Kohama, J. Cryst. Growth 433, 48 (2016).
- Blech and Averbach [1965] I. A. Blech and B. L. Averbach, Phys. Rev. 137, A1113 (1965).
- Perdew et al. [1996] J. P. Perdew, K. Burke, and M. Ernzerhof, Phys. Rev. Lett. 77, 3865 (1996).
- Hohenberg and Kohn [1964] P. Hohenberg and W. Kohn, Phys. Rev. 136, B864 (1964).
- Kohn and Sham [1965] W. Kohn and L. J. Sham, Phys. Rev. 140, A1133 (1965).
- Blöchl [1994] P. E. Blöchl, Phys. Rev. B 50, 17953 (1994).
- Kresse and Furthmüller [1996] G. Kresse and J. Furthmüller, Phys. Rev. B 54, 11169 (1996).
- Kresse and Joubert [1999] G. Kresse and D. Joubert, Phys. Rev. B 59, 1758 (1999).
- Evans and Holian [1985] D. J. Evans and B. L. Holian, J. Chem. Phys. 83, 4069 (1985).
- Shibata et al. [2015] K. Shibata, N. Takahashi, Y. Kawakita, M. Matsuura, T. Yamada, T. Tominaga, W. Kambara, M. Kobayashi, Y. Inamura, T. Nakatani, K. Nakajima, and M. Arai, JPS Conf. Proc. 8, 036022 (2015).
- Inamura et al. [2011] Y. Inamura, T. Nakatani, J. Suzuki, and T. Otomo, J. Phys. Soc. Jpn 82, SA031 (2011).
- Várez et al. [1995] A. Várez, F. García-Alvarado, E. Morán, and M. A. Alario-Franco, J. Solid State Chem. 118, 78 (1995).
- Ibarra et al. [2000b] J. Ibarra, A. Varéz, C. León, J. Santamará, L. M. Torres-Martńez, and J. Sanz, Solid State Ionics 134, 219 (2000b).
- Hempelmann [2000] R. Hempelmann, Quasielastic Neutron Scattering and Solid State Diffusion (Oxford : Clarendon Press, 2000).
- [35] K. Mori, personal communication.
- Kanno et al. [2000] R. Kanno, T. Hata, Y. Kawamoto, and M. Irie, Solid State Ionics 130, 97 (2000).
- Smith and Siegel [2020] J. G. Smith and D. J. Siegel, Nat. Commun 11, 1 (2020).
- Moriwake et al. [2015] H. Moriwake, X. Gao, A. Kuwabara, C. A. J. Fisher, T. Kimura, Y. H. Ikuhara, K. Kohama, T. Tojigamori, and Y. Ikuhara, J. Power Sources 276, 203 (2015).
- Momma and Izumi [2011] K. Momma and F. Izumi, J. Appl. Cryst. 44, 1272 (2011).