Physical Characterization of Main-Belt Comet (248370) 2005 QN173
Abstract
We report results from new and archival observations of the newly discovered active asteroid (248370) 2005 QN137, which has been determined to be a likely main-belt comet based on a subsequent discovery that it is recurrently active near perihelion. From archival data analysis, we estimate -, -, -, and -band absolute magnitudes for the nucleus of , , , and , corresponding to nucleus colors of , , and , an equivalent -band absolute magnitude of , and a nucleus radius of km (using a -band albedo of ). Meanwhile, we find mean near-nucleus coma colors when 248370 was active of , , and , and similar mean dust tail colors, suggesting that no significant gas coma is present. We find approximate ratios between the scattering cross-sections of near-nucleus dust (within 5000 km of the nucleus) and the nucleus of on 2016 July 22, and in 2021 July and August. During the 2021 observation period, the coma declined in intrinsic brightness by mag (or 25%) in 37 days, while the surface brightness of the dust tail remained effectively constant over the same period. Constraints derived from the sunward extent of the coma suggest that terminal velocities of ejected dust grains are extremely slow ( for particles), indicating that the observed dust emission may have been aided by rapid rotation of the nucleus lowering the effective escape velocity.
1 Introduction
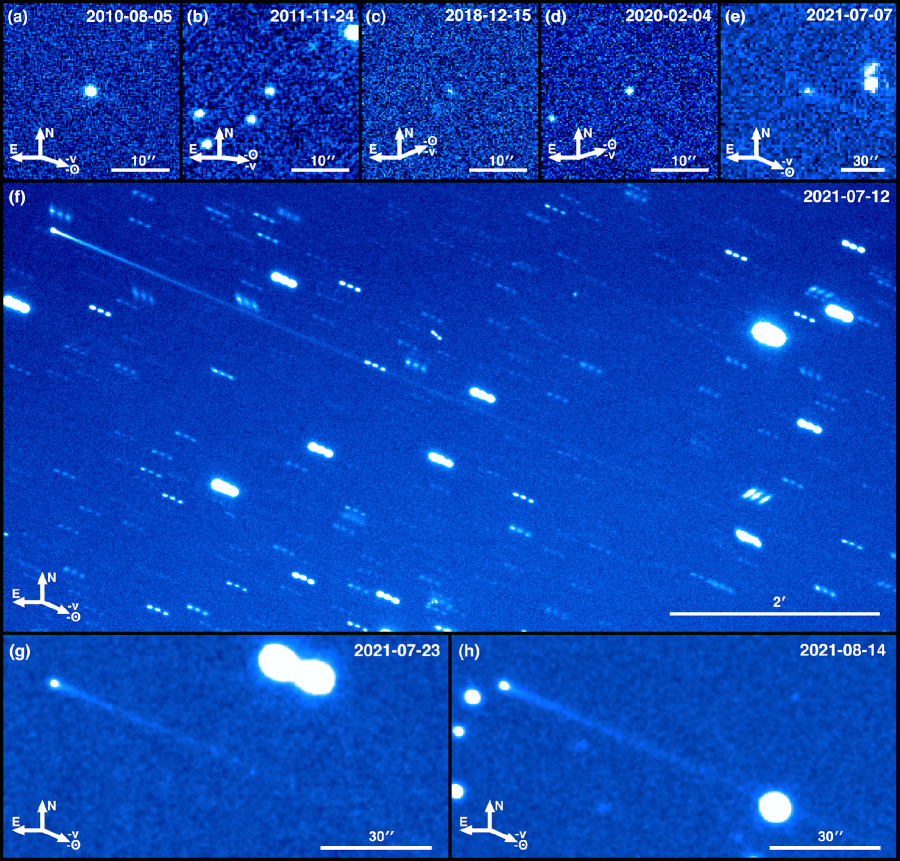
Asteroid (248370) 2005 QN173 (hereafter, 248370) was discovered to be active on UT 2021 July 7 in data comprising 120s of total exposure time (Figure 1e) obtained by the Asteroid Terrestrial-Impact Last Alert System (ATLAS; Tonry et al., 2018a) survey telescope (Fitzsimmons et al., 2021). On that date, the object was at a heliocentric distance of au and true anomaly of , having most recently reached perihelion on UT 2021 May 14. As reported in the discovery announcement, 248370 exhibited a thin, straight dust tail in length at a position angle of 245∘ East of North in confirmation observations obtained by Lowell Observatory’s 4.3 m Lowell Discovery Telescope (LDT). Zwicky Transient Facility (ZTF) observations show the presence of the tail as early as UT 2021 June 11 (Kelley et al., 2021).
As of 2021 August 1, 248370 has a semimajor axis of au, eccentricity of , and inclination of , according to the JPL Small-Body Database111https://ssd.jpl.nasa.gov/sbdb.cgi, placing it unambiguously in the outer main asteroid belt. 248370’s active nature and asteroidal orbit places it among the class of objects known as active asteroids, which exhibit comet-like mass loss yet have dynamically asteroidal orbits (Jewitt et al., 2015). Active asteroids include main-belt comets (Hsieh & Jewitt, 2006), for which sublimation of volatile ice is the most likely activity driver, and disrupted asteroids, for which activity is due to other processes such as impacts or rotational destabilization (e.g., Hsieh et al., 2012).
248370 has been previously measured to have a diameter of 3.60.2 km and visible geometric albedo of 0.0540.012, using for the V-band absolute magnitude and (Mainzer et al., 2019). As of July 2021, there are no published rotational lightcurve data available for the object in the Asteroid Lightcurve Photometry Database222https://minplanobs.org/alcdef/index.php, nor in the Asteroid Lightcurve Data Base archived by the NASA Planetary Data System (PDS). Similarly, no taxonomic classification for 248370 is available in current PDS catalogs.
Following the discovery of 248370’s activity in 2021, Chandler et al. (2021) reported the discovery of activity in archival data from the Dark Energy Camera (DECam; Flaugher et al., 2015) on the 4 m Victor M. Blanco Telescope (hereafter, Blanco) at Cerro Tololo Interamerican Observatory (CTIO) obtained on UT 2016 July 22, when the object was at a true anomaly of , having then most recently passed perihelion on UT 2016 January 3. This discovery of two separate active apparitions of 248370, both near perihelion, is considered a strong indication that sublimation is responsible for the observed activity (e.g., Hsieh et al., 2012, Chandler et al., submitted).
2 Observations
| UT Date | Telescope | a | Filter | b | c | d | e | f | g | h | i | j | k |
| 2021 Jul 7 | ATLAS | 120 | cyan | 5.2 | 16.0 | 2.391 | 1.930 | 24.4 | — | — | — | — | — |
| 2021 Jul 9 | Palomar | 800 | 2.1 | 16.6 | 2.392 | 1.909 | 24.2 | 19.570.01 | 15.140.01 | 2.90.5 | 15.10.7 | 24.240.20 | |
| 2021 Jul 9 | FTN | 480 | 1.5 | 16.6 | 2.392 | 1.909 | 24.2 | 19.710.01 | 15.280.01 | 2.40.5 | 13.60.8 | 23.870.20 | |
| 2021 Jul 12 | Palomar | 300 | 1.4 | 17.5 | 2.394 | 1.877 | 23.8 | 19.520.02 | 15.140.02 | 2.90.5 | 16.40.8 | 23.660.20 | |
| 2021 Jul 13 | FTN | 480 | 2.4 | 17.8 | 2.395 | 1.867 | 23.7 | 19.520.02 | 15.150.02 | 2.90.5 | 14.50.8 | 24.010.20 | |
| 2021 Jul 15 | FTN | 480 | 1.5 | 18.5 | 2.396 | 1.842 | 23.4 | 19.550.02 | 15.220.02 | 2.60.5 | 14.60.8 | 23.770.20 | |
| 2021 Jul 8 | LDT | 2400 | 1.8 | 16.3 | 2.391 | 1.920 | 24.3 | 19.140.01 | 14.690.01 | 2.70.4 | 23.20.9 | 23.450.20 | |
| 2021 Jul 9 | Palomar | 1300 | 2.1 | 16.6 | 2.392 | 1.909 | 24.2 | 19.110.01 | 14.680.01 | 2.80.4 | 22.80.8 | 23.680.20 | |
| 2021 Jul 9 | FTN | 480 | 1.4 | 16.6 | 2.392 | 1.909 | 24.2 | 19.190.01 | 14.760.01 | 2.50.4 | 22.21.0 | 23.340.20 | |
| 2021 Jul 10 | LCOGT 1m | 480 | 1.8 | 16.9 | 2.393 | 1.898 | 24.1 | 19.170.02 | 14.760.02 | 2.50.4 | 21.41.0 | 23.420.20 | |
| 2021 Jul 12 | Palomar | 900 | 1.2 | 17.5 | 2.394 | 1.877 | 23.8 | 19.120.01 | 14.740.01 | 2.60.4 | 23.20.9 | 23.170.20 | |
| 2021 Jul 13 | FTN | 480 | 2.2 | 17.8 | 2.395 | 1.867 | 23.7 | 19.050.01 | 14.680.01 | 2.80.4 | 22.60.9 | 23.550.20 | |
| 2021 Jul 14 | LCOGT 1m | 1130 | 2.1 | 18.1 | 2.395 | 1.856 | 23.6 | 19.110.02 | 14.760.02 | 2.50.4 | 20.81.0 | 23.660.20 | |
| 2021 Jul 15 | LCOGT 1m | 1130 | 1.7 | 18.5 | 2.396 | 1.842 | 23.4 | 19.050.01 | 14.720.01 | 2.60.4 | 22.80.9 | 23.410.20 | |
| 2021 Jul 15 | FTN | 480 | 1.4 | 18.5 | 2.396 | 1.842 | 23.4 | 19.130.01 | 14.800.01 | 2.40.3 | 21.21.0 | 23.260.20 | |
| 2021 Jul 18 | LCOGT 1m | 283 | 1.7 | 19.3 | 2.398 | 1.815 | 23.0 | 19.030.06 | 14.750.06 | 2.50.4 | 22.11.9 | 23.400.20 | |
| 2021 Jul 19 | LCOGT 1m | 1130 | 1.9 | 19.5 | 2.399 | 1.805 | 22.9 | 19.060.02 | 14.780.02 | 2.40.4 | 20.71.0 | 23.450.20 | |
| 2021 Jul 21 | LCOGT 1m | 1130 | 2.2 | 20.1 | 2.401 | 1.785 | 22.5 | 19.070.03 | 14.830.03 | 2.30.3 | 18.81.1 | 23.750.20 | |
| 2021 Jul 23 | LCOGT 1m | 1853 | 1.9 | 20.8 | 2.402 | 1.762 | 22.1 | 19.050.03 | 14.850.03 | 2.20.3 | 19.01.1 | 23.520.20 | |
| 2021 Aug 5 | LCOGT 1m | 600 | 2.1 | 24.5 | 2.414 | 1.648 | 19.2 | 18.860.02 | 14.890.02 | 2.10.3 | 17.91.0 | 23.550.20 | |
| 2021 Aug 7 | LCOGT 1m | 600 | 2.0 | 25.1 | 2.415 | 1.632 | 18.7 | 18.800.01 | 14.870.01 | 2.20.3 | 18.70.9 | 23.500.20 | |
| 2021 Aug 14 | LCOGT 1m | 600 | 2.0 | 27.2 | 2.423 | 1.577 | 16.4 | 18.810.01 | 15.020.02 | 1.80.3 | 15.31.0 | 23.450.20 | |
| 2021 Jul 9 | Palomar | 900 | 2.1 | 16.6 | 2.392 | 1.909 | 24.2 | 18.980.01 | 14.550.01 | 2.80.2 | 25.70.5 | 23.600.20 | |
| 2021 Jul 9 | FTN | 480 | 1.3 | 16.6 | 2.392 | 1.909 | 24.2 | 19.160.02 | 14.730.02 | 2.20.2 | 22.20.9 | 23.070.20 | |
| 2021 Jul 12 | Palomar | 600 | 1.2 | 17.5 | 2.394 | 1.877 | 23.8 | 19.030.01 | 14.650.01 | 2.40.2 | 24.80.6 | 22.940.20 | |
| 2021 Jul 13 | FTN | 480 | 2.2 | 17.8 | 2.395 | 1.867 | 23.7 | 18.920.02 | 14.550.02 | 2.80.2 | 25.50.9 | 23.400.20 | |
| 2021 Jul 15 | FTN | 480 | 1.4 | 18.5 | 2.396 | 1.842 | 23.4 | 18.950.02 | 14.620.02 | 2.50.2 | 25.50.9 | 23.070.20 | |
| 2016 Jul 22 | Blanco | 89 | 1.1 | 56.5 | 2.591 | 2.571 | 22.7 | 20.510.10 | 15.310.10 | 0.70.3 | 7.52.4 | 25.300.50 | |
| 2021 Jul 9 | FTN | 480 | 1.2 | 16.6 | 2.392 | 1.909 | 24.2 | 19.050.04 | 14.620.04 | 2.20.5 | 24.52.1 | 23.080.30 | |
| 2021 Jul 13 | FTN | 480 | 2.1 | 17.8 | 2.395 | 1.867 | 23.7 | 18.840.03 | 14.480.03 | 2.60.5 | 27.21.9 | 23.400.30 | |
| 2021 Jul 15 | FTN | 480 | 1.3 | 18.5 | 2.396 | 1.842 | 23.4 | 18.920.03 | 14.590.03 | 2.20.5 | 25.51.9 | 23.060.30 | |
| a Total integration time, in seconds. | |||||||||||||
| b FWHM seeing, in arcseconds. | |||||||||||||
| c True anomaly, in degrees. | |||||||||||||
| d Heliocentric distance, in au. | |||||||||||||
| e Geocentric distance, in au. | |||||||||||||
| f Solar phase angle (Sun-object-Earth), in degrees. | |||||||||||||
| g Mean apparent coma magnitude (measured using 5000 km-radius photometry apertures). | |||||||||||||
| h Computed absolute magnitude corresponding to measured apparent magnitude assuming a phase function where . | |||||||||||||
| i Inferred ratio of effective scattering cross-sectional areas of coma dust (within 5000 km-radius photometry apertures) and the nucleus, | |||||||||||||
| where listed uncertainties only reflect photometric measurement uncertainty and not potential nucleus rotational variability. | |||||||||||||
| j values, computed using Equation 4 and 5000 km photometry apertures, in cm. | |||||||||||||
| k Dust tail surface brightness in mag arcsec-2, as measured in a 1500 km 10000 km rectangular aperture, as described in the text. | |||||||||||||
| UT Date | Tel.a | b | c | Filter | d | e | f | g | h | i |
| 2010 Aug 6 | PS1 | 1 | 43 | 354.7 | 2.389 | 1.377 | 2.0 | 19.170.03 | 16.350.03 | |
| 2010 Sep 6 | PS1 | 2 | 86 | 3.8 | 2.388 | 1.463 | 12.2 | 20.080.05 | 16.630.05 | |
| 2011 Nov 24 | PS1 | 2 | 86 | 109.4 | 3.150 | 2.180 | 4.1 | 21.200.13 | 16.640.13 | |
| 2011 Dec 1 | PS1 | 2 | 86 | 110.6 | 3.164 | 2.180 | 1.4 | 20.980.10 | 16.600.10 | |
| Medianj | … | … | … | … | … | … | … | … | 16.620.13 | |
| 2010 Aug 5 | PS1 | 1 | 40 | 354.4 | 2.389 | 1.378 | 2.5 | 18.810.03 | 15.950.03 | |
| 2011 Nov 24 | PS1 | 2 | 80 | 109.4 | 3.150 | 2.180 | 4.0 | 20.740.10 | 16.190.10 | |
| 2018 Dec 15 | Blanco | 1 | 45 | 191.7 | 3.733 | 3.508 | 15.2 | 22.630.31 | 16.200.31 | |
| 2020 Feb 4 | Blanco | 2 | 81 | 248.9 | 3.165 | 3.059 | 18.1 | 21.910.11 | 16.040.11 | |
| Medianj | … | … | … | … | … | … | … | … | 16.120.10 | |
| 2004 Jul 8 | CFHT | 3 | 540 | 287.5 | 2.740 | 2.028 | 17.7 | 20.720.03 | 16.070.03 | |
| 2010 Aug 2 | PS1 | 1 | 45 | 353.5 | 2.390 | 1.383 | 3.9 | 19.010.05 | 16.050.05 | |
| 2010 Aug 31 | PS1 | 2 | 90 | 2.1 | 2.388 | 1.429 | 9.8 | 19.230.04 | 15.930.04 | |
| 2011 Nov 30 | PS1 | 2 | 90 | 110.4 | 3.162 | 2.179 | 1.9 | 20.260.09 | 15.840.09 | |
| 2015 Aug 18 | SkyMapper | 1 | 100 | 320.3 | 2.483 | 1.888 | 21.8 | 20.720.26 | 16.310.26 | |
| Medianj | … | … | … | … | … | … | … | … | 16.050.11 | |
| 2010 Jun 14 | PS1 | 2 | 60 | 339.3 | 2.416 | 1.728 | 21.1 | 20.070.13 | 15.930.13 | |
| 2010 Oct 30 | PS1 | 5 | 150 | 19.6 | 2.413 | 2.018 | 23.8 | 20.480.23 | 15.930.13 | |
| 2020 Feb 10 | Blanco | 1 | 199 | 250.0 | 3.152 | 2.960 | 18.2 | 21.590.14 | 15.800.14 | |
| Medianj | … | … | … | … | … | … | … | … | 15.930.08 | |
| a Telescope used | ||||||||||
| b Number of exposures. | ||||||||||
| c Total integration time, in seconds. | ||||||||||
| d True anomaly, in degrees. | ||||||||||
| e Heliocentric distance, in au. | ||||||||||
| f Geocentric distance, in au. | ||||||||||
| g Solar phase angle (Sun-object-Earth), in degrees. | ||||||||||
| h Mean apparent magnitude in specified filter. | ||||||||||
| i Computed absolute magnitude corresponding to measured apparent magnitude assuming IAU | ||||||||||
| phase function behavior where . | ||||||||||
| j Median values of computed absolute magnitudes, where standard deviations are used as uncertainties. | ||||||||||
New observations of 248370 were obtained on several nights between UT 2021 July 8 and UT 2021 August 14 with LDT (Levine et al., 2012), Palomar Observatory’s 5 m Hale Telescope (hereafter, Palomar), the 2 m Faulkes Telescope North (FTN), and Las Cumbres Observatory (hereafter, LCOGT) 1 m telescopes (Brown et al., 2013) at CTIO and the South African Astronomical Observatory (SAAO) (Table 1). Observations were obtained using the LDT’s Large Monolithic Imager (LMI; Bida et al., 2014), Palomar’s Wafer-Scale camera for Prime (WaSP; Nikzad et al., 2017) wide field prime focus camera, FTN’s Multicolor Simultaneous Camera for studying Atmospheres of Transiting exoplanets (MuSCAT3; Narita et al., 2020), and LCOGT Sinistro cameras. All observations were obtained using Sloan -, -, -, or -band filters, and non-sidereal tracking to follow the target’s motion.
Multi-filter FTN data were obtained using the simultaneous -, -, -, and -band imaging capability of MuSCAT3. Multi-filter Palomar observations were obtained by interspersing filters (i.e., using repeating or sequences) to enable the use of interpolation to approximate simultaneous multi-filter imaging for color computation (i.e., compensating for possible rotational variability in the nucleus brightness between our actual observations in different filters).
Bias subtraction, flat field correction, and cosmic ray removal were performed for LDT and Palomar data using Python 3 code utilizing the ccdproc package in Astropy (Astropy Collaboration et al., 2018) and L.A.Cosmic code333Written for python by Maltes Tewes (https://github.com/RyleighFitz/LACosmics) (van Dokkum, 2001; van Dokkum et al., 2012). FTN and LCOGT 1 m data were processed using standard LCOGT pipeline software (McCully et al., 2018).
We also used the Canadian Astronomy Data Centre’s Solar System Object Image Search tool444http://www.cadc-ccda.hia-iha.nrc-cnrc.gc.ca/en/ssois/ (Gwyn et al., 2012) and the NASA Planetary Data System (PDS) Small Bodies Node’s Comet Asteroid Telescopic Catalog Hub (CATCH) tool555https://catch.astro.umd.edu/ to identify archival Sloan -, -, -, and -band observations of 248370 from 2004 to 2020 (Table 2) from the 1.8 m Panoramic Survey Telescope and Rapid Response System (Pan-STARRS1; hereafter PS1) survey telescope (Chambers et al., 2016; Flewelling et al., 2020), MegaCam (Boulade et al., 2003) on the 3.6 m Canada-France-Hawaii Telescope (CFHT), the 1.35 m SkyMapper survey telescope (Wolf et al., 2018), and Blanco. For the purposes of our analysis, PS1 , , , and filters are considered functionally equivalent to their Sloan counterparts. All archival data were pipeline-processed by their respective facilities.
The object was identified in archival images either from its non-sidereal motion when more than one image was available on a particular night, or otherwise from comparison with reference images obtained on other nights when the object was not in the field of view.
| Coma | Tail | ||||||||
| UT Date | Telescope | ||||||||
| 2021 Jul 9 | Palomar | 0.470.01 | 0.130.01 | — | 0.560.30 | 0.080.30 | — | ||
| 2021 Jul 9 | FTN | 0.520.02 | 0.030.03 | 0.140.04 | 0.530.30 | 0.270.30 | 0.020.40 | ||
| 2021 Jul 12 | Palomar | 0.420.02 | 0.080.01 | — | 0.490.30 | 0.230.30 | — | ||
| 2021 Jul 13 | FTN | 0.470.02 | 0.130.03 | 0.050.04 | 0.450.30 | 0.160.30 | 0.010.40 | ||
| 2021 Jul 15 | FTN | 0.500.02 | 0.100.03 | 0.030.04 | 0.510.30 | 0.190.30 | 0.010.40 | ||
| Mediana | … | 0.470.03 | 0.100.04 | 0.050.05 | 0.510.04 | 0.190.07 | 0.010.01 | ||
| a Median values of computed colors, where standard deviations are used as uncertainties. | |||||||||
3 Results and Analysis
3.1 Data Analysis
Except for data from 2016 July 22, 248370 had a star-like surface brightness profile in all archival images and exhibited no other visible indications of activity. Meanwhile, in all 2021 observations, the object exhibited a long, straight dust tail oriented along the coincident antisolar and negative heliocentric velocity vector directions as projected on the sky. In our best composite image from UT 2021 July 12, the tail was seen extending from the nucleus (Figure 1f), corresponding to a physical extent of 720,000 km at the geocentric distance of the comet. Minimal coma was present in all images, with full-width at half-maximum (FWHM) measurements of the nucleus’s surface brightness profile measured in the direction perpendicular to the dust tail nearly identical to FWHM measurements, , of field star profiles (listed in Table 1), measured in the direction perpendicular to their trailing due to non-sidereal tracking. We did however find the half-width at half-maximum (HWHM) of the object’s profile measured along the sunward direction directly opposite the dust tail to be 10% larger than stellar HWHM values.
To maximize signal-to-noise ratios (S/N) for sets of observations where more than one image was obtained in the same filter in a night, we constructed composite images by shifting and aligning individual images in each filter on the object’s photocenter using linear interpolation, and adding them together. Representative single or composite images are shown in Figure 1.
For photometry of all data, measurements of 248370 and 10-30 nearby reference stars were performed using IRAF software (Tody, 1986, 1993), with absolute calibration performed using field star magnitudes in Sloan bandpasses derived from the RefCat2 all-sky catalog (which uses the PS1 photometric system; Tonry et al., 2018b). Nucleus or near-nucleus coma photometry of 248370 was performed using circular apertures with sizes chosen using curve-of-growth analyses when the object appeared inactive, or circular apertures with fixed radii equivalent to 5000 km at the geocentric distance of the object when it was active. For the latter, photometry aperture radii, , were determined from convolving the projected angular equivalent, , of the desired intrinsic distance (i.e., 5000 km) at the geocentric distance of the comet with the FWHM seeing, , on a given night using
| (1) |
where for most of our observations. Background statistics for comet photometry were measured in nearby regions of blank sky to avoid dust contamination from the object or nearby field stars.
We also measured the surface brightnesses of 248370’s dust tail on each night by rotating composite images to make the dust tail horizontal in each image frame, measuring net fluxes in rectangular apertures placed along the length of each tail, and converting those fluxes to surface brightnesses in mag arcsec-2 using the measured mean magnitudes of the nucleus for data comprising each composite image for absolute photometric calibration. We chose rectangular apertures that extended 750 km above and below the tail’s central axis in the vertical direction (i.e., in total height for most of our observations) and from 5000 km to 15000 km (i.e., from to for most of our observations) from the nucleus in the horizontal direction, where the angular sizes of these apertures were computed in the same manner described earlier for near-nucleus photometry apertures. The details of this method of measuring surface brightnesses were chosen to maximize signal-to-noise while also minimizing nucleus flux contribution by focusing on the bright central core of the tail, and measuring close, but not too close, to the nucleus where the tail is brightest.
3.2 Nucleus Properties
Using measured apparent magnitudes of 248370 from archival data, we derive magnitudes normalized to au and , or , by assuming inverse-square-law fading and IAU phase function behavior (Bowell et al., 1989) where (Table 2). We then take medians of these computed values to estimate absolute magnitudes in each filter. We estimate 248370’s absolute magnitudes to be , , , and (Table 2), corresponding to nucleus colors of , , and , which within uncertainties, are effectively solar (e.g., Holmberg et al., 2006). These colors are consistent with a C-type taxonomic classification (see DeMeo & Carry, 2013), which is the most likely classification expected for an outer main belt asteroid like 248370, but large uncertainties on the colors derived here from sparse archival data mean that other taxonomic types cannot necessarily be excluded at this time. Using (Jordi et al., 2006), we find an equivalent -band absolute magnitude of .
Using
| (2) |
where we use (Mainzer et al., 2019) for the object’s -band albedo and for the apparent -band magnitude of the Sun (Hardorp, 1980), we find an effective nucleus radius of km, or slightly smaller than the radius computed by Mainzer et al. (2019).
The ranges in computed absolute magnitudes in each filter are mag, mag, mag, and . These values are not particularly meaningful given the small number of data points used to derive them, but in the present absence of better measurements, they suggest that 248370’s photometric range due to rotation is mag, implying a minimum axis ratio of .
3.3 Activity Properties
3.3.1 Dust Composition
We find mean coma colors of , , and and mean dust tail colors of , , and (Table 3). Within uncertainties, coma and dust tail colors are comparable to one another, indicating that both are dominated by dust of similar composition with no apparent color gradient with distance from the nucleus that might indicate the presence of a significant near-nucleus gas coma. The apparent compositional similarity of coma and tail dust also means that we see no evidence of grain fragmentation or loss of icy grains to sublimation that could cause overall color changes to observed dust. The colors of both are also similar within uncertainties to colors found for the bare nucleus (Section 3.2), suggesting that the dust coma and tail are compositionally similar to the nucleus’s surface regolith.
3.3.2 Activity Strength and Evolution
From our calculations of 248370’s absolute magnitudes (Section 3.2), we find that the near-nucleus region of the object was 0.5 mag brighter than expected for the inactive nucleus on 2016 July 22 and 1 mag brighter than expected in 2021 (Table 1). We also compute the ratios, , of the scattering cross-sections of ejected near-nucleus dust within our 5000 km photometry apertures and the underlying nucleus when 248370 was active using
| (3) |
(e.g., Hsieh et al., 2021). We find on 2016 July 22, and in 2021 (Table 1).
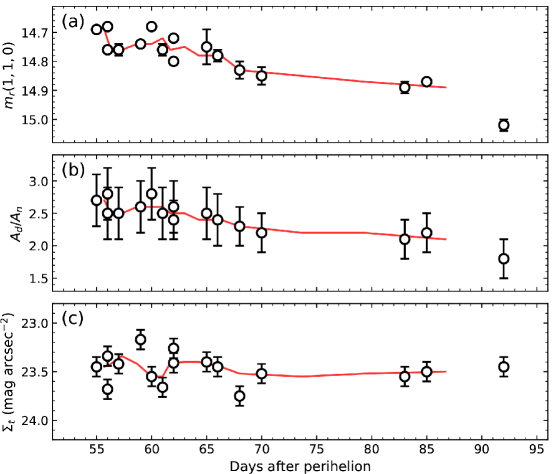
Plotting and as functions of time, we see that the coma faded during our 2021 observations (Figures 2a and 2b), declining in intrinsic brightness by 0.35 mag (or 25%) in 37 days. Increasing activity strength would suggest ongoing dust production, and therefore the action of a prolonged, possibly sublimation-driven, emission event. However, declining activity strength does not necessarily rule out a sublimation-driven emission event, especially at the relatively gradual rate (0.01 mag/day) seen for 248370, similar to the rate of fading of the coma of confirmed recurrently active MBC 259P/Garradd (Hsieh et al., 2021) of 0.015 mag/day observed after its discovery in 2008 (Jewitt et al., 2009).
Despite the fading of 248370’s coma, the dust tail remained relatively consistent in brightness during our observations (Table 1; Figure 2c), suggesting that the tail may consist of larger particles on average than the coma. Larger particles in the tail would be dissipated by radiation pressure more slowly than presumably smaller particles in the coma, which would explain the slower fading of the tail to apparently weakening dust production from the nucleus.
For reference, we also compute values (hereafter, ), which are nominally independent of photometry aperture sizes for observations of comae with radial profiles, and are given by
| (4) |
(A’Hearn et al., 1984), where is in au, is in cm, is the physical radius in cm of the photometry aperture at the geocentric distance of the comet, is the Sun’s apparent magnitude in the specified filter (using , , , and ; Hardorp, 1980; Jordi et al., 2006; Holmberg et al., 2006), and is the phase-angle-normalized (to ) magnitude of the excess dust mass of the comet (i.e., with the flux contribution of the nucleus subtracted out). These results are tabulated in Table 1, where we see fading behavior similar to that seen for and .
3.3.3 Dust Ejection Parameter Constraints
Dust grains ejected sunward with a terminal ejection velocity of are turned back by solar radiation pressure on a distance scale given by
| (5) |
(Jewitt & Meech, 1987), where is the heliocentric distance in au, m s-2 is the gravitational acceleration to the Sun at 1 au, and is the ratio of the acceleration experienced by a particle due to solar radiation pressure to the local acceleration due to solar gravity (Burns et al., 1979). Comet dust modeling analyses commonly use to represent particle sizes, where gives approximate corresponding dust particle radii, , in m.
On UT 2021 July 12, we measure a HWHM value for the sunward portion of the coma of , while nearby field stars had HWHM values of . Using an analogous form of Equation 1 to compute an inferred intrinsic half-width of the coma, , in the absence of atmospheric seeing, we find , or 400 km at the geocentric distance of the object. Using km, Equation 5 gives m s-1, or about half the ejection velocities found for 133P/Elst-Pizarro (Jewitt et al., 2014), another MBC very similar in morphology to 248370.
Analyzing the composite image for UT 2021 July 12, we measure a median FWHM of for the dust tail over the of the tail closest to the nucleus, as measured in intervals of 20 pixels () along the tail. The tail’s FWHM flares slightly from close to the nucleus to at from the nucleus. Using Equation 1, we find an intrinsic median tail FWHM of , corresponding to a physical projected width of 1100 km in the plane of the sky. The narrowness of the tail is consistent with low dust ejection velocities, and similar to that found for 133P (Hsieh et al., 2004).
Performing a simple (zero-ejection velocity) dust modeling analysis using the online Comet Toolbox666http://comet-toolbox.com/FP.html, we find that particles with (or m) would take 20 days to reach an apparent angular separation from the nucleus of 9′ (the visible length of the tail on UT 2021 July 12; Figure 1f). Meanwhile, particles with , , and (or m, m, and mm), which span the range of particle sizes found for other MBCs (e.g., Hsieh et al., 2009; Licandro et al., 2013; Jewitt et al., 2014), would take 60, 150, and 430 days, respectively, to reach the same apparent separation. Without additional particle size constraints at the present time, however, we are unable to meaningfully constrain the likely ejection times of the most distant dust grains in 248370’s tail. We note that if activity began when 248370 was at (the earliest activation point confirmed to date for a MBC; Hsieh & Sheppard, 2015), which the object passed on 2020 October 22, particles as large as m () would have been able to reach a separation from the nucleus by 2021 July 12.
3.4 Future Work
The discovery that 248370 is recurrently active near perihelion strongly suggests that sublimation is a primary driver of its activity, although it does not rule out other processes that could also contribute to the current observed activity or may have triggered it. In particular, the slow terminal velocities inferred for ejected dust grains (Section 3.3.3) suggest that rapid rotation, nucleus elongation, or both could be acting to reduce or negate the effective gravity felt by dust particles at certain locations on the nucleus surface, allowing even extremely large particles to be ejected, similar to what may be occurring on 133P (Jewitt et al., 2014). As such, measurement of 248370’s rotational period and nucleus shape, as well as its taxonomic type, should be considered a high priority once its current activity ends. Continued monitoring of 248370’s current activity is also highly encouraged to enable further characterization of the object’s fading behavior, which can help constrain the dust grain size distribution.
A detailed dynamical analysis of 248370 is outside the scope of this paper, but should also be performed in the near future. Issues to consider include whether the object can be linked to any dynamical asteroid families (e.g., Hsieh et al., 2018), its long-term dynamical stability and whether it may be an implanted object (e.g., Hsieh & Haghighipour, 2016), and whether it follows dynamical trends found for previously discovered MBCs (Kim et al., 2018).
In the long term, 248370 will be well-placed for monitoring during the approach to its next perihelion passage on UT 2026 September 3. It becomes observable from the Southern Hemisphere in 2026 February at , i.e., the earliest activation point confirmed to date for a MBC, as discussed earlier. Monitoring during this time will be extremely valuable for further confirming the recurrent nature of 248370’s activity, constraining the orbital range over which activity occurs (with implications for constraining ice depth on the object, as well as its active lifetime), measuring initial dust production rates, and comparing the object’s activity levels from one orbit to another as well as to other MBCs.
References
- A’Hearn et al. (1984) A’Hearn, M. F., Schleicher, D. G., Millis, R. L., Feldman, P. D., & Thompson, D. T. 1984, AJ, 89, 579
- Astropy Collaboration et al. (2018) Astropy Collaboration, Price-Whelan, A. M., Sipőcz, B. M., et al. 2018, AJ, 156, 123
- Bida et al. (2014) Bida, T. A., Dunham, E. W., Massey, P., & Roe, H. G. 2014, in Proc. SPIE, Vol. 9147, Ground-based and Airborne Instrumentation for Astronomy V, 91472N
- Boulade et al. (2003) Boulade, O., Charlot, X., Abbon, P., et al. 2003, in Proc. SPIE, Vol. 4841, Instrument Design and Performance for Optical/Infrared Ground-based Telescopes, 72–81
- Bowell et al. (1989) Bowell, E., Hapke, B., Domingue, D., et al. 1989, in Asteroids II, 524–556
- Brown et al. (2013) Brown, T. M., Baliber, N., Bianco, F. B., et al. 2013, PASP, 125, 1031
- Burns et al. (1979) Burns, J. A., Lamy, P. L., & Soter, S. 1979, Icarus, 40, 1
- Chambers et al. (2016) Chambers, K. C., Magnier, E. A., Metcalfe, N., et al. 2016, ArXiv e-prints, arXiv:1612.05560
- Chandler et al. (2021) Chandler, C. O., Trujillo, C. A., & Hsieh, H. H. 2021, Central Bureau Electronic Telegrams, 5005, 1
- DeMeo & Carry (2013) DeMeo, F. E., & Carry, B. 2013, Icarus, 226, 723
- Fitzsimmons et al. (2021) Fitzsimmons, A., Erasmus, N., Thirouin, A., Hsieh, H. H., & Green, D. W. E. 2021, Central Bureau Electronic Telegrams, 4995, 1
- Flaugher et al. (2015) Flaugher, B., Diehl, H. T., Honscheid, K., et al. 2015, AJ, 150, 150
- Flewelling et al. (2020) Flewelling, H. A., Magnier, E. A., Chambers, K. C., et al. 2020, ApJS, 251, 7
- Ginsburg et al. (2019) Ginsburg, A., Sipőcz, B. M., Brasseur, C. E., et al. 2019, AJ, 157, 98
- Gwyn et al. (2012) Gwyn, S. D. J., Hill, N., & Kavelaars, J. J. 2012, PASP, 124, 579
- Hardorp (1980) Hardorp, J. 1980, A&A, 91, 221
- Holmberg et al. (2006) Holmberg, J., Flynn, C., & Portinari, L. 2006, MNRAS, 367, 449
- Hsieh & Haghighipour (2016) Hsieh, H. H., & Haghighipour, N. 2016, Icarus, 277, 19
- Hsieh et al. (2021) Hsieh, H. H., Ishiguro, M., Knight, M. M., et al. 2021, Planet. Sci. J., 2, 62
- Hsieh & Jewitt (2006) Hsieh, H. H., & Jewitt, D. 2006, Science, 312, 561
- Hsieh et al. (2009) Hsieh, H. H., Jewitt, D., & Ishiguro, M. 2009, AJ, 137, 157
- Hsieh et al. (2004) Hsieh, H. H., Jewitt, D. C., & Fernández, Y. R. 2004, AJ, 127, 2997
- Hsieh et al. (2018) Hsieh, H. H., Novaković, B., Kim, Y., & Brasser, R. 2018, AJ, 155, 96
- Hsieh & Sheppard (2015) Hsieh, H. H., & Sheppard, S. S. 2015, MNRAS, 454, L81
- Hsieh et al. (2012) Hsieh, H. H., Yang, B., & Haghighipour, N. 2012, ApJ, 744, 9
- Jewitt et al. (2015) Jewitt, D., Hsieh, H., & Agarwal, J. 2015, Asteroids IV (Tucson, University of Arizona Press), 221–241
- Jewitt et al. (2014) Jewitt, D., Ishiguro, M., Weaver, H., et al. 2014, AJ, 147, 117
- Jewitt et al. (2009) Jewitt, D., Yang, B., & Haghighipour, N. 2009, AJ, 137, 4313
- Jewitt & Meech (1987) Jewitt, D. C., & Meech, K. J. 1987, ApJ, 317, 992
- Jordi et al. (2006) Jordi, K., Grebel, E. K., & Ammon, K. 2006, A&A, 460, 339
- Kelley et al. (2021) Kelley, M. S. P., Bolin, B. T., Buzzi, L., et al. 2021, Central Bureau Electronic Telegrams, 4998, 1
- Kim et al. (2018) Kim, Y., JeongAhn, Y., & Hsieh, H. H. 2018, AJ, 155, 142
- Levine et al. (2012) Levine, S. E., Bida, T. A., Chylek, T., et al. 2012, in Society of Photo-Optical Instrumentation Engineers (SPIE) Conference Series, Vol. 8444, Ground-based and Airborne Telescopes IV, ed. L. M. Stepp, R. Gilmozzi, & H. J. Hall, 844419
- Licandro et al. (2013) Licandro, J., Moreno, F., de León, J., et al. 2013, A&A, 550, A17
- Mainzer et al. (2019) Mainzer, A. K., Bauer, J. M., Cutri, R. M., et al. 2019, NASA Planetary Data System, urn:nasa:pds:neowise_diameters_albedos::2.0, doi:10.26033/18S3-2Z54
- McCully et al. (2018) McCully, C., Volgenau, N. H., Harbeck, D.-R., et al. 2018, in Society of Photo-Optical Instrumentation Engineers (SPIE) Conference Series, Vol. 10707, Software and Cyberinfrastructure for Astronomy V, ed. J. C. Guzman & J. Ibsen, 107070K
- Narita et al. (2020) Narita, N., Fukui, A., Yamamuro, T., et al. 2020, in Society of Photo-Optical Instrumentation Engineers (SPIE) Conference Series, Vol. 11447, Society of Photo-Optical Instrumentation Engineers (SPIE) Conference Series, 114475K
- Nikzad et al. (2017) Nikzad, S., Jewell, A. D., Hoenk, M. E., et al. 2017, Journal of Astronomical Telescopes, Instruments, and Systems, 3, 036002
- Tody (1986) Tody, D. 1986, in Proc. SPIE, Vol. 627, Instrumentation in Astronomy VI, 733
- Tody (1993) Tody, D. 1993, in Astronomical Society of the Pacific Conference Series, Vol. 52, Astronomical Data Analysis Software and Systems II, 173
- Tonry et al. (2018a) Tonry, J. L., Denneau, L., Heinze, A. N., et al. 2018a, PASP, 130, 064505
- Tonry et al. (2018b) Tonry, J. L., Denneau, L., Flewelling, H., et al. 2018b, ApJ, 867, 105
- van Dokkum (2001) van Dokkum, P. G. 2001, PASP, 113, 1420
- van Dokkum et al. (2012) van Dokkum, P. G., Bloom, J., & Tewes, M. 2012, L.A.Cosmic: Laplacian Cosmic Ray Identification, , , ascl:1207.005
- Vincent (2014) Vincent, J. 2014, in Asteroids, Comets, Meteors 2014, ed. K. Muinonen, A. Penttilä, M. Granvik, A. Virkki, G. Fedorets, O. Wilkman, & T. Kohout
- Wolf et al. (2018) Wolf, C., Onken, C. A., Luvaul, L. C., et al. 2018, PASA, 35, e010