Topology of Orientational Defects in Confined Smectic Liquid Crystals
Abstract
We propose a general formalism to characterize orientational frustration of smectic liquid crystals in confinement by interpreting the emerging networks of grain boundaries as objects with a topological charge. In a formal idealization, this charge is distributed in pointlike units of quarter-integer magnitude, which we identify with tetratic disclinations located at the end points and nodes. This coexisting nematic and tetratic order is analyzed with the help of extensive Monte Carlo simulations for a broad range of two-dimensional confining geometries as well as colloidal experiments, showing how the observed defect networks can be universally reconstructed from simple building blocks. We further find that the curvature of the confining wall determines the anchoring behavior of grain boundaries, such that the number of nodes in the emerging networks and the location of their end points can be tuned by changing the number and smoothness of corners, respectively.
Topological defects are ubiquitous in ordered states of matter Chaikin and Lubensky (1995); Mermin (1979); Kibble (1976); Moor et al. (2014); Liu et al. (2019) and thus also emerge as a characteristic feature of liquid crystals de Gennes and Prost (1993); Kleman and Lavrentovich (2003); Alexander et al. (2012); Sentker et al. (2018); Čopar et al. (2013); Radzihovsky (2020), which exhibit various degrees of positional and orientational ordering de Gennes and Prost (1993); Teerakapibal et al. (2018); Bolhuis and Frenkel (1997); Mederos et al. (2014); Wittmann et al. (2017); Dussi et al. (2018); Peters et al. (2020). Frustrated orientational order in nematic liquid crystals typically manifests itself in the form of singular points or lines. Defects of this type may spontaneously form and annihilate in bulk due to fluctuations Crawford and Zumer (1996), external influences such as electromagnetic fields Reznikov et al. (2000); Gu and Abbott (2000); Stark (2002); Cladis et al. (1987); Link et al. (1996), changes in temperature Ohzono and Fukuda (2012); Muzny and Clark (1992) or active motion Shi and Ma (2013); Narayan et al. (2007); Chardac et al. (2021). In these processes, the defect strength, quantified by a half-integer topological charge , is subject to a universal conservation law Fulton (1995); Senyuk et al. (2013). The formation of topological defects can further be triggered in a controlled manner through confining the particles Lavrentovich (1986, 1998); Kim et al. (2013); Dammone et al. (2012); Manyuhina et al. (2015); Dzubiella et al. (2000); Trukhina and Schilling (2008); Varga et al. (2014); Brumby et al. (2017); Lewis et al. (2014); Kralj and Majumdar (2014); Majumdar and Lewis (2016); Gârlea et al. (2016); Kurik and Lavrentovich (1988); Yao and Chen (2020); Basurto et al. (2020); Kil et al. (2020) or inserting an obstacle Poulin et al. (1997); Ruhwandl and Terentjev (1997); Andrienko et al. (2001); Čopar et al. (2012); Ilnytskyi et al. (2014); Püschel-Schlotthauer et al. (2017); Senyuk et al. (2016); Chen et al. (2018). In this case, the precise type, number, and location of defects depend on the particular geometry Araki et al. (2013); Campbell et al. (2014); Gârlea et al. (2019) and particle properties Gârlea et al. (2016); van Anders et al. (2014); Alvarado et al. (2014); Chiappini et al. (2019); Revignas and Ferrarini (2020), due to a delicate balance between elastic distortions and surface anchoring.

The characteristic positional order of smectic liquid crystals breaks the symmetry of the homogeneous nematic phase and affects the elastic properties de Gennes and Prost (1993); Lagerwall and Giesselmann (2006). The constraints associated with the layer structure Poénaru (1981); Mosna et al. (2012) stabilize distortions of the bulk smectic lattice Chen et al. (2009); Machon et al. (2019) which do not exist in nematic liquid crystals de Gennes and Prost (1993). These include purely positional defects called edge dislocations Meyer et al. (1978); Chen and Lu (2011); Zhang et al. (2015); Kamien and Mosna (2016) but also more complex objects like focal conic domains Kléman and Lavrentovich (2000); Bramble et al. (2007); Kim et al. (2009); Liarte et al. (2016). In many cases, orientational frustration in smectic phases can be well described in terms of topological defects in the nematic order that is inherent to the symmetry of the smectic phase. However, in the paradigmatic case of confined two-dimensional lyotropic systems, the formation of grain boundaries largely dominates over strong elastic deformations Geigenfeind et al. (2015); Cortes et al. (2017); Wittmann et al. (2021). At these grain boundaries, the nematic order present in the bulk smectic phase breaks down, hindering a classification of the emerging orientational patterns in terms of nematic topology alone.
In this Letter, we demonstrate that extremely confined smectic systems can be effectively described in terms of topological defects in the tetratic order due to the strong preference of smectic layers to tilt at a grain boundary by approximately . The tetratic topology is thus not only important in systems with tetratic bulk symmetry Li et al. (2013); Narayan et al. (2006); González-Pinto et al. (2017); Armas et al. (2020) but also a vital ingredient to a comprehensive picture of frustrated smectics. In detail, we identify quarter-integer tetratic disclinations, which materialize in pairs at the extremities of grain boundaries, as the elementary topological unit of smectic liquid crystals. In turn, the notion of a nematic disclination expands to a spatially extended defect structure whose half-integer charge follows from the sum of its tetratic components, thereby acting as a spatial charge distribution, as exemplified in Fig. 1. To unveil the full implications of coexisting nematic and tetratic order, we use particle-resolved computer simulations and colloidal experiments on hard rods to create different defect structures in a large range of two-dimensional geometries. Defining the grain boundaries connecting different types of tetratic disclinations as fundamental building blocks, we provide the basic toolbox to characterize the more complex smectic defect networks emerging in the presence of multiple corners, as illustrated in Fig. 2. Thereby, our approach visualizes the topological charge conservation for both individual tetratic point defects and defect networks with nematic charge , whose typical connectivity depends on the curvature landscape of the confining wall.


To create the smectic structures for each confinement, we perform canonical Monte Carlo (MC) simulations on hard discorectangles Vega and Lago (1994) of aspect ratio within two-dimensional cavities, bounded by WCA-like soft walls Andersen et al. (1972); Metropolis et al. (1953), see Supplemental Material SI . We randomly initialize the system at a low area fraction . The system is quickly compressed at a rate of per MC cycle to an area fraction , where the isotropic-nematic transition is expected Bates and Frenkel (2000). We subsequently compress the system at a lower rate per MC cycle until the system reaches the target area fraction of and exhibits smectic order. This protocol ensures that the system is close to equilibrium at all times. After equilibration, we use cluster analysis to identify domains with different orientational order and generate statistics. For each state, we determine local nematic and tetratic order parameter fields to identify the composition of topological defects SI .

On the experimental side, we analyze smectic structures emerging at the bottom of tailored cavities at sedimentation-diffusion equilibrium of colloidal silica rods Cortes et al. (2017). The synthetic rods Kuijk et al. (2012) have a small polydispersity in length and diameter.They are dispersed into a mM NaCl aqueous solution Wittmann et al. (2021), which leads to a short-ranged repulsion and effective hard-rod-like interactions. The degenerate planar anchoring at the bottom wall allows us to capture images of quasi-two-dimensional smectic states in the horizontal plane. Using bright-field microscopy with an objective of high numerical aperture, we can discriminate most rods and thus determine the local order.
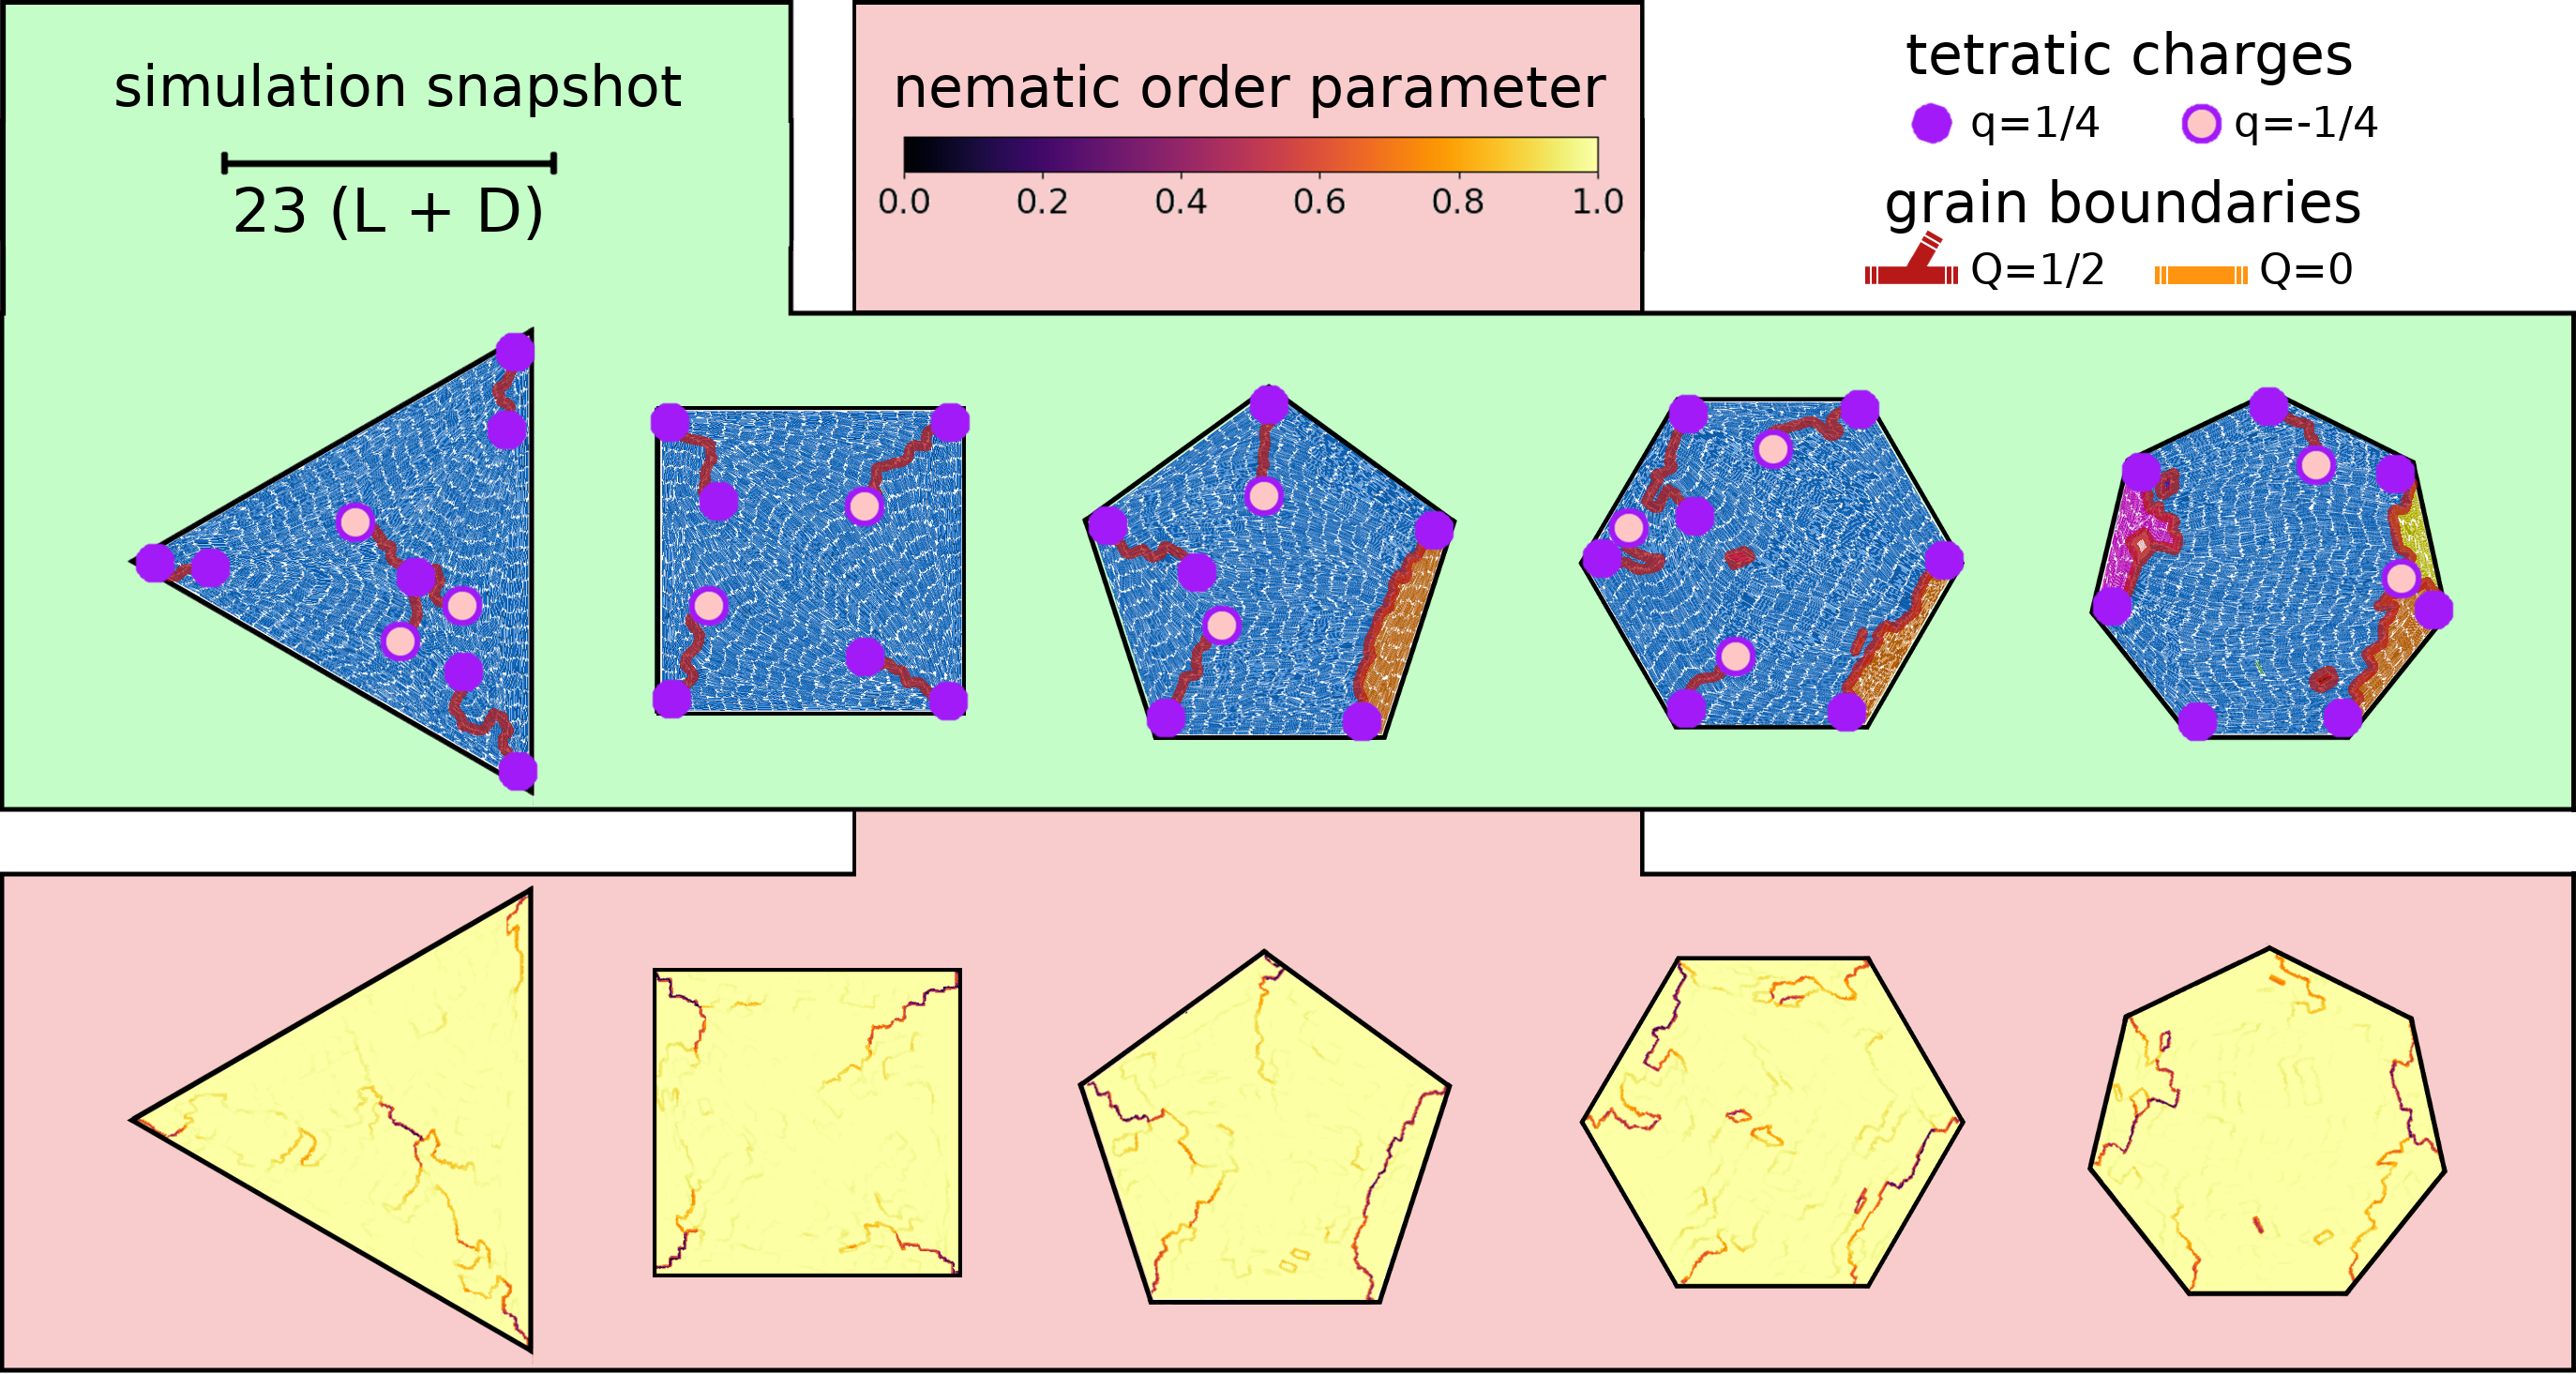
Our numerical observations are summarized in Fig. 3. The common feature of all structures is a large, defect-free central domain, characteristic for the bridge state Geigenfeind et al. (2015); Cortes et al. (2017); Wittmann et al. (2021). The detailed appearance of the topological defects, however, sensitively depends on the confining geometry. To verify that the overall topology is universal, we decorate SI all representative snapshots with a defect structure assembled from the building blocks in Fig. 2. By doing so, we recognize in each system in Fig. 3 two separate grain-boundary networks representing a charge each, while the remaining defects do not carry any nematic charge as a whole. The intriguing dependence of the emerging defect networks on the geometric properties of the confining wall can be perceived according to the schematic cycle in Fig. 2, as laid out in the following three paragraphs.
The most common defects are linear grain boundaries of the general type , which we further discriminate by the location of the two positively charged tetratic end points, cf. Fig. 2. The circular cavity in Fig. 3 typically features two opposing bulk defects of subtype , i.e., both end points possessing isolated tetratic signals are detached from the wall. Therefore, the orientation of rods around the perimeter changes continuously and all particles within the system belong to a single domain. Upon switching from the uniformly curved circular confinement to different polygons, the grain boundaries usually extend towards the corners, such that the tetratic defects anchor at the wall. The invariance of our topological picture can be illustrated by considering confinements with smooth corners SI . The example of a rounded equilateral triangle in Fig. 3 indicates that one grain boundary turns into a true domain boundary, i.e., a type- defect, as both its end points move towards two of the three corners. The second grain boundary gradually turns into a type- defect, as one end point attaches with the remaining corner and the other end extends into the center of the large domain. This structure is most pronounced in the limit of sharp corners. We further observe that a grain boundary of type gradually contracts to a point defect upon decreasing the opening angle SI . Turning to a square cavity in Fig. 3, the additional corner can accommodate the loose end point of the type- defect, resulting in the eponymous bridge structure Cortes et al. (2017); Geigenfeind et al. (2015) with two parallel type- domain boundaries, as in circular confinement, but with perfect tetratic bulk order.

Following in Fig. 3 a sequence of geometries represented by regular polygons, the increasing number of charges at each corner is compensated accordingly by negative bulk charges. We thus introduce an additional type- building block representing a pair of tetratic charges. This overall charge-neutral object with either occurs on its own (at edge dislocations in the bulk or attached to a single corner) or attaches with its negative end to other building blocks, forming a large network of grain boundaries, cf. Fig. 2. In particular, the pentagon can accommodate an individual type- defect in addition to the two type- domain boundaries also found in square confinement (notice the difference with the free-standing type- defect with in the triangle). The hexagon typically features two parallel type- networks, each separating two small domains from the central bridging layers and resembling a type- defect, like in the square, with an attached type- defect emerging from the additional corner in the middle.
The addition of further corners allows for the formation of complex type- networks, which contain nodes with and branches ending on a charge. The typical defect structure, however, gradually reverts to that in circular confinement, closing the cycle in Fig. 2. The defect networks in Fig. 3 thus detach from the confining wall, as adjacent pairs of opposite tetratic charges annihilate. Grain boundaries between pairs of defects close to annihilation typically induce only a small tilt between smectic layers, such that their nematic signal weakens and qualitatively resembles the tetratic signal (contrast, e.g., the free-standing type- defects in the pentagon and heptagon). In general, the degree of the annihilation increases with increasing opening angle at the corners SI .
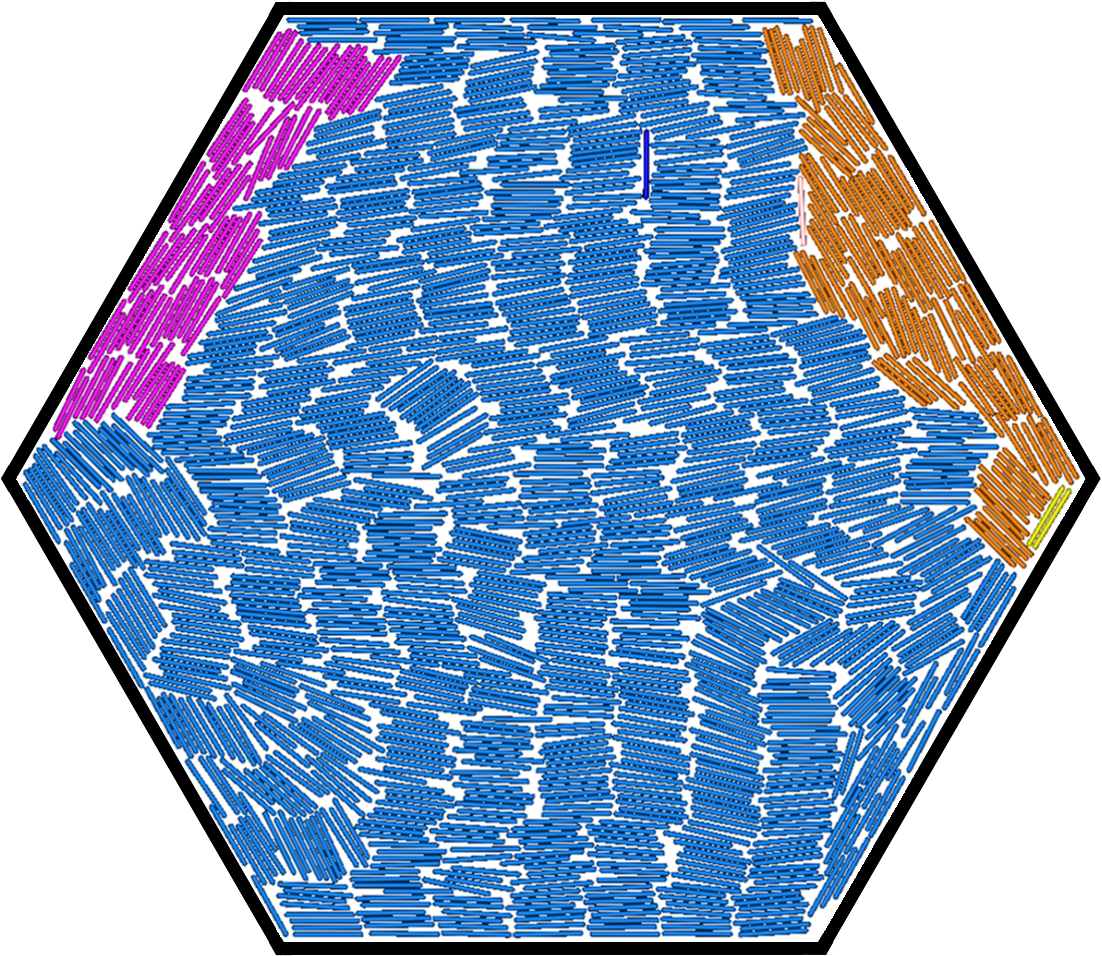
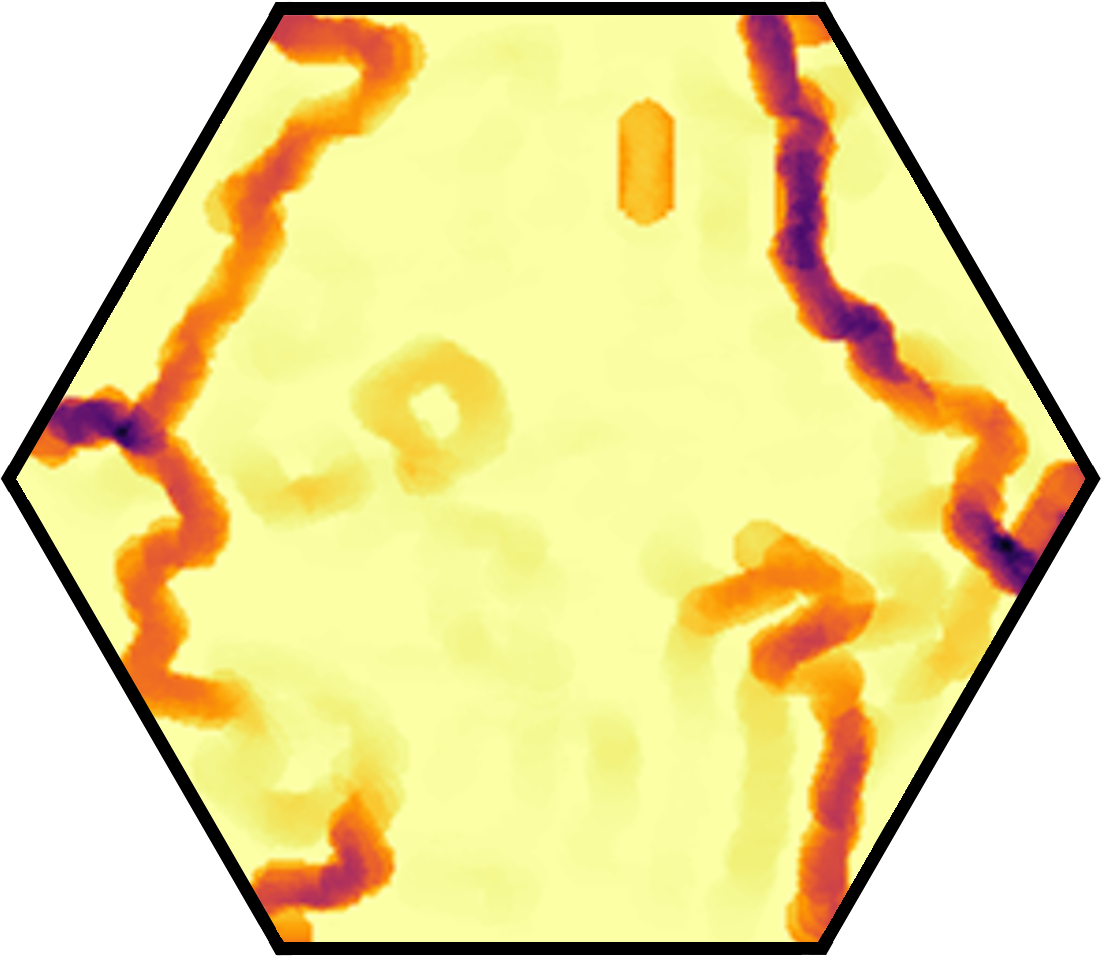
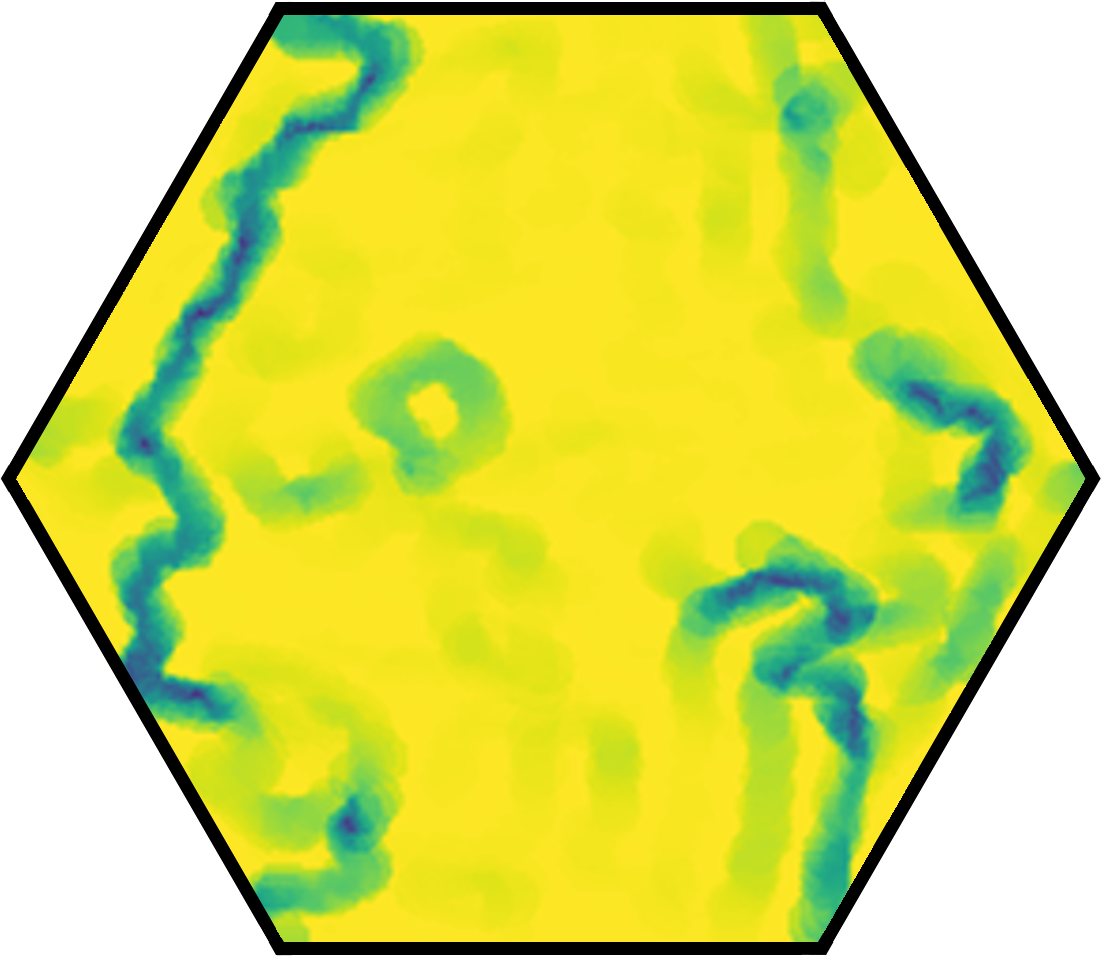
To demonstrate the experimental relevance of our classification scheme, we analyze in Fig. 4 microscopy images of colloidal rods for their orientational order, here focusing on a hexagonal domain. The experimental defect networks are typically less complex than those in the pure hard-rod simulations SI , due to the higher elasticity of the smectic layers. Nonetheless, the defect networks found consist of the same fundamental building blocks, confirming the broad applicability of our approach. Additionally, our simulation results match the previously reported experiments in square Cortes et al. (2017) and circular Wittmann et al. (2021) confinement, and hence the same analysis is directly suitable to those experiments as well.
Beyond the chosen methodology, our topological toolbox can be readily employed to illustrate the coexisting nematic and tetratic orientational order of frustrated smectics in free-energy based theoretical studies Wittmann et al. (2017, 2021, 2016); Pevnyi et al. (2014); Xia et al. (2021), granular experiments Narayan et al. (2006); González-Pinto et al. (2017); Armas et al. (2020) or molecular systems Jeong and Kim (2012); Michel et al. (2006); Coursault et al. (2016). Regarding nonconvex confinements Wittmann et al. (2021) or two-dimensional manifolds Mosna et al. (2012); Allahyarov et al. (2017), our set of building blocks can be supplemented by a line connecting two negative tetratic charges. A generalized approach can shed more light on intersecting surfaces of grain boundaries in three-dimensions. One central implication of our analysis is that the motion of grain boundaries can be tracked through tetratic point defects, providing additional insights into the dynamics of smectics Dhont (1996); Grelet et al. (2008); Kurita et al. (2017); Chiappini et al. (2020) and their nucleation Schilling and Frenkel (2004); Ni et al. (2010); Cuetos et al. (2010), which is particularly interesting for biologically inspired nonequilibrium systems like self-propelled rods Bär et al. (2020); Kumar et al. (2019); Maitra et al. (2020); Bott et al. (2018) or growing bacterial colonies van Holthe tot Echten et al. (2020); You et al. (2021); Copenhagen et al. (2021) as candidates for active smectics.
Finally, we expect that the classification of the fine structure of defects on the length scale of individual particles put forward in this work will be helpful to analyze quenched or undercooled systems, in particular those where the symmetry of an ordered phase is broken by grain boundaries that may still impose a preferred alignment between adjacent domains. One possible example would be fine-grained polycrystals, which are challenging to distinguish from amorphous solids on the single-particle level Zhang and Han (2018). More generally, those methods could lead to a better understanding of defects in complex solids (such as protein Tsekova et al. (2012) or aerosol Dusek et al. (2006) crystals) relevant for photonics Lu et al. (2014), phononics Yi and Youn (2016) and metamaterials Wang et al. (2020).
The authors would like to thank Daniel de las Heras, Axel Voigt, Raphael Wittkowski and Michael te Vrugt for helpful discussions. This work was supported by the German Research Foundation (DFG) within project LO 418/20-2.
P.M. and R.W. contributed equally to this work.
References
- Chaikin and Lubensky (1995) P. M. Chaikin and T. C. Lubensky, Topological defects (Cambridge University Press, 1995), pp. 495–589.
- Mermin (1979) N. D. Mermin, Rev. Mod. Phys. 51, 591 (1979).
- Kibble (1976) T. W. B. Kibble, J. Phys. A 9, 1387 (1976).
- Moor et al. (2014) A. Moor, A. F. Volkov, and K. B. Efetov, Phys. Rev. B 90, 224512 (2014).
- Liu et al. (2019) Y. Liu, Z. Wang, T. Sato, M. Hohenadler, C. Wang, W. Guo, and F. F. Assaad, Nat. Commun. 10, 2658 (2019).
- de Gennes and Prost (1993) P.-G. de Gennes and J. Prost, The Physics Of Liquid Crystals (Clarendon Press, 1993).
- Kleman and Lavrentovich (2003) M. Kleman and O. D. Lavrentovich, Soft Matter Physics - An Introduction (Springer-Verlag, 2003).
- Alexander et al. (2012) G. P. Alexander, B. G.-g. Chen, E. A. Matsumoto, and R. D. Kamien, Rev. Mod. Phys. 84, 497 (2012).
- Sentker et al. (2018) K. Sentker, A. W. Zantop, M. Lippmann, T. Hofmann, O. H. Seeck, A. V. Kityk, A. Yildirim, A. Schönhals, M. G. Mazza, and P. Huber, Phys. Rev. Lett. 120, 067801 (2018).
- Čopar et al. (2013) S. Čopar, N. A. Clark, M. Ravnik, and S. Žumer, Soft Matter 9, 8203 (2013).
- Radzihovsky (2020) L. Radzihovsky, Phys. Rev. Lett. 125, 267601 (2020).
- Teerakapibal et al. (2018) R. Teerakapibal, C. Huang, A. Gujral, M. D. Ediger, and L. Yu, Phys. Rev. Lett. 120, 055502 (2018).
- Bolhuis and Frenkel (1997) P. Bolhuis and D. Frenkel, J. Chem. Phys. 106, 666 (1997).
- Mederos et al. (2014) L. Mederos, E. Velasco, and Y. Martínez-Ratón, J. Phys. Condens. Matter 26, 463101 (2014).
- Wittmann et al. (2017) R. Wittmann, C. E. Sitta, F. Smallenburg, and H. Löwen, J. Chem. Phys. 147, 134908 (2017).
- Dussi et al. (2018) S. Dussi, N. Tasios, T. Drwenski, R. van Roij, and M. Dijkstra, Phys. Rev. Lett. 120, 177801 (2018).
- Peters et al. (2020) V. F. D. Peters, M. Vis, A. G. García, H. H. Wensink, and R. Tuinier, Phys. Rev. Lett. 125, 127803 (2020).
- Crawford and Zumer (1996) G. P. Crawford and S. Zumer, Liquid crystals in complex geometries: formed by polymer and porous networks (CRC Press, 1996).
- Reznikov et al. (2000) Y. Reznikov, O. Ostroverkhova, K. D. Singer, J.-H. Kim, S. Kumar, O. Lavrentovich, B. Wang, and J. L. West, Phys. Rev. Lett. 84, 1930 (2000).
- Gu and Abbott (2000) Y. Gu and N. L. Abbott, Phys. Rev. Lett. 85, 4719 (2000).
- Stark (2002) H. Stark, Phys. Rev. E 66, 032701 (2002).
- Cladis et al. (1987) P. E. Cladis, W. van Saarloos, P. L. Finn, and A. R. Kortan, Phys. Rev. Lett. 58, 222 (1987).
- Link et al. (1996) D. R. Link, J. E. Maclennan, and N. A. Clark, Phys. Rev. Lett. 77, 2237 (1996).
- Ohzono and Fukuda (2012) T. Ohzono and J.-i. Fukuda, Soft Matter 8, 11552 (2012).
- Muzny and Clark (1992) C. D. Muzny and N. A. Clark, Phys. Rev. Lett. 68, 804 (1992).
- Shi and Ma (2013) X.-Q. Shi and Y.-Q. Ma, Nat. Commun. 4, 3013 (2013).
- Narayan et al. (2007) V. Narayan, S. Ramaswamy, and N. Menon, Science 317, 105 (2007).
- Chardac et al. (2021) A. Chardac, L. A. Hoffmann, Y. Poupart, L. Giomi, and D. Bartolo, Preprint at https://arxiv.org/abs/2103.03861 (2021).
- Fulton (1995) W. Fulton, Algebraic Topology - A First Course (Springer-Verlag, 1995).
- Senyuk et al. (2013) B. Senyuk, Q. Liu, S. He, R. D. Kamien, R. B. Kusner, T. C. Lubensky, and I. I. Smalyukh, Nature 493, 200 (2013).
- Lavrentovich (1986) O. D. Lavrentovich and E. M. Terentjev, Zh. Eksp. Teor. Fiz. 91, 2084 (1986).
- Lavrentovich (1998) O. D. Lavrentovich, Liq. Cryst. 24, 117 (1998).
- Kim et al. (2013) Y.-K. Kim, S. V. Shiyanovskii, and O. D. Lavrentovich, J. Condens. Matter Phys. 25, 404202 (2013).
- Dammone et al. (2012) O. J. Dammone, I. Zacharoudiou, R. P. A. Dullens, J. M. Yeomans, M. P. Lettinga, and D. G. A. L. Aarts, Phys. Rev. Lett. 109, 108303 (2012).
- Manyuhina et al. (2015) O. V. Manyuhina, K. B. Lawlor, M. C. Marchetti, and M. J. Bowick, Soft Matter 11, 6099 (2015).
- Dzubiella et al. (2000) J. Dzubiella, M. Schmidt, and H. Löwen, Phys. Rev. E 62, 5081 (2000).
- Trukhina and Schilling (2008) Y. Trukhina and T. Schilling, Phys. Rev. E 77, 011701 (2008).
- Varga et al. (2014) S. Varga, Y. Martínez-Ratón, and E. Velasco, J. Phys. Condens. Matter 26, 075104 (2014).
- Brumby et al. (2017) P. E. Brumby, H. H. Wensink, A. J. Haslam, and G. Jackson, Langmuir 33, 11754 (2017).
- Lewis et al. (2014) A. H. Lewis, I. Garlea, J. Alvarado, O. J. Dammone, P. D. Howell, A. Majumdar, B. M. Mulder, M. Lettinga, G. H. Koenderink, and D. G. A. L. Aarts, Soft Matter 10, 7865 (2014).
- Kralj and Majumdar (2014) S. Kralj and A. Majumdar, Proc. R. Soc. A 470, 20140276 (2014).
- Majumdar and Lewis (2016) A. Majumdar and A. Lewis, Liq. Cryst. 43, 2332 (2016).
- Gârlea et al. (2016) I. C. Gârlea, P. Mulder, J. Alvarado, O. J. Dammone, D. G. A. L. Aarts, M. P. Lettinga, G. H. Koenderink, and B. M. Mulder, Nat. Commun. 7, 12112 (2016).
- Kurik and Lavrentovich (1988) M. V. Kurik and O. D. Lavrentovich, Sov. Phys. Usp. 31, 196 (1988).
- Yao and Chen (2020) X. Yao and J. Z. Y. Chen, Phys. Rev. E 101, 062706 (2020).
- Basurto et al. (2020) E. Basurto, P. Gurin, S. Varga, and G. Odriozola, Phys. Rev. Research 2, 013356 (2020).
- Kil et al. (2020) K. H. Kil, A. Yethiraj, and J. S. Kim, Phys. Rev. E 101, 032705 (2020).
- Poulin et al. (1997) P. Poulin, V. Cabuil, and D. A. Weitz, Phys. Rev. Lett. 79, 4862 (1997).
- Ruhwandl and Terentjev (1997) R. W. Ruhwandl and E. M. Terentjev, Phys. Rev. E 56, 5561 (1997).
- Andrienko et al. (2001) D. Andrienko, G. Germano, and M. P. Allen, Phys. Rev. E 63, 041701 (2001).
- Čopar et al. (2012) S. Čopar, T. Porenta, V. S. R. Jampani, I. Muševič, and S. Žumer, Soft Matter 8, 8595 (2012).
- Ilnytskyi et al. (2014) J. M. Ilnytskyi, A. Trokhymchuk, and M. Schoen, J. Chem. Phys. 141, 114903 (2014).
- Püschel-Schlotthauer et al. (2017) S. Püschel-Schlotthauer, V. Meiwes Turrión, C. K. Hall, M. G. Mazza, and M. Schoen, Langmuir 33, 2222 (2017).
- Senyuk et al. (2016) B. Senyuk, Q. Liu, Y. Yuan, and I. I. Smalyukh, Phys. Rev. E 93, 062704 (2016).
- Chen et al. (2018) K. Chen, O. J. Gebhardt, R. Devendra, G. Drazer, R. D. Kamien, D. H. Reich, and R. L. Leheny, Soft Matter 14, 83 (2018).
- Araki et al. (2013) T. Araki, F. Serra, and H. Tanaka, Soft Matter 9, 8107 (2013).
- Campbell et al. (2014) M. G. Campbell, M. Tasinkevych, and I. I. Smalyukh, Phys. Rev. Lett. 112, 197801 (2014).
- Gârlea et al. (2019) I. C. Gârlea, O. Dammone, J. Alvarado, V. Notenboom, Y. Jia, G. H. Koenderink, D. G. A. L. Aarts, M. P. Lettinga, and B. M. Mulder, Sci. Rep. 9, 20391 (2019).
- van Anders et al. (2014) G. van Anders, D. Klotsa, N. K. Ahmed, M. Engel, and S. C. Glotzer, Proc. Natl. Acad. Sci. U.S.A. 111, E4812 (2014).
- Alvarado et al. (2014) J. Alvarado, B. M. Mulder, and G. H. Koenderink, Soft Matter 10, 2354 (2014).
- Chiappini et al. (2019) M. Chiappini, T. Drwenski, R. van Roij, and M. Dijkstra, Phys. Rev. Lett. 123, 068001 (2019).
- Revignas and Ferrarini (2020) D. Revignas and A. Ferrarini, Phys. Rev. Lett. 125, 267802 (2020).
- Lagerwall and Giesselmann (2006) J. P. F. Lagerwall and F. Giesselmann, Chem. Phys. Chem. 7, 20 (2006).
- Poénaru (1981) V. Poénaru, Commun. Math. Phys. 80, 127 (1981).
- Mosna et al. (2012) R. A. Mosna, D. A. Beller, and R. D. Kamien, Phys. Rev. E 86, 011707 (2012).
- Chen et al. (2009) B. G.-g. Chen, G. P. Alexander, and R. D. Kamien, Proc. Natl. Acad. Sci. U.S.A. 106, 15577 (2009).
- Machon et al. (2019) T. Machon, H. Aharoni, Y. Hu, and R. D. Kamien, Commun. Math. Phys. 372, 525 (2019).
- Meyer et al. (1978) R. B. Meyer, B. Stebler, and S. T. Lagerwall, Phys. Rev. Lett. 41, 1393 (1978).
- Chen and Lu (2011) P. Chen and C.-Y. D. Lu, J. Phys. Soc. Jpn. 80, 094802 (2011).
- Zhang et al. (2015) C. Zhang, A. M. Grubb, A. J. Seed, P. Sampson, A. Jákli, and O. D. Lavrentovich, Phys. Rev. Lett. 115, 087801 (2015).
- Kamien and Mosna (2016) R. D. Kamien and R. A. Mosna, New J. Phys. 18, 053012 (2016).
- Kléman and Lavrentovich (2000) M. Kléman and O. Lavrentovich, European Physical Journal E 2, 47 (2000).
- Bramble et al. (2007) J. P. Bramble, S. D. Evans, J. R. Henderson, T. J. Atherton, and N. J. Smith, Liq. Cryst. 34, 1137 (2007).
- Kim et al. (2009) Y. H. Kim, D. K. Yoon, M.-C. Choi, H. S. Jeong, M. W. Kim, O. D. Lavrentovich, and H.-T. Jung, Langmuir 25, 1685 (2009).
- Liarte et al. (2016) D. B. Liarte, M. Bierbaum, R. A. Mosna, R. D. Kamien, and J. P. Sethna, Phys. Rev. Lett. 116, 147802 (2016).
- Geigenfeind et al. (2015) T. Geigenfeind, S. Rosenzweig, M. Schmidt, and D. de las Heras, J. Chem. Phys. 142, 174701 (2015).
- Cortes et al. (2017) L. B. G. Cortes, Y. Gao, R. P. A. Dullens, and D. G. A. L. Aarts, J. Phys. Condens. Matter 29, 064003 (2017).
- Wittmann et al. (2021) R. Wittmann, L. B. G. Cortes, H. Löwen, and D. G. A. L. Aarts, Nat. Commun. 12, 623 (2021).
- Li et al. (2013) Y. Li, H. Miao, H. Ma, and J. Z. Y. Chen, Soft Matter 9, 11461 (2013).
- Narayan et al. (2006) V. Narayan, N. Menon, and S. Ramaswamy, J. Stat. Mech. 2006, P01005 (2006).
- González-Pinto et al. (2017) M. González-Pinto, F. Borondo, Y. Martínez-Ratón, and E. Velasco, Soft Matter 13, 2571 (2017).
- Armas et al. (2020) A. D.-D. Armas, M. Maza-Cuello, Y. Martínez-Ratón, and E. Velasco, Phys. Rev. Research 2, 033436 (2020).
- (83) eprint See Supplemental Material at [URL will be inserted by publisher] for a detailed description of the physical model, simulation procedure and analysis of the observed topological structures. We also discuss some additional simulation results for different isosceles triangles, triangles with rounded corners and explore the dependence on system size, aspect ratio and density.
- Vega and Lago (1994) C. Vega and S. Lago, Comput. Chem. 18, 55 (1994).
- Andersen et al. (1972) H. C. Andersen, D. Chandler, and J. D. Weeks, J. Chem. Phys. 56, 3812 (1972).
- Metropolis et al. (1953) N. Metropolis, A. W. Rosenbluth, M. N. Rosenbluth, A. H. Teller, and E. Teller, J. Chem. Phys. 21, 1087 (1953).
- Bates and Frenkel (2000) M. A. Bates and D. Frenkel, J. Chem. Phys. 112, 10034 (2000).
- Kuijk et al. (2012) A. Kuijk, D. V. Byelov, A. V. Petukhov, A. van Blaaderen, and A. Imhof, Faraday Discuss. 159, 181 (2012).
- Wittmann et al. (2016) R. Wittmann, M. Marechal, and K. Mecke, J. Phys. Condens. Matter 28, 244003 (2016).
- Pevnyi et al. (2014) M. Y. Pevnyi, J. V. Selinger, and T. J. Sluckin, Phys. Rev. E 90, 032507 (2014).
- Xia et al. (2021) J. Xia, S. MacLachlan, T. J. Atherton, and P. E. Farrell, Phys. Rev. Lett. 126, 177801 (2021).
- Jeong and Kim (2012) J. Jeong and M. W. Kim, Phys. Rev. Lett. 108, 207802 (2012).
- Michel et al. (2006) J.-P. Michel, E. Lacaze, M. Goldmann, M. Gailhanou, M. de Boissieu, and M. Alba, Phys. Rev. Lett. 96, 027803 (2006).
- Coursault et al. (2016) D. Coursault, B. Zappone, A. Coati, A. Boulaoued, L. Pelliser, D. Limagne, N. Boudet, B. H. Ibrahim, A. de Martino, M. Alba, et al., Soft Matter 12, 678 (2016).
- Allahyarov et al. (2017) E. Allahyarov, A. Voigt, and H. Löwen, Soft Matter 13, 8120 (2017).
- Dhont (1996) J. K. G. Dhont, An introduction to dynamics of colloids, vol. 2 (Elsevier, 1996).
- Grelet et al. (2008) E. Grelet, M. P. Lettinga, M. Bier, R. van Roij, and P. van der Schoot, J. Phys. Condens. Matter 20, 494213 (2008).
- Kurita et al. (2017) R. Kurita, S. Mitsui, and H. Tanaka, Phys. Rev. Lett. 119, 108003 (2017).
- Chiappini et al. (2020) M. Chiappini, E. Grelet, and M. Dijkstra, Phys. Rev. Lett. 124, 087801 (2020).
- Schilling and Frenkel (2004) T. Schilling and D. Frenkel, Phys. Rev. Lett. 92, 085505 (2004).
- Ni et al. (2010) R. Ni, S. Belli, R. van Roij, and M. Dijkstra, Phys. Rev. Lett. 105, 088302 (2010).
- Cuetos et al. (2010) A. Cuetos, E. Sanz, and M. Dijkstra, Faraday Discuss. 144, 253 (2010).
- Bär et al. (2020) M. Bär, R. Großmann, S. Heidenreich, and F. Peruani, Annu. Rev. Condens. Matter Phys. 11, 441 (2020).
- Kumar et al. (2019) N. Kumar, R. K. Gupta, H. Soni, S. Ramaswamy, and A. K. Sood, Phys. Rev. E 99, 032605 (2019).
- Maitra et al. (2020) A. Maitra, P. Srivastava, M. C. Marchetti, S. Ramaswamy, and M. Lenz, Phys. Rev. Lett. 124, 028002 (2020).
- Bott et al. (2018) M. C. Bott, F. Winterhalter, M. Marechal, A. Sharma, J. M. Brader, and R. Wittmann, Phys. Rev. E 98, 012601 (2018).
- van Holthe tot Echten et al. (2020) D. van Holthe tot Echten, G. Nordemann, M. Wehrens, S. Tans, and T. Idema, Preprint at https://arxiv.org/abs/2003.10509 (2020).
- You et al. (2021) Z. You, D. J. G. Pearce, and L. Giomi, Sci. Adv. 7, eabf8685 (2021).
- Copenhagen et al. (2021) K. Copenhagen, R. Alert, N. S. Wingreen, and J. W. Shaevitz, Nat. Phys. 17, 211 (2021).
- Zhang and Han (2018) H. Zhang and Y. Han, Phys. Rev. X 8, 041023 (2018).
- Tsekova et al. (2012) D. S. Tsekova, D. R. Williams, and J. Y. Heng, Chem. Eng. Sci. 77, 201 (2012).
- Dusek et al. (2006) U. Dusek, G. Frank, L. Hildebrandt, J. Curtius, J. Schneider, S. Walter, D. Chand, F. Drewnick, S. Hings, D. Jung et al., Science 312, 1375 (2006).
- Lu et al. (2014) L. Lu, J. D. Joannopoulos, and M. Soljačić, Nat. Photonics 8, 821 (2014).
- Yi and Youn (2016) G. Yi and B. D. Youn, Struct. Multidiscip. Optim. 54, 1315 (2016).
- Wang et al. (2020) Y.-F. Wang, Y.-Z. Wang, B. Wu, W. Chen, and Y.-S. Wang, Appl. Mech. Rev. 72 (2020).
Supplemental Material
I Numerical methods
I.1 Model system
We model our system as fluid of hard discorectangles that are defined as rectangles with length and width capped by two half discs with diameter , interacting via pure excluded-volume interaction Vega and Lago (1994). We focus on particles with length-to-width ratio . The coordinates of the particles are defined via their position vectors and orientation vectors , where is the angle of the th particle with an arbitrary fixed axis. The particles are confined within various two dimensional cavities as depicted in Fig. 3 in the main manuscript. To force particles from the outside of the cavity to the inside, we model the interaction of the particles with the walls as a soft cut-off Weeks-Chandler-Anderson (WCA) potential Andersen et al. (1972). To determine the interaction energy of the particles with the walls in our model, we consider the discoidal caps sitting at . Defining the relative positions and of both discs to the walls of the confinement, we compute the wall energy of the th rod as
| (S.1) |
with the potential
| (S.2) |
providing a version, linearized below and thus extended to the outside of the cavity, of the regular WCA-potential
| (S.3) |
where we use the energy scale to mimic nearly hard walls, thereby imposing a bias for planar surface anchoring.
I.2 Simulation procedure
We study systems at constant particle number and constant temperature using standard canonical Monte-Carlo simulations. We define the area fraction of the confined particles as with the area of a hard discorectangle
| (S.4) |
and the area of the confining geometry, assuming hard walls at . We focus on the study of smectic states at an area fraction , where the smectic phase is stable in bulk Wittmann et al. (2017).
Every simulation runs for at least Monte-Carlo cycles. One cycle consists of trial moves where we randomly choose one particle and, by equal probability, either displace it or rotate it. The particles are displaced by changing their - and -coordinates by . Rotation is done by displacing the orientation vector along its orthogonal by and then renormalizing. The whole trial step is accepted with the standard acceptance probability Metropolis et al. (1953) where is the total change in the energy of the system. The rate with which particle trial moves are accepted depends on and . Those quantities are adjusted over the course of the simulation to stabilize the acceptance rate at about .
To obtain the desired high-density states, we initialize our simulation by randomly placing all particles within an augmented confinement, such that the initial area fraction is . We then follow a compression protocol to bring the system slowly to the desired density. This is done at sufficiently low compression rates to allow the system to reach thermodynamic equilibrium at each density. Specifically, the compression procedure is divided into two stages: a first one where we increase the area fraction of by shrinking the confinement with a relatively high compression rate per MC-cycle to an area fraction where nematic ordering starts to occur. This is observed to lie slightly below the area fraction of the isotropic to nematic phase transition Bates and Frenkel (2000). Once the system reaches we reduce the compression rate to per MC cycle and compress further until the desired target area fraction (we typically choose ) is reached and we sample the results. As there is a significant difference between nematic and smectic states in a square cavity, we equilibrated the systems confined to square cavities at compression rates that were slower than those for the other geometries by a factor of four.
I.3 Data analysis
In this section, we define the local quantities, we use characterize the structure of the confined systems. The central quantities to our topological analysis are the nematic
| (S.5) |
and the tetratic
| (S.6) |
orientational order parameters, where the angled brackets denote the average over all particles which intersect a local circle around with radius . and take values in the interval , where denotes low local orientational order and corresponds to high local orientational order. Furthermore we measure the local nematic director angle and tetratic director angle as
| (S.7) |
with and the real part of a complex number. The normalized nematic and tetratic director fields are defined as and , respectively.
To facilitate the identification of grain boundaries and to determine the number of the domains within the confinement, we perform a cluster analysis on the final equilibrated configuration based on the inter-particle distances and the relative orientations. We chose the pairwise domain criterion such that two particles and are assigned to the same domain if the distance of their position vectors is smaller than a threshold and their relative orientation follows the criterion
| (S.8) |
To further identify the fine structure of the system, we draw bonds between neighboring particles that we consider to be in the same smectic layer. For each particle with position and orientation , we also define the vector , which is taken to be perpendicular to . We then consider two possible neighbors: the particle that is closest to the point and the particle that is closest to . By closest, we here mean the distance of the chosen point to any point on the particle’s surface. A chosen particle on each side of particle is now considered a neighbor if
-
1.
, and
-
2.
, and
-
3.
,
where . To ensure symmetry, we remove any bonds from particle to where particle is not bonded to particle .
II Characterizing the topological defect structure
II.1 Topological charge conservation of pointlike nematic bulk and boundary defects
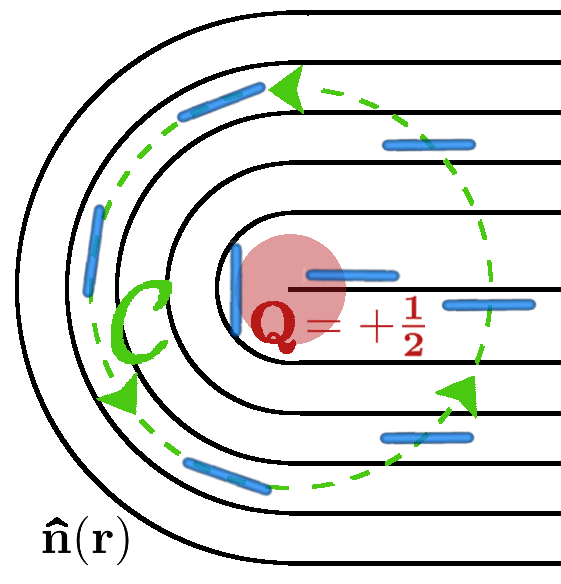
To introduce the fundamental topological concepts relevant to determine and interpret the charge of a defect, we first reiterate the established methods for a fluid with pure nematic symmetry. Nematic orientational order of uniaxial liquid crystals is described by the director field , with the identification , reflecting the apolarity of the particles. To determine the charge of the topological defects emerging in a two-dimensional system, we consider a closed contour with one revolution in counter-clockwise direction, as illustrated in Fig. 1, assuming that does not pass any points or regions with a discontinuous . Hence, the local orientation of the director will always return to its initial value, when traversing once along a given from any starting point. This results in the topological charge , defined as the number of revolutions of the director relative to those of , being always a multiple of , see Fig. 1a for an example with . Introducing a parametrization of the contour , the topological charge can be explicitly calculated according to Kleman and Lavrentovich (2003); Lavrentovich (1998)
| (S.9) |
where . Since takes only discrete values but must change continuously whilst continuously altering the path in a region without singularities, it has to be constant in such a region Fulton (1995). Moreover, the total charge within a given domain can be computed as the sum of individual charges.
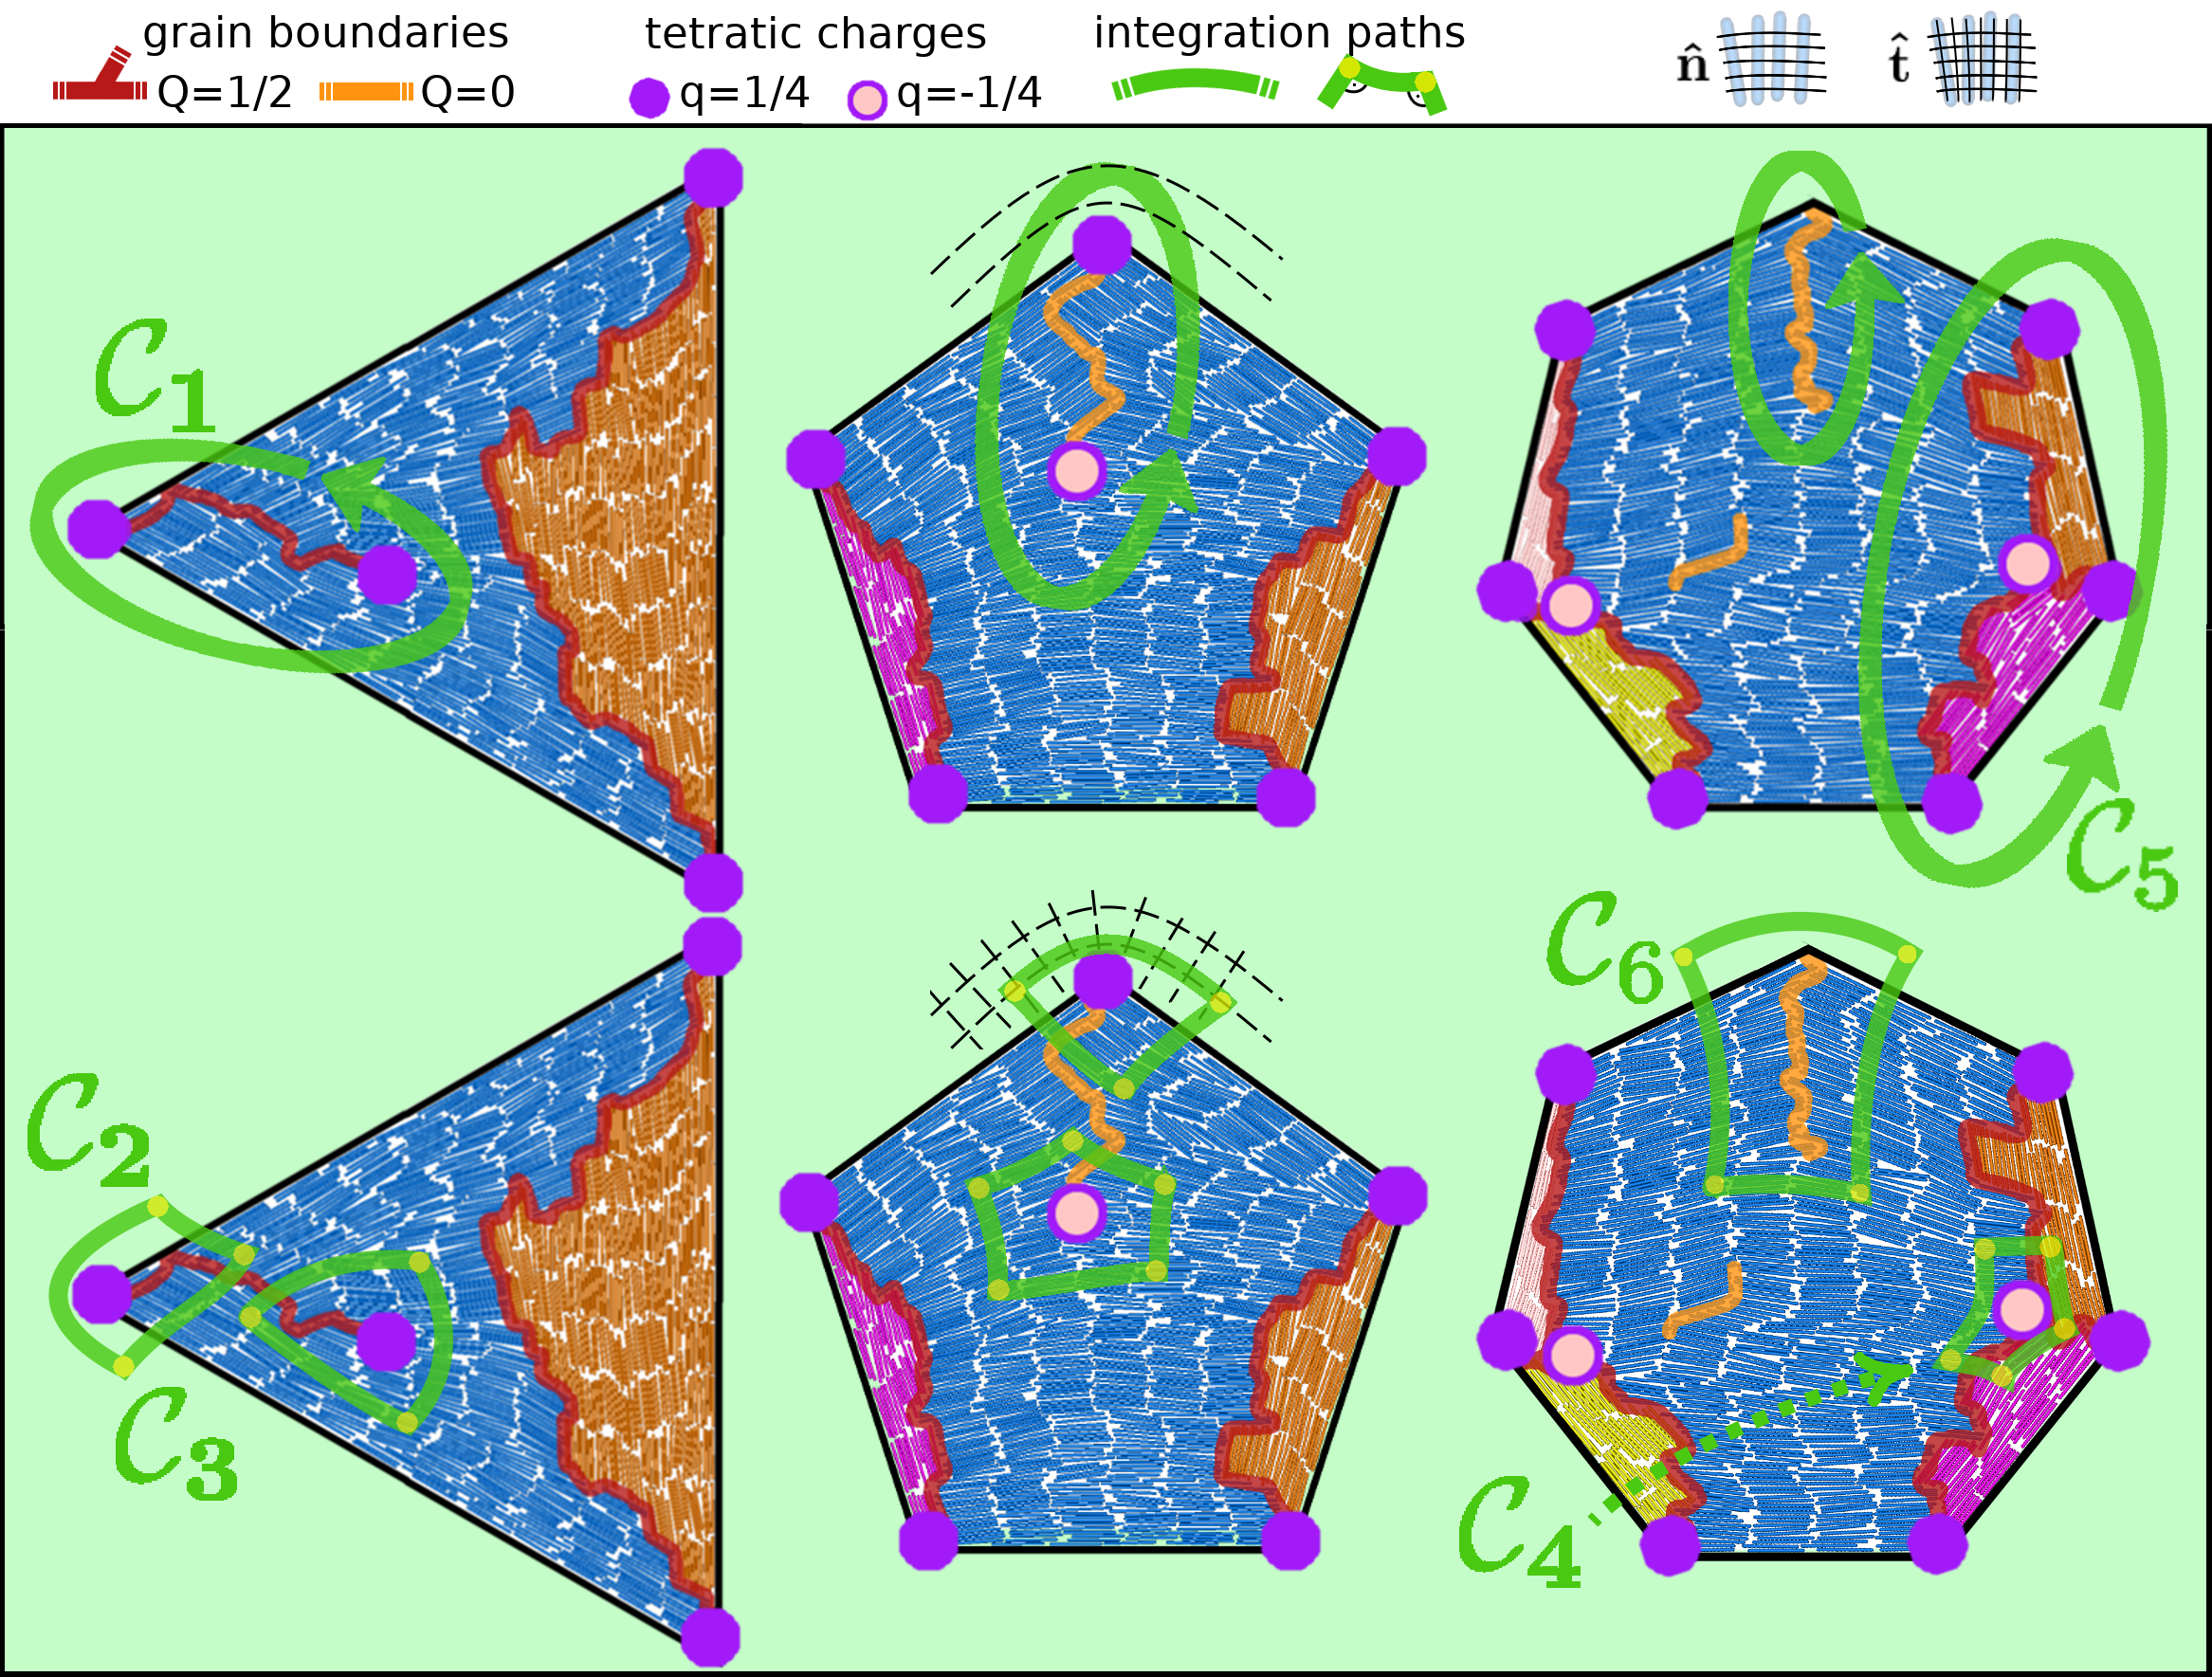
In a confined system, the external boundary induces a particular alignment of the particles, which is preferably parallel to the walls in case of hard rods at a hard wall. This typically enforces the formation of defects. If all particles obey a strong tangential anchoring condition at each point of the boundary, then the sum of all topological charges is determined by the Euler characteristic of the simply-connected confining domains considered here Fulton (1995). The corresponding fundamental law of charge conservation reads
| (S.10) |
where the index labels all defects in the system.
The topological defects occurring in nematic liquid crystals can be generally classified according to their location relative to the confining walls as bulk, boundary or virtual defects Manyuhina et al. (2015); Gârlea et al. (2016). The charge of a bulk defect determined according to Eq. (S.9) is not affected by the presence of the boundary. A boundary defect indicates a violation of the anchoring condition. This is particularly the case at a corner, i.e., a singular point of the boundary curvature, which is not compatible with the symmetry of the director field . The sudden jump of when traversing the confining wall can be related to the deficiency angle at the corner of opening angle , which leads to the common definition Kim et al. (2013); Lavrentovich (1998); Manyuhina et al. (2015) of a of a boundary charge , where takes integer values. The corresponding conservation law generalizing Eq. (S.10) then reads
| (S.11) |
with the bulk defect charges . Finally, a virtual defect represents a director field which does not uniformly align with the boundary, such that the center of this distortion can be thought to lie outside the actual system Gârlea et al. (2016). For smectic liquid crystals, which also exhibit positional order, the interpretation of the defect structure, described in the remainder of this section, requires further care.
II.2 Nematic and tetratic topological charge within smectic grain boundaries
In this section we describe the classification of topological defects in a smectic fluid, which are of central interest in our simulations and experiments. Regarding the spatially extended defect structure represented by the emerging smectic grain boundaries, a clear distinction between bulk and boundary defects is not always possible. For example, depending on the local curvature of the wall, we observe a continuous transition between grain-boundary lines representing pure bulk defects and those with one or both end points attached to the boundary (see, e.g., Fig. 7). On a second level of our classification, the end points of grain boundaries themselves can be identified as tetratic bulk or boundary defects, which could be classified along the lines of Sec. II.1. However, in what follows, we seek for a unifying virtual treatment for all defects, irrespective of their location, which we illustrate for both nematic and tetratic order in Fig. 2.
As a first step, we introduce a virtual extension of the director field that is tangential to the boundary and continuously circulates each corner in the outside region. Hence, we avoid the ambiguity arising from the angular deficiency at the corners and treat all defects as bulk defects, compare, e.g., the contour in Fig. 2. This picture allows us to associate a well-defined topological charge , determined via Eq. (S.9), with any defect in the nematic order, irrespective of its spatial extension and connectivity with the boundary, see Fig. 2 for representative examples. A pointlike defect at the system boundary, in particular, is thus interpreted as a virtual defect with half-integer topological charge , such that the charge conservation law for internal bulk charges from Eq. (S.10), which applies to our classification, is recovered from Eq. (S.11). This concept is best justified regarding the detachment of defects from the boundary in polygons with rounded corners, as detailed in Sec. V.2.
As a second step, we apply the continuum assumption of a tilt angle between smectic layers at opposite sides of grain boundaries that is exactly . Therefore, each grain boundary is compatible with tetratic orientational order, described by the director field , which is similar to the nematic director field but with the identification - - of both parallel and perpendicular orientations ( is the unit vector perpendicular to the two-dimensional system). The topological charge of a tetratic defect is always a multiple of and can be defined analogously to Eq. (S.9) as
| (S.12) |
where the closed contour may traverse grain boundaries, which is forbidden for a nematic director field. This allows us to identify two isolated pointlike tetratic defects at the end points of a grain boundary. For example, the contours and in Fig. 2 enclose a tetratic bulk defect and a virtual defect at the boundary, respectively.
As a third step, we apply the same continuum assumption to networks of grain boundaries, which reveals the location of additional tetratic point defects at the nodes, which represent a junction point of three grain boundaries, compare, e.g., the contour in Fig. 2. For the convex confinement shapes considered in our work, we typically observe defect networks of total nematic charge , consisting of nodes and end points with tetratic charge and , respectively. This decomposition reflects the fact that the nematic charge
| (S.13) |
of a defect equals the sum of all tetratic point charges enclosed by the same contour, compare, e.g., the contour in Fig. 2. Formally, the topological charge of a grain-boundary network is thus exclusively located at its nodes and end points. Globally, the fundamental conservation laws, Eq. (S.10), for the total nematic charge and accordingly for the total tetratic charge can be nicely illustrated in terms of the two types (with ) and (with ) of grain-boundary lines, introduced in the main text as building blocks of the emerging defect structures: we usually identify two networks, which consist of one type- and type- defect, and a number of standalone type- grain boundaries.
As a final step, we must decide for which of the observed grain boundaries the continuum assumption is justified and how to classify the defect structures in the case it is not. This issue is dealt with in the following section.
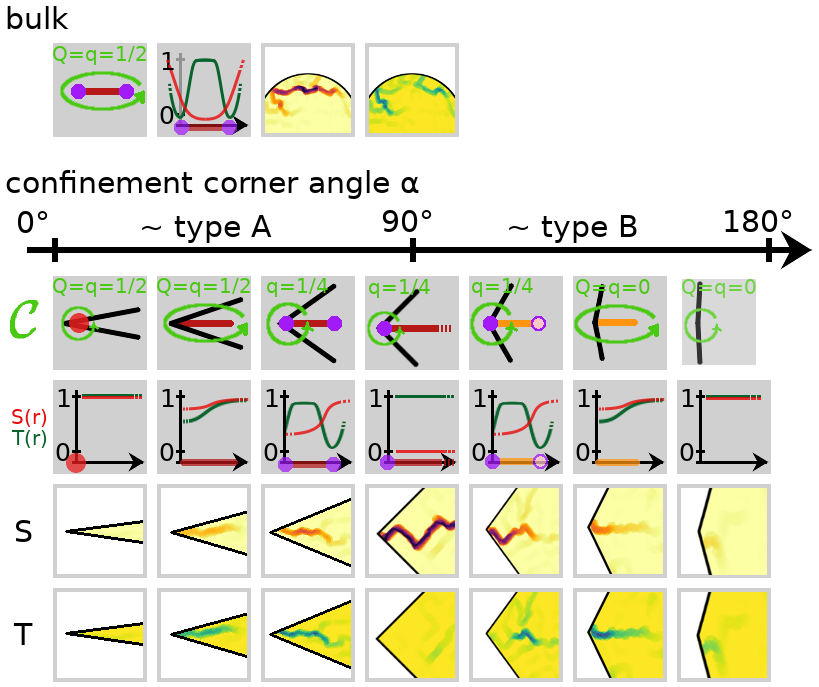
III Detection of tetratic defects in frustrated smectics
III.1 Local fields of the orientational order parameters
Having introduced a continuum classification of smectic grain boundaries in Sec. II.2, we now address the defect structure arising from frustrated smectic order in extreme confinement as represented by our simulation data. One way to visualize the emerging topological defects is through the local profiles of the nematic order parameter and the tetratic order parameter . If a grain-boundary line is located in the bulk, i.e., not attached to the boundary, its topological structure is unambiguously revealed by these fields. As emphasized in Fig. 3, the lines along which the field is close to zero are clearly visible, whereas the tetratic signal in the middle of the line is not distinguishable from the background. However, the field is low at both ends of the line, indicating the two end-point defects. If a grain-boundary network is connected to the wall, both the strength of the signal in the order parameters (deviation from the bulk value one) along a grain boundary and the observed type of the free-standing defects typically depends on the opening angle of the adjacent corner, as illustrated in Fig. 3 and detailed in the following. Corners with induce ideal grain boundaries with with and promote perfect tetratic ordering throughout the system. The tetratic end point defects are fully located on the system boundary and can therefore not be resolved in the field. Departing from the particular case , the tetratic order along a grain boundary is also frustrated close to the confining wall. For and the nematic signal along a grain-boundary line opposes the tetratic signal ( increases when decreases and vice versa). For both and the tetratic charges no longer provide isolated signals, i.e., they are partially merged to a line defect whose order parameter field qualitatively resembles the nematic one. Such a grain boundary does not accommodate perpendicular smectic layers, compare, e.g., the contour in Fig. 2. In the limit , adjacent smectic layers are parallel and there is no topological defect. This corresponds to a type- grain boundary, typically observed for , whose oppositely charged tetratic endpoints are completely annihilated. In the opposite case, , there is a point defect of charge in the corner, corresponding to the two merged endpoints of a type- defect, generally preferred for .
The given thresholds for the opening angle reflect the different symmetry inherent to the nematic and tetratic order. The resulting intuition helps to predict the expected type of defect induced by a corner. In particular if there is only a single grain-boundary line, the information in the order-parameter field can be used as a basis for the decision whether or not to assign isolated tetratic end points to the defect, as indicated in Fig. 3. Regarding, however, the variety of possible defect structures laid out in Sec. IV, we take a cue from our domain criterion described in Sec. I.3 and attach a branch of type to a grain-boundary network only if it separates two different domains. Otherwise, we consider the endpoints of such a building block as annihilated and no such branch is drawn into our schematic defect structures.
III.2 Tetratic defect analysis based on smectic layers
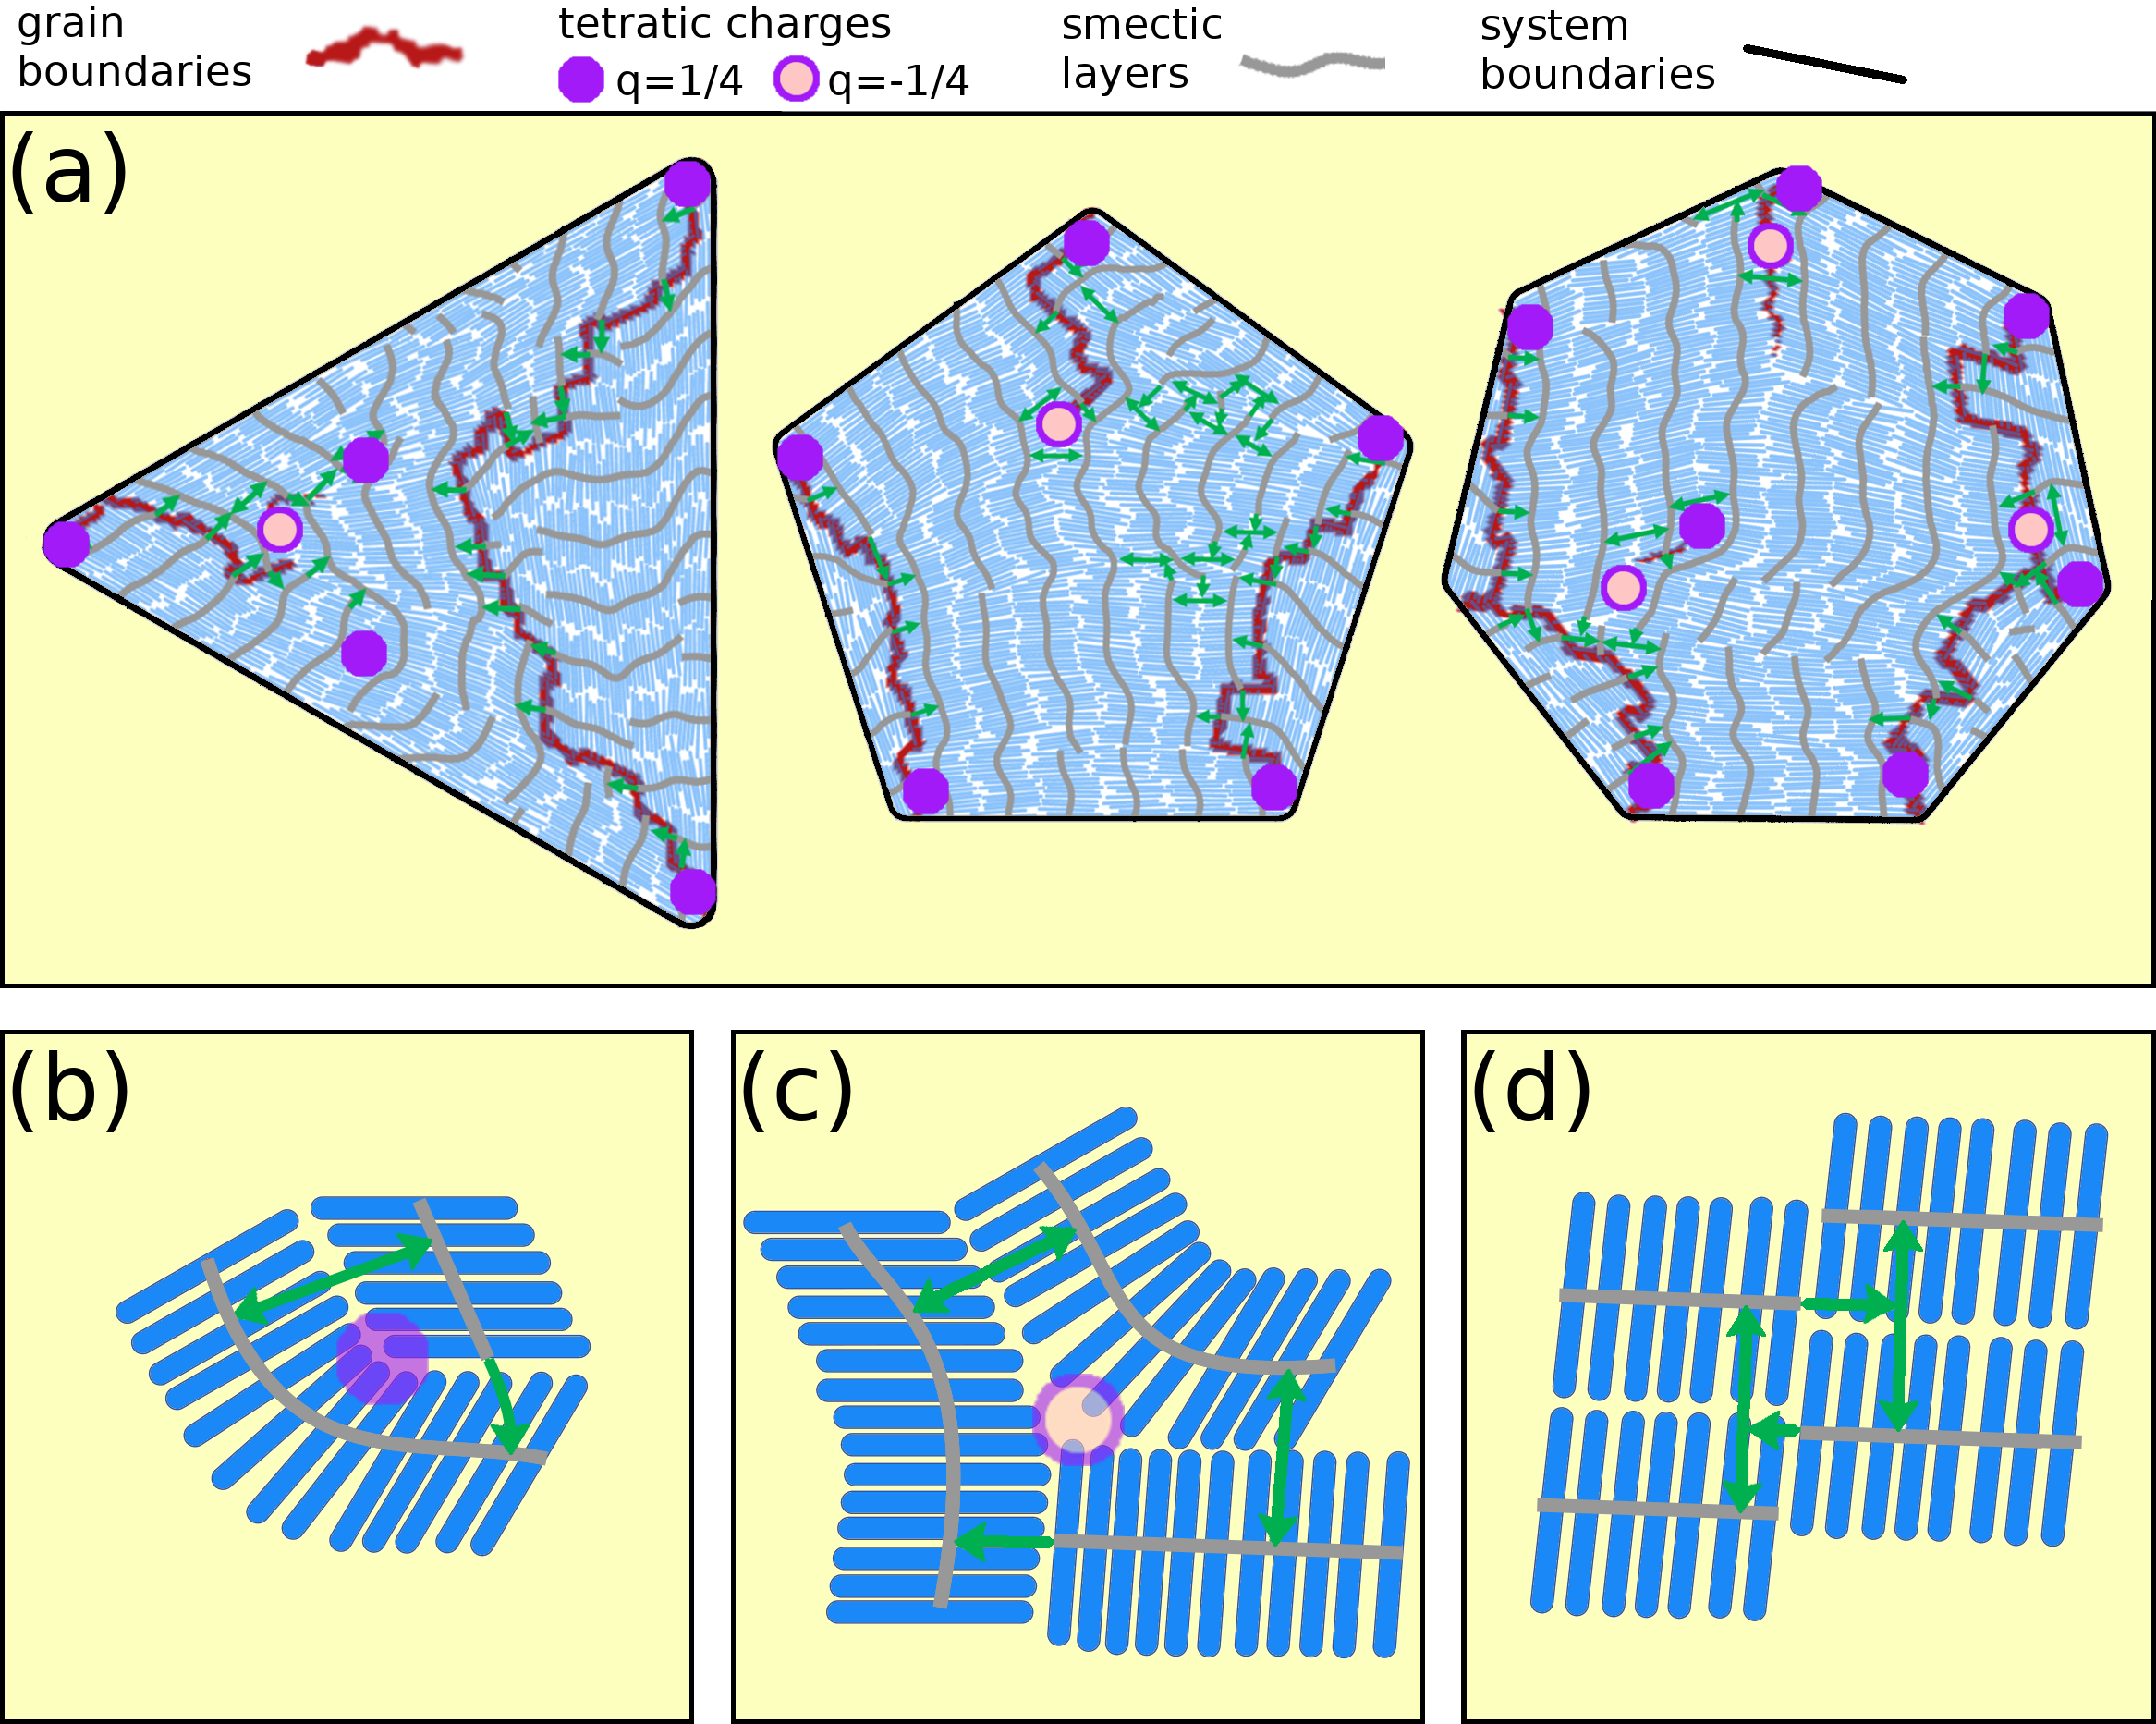
To provide an alternative point of view on tetratic defects in frustrated smectics, we focus our analysis on the smectic layers, instead of the particle-resolved picture in the previous section. Our main goals are to provide a deterministic distinction between isolated and (partially) annihilated defects and to explicitly detect boundary defects. In the frustrated smectic configurations we consider here, many of the smectic layers are tilted to some degree, and as a result the particles are not aligned perpendicular to the direction of the smectic layer. Hence, the difference in nematic orientation across a grain boundary can be significantly different from , resulting in a low local tetratic order parameter near the grain boundary. As a result, pinpointing defects based on the tetratic order parameter is not easy in practice. We thus require a more robust way of identifying the topological defects associated with the tetratic order in frustrated smectic liquid crystals from our simulation data.
To circumvent the difficulties associated with the local order parameter field, we determine the directions and connectivity of the smectic layers. Specifically, we consider two particles to be in the same smectic layer based on a bonding criterion that takes into account the positions and orientations of pairs of particles, see Sec.I.3 for details. We then draw a smoothened center line along the length of each layer to mark its direction. The smoothening is performed by first determining an overall direction for the smectic layer (taken to be perpendicular to the nematic director of all particles in the layer), and then applying a low-pass filter to the component of the particle positions perpendicular to this director. We can now use these lines to guide us in identifying the behavior of the tetratic director as we move through the system. Along the center line of the smectic layers, the orientation of the tetratic director varies smoothly. Moreover, we can connect two lines by green arrows that are either parallel, or meet at an approximately perpendicular junction, such that the tetratic director can be assumed to vary smoothly along this connection. The resulting closed lines allow us to locate the defects in the tetratic order, as illustrated in Fig. 4. To do this, we consider two types connections between smectic layers. First, between two parallel smectic layers within the same smectic domain, we can draw direct connections perpendicular to the two smectic layers, denoted by double-headed green arrows. Second, when a smectic layer terminates against the side of another layer, such that the last particle in the first layer lies parallel to the smectic direction of the second layer, we draw a single-headed arrow, which by definition crosses an area of low nematic order.
As shown in Fig. 4, it is then possible to identify a topological charge of tetratic defects , by counting the number of turns represented by the tips of the green arrows. In an idealized interpretation of any loop, switching direction at the tip of a green arrow is a turn of , which has no effect on the tetratic order. Following the closed loop in Fig. 4b, we encounter three sharp corners of (with no effect on the tetratic order) plus the smooth rotation of the smectic director by a final , completing the loop. This quarter-turn of the tetratic director indicates the presence of a defect with topological charge. Similarly, closed loops with 5 turns at a right angle, like in Fig. 4c must carry a topological charge of . Finally, we should consider non-topological defects that are common in our configurations. These can be either dislocations or simply sudden shifts in a smectic layer perpendicular to its smectic direction, and do not significantly impact the orientations of the particles: they occur in regions of high nematic order. An example is shown in Fig. 4d, with connections between the different layers drawn to show that no topological defects occur, as the closed loop has exactly four sharp corners of .
We can now apply this approach to the simulated configurations, as illustrated in Fig. 4a. For this, it is convenient to include the nematic order parameter field as a background. In particular, as terminations of one smectic layer against another (single-headed green arrows) only occur in regions of low nematic order, in practice we only have to focus on the regions close to the grain boundaries to find tetratic defects. In each figure, we draw only the connections required to identify the topological defects in the system. Then, additional connections between parallel layers are added to narrow down the regions where defects are located. Moreover, as detailed in Sec. II.2, we assume the tetratic director field to vary smoothly along the outside wall. To reflect this, we draw a smoothened outline of the system boundary in each image. Smectic layers can terminate at the wall, providing an additional connection that should again be interpreted as a rotation by in any closed loop that includes it. In other words, the wall represents a double-headed arrow (which is not drawn for presentation reasons).
We stress that identifying tetratic defects in this way is relatively straightforward. Arrows are drawn manually, but there is usually no freedom of choice: when a smectic layer terminates in a region of low nematic order, it is connected to the perpendicular layer just ahead of it. If no such layer is immediately visible, then occasionally another connection in this region should be made first to allow the first layer to terminate by drawing an arrow which ends on another perpendicular arrow (see, e.g., on the right-hand side of the heptagon in Fig. 4a. The only freedom of choice in this method occurs when it is not clear whether two adjacent smectic lines should be considered perpendicular or parallel. For example, one could imagine continuously deforming the region around the defect pair just to the left of the center of the heptagon in Fig. 4a to be more similar to an edge dislocation, as in Fig. 4d, which would result in the annihilation of the two defects. However, note that any choice leaves the overall topological charge of the system intact, as one would expect.
Compared to the analysis of order-parameter fields, described in Sec. III.1, our layer-based approach generally resolves a larger number of defect pairs, albeit these are usually close to annihilation. For example, the distribution of tetratic charges in the free-standing grain boundary at the top corner of the heptagon in Fig. 4a corroborates our interpretation of partially annihilated endpoint charges. In conclusion, while both methods provide a solid understanding of the tetratic topology in their own right, the algorithm presented above is perhaps most suitable to track the defect motion in a dynamical setup.
IV Relative frequencies of observed liquid crystal structures
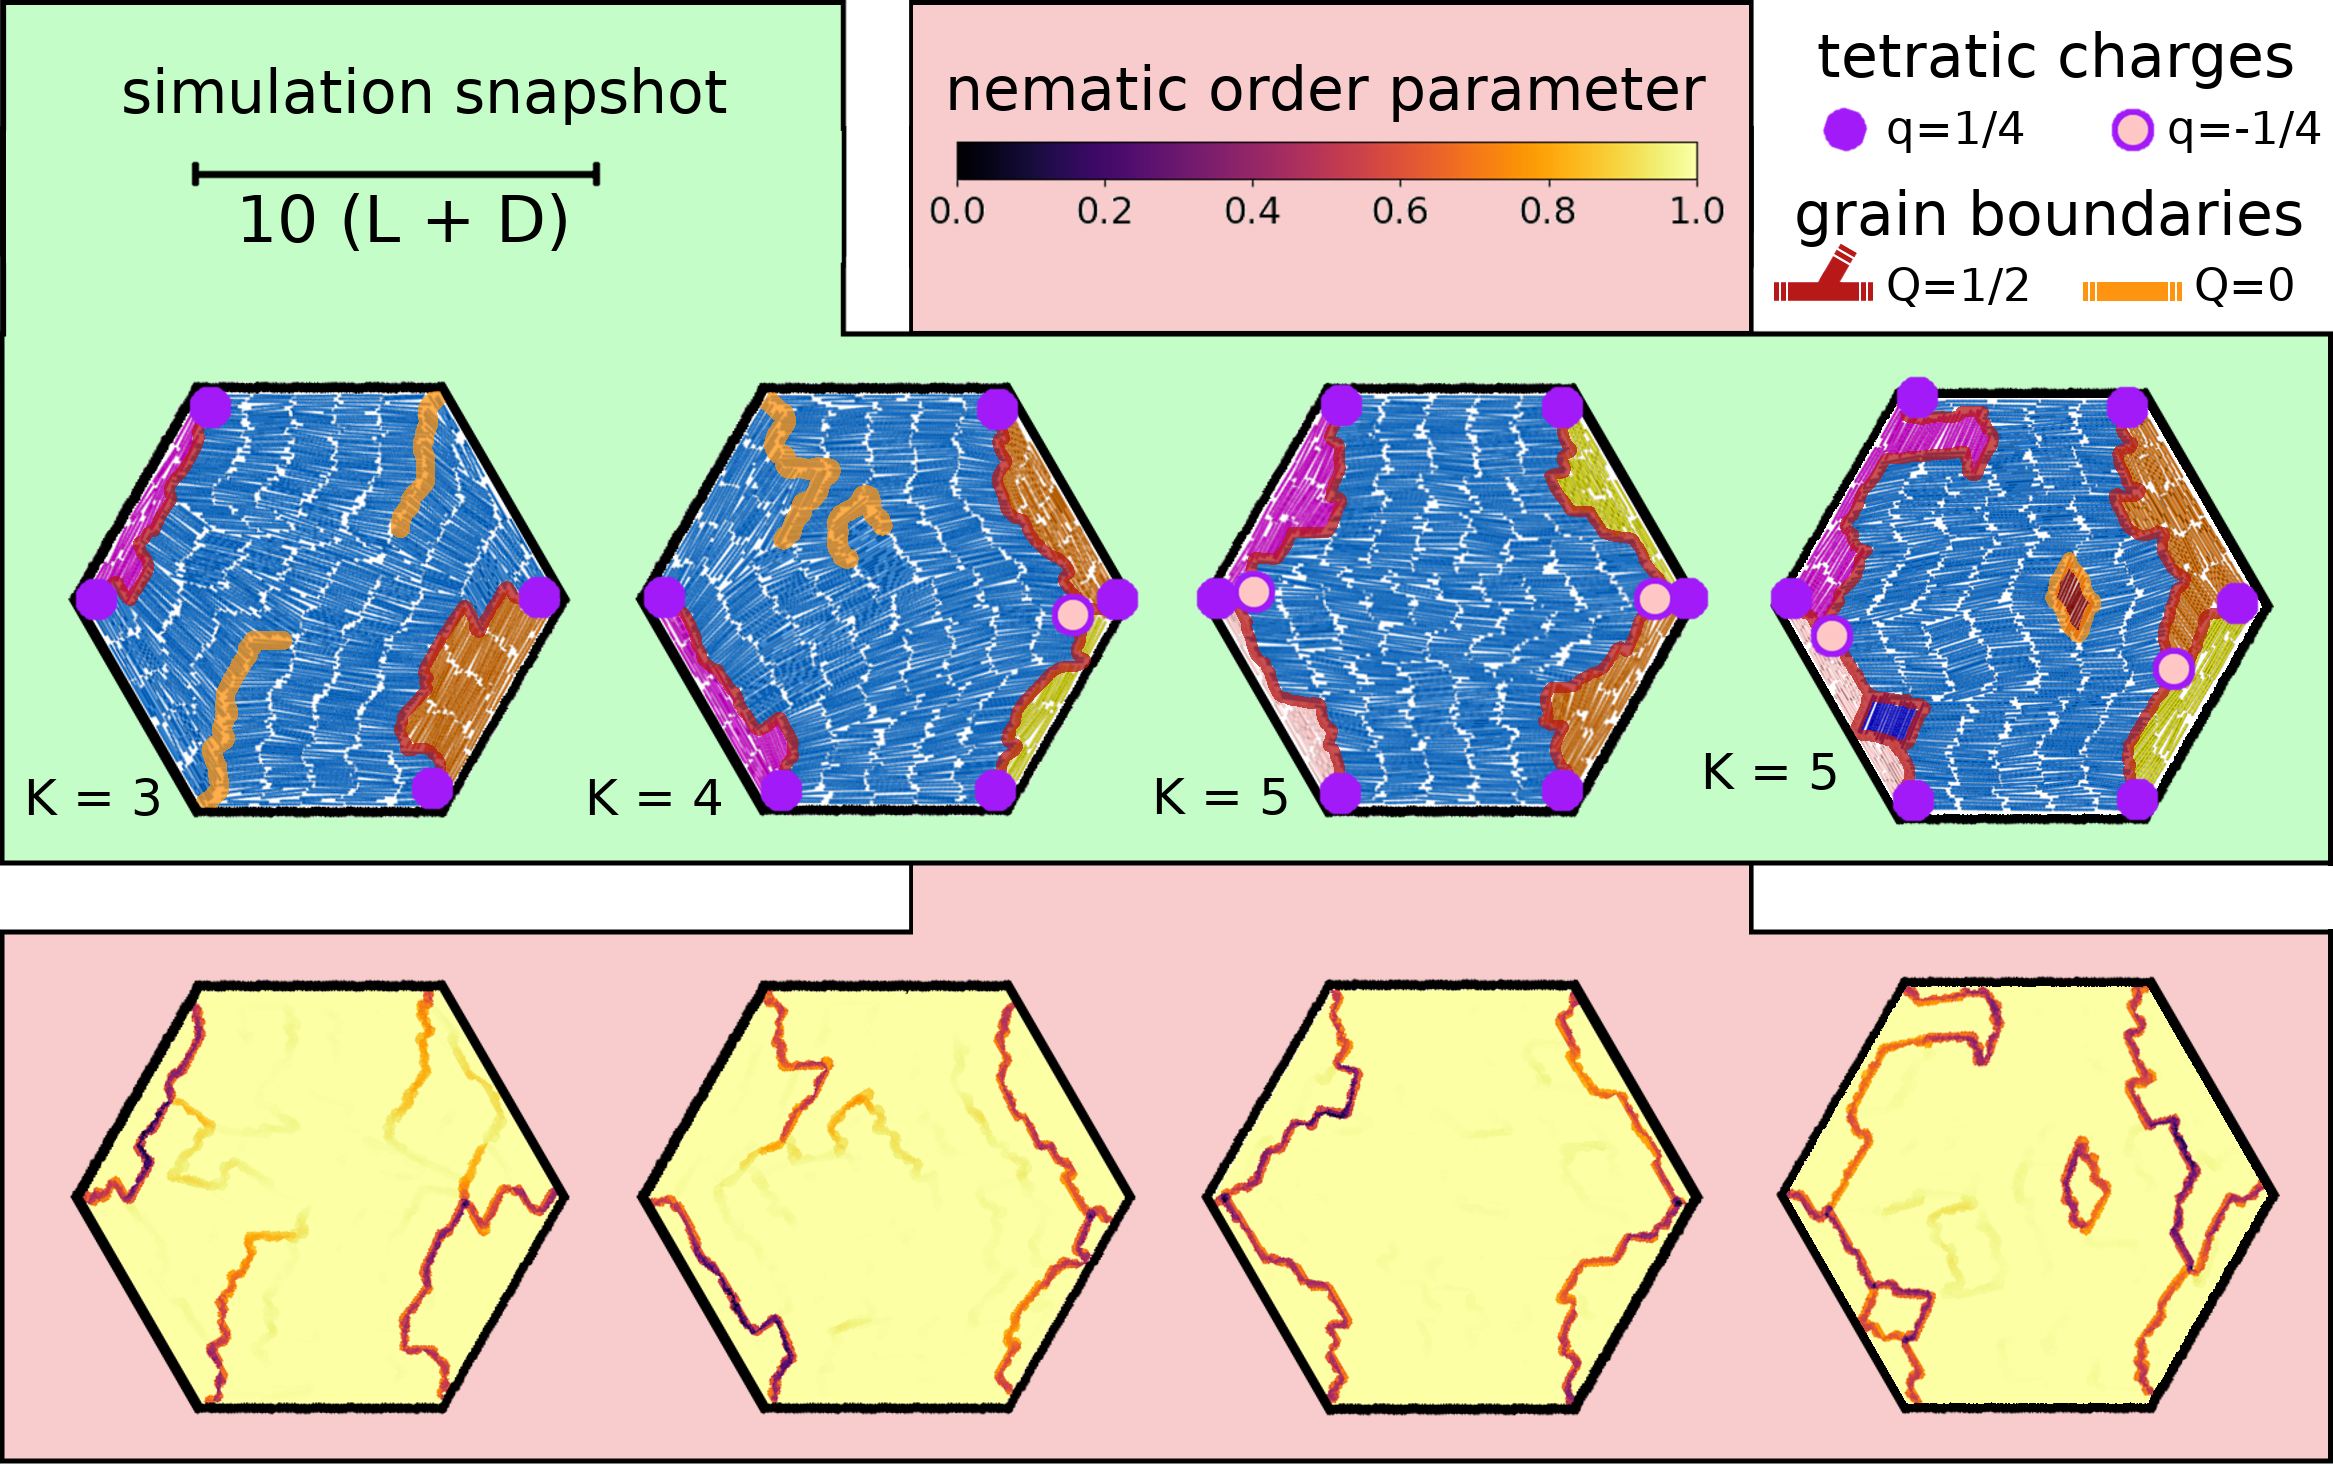
In general, each smectic structure in simply-connected confinement features a total topological charge typically distributed over two grain-boundary networks (containing one type- and type- building blocks each) and a number of additional type- grain boundaries. To identify the most likely network composition, we differentiate between the occurring defect structures by counting the number of domains, according to the analysis in Sec. I.3. Considering hexagonal confinement as an exemplary case, Fig. 5 shows how the number of domains relates to the complexity of the emerging networks: when completely connected to the wall, an network separates domains.
In Tab. 1, we list the relative frequencies for structures labeled according to the number of domains for a range of polygonal confinements. For polygons with smaller numbers of corners, we observe that the average number of domains increases with increasing number of corners, peaking for dodecagon (12 corners) and tridecagon (13 corners). Further increasing the number of corners, decreases again, as the confinement gradually approaches a circular shape. This behavior reflects a general trend, which is also reflected by the most frequently observed defect structure for a given confinement. The particular distribution for a given polygon depends in detail on the ratio of the side length (determined by the fixed particle number and area fraction) to the length of the rods. For instance, the triacontagonal (30 corners) confinement, for which this ratio is equal to , displays a relatively large number (compared to 40 corners) of single-domain structures, which can be related to the high probability of a continuous string of rods around the perimeter.
| confinement | number of domains | |||||||||||
| (corners) | ||||||||||||
| circle (, ) | ||||||||||||
| triangle (3) | ||||||||||||
| square (4) | ||||||||||||
| pentagon (5) | ||||||||||||
| hexagon (6) | ||||||||||||
| heptagon (7) | ||||||||||||
| octagon (8) | ||||||||||||
| nonagon (9) | ||||||||||||
| decagon (10) | ||||||||||||
| hendecagon (11) | ||||||||||||
| dodecagon (12) | ||||||||||||
| tridecagon (13) | 7.05 | |||||||||||
| tetradecagon (14) | ||||||||||||
| pentadecagon (15) | ||||||||||||
| hexdecagon (16) | ||||||||||||
| icosagon (20) | ||||||||||||
| triacontagon (30) | ||||||||||||
| tetracontagon (40) | ||||||||||||
V Additional simulation data
The distinctive topology of the defects, we observe in our confined systems, is influenced by various quantities, such as area fraction , geometry of the particles (aspect ratio ), as well as confining geometry and system size (particle number ). To further explore these different aspects, we present in the following sets of simulation data generated with the protocol described in Sec. I.2. First, we consider additional geometries for the simulation parameters , and used in the main text. In detail, we exemplify the dependence of the typical length of a grain boundary on the sharpness of the adjacent corner by considering a range of isosceles triangles in Sec. V.1 and discuss the effects of a varying local curvature of the confining walls by the example of different rounded triangles in Sec. V.2. We then elaborate on the dependence of the topological defect structure on the system size in Sec. V.3. Finally, to shed light on the relation between simulation and experiment, we explore a range of area fractions and aspect ratios in Sec. V.4.
V.1 Isosceles triangles
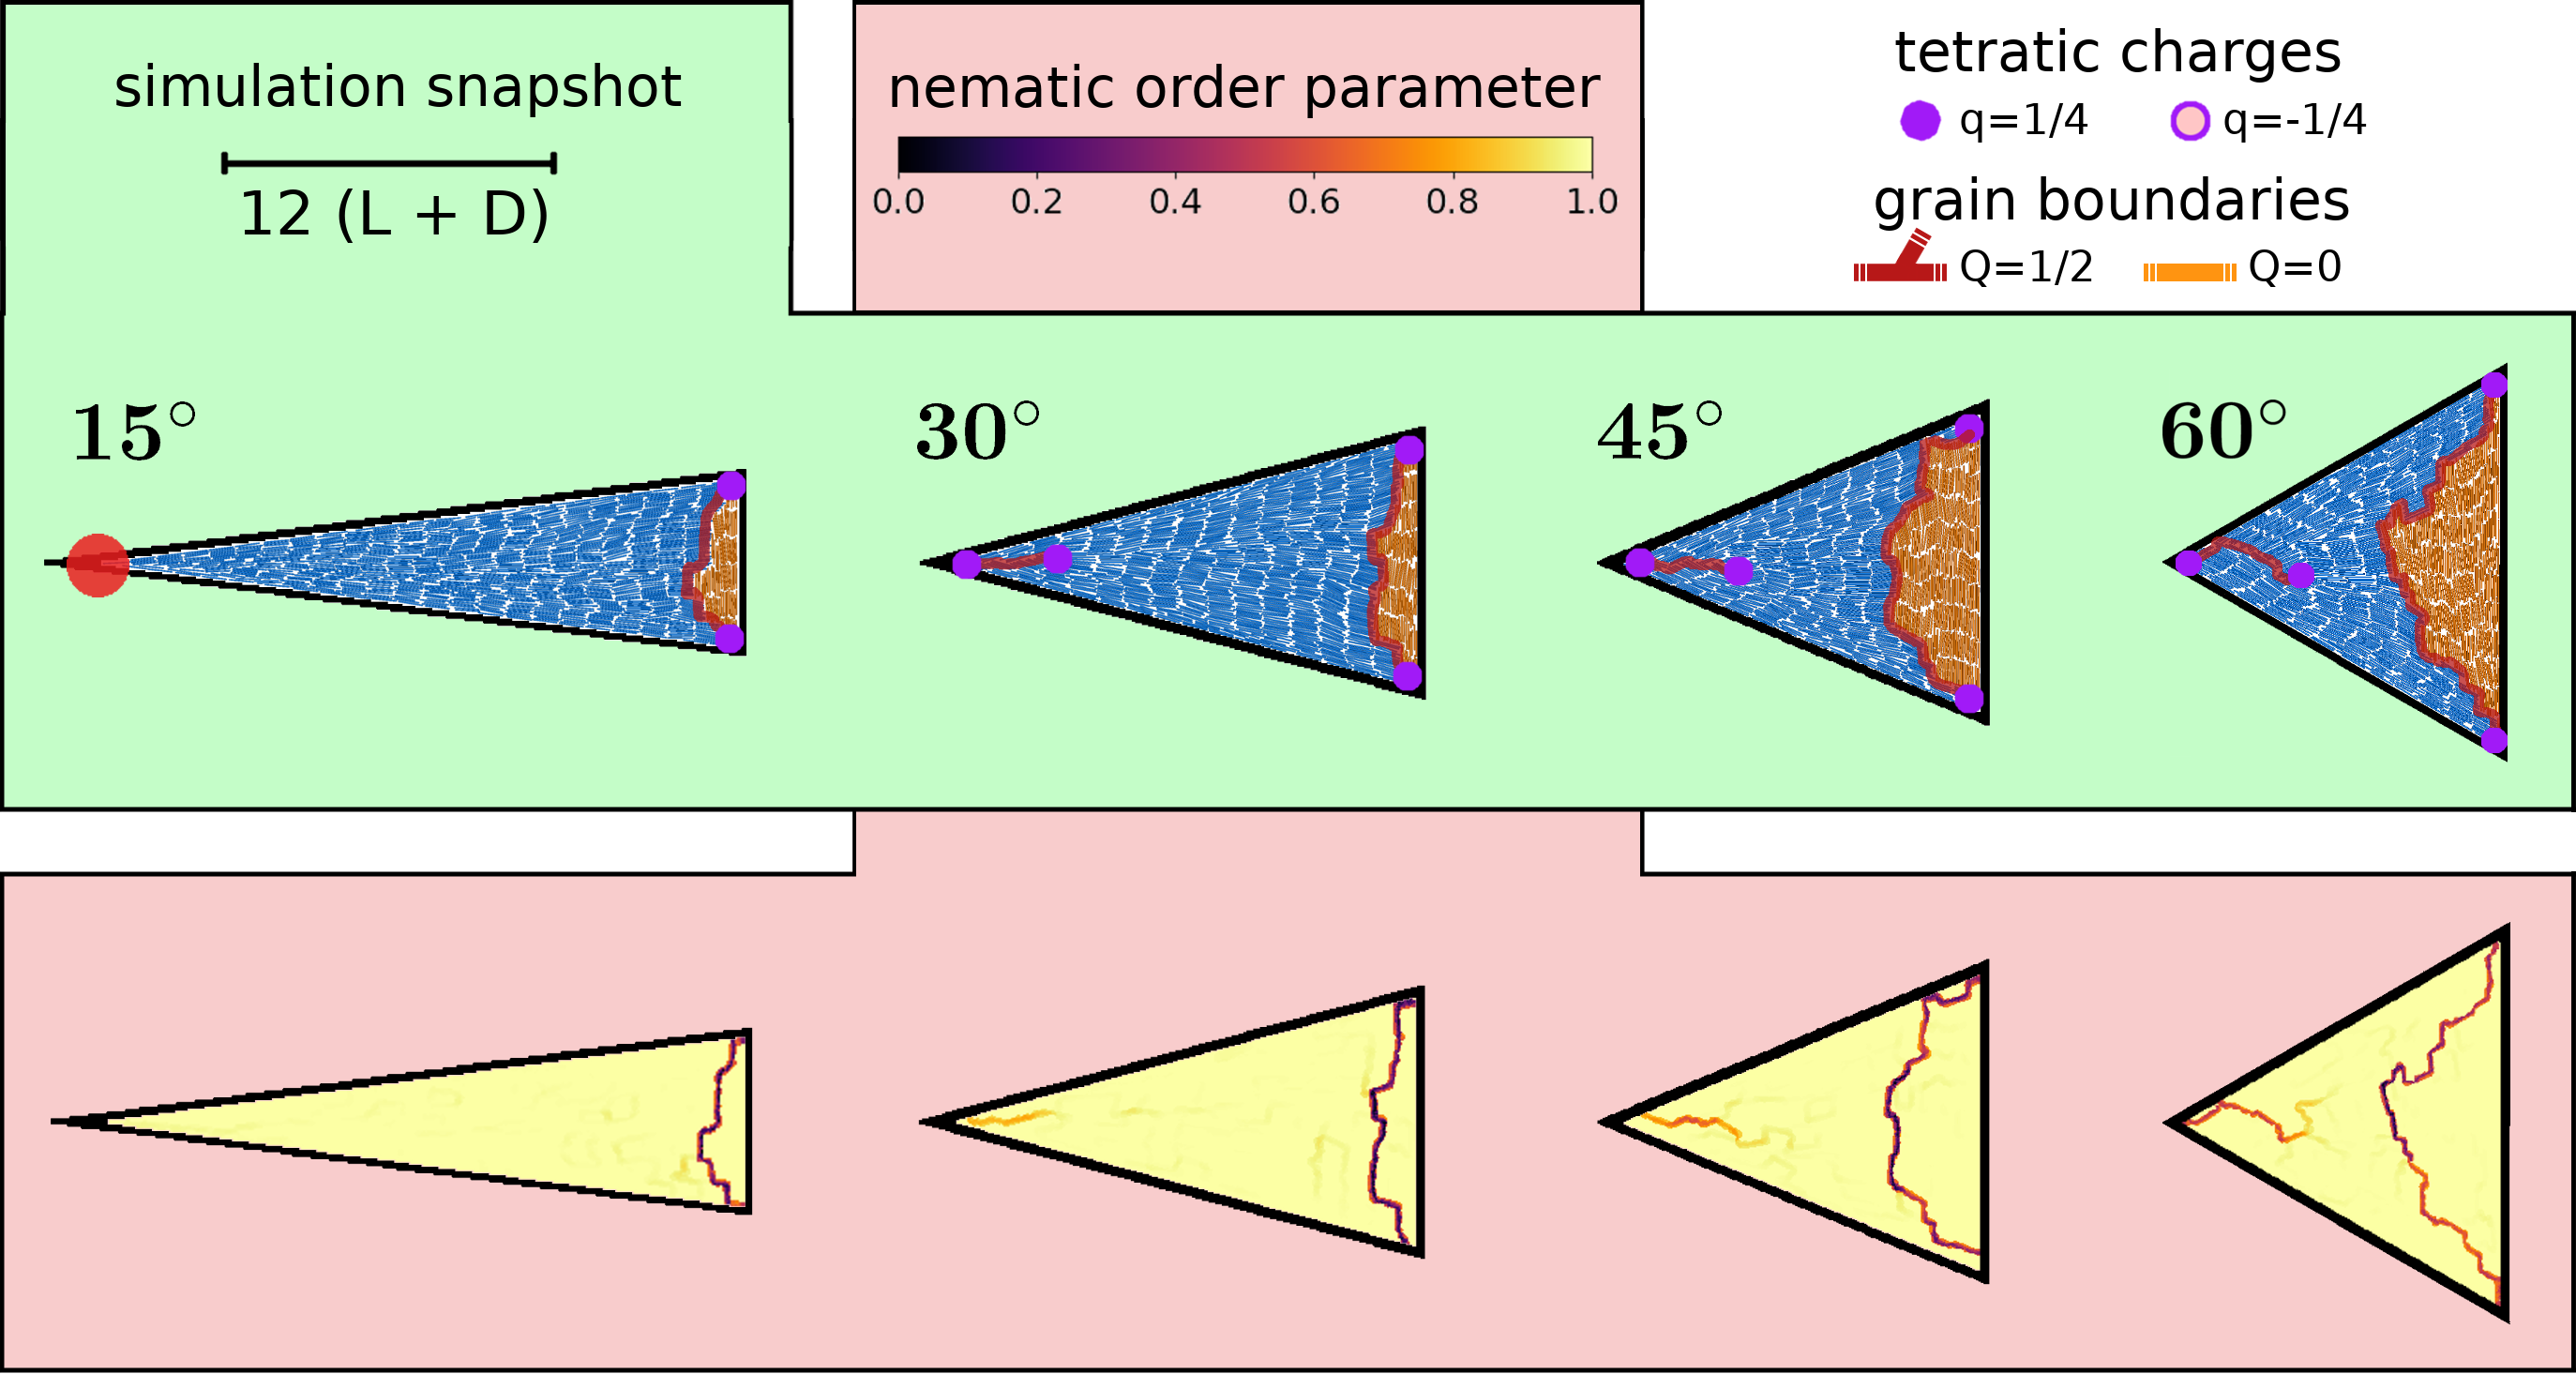
To study the effect of the of the sharpness of a corner on the typical length of the adjacent grain boundary, we consider in Fig. 7 a range of sharp isosceles triangles. The appearance of the free-standing type- defect, typically attached to the sharpest corner of the polygons, critically depends on the opening angle, as illustrated in Fig. 3 and depicted in Fig. 7. As elaborated in the main manuscript, the free-standing grain boundary in equilateral triangles tends to protrude deeply into the bulk. For intermediate opening angles, we typically observe that the length of the defect decreases compared to the legs of the triangle and the degree of orientational frustration becomes lower as the tetratic endpoints begin to merge. For angles we observe an isolated perfect point defect with as smectic layering is suppressed by the cramped geometry in the vicinity of the tip.
V.2 Rounded triangles
As mentioned in the main manuscript, the curvature of the outer system boundary plays a central role in the formation and resulting topological interpretation of grain-boundary networks. To elaborate on the dependence of the topological defect structure on the curvature of confining cavities, we consider rounded polygons generally defined by the equation
| (S.14) |
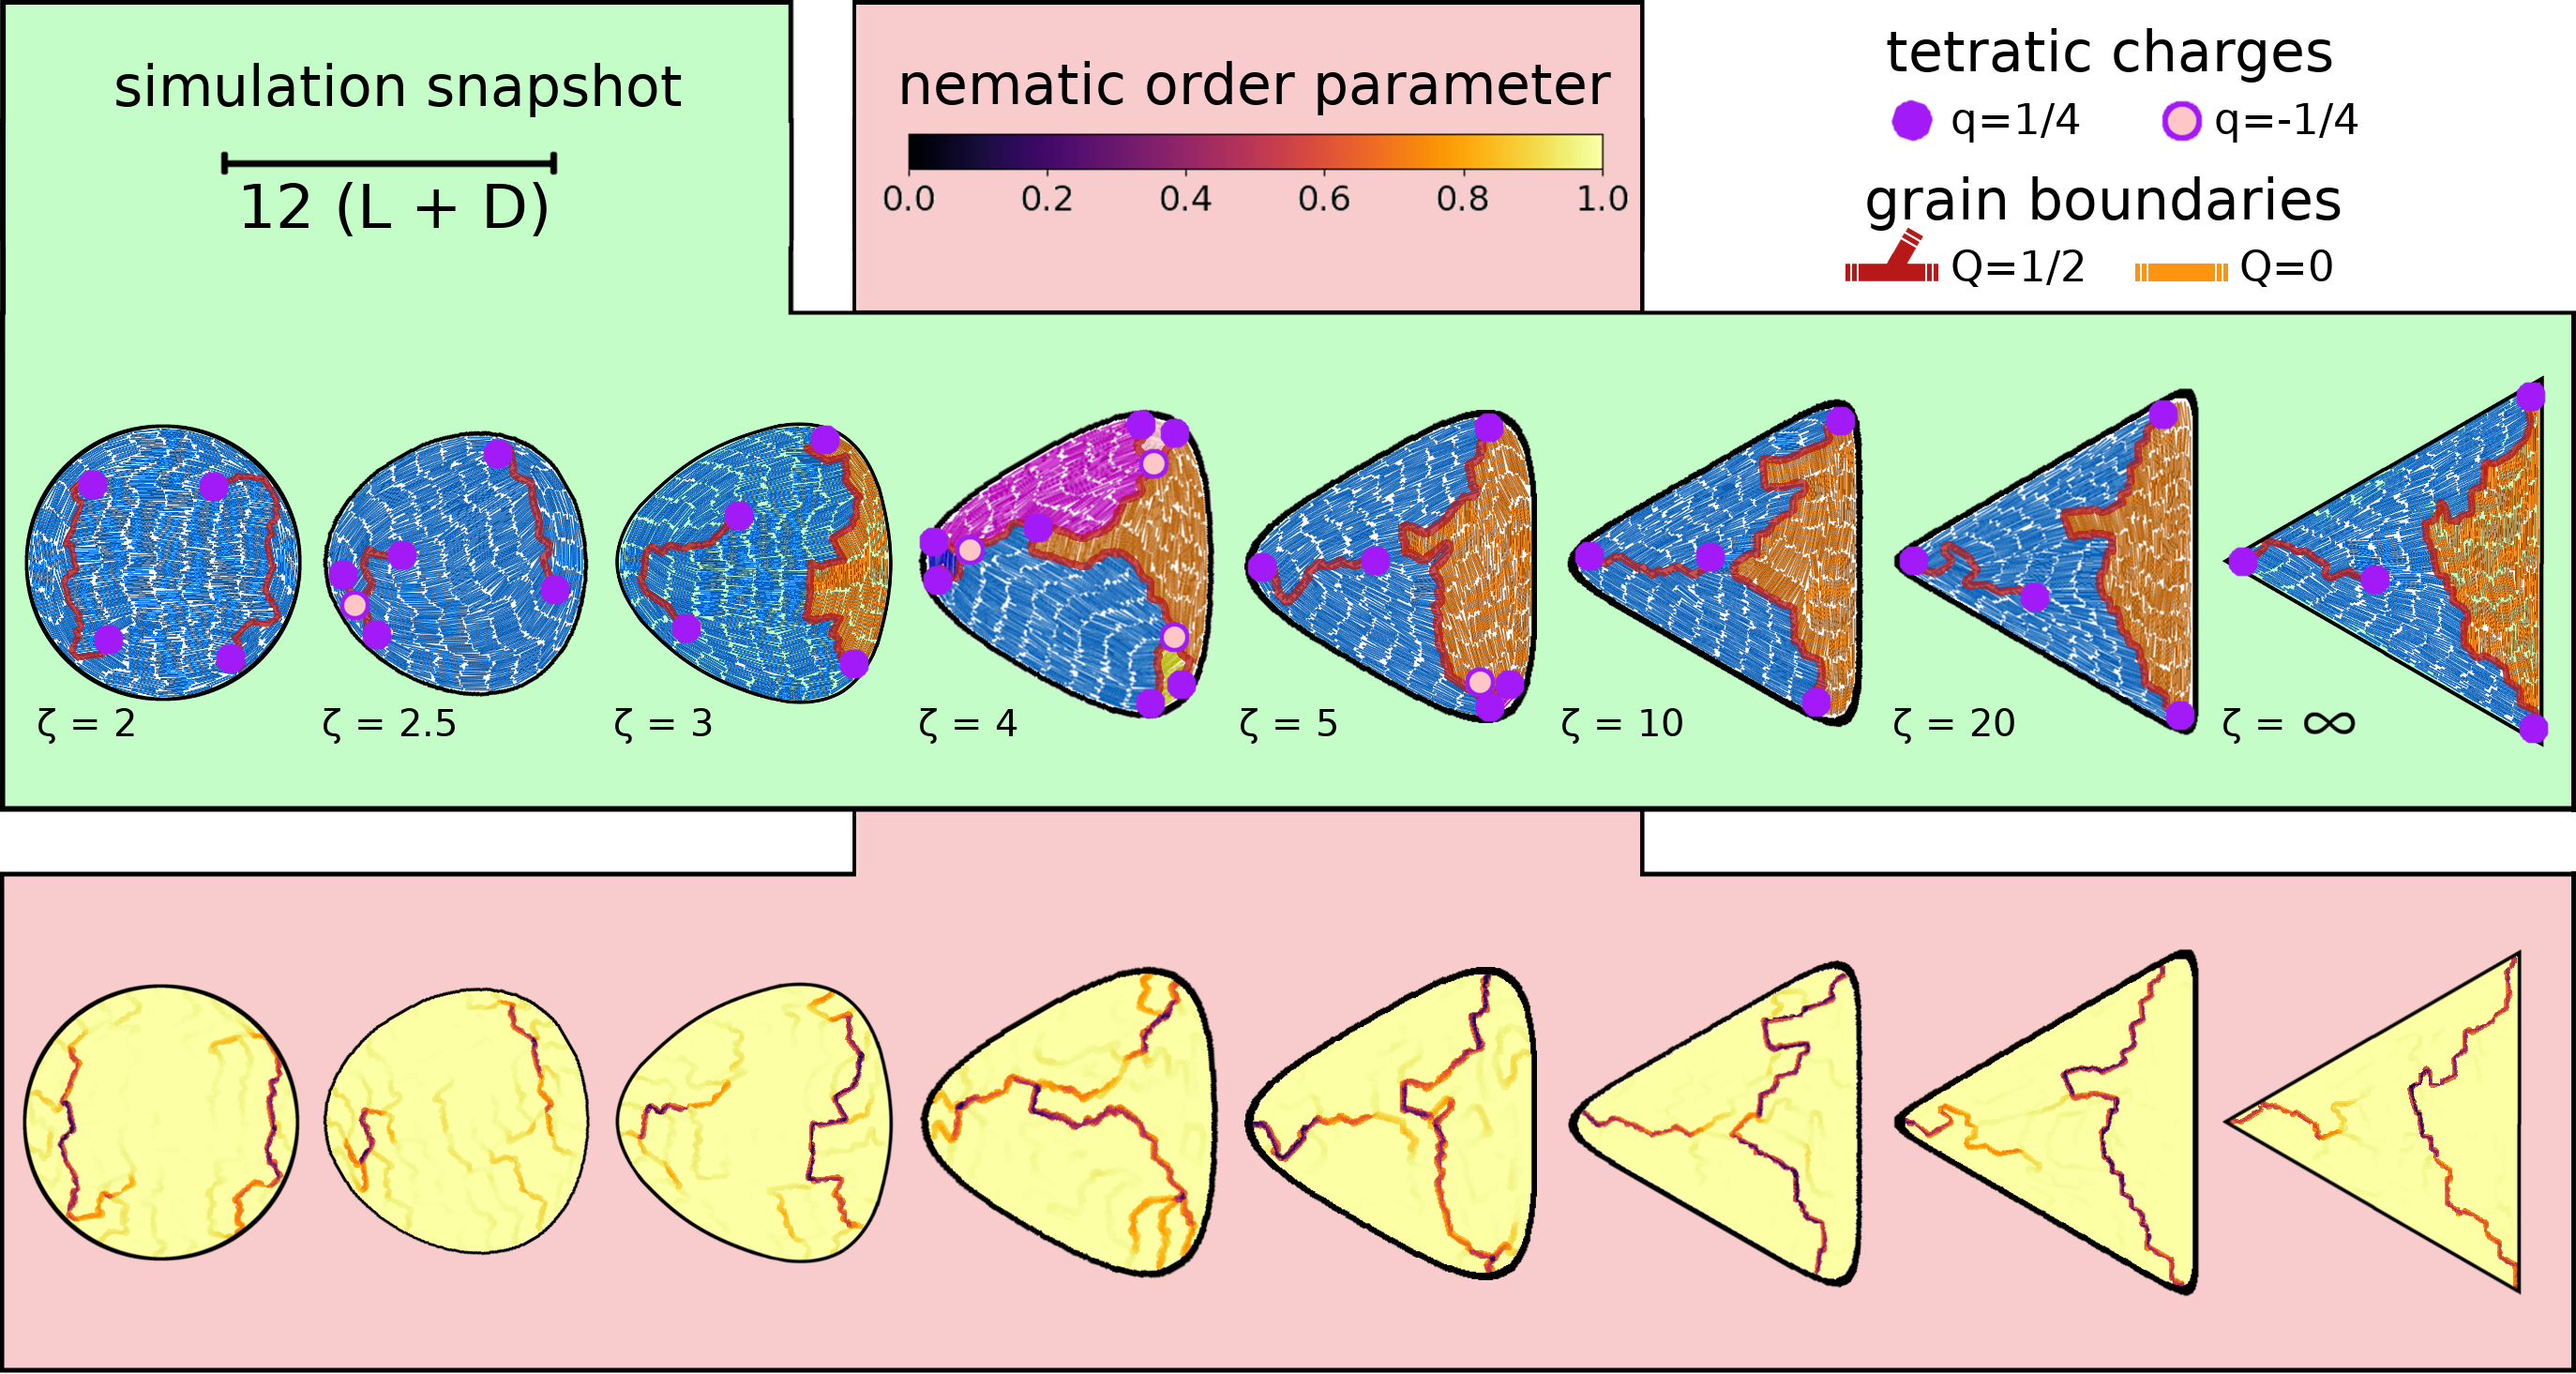
with , and , such that and denote the number and sharpness of the corners, respectively. In particular, defines a circle and the limit corresponds to sharp corners.
Focusing on , Fig. 7 compares the typical structure for a large range of rounded triangles. For sharp corners with infinite local curvature, the sudden shift in the orientation of the wall causes a frustration of the orientational order directly at the walls, resulting in grain boundaries attached to each corner. The resulting defect structure with two clearly separated domains remains dominant for rounded triangles with throughout. For , the dominant structure resembles that in circular confinement, characterized by a single domain and two opposite grain-boundary lines on each side of the confinement, which tend to align locally with the confining wall. The degree of attachment to the system boundary, generally decreases with , which demonstrates the convenience of our virtual treatment of boundary defects.
For intermediate values of the roundness parameter around , where the curvature radius at the corners is comparable to the rod length, we find additional structural elements: the grain boundaries tend to branch out close to the corners, resulting in small domains incorporating one to two smectic layers. Moreover, in this parameter range, we find structures that feature either one, two or three large domains, reflecting a strongly fluctuating connectivity of the defect networks.
| number of domains | |||||||||
|---|---|---|---|---|---|---|---|---|---|
| sim-# | |||||||||
| number of domains | ||||||||||
V.3 Polygons with different particle numbers
The typical extent of the topological defects we observe in extreme confinement, depends on the elastic deformation energy of the smectic layers. On smaller length scales, positional distortions of the smectic layers are favored, whereas bent smectic layers are dominant on larger length scales Kleman and Lavrentovich (2003). This results in the formation of the described networks of grain boundaries in smaller systems while in bigger systems large scale bends, connecting different walls of the confinement, suppress the formation of separated domains. Accordingly, we show in Figs. 8, 10 and 10 exemplary simulation results with different particle numbers , leaving the area fraction constant for any confinement. In general, we observe that the average number of domains in each confinement decreases with increasing system size, which is statistically quantified in Tab. 2. Moreover, the relative length of free-standing type- grain boundaries is reduced for larger systems, which can be observed, e.g., by comparing the structures in the heptagons.
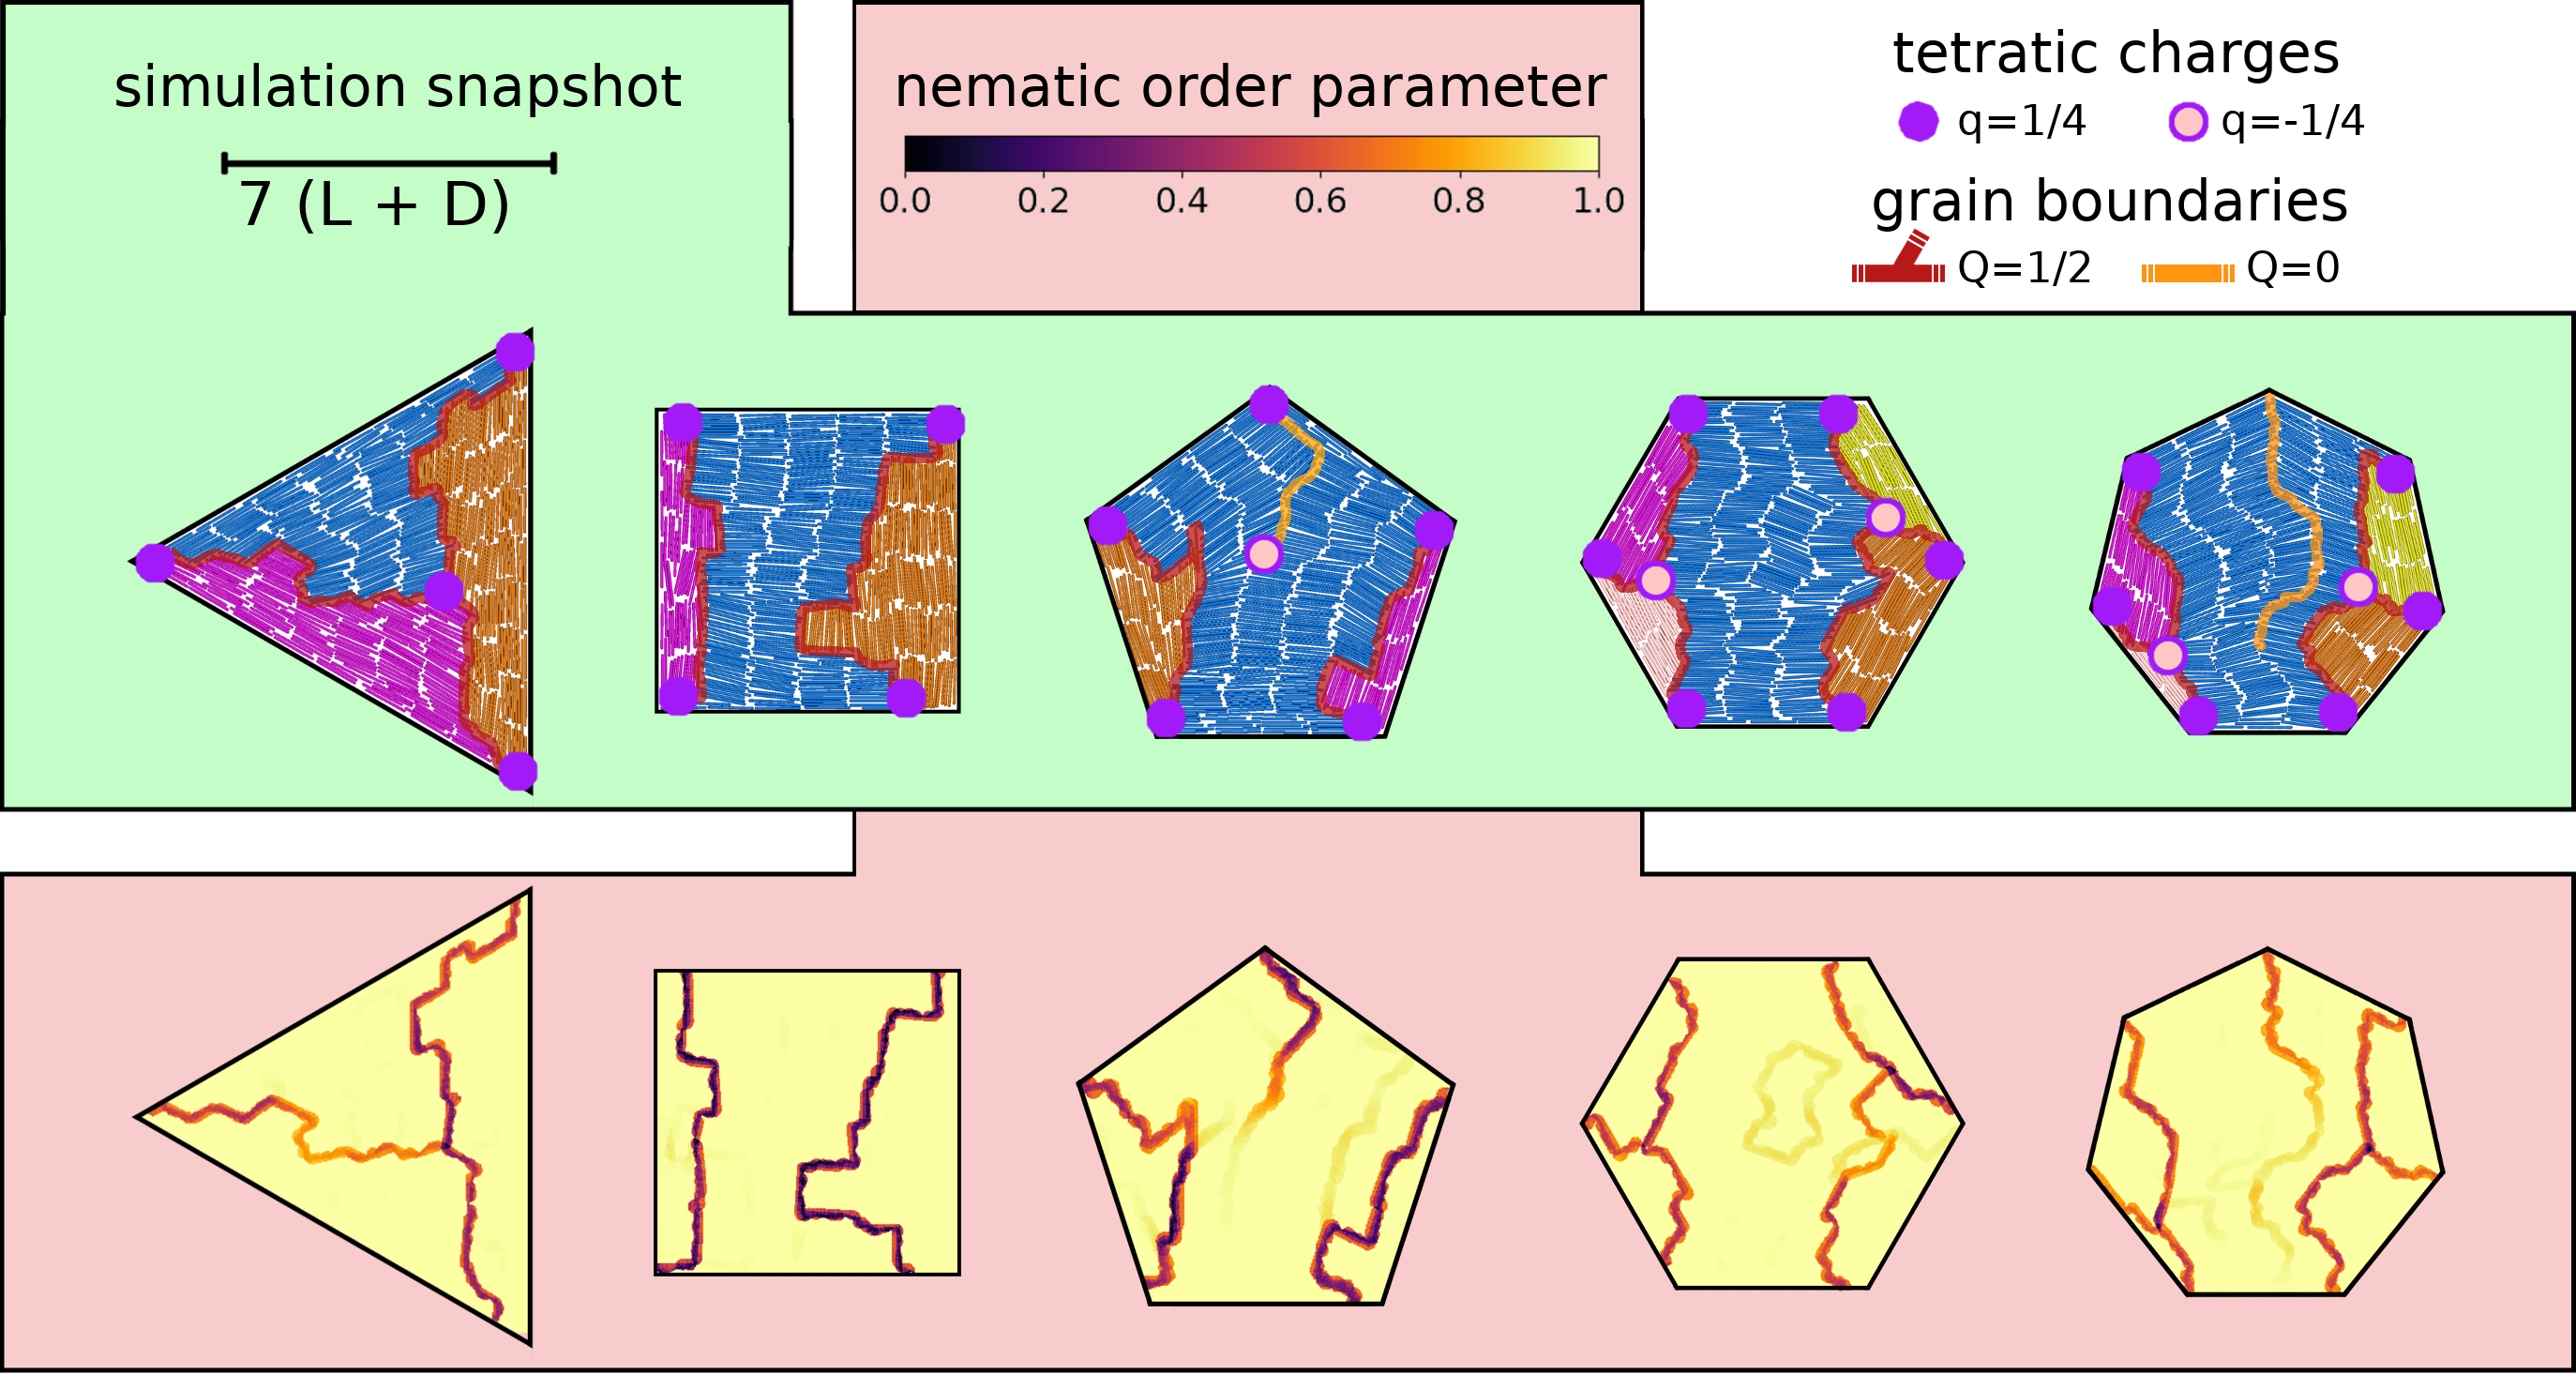
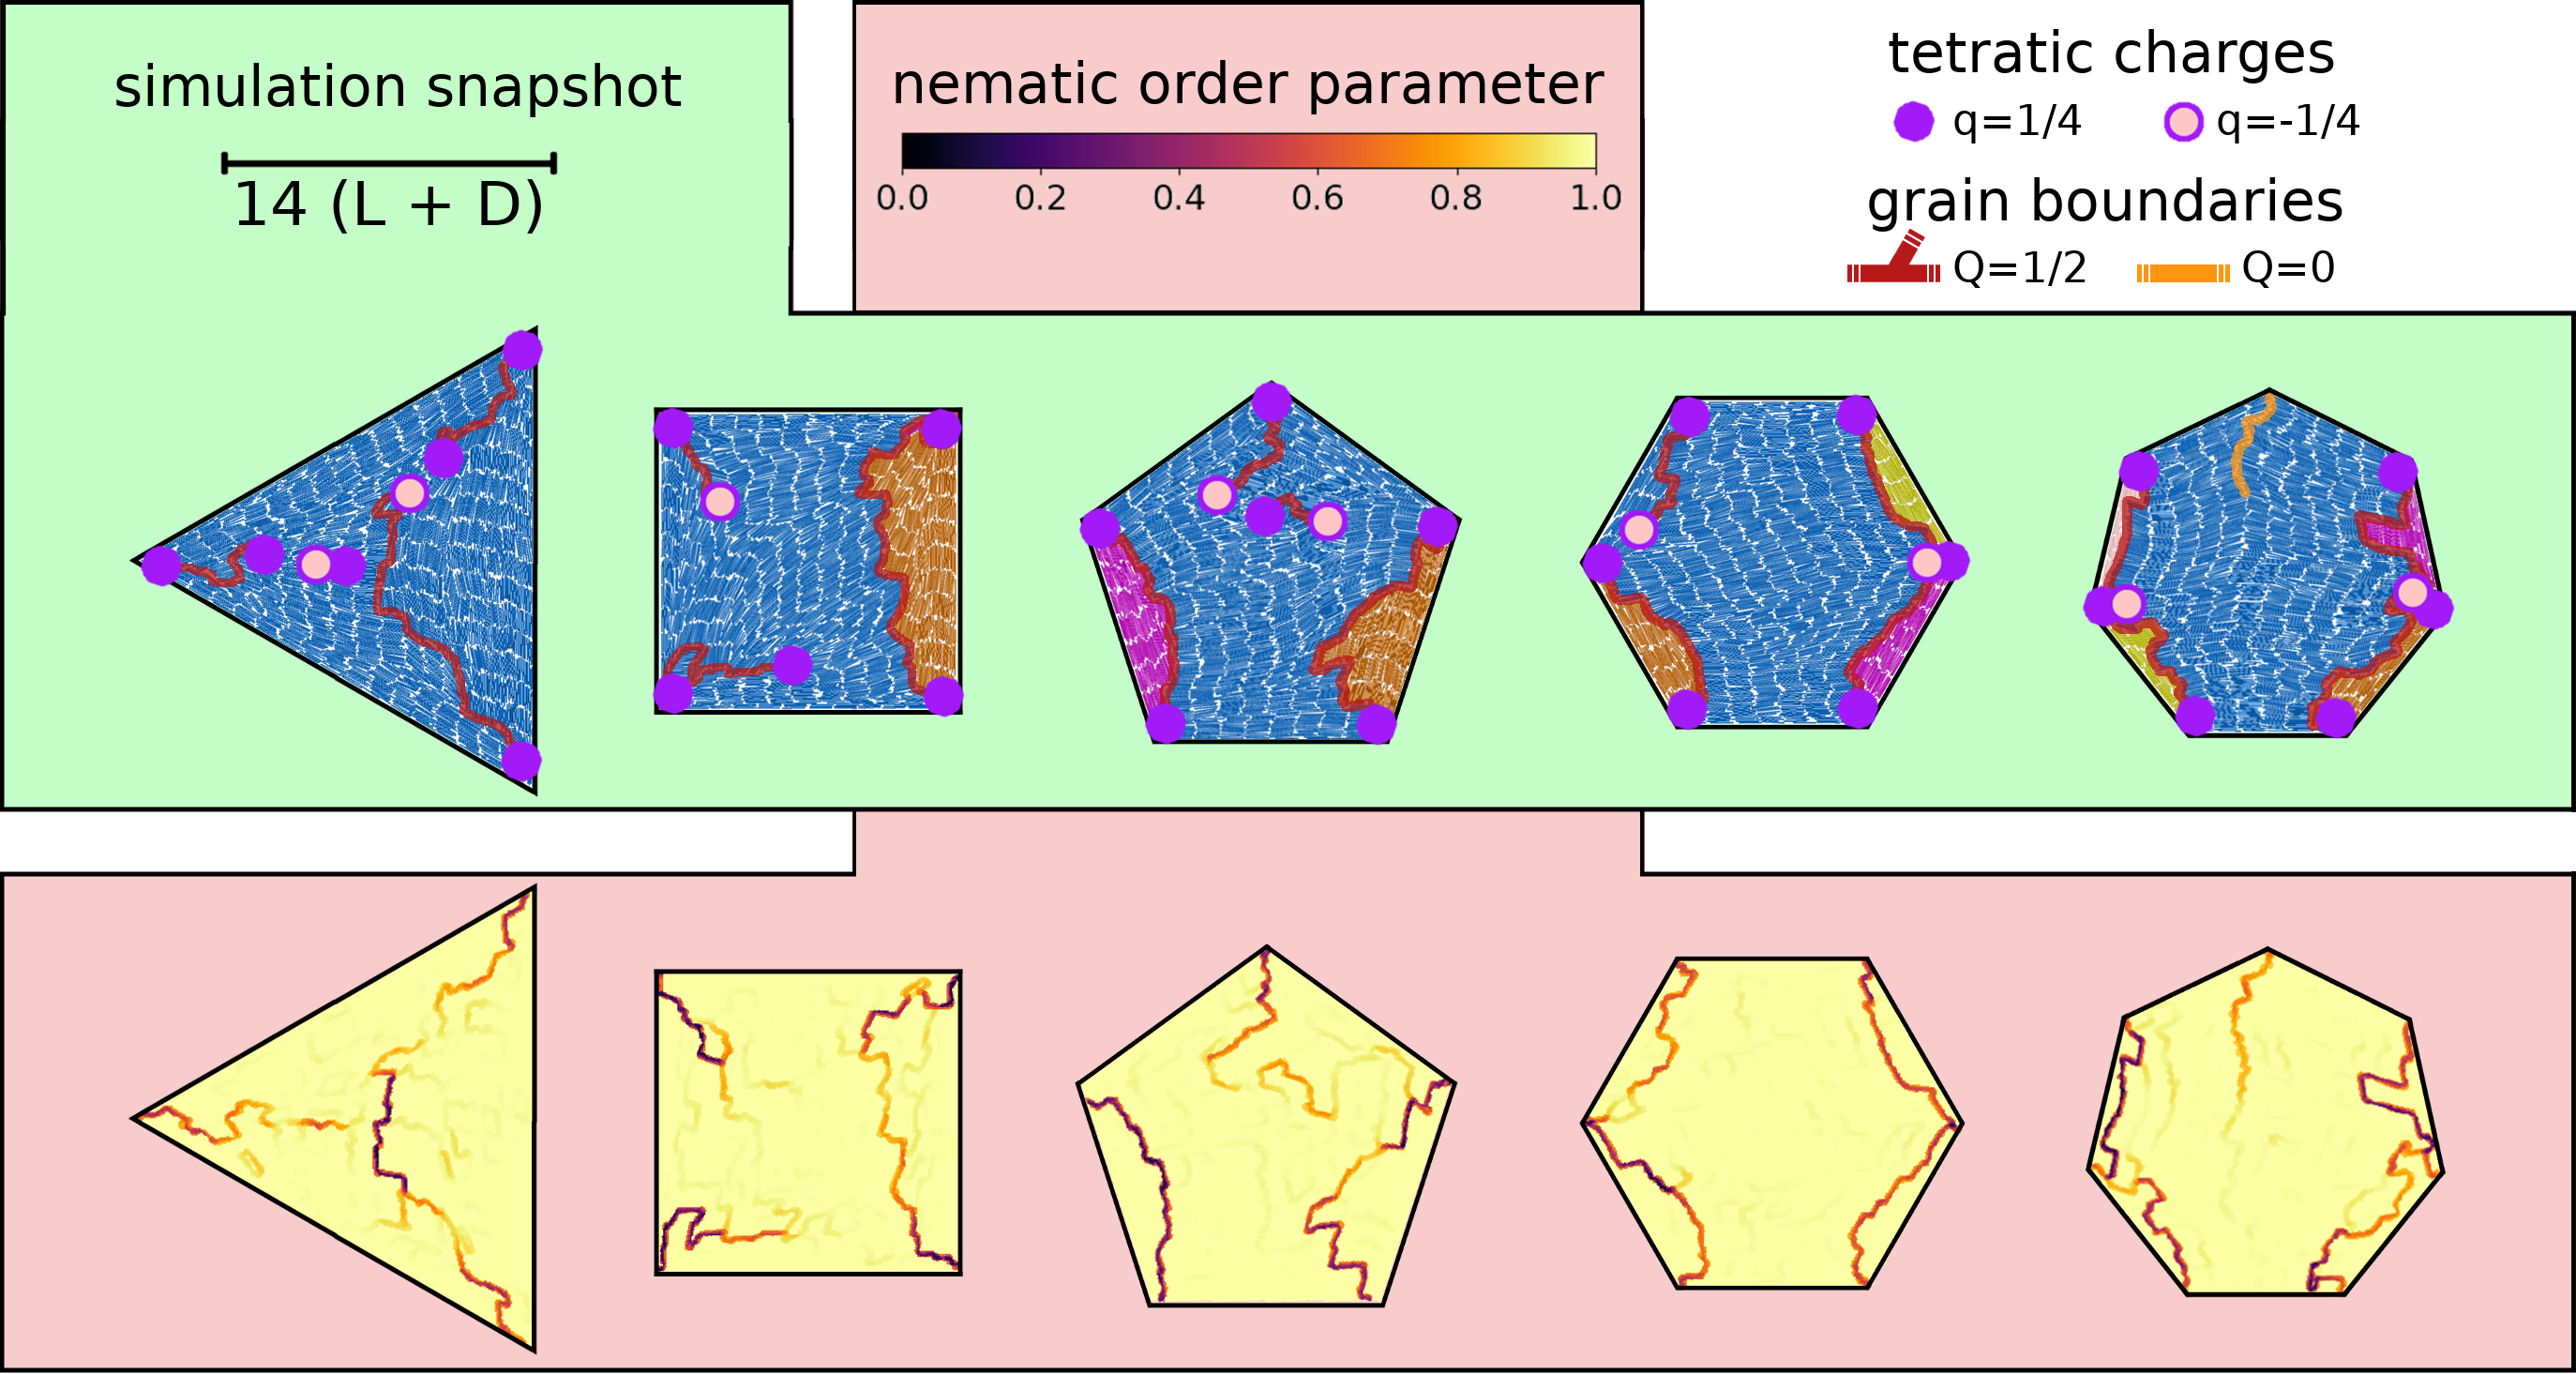
The extremely confined structures with particles shown in Fig. 8 display a tendency to develop pronounced positional distortions all across the central bridging domain. This is for instance visible through the slightly rotated dislocated layer in the hexagon and the strong elastic deformations in combination with the almost system-spanning central grain boundary in the heptagon. Moreover, the triangular cavity typically displays a single network featuring a positively charged node with , separating three equally-sized domains. Strictly speaking, this structure is different from the bridge state, irrespective of the identical set of building blocks. For systems larger than those considered in the main text, the enhanced flexibility leads to a higher frequency of smectic layers interrupting and thus disconnecting the individual grain-boundary networks. In return, this results in a higher frequency of structures with unified neighboring domains, as can be nicely observed for in Fig. 10. This behavior is exemplified in a more pronounced way for in Fig. 10, depicting a larger number of grain boundaries with partially annihilated tetratic end points, while the length of all grain boundaries relative to the cavity size decreases.
V.4 Comparison between simulation and experiment
To establish a closer connection to the experimental data shown in the main manuscript, we show in Tab. 3 a set of simulation data for systems with a constant ratio of the side length of the hexagonal confinement and the rod length. This allows for the formation of seven to eight smectic layers at each side like in the experiment. The remaining parameters are the area fraction and the rod aspect ratio .
Keeping the packing fraction fixed, we find that the distribution of the different structures is largely independent of the aspect ratio, although a change in is accompanied by a relatively big change in the particle number . This means that the effect described in Sec. V.3 of increasing is mainly due to increasing the typical length scale of the confinement relative to the particle length. Therefore, the difference of (effective) aspect ratios in our simulations and experiments has no significant effect. In contrast, we observe a clear trend that the distribution of domain numbers shifts to smaller values when the packing fraction is reduced. In conclusion, structures with more flexible smectic layers as well as less separated domains, which are typical for our colloidal experiment, are best reproduced in our hard-rod simulations for choosing a particle number and aspect ratio compatible with the desired number of layers in a given geometry and reducing the packing fraction , see Fig. 11 for an exemplary structure.
In principle, a closer match between simulation and experiment could likely be reached by taking into account (i) the effects of the slight softness and polydispersity of the silica rods, which also tend to reduce the rigidity of the smectic layers, (ii) the three-dimensional nature of the experiment, which makes it difficult to estimate and compare an explicit packing fraction at the bottom, and (iii) the particular equilibration protocol of the two-dimensional simulation, contrasting the experimental sedimentation process (also note that the compression in our experiments is faster than in Ref. Wittmann et al. (2021), since in this work we use a larger number of rods, which results in a higher osmotic pressure at the bottom of the cavity).
