Effects of mutations and immunogenicity on outcomes of anti-cancer therapies for secondary lesions
Abstract
Cancer development is driven by mutations and selective forces, including the action of the immune system and interspecific competition. When administered to patients, anti-cancer therapies affect the development and dynamics of tumours, possibly with various degrees of resistance due to immunoediting and microenvironment. Tumours are able to express a variety of competing phenotypes with different attributes and thus respond differently to various anti-cancer therapies.
In this paper, a mathematical framework incorporating a system of delay differential equations for the immune system activation cycle and an agent-based approach for tumour-immune interaction is presented. The focus is on those metastatic, secondary solid lesions that are still undetected and non-vascularised.
By using available experimental data, we analyse the effects of combination therapies on these lesions and investigate the role of mutations on the rates of success of common treatments. Findings show that mutations, growth properties and immunoediting influence therapies’ outcomes in nonlinear and complex ways, affecting cancer lesion morphologies, phenotypical compositions and overall proliferation patterns. Cascade effects on final outcomes for secondary lesions are also investigated, showing that actions on primary lesions could sometimes result in unexpected clearances of secondary tumours. This outcome is strongly dependent on the clonal composition of the primary and secondary masses and is shown to allow, in some cases, the control of the disease for years.
keywords:
secondary lesions , immune response, combination therapies , tumour morphology1 Introduction
Cancer is a generic definition of a disease that, among its typical features, is driven by dynamic alterations in the genome [1]. These microscopic changes not only give birth to a variety of different types of cancer at the macroscopic scale, but can also lead to heterogeneity within the same cancer tissue: tumour phenotypes undergo clonal expansion and genetic diversification, promoting natural selection mechanisms that favor cell clones with advantageous characteristics [2, 3].
Alterations in the DNA of the cell, such as inclusions of copy number aberrations and point mutations, occur early during the neoplastic transformation and usually before any possible clinical detection [4]. The step-wise accumulation of driver mutations may confer survival advantages in relation to the particular environment in which they are embedded and may be accelerated by so-called selective sweeps [5]. Furthermore, although the immune system routinely recognises and kills any dangerous host including cancer, mutations can provide cancer cells with the ability to avoid detection or immuno-suppress the environment, advantaging tumour progression or preventing eradication [1]. Processes involving mutations, cell growth and immune surveillance cumulatively result in the emergence of different cancer populations integrated in an environment made up of healthy tissue, immune cells and stroma [6, 7].
Understanding how these complex interactions shape and influence each other is one of the greatest challenges in current medical biosciences. For example, morphology is known to be strongly sensitive to tumour adaptation to the environment (e.g. the lack of nutrients, oxygen, space) and by the combined action of immune response and existing anti-cancer therapies [8] such as chemotherapy, radiotherapy, immune-boosting and so on. In the last quarter of century, a number of diverse contributions have been proposed from the biomathematical community to shed light on some of these complex interaction mechanisms. Several mathematical models have been advanced using the framework of population dynamics, with tumour immune interactions considered, for example, in Ref. [9, 10] and cancer mutations in Ref. [11]. Other works have involved a discrete Cellular Potts approach [12] or different degrees of hybrid modelling [13, 14], with particular focus on tumour shape [8, 15]. The effects of some of the currently available anti-tumour therapies have also been analysed in the context of evolutionary dynamics [16, 17], with immunotherapy [18, 19, 20, 21] and, recently, using agent-based modelling in the context of virotherapies [22]. A number of reviews detailing the evolution and the contribution of these and other models also exist in the literature [23, 24, 25, 26].
The focus of the present work is on metastatic secondary solid lesions, with particular emphasis on the role of the immune system and mutations. Scope of the this work is the study of the effects of different combination therapies on secondary lesions in order to better understand the dynamics involved and the role of mutations on treatments’ effectiveness. The rest of the paper is organised as follows. In the “Model” section, a description of the mathematical approach used to describe tumours, immune responses and anti-cancer therapies is given. Findings obtained via computational analysis are illustrated and analysed in the “Results” and “Discussion” sections. Finally, the “Conclusions” section terminates the paper.
2 Model
Let us consider the biological setting under study as follows: a primary, clinically detected cancer is present in a patient and it is scheduled to be treated with different therapeutic approaches, in an effort to improve the patients’ clinical outlook. A secondary lesion is also growing, undetected and located away from the primary site, due to previous metastatic events and migration of tumour cells belonging to the first lesion. We are interested in understanding how the secondary lesion is affected by strategies aimed at reducing the primary one. Our approach is based on an existing mathematical model for tumour-immune interaction [27], which has been validated previously both from the point of view of biological appropriateness and sensitivity to model parameters. The phenomena at hand are inherently complex and there is a number of unknowns that still characterise these processes. Our work is thus focussed on understanding the major trends and the typical outcomes that can emerge in treating secondary lesions, providing some quantitative data that can be tested experimentally.
The dynamics between a heterogeneous, small, solid cancer lesion and the immune system is formulated using an hybrid agent-based model (ABM) coupled with a delay differential equation (DDE) system. An immune response to cancer cells that grow and mutate is simulated using a population of cytotoxic T lymphocytes (CTLs), which mature in a tumour-draining lymph node. The overall approach rests on an existing framework, originally discussing tumour cells endowed with only a unique, single phenotype. The novelty of the present formulation lies in considering more than one clone, with mutation processes strongly influencing and shaping tumour growth dynamics. For a full analysis and description of the model we refer the reader to Ref. [27], and only discuss the equations briefly in the following.
The system describing immune activation is given by:
| (1) |
where is the total cancer cell population and , , , , are the concentrations of antigen presenting cells (APC), mature APCs, memory CTLs, effector CTLs and CTLs, respectively. A sketch of the dynamics captured by the above equations is depicted in Fig.1.
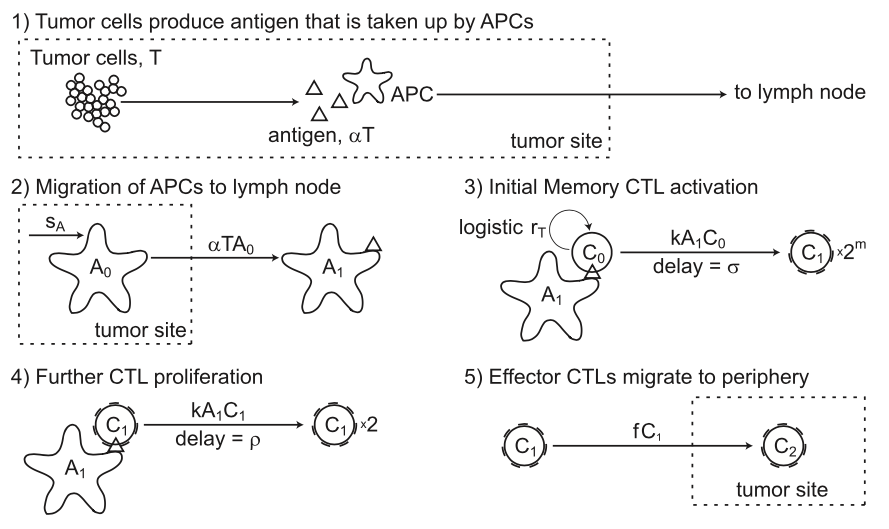
The first two equations describe the transition from immature APCs circulating in the periphery to mature ones migrating to the lymph node as a response to tumour antigens.
The population of immature APCs is generated and dies at constant rates and , with the maximum value of corresponding to the equilibrium level . When tumour antigens are presented, decreases proportionally to the antigenicity value and mature APCs () begin entering the lymph node, with some dying at natural death rate .
The presence of mature, tumour-antigen-bearing APCs in the lymph node causes memory CTLs to activate and mature into effector CTLs, with a certain delay. Consequently, the effector CTLs proliferate and migrate to the tumour site where the anti-tumour immune response starts. This process is captured as follows. The third equation represents the stimulation by the APCs of the memory CTLs (), with a logistic growth rate independent of the external stimuli and a stimulation by mature APCs that follows a mass action law. In the fourth equation, memory CTLs develop a minimal division process, characterised by times divisions, and evolve in effector CTLs () with a time delay . Then, effector CTLs divide again in a time and flow away of the lymph node or naturally die with a rate . The last equation represents the concentration of CTLs () in the periphery around the tumour and provides the concentration used by the ABM component of the model to generate the boundary conditions for the tumour-site domain. Table 1 shows parameter values used in this system of equations and their meanings. Subsection 2.1 reports the parameter estimation and the related sensitivity analysis, which have been mostly performed in previous works [27].
| Par. | Description | Value (range) | Ref. | Note |
|---|---|---|---|---|
| Initial concentration of immature APCs | 0.01 | [28] | same order of magnitude as the APCs in the lymph node | |
| Death/turnover rate of immature APCs | 0.03 | [29] | similar to those of naïve T cells | |
| Supply rate of immature APCs | [29] | |||
| Death/turnover rate of mature APCs | 0.8 | [30] | using a half-life of 20 h: | |
| Equilibrium concentration of memory CTLs | [28] | of the T-cells in a lymph node of radius 1 mm | ||
| Logistic growth rate of memory CTLs | [27] | minimum doubling time of 1 day | ||
| Minimal number of CTL divisions | 10 | [31] | range from 7 to 17 cell divisions [32, 33] | |
| Death/turnover rate of effector CTLS | 0.4 | [34] | half-life during T-cell contraction of 41 h: | |
| Mass-action coefficient | 20 () | [28] | with and | |
| Duration of one CTL division | 8 h | [35] | T-cell doubles every 8 hours during expansion [34] | |
| Duration of CTL division program | [36] | first division does not occur until 24 hours after stimulation | ||
| Antigenicity of the tumour | () | [27] | reciprocal of the rate of encountering of antigen from a tumor cell by APC | |
| CTLs flow rate out of lymph node to tissue | [27] | effector CTLs emigrate at a half-life of 1 day: | ||
| Ratio of volume of tissue to the lymph node | 1000 | [37] | lymph node compartment is and the breast tissue |
Cancer dynamics and immune cells response
The ABM controls tumour growth dynamics and the interaction between tumour cells and CTLs at the tumour site, which follow specific algorithmic rules. Our model does not consider healthy tissue around tumours and other structures such as the stroma or the cells part of a vascular network: it is assumed that tumour’s surroundings are effectively healthy cells being “pushed away” by the growing tumour. Note also that no vascularisation is present due to the limited size of the secondary tumour lesion, which is considered to be small, solid and with no necrotic core. Furthermore, other motility of metastatic processes from the secondary lesion are neglected. The overall assumption is that the secondary tumour is trying to colonize the site and is in its early stages of proliferation. All cells partaking the dynamics are represented as spheres of radius in 3D space, with no overlap. ABM is updated in discrete timesteps .
CTL agents. The rules that govern CTLs cells via the ABM are three: motion around the tumour, recruitment of other immune system cells and killing of tumour cells. As mentioned, CTLs cells appear at a concentration at the border of the spherical domain representing the region of interest where the tumour is growing. They then move into that region performing Brownian motion in 3D space until they either collide with a cell or leave the domain. At each time step, the position of the cells are given by independent random variables with normal distribution , where the variance is such that , with being the diffusion rate of the CTLs. When an immune cell comes into contact with a cancer cells three possibilities exist:
-
1.
A CTL clone can be recruited with a probability , with being the average recruitment time. Mathematically, CTL recruitment is modeled similarly to Mallet et al. [38] with cellular automata, and it is biologically validated as in [39, 40]. When the first CTL cell engages a cancer cell and starts recruiting another CTL clone, a second cell appears at a position adjacent to the first cell. The direction of the new clone is chosen randomly among all directions available.
-
2.
A cancer cell is not recognised with a probability , where is the probability of the i-th cancer phenotype (see below) to be recognised by the immune system. The parameter has a value of one for cancer agents, expressing antigens completely matching with the T-cell receptors and thus, that are always detected by the immune system. A value of zero indicates that the antigens of a phenotype are completely unrecognised. If the cancer cell is not recognised, the CTL starts to move again choosing a new random direction and accelerating up to the maximum unit standard deviation . If is the time necessary to accelerate from the stationary to the maximum diffusion rate, the CTL acceleration is computed as: . This approach aims at approximating CTL chemotaxis along a chemokine gradient [41, 42].
-
3.
A cancer cell is recognised and killed with a probability , with being the average time for a CTL to eliminate a cancer cell. The killing process is obtained by removing the agent. After the agent is removed, the immune cell starts to move again as described above.
If CTLs die naturally, then they are removed from the system. An explanation of the ABM-parameters is reported in Table 2 whereas parameter estimation and sensitivity analysis is discussed in Subsection 2.1.
| Par. | Description | Value (range) | Ref. | Note |
|---|---|---|---|---|
| Time step | 1 min | [27] | timescale of the fastest dynamic simulated in the model | |
| Radius of cells | 5 | [43] | [38, 44, 28] | |
| Avg. division time of i-th cancer phenotype | 1-39 day | [45] | [38, 46, 47] | |
| Avg. division time of original phenotype | 7 day | [45] | [38, 46, 47] | |
| Max unit standard deviation of CTL diffusion | 12 | [28] | [48] | |
| CTL acceleration time from 0 to | 5 h | [27] | ||
| Avg. CTL lifespan | 41 h | [34] | ||
| Avg. time fro CTL recruitment | 22 h | [27] | [39, 40] | |
| Avg. time fro CTL to kill tumour cell | 24 h | [27] | killing target cells may require a long recovery period | |
| Radius of region of interest | 620.4 | [27] | ||
| Thickness of CTL cloud | [27] | probability that a CTL could pass from outside into the region of interest is 0.001 | ||
| Probability of mutation | 0.01 | [49] | ||
| Probability of recognition of i-th cancer phenotype | 0-1 | Span the entire probability range | ||
| Probability of recognition of original phenotype | 1 | the APC cell can always recognize the antigen released |
Cancer agents. Tumour cells can proliferate, mutate or die, killed by the immune system, and no migration is considered. This approximation is motivated by the scope of the study, which is focused on the solid, growing secondary lesion after the colonisation of a new tissue. In this early stage of implantation most of the cells are assumed to be in a proliferation state and migration can be neglected [50]. Cellular division occurs with a probability , , where is the average division time of the i-th tumour phenotype. When a tumour cell divides, the position of a new cell is chosen randomly on the mother cell’s perimeter, such that the daughter cell is tangent. If no space is available in the chosen position, the division process fails and no new agent is created, mimicking the contact-inhibition mechanism occurring in the early stages of metastasis implantation [51].
To analyse the effect of mutations on cancer development and immune response, we use five different cancer phenotypes that may emerge from the mutation of an original clone, identified by different values of characteristic parameters and . Mutations can occur during cell duplication, with a probability that aims to capture the genetic instability of the system. Each mutated cell is then identified by indices representing the level of expression of the two characteristic quantities and . These values effectively classify the mutated clones and the following mutated phenotypes. Modeling few phenotypes of mutated cells is a simplification justified by several works showing that only a limited number of phenotypes are predominant in a tumour, see for example [8]. For the scope of our study, the five mutated clones are prototypical of a wide range of similar mutations. In Table 3 cancer clonal composition is considered. One of the assumptions is that only one class of CTLs is modeled and it is not antigen specific. Although different types of CTLs could take part in an immune response and act differently depending on the clone, our immune attacks are regulated only via .
| Name | Description | ||||||
|---|---|---|---|---|---|---|---|
| original |
|
1 | 7 day | ||||
| (0.5,0.5) |
|
0.5 | 7 day | ||||
| (0,1) |
|
0 | 13 day | ||||
| (0.25,0.75) |
|
0.25 | 10 day | ||||
| (0.75,0.25) |
|
0.75 | 4 day | ||||
| (1,0) |
|
1 | 1 day |
Using these different types of phenotypes, as we will see shortly, helps us to shed light on the role of mutations in determining the effectiveness of immune response and anti-cancer therapies. Different clonal compositions and reproductive and immunoediting advantages dramatically influence the outcomes of anti-cancer therapies.
Modeling therapies: chemotherapy, immune boosting and radiotherapy
One of the typical features of secondary lesions is that they usually show cells with mutated functional characteristics respect to the original tumour, due to the genetic instability typical of metastatic masses they originate from. We reiterate that there is no analysis of the fate of the global cancer disease but only on such secondary lesions, which can show different dimensions, compositions, structures and biological characteristics from the primary neoplasia. Chemotherapy, immune boosting and radiotherapy are the strategies our modelling focuses on.
Chemotherapy. This treatment consists of cytotoxic drugs targeting a specific cellular phase of the cell cycle to induce cell death. The procedure acts against rapidly proliferating cells, independently from their nature [52]. This means that healthy cells and immune system cells are usually damaged along with cancer cells, and this leads to well-known side effects for the patients. In this work, only the primary killing effect against cancer cells and no direct effects on the immune system is assumed. This simplification is motivated by two main points. First, the average CTL lifespan is 41 hours, whereas the tumour division rate is greater and the tumour death rate due to the therapy is slower. CTL cells are rapidly affected by the reduction of the tumour mass and no new CTL is recruited: the “old” cells tend to naturally die. Second, if on one side chemotherapy affects the immune cells, on the other specific T-cell response is reinforced [53], and the investigation of these secondary effects is not in the scope of the future present work.
During a cycle of chemotherapy of duration , the i-th cancer phenotype can go through cellular death with probability , where the average time for the drugs to induce cellular death is and depends from the proliferation potential of the phenotype. takes into account a single cycle of three injections every three days and represents the global time duration of the chemotherapy’s effects. The drug remains two days above a certain percentage level such that the cytotoxic effects on tumour cells can be considered constant.
Different values of have been explored as reported in Table 4, supposing that the same total dose is inoculated in continuous cycles of low metronomic doses. The effect of different with the same total dose is a faster or slower decrease of the cancer population with similar qualitative dynamics. In particular, for clone (refer to Table 3 for notation), i.e. the phenotype that grows slowly but is poorly immunogenic, , namely a -death is very rare. Clone , with , has , so that the tumour with higher proliferation rate has very high probability to die due to the effect of the drug.
Immune boosting. We use this generic term to capture the number of clinically available strategies that potentiate an immune response. For example, a treatment that is increasingly used for cancer patients is the so-called adoptive cell transfer (ACT), where patients’ own immune cells are stimulated and modified to treat their tumour. There are several types of ACTs that go under different acronyms depending on the boosting strategy employed, with the most used ones nowadays being TIL (Tumour infiltrating lymphocytes), TCR (Tumour cell receptors) T-cell and CAR (Chimeric antigen receptors) T-cells treatments [54].
We concentrate in particular on TIL therapy, where T-cells are extracted from the patient’s tumour, grown in vitro to boost their numbers and injected back into the patient to contrast cancer progression. This strategy appears to be, for example, one of the most effective treatment against metastatic melanoma [54]. In our approach, TIL is modeled as a continuous increase of the CTLs concentration in the cloud, depending on the value of at the starting time for the therapy. The net increase is modeled by a number of cells for a short time . For simplicity, in the following we refer to this treatment as immune boosting or simply boost. The parameters used to model boost and chemotherapy are explained and collated in Table 4.
| Parameter | Description | Value (range) |
|---|---|---|
| Duration of a chemotherapy cycle | 10-50 day | |
| Effect of chemotherapy | ||
| Persistence time of boosting (TIL) | 3 day | |
| Number of CTL cells injected | 500-1000 |
Radiotherapy. Radiotherapy (RT) uses ionising radiation to induce cell death in a localised area under treatment. This therapy has several positive and negative feedbacks on the immune system, modulating different compartments of the tumour microenvironment. In particular, tumour-specific antigens and immune-stimulatory signals are released by the dying cancer cells.
Because of its contributing primarily to the original, metastatic neoplasia, the effect of RT is here modelled as an indirect effect on the secondary lesion and is accounted for as as a restoring factor in the ability of CTL cells to recognise and kill various cancer phenotypes.
2.1 Parameter estimation and sensitivity analysis
The biological significance of parameters and processes that underpin the present model has been discussed at length elsewhere [27, 55]. In some cases, such as, for example, parameters used for tumour division time or cell radius, well-established values in the literature have been used [43, 44, 45, 38]. In other cases, estimations from the available experimental and theoretical data have been carried out.
A sensitivity analysis has originally also been carried out for eight parameters of the model: and . Other parameters have not been considered because their role is known to be marginal. For instance, the replenishment rate for memory CTLs is known to be irrelevant, since only a very tiny fraction of memory CTLs () is known to be affected by the tumour. Similarly, the duration of CTL division (time delay parameter in the DDE) is too small to impact the CTL division program as a whole and does not influence final outcomes. Using Spearman’s rank-order correlations, tumour populations’ values and extinction times, Kim et al. have concluded [27] that tumour division times , antigenicity and the number of divisions of memory CTLs upon activation are the most sensitive parameters.
In this work, we use the same parameters proposed in the original paper, with the only difference of , still chosen in the proposed interval but capturing a more aggressive tumour (i.e. days). The effect on simulations is to shorten the proliferating phase, which occurs at a larger growth rate and allows for a quicker immune response.
The new probability coefficients introduced here, i.e. and , have different effects. By using different simulations with different initial random seeds and different values of the parameters, we conclude that has no effect on the final outcomes of the system, but only accelerates or delays the identical dynamics shown by the model.
instead has a notable effect on the system. When for a given -th clone, the immune system is unable to eradicate that particular phenotype and, if no external therapy is present, the tumour endlessly grows.
As far as the values for therapies’ parameters are concerned, i.e. , , , , they are chosen so that the dynamics between tumour, immune system and therapies display interesting behaviours and does not result in an immediate negative or positive outcome. In particular, and have been varied in a number of different instantiations of the model, with only the cases , cells used in the discussion of results. Variations of those parameters do not alter in a significant way the prototypical dynamics that we will discuss shortly. Note that has been chosen so that the cytotoxic drug targets fast proliferating cells.
2.2 Morphological and complexity measures
Three indices that capture the shape and cellular compositions of the tumour mass are introduced and monitored in our computational experiments. Note that these indices can guide the evaluation of collective properties of the evolving tumours. They are useful to discriminate between different evolutions of the cancer masses and have also been validated in some in vitro experiments, as shown by other authors in previous works [56, 14].
Roughness. Although random proliferation of a group of cells leads to an almost smooth and spherical object, a tumoural mass with diverse clonal families under the action of the immune system can present itself as a rough aggregate. To account for this, a measure of roughness is introduced, as the ratio between the surface and the volume of the aggregate [56]. The minimum ratio is represented by a sphere , where the value has been non-dimensionalised as follows: . The roughness index , expressed in terms of the minimal ratio for a sphere, is given by:
| (2) |
A compact, non-infiltrated, almost spherical tumour mass has an index close to unity while a tumour with highly irregular borders, for instance a solid tumour with fingers and clusters of invasive cells or a mass highly infiltrated by the immune system, displays a higher value.
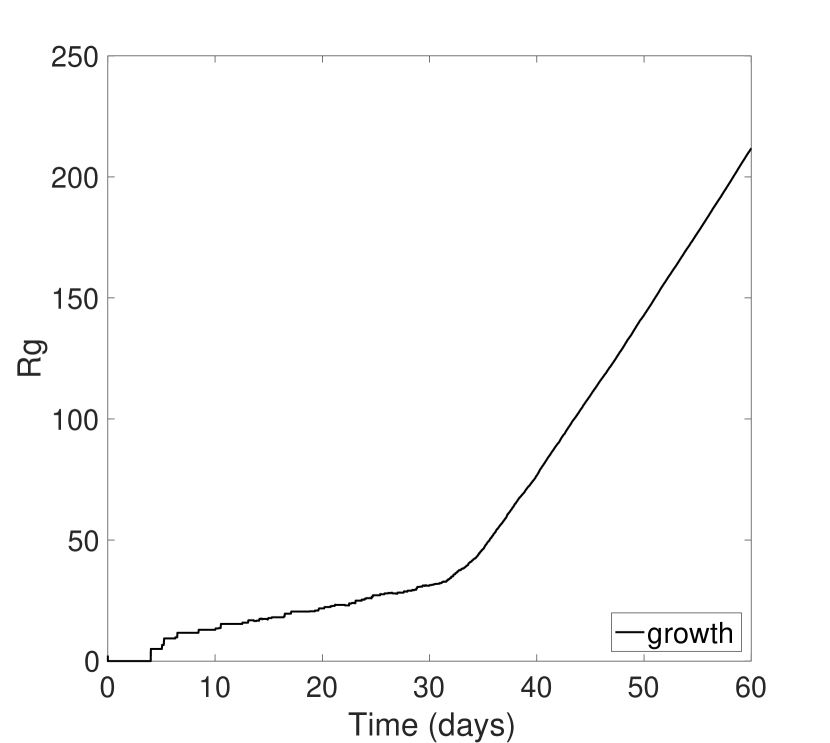
Radius of gyration. This value represents the radius of a sphere that contains the whole tumour aggregate and reads:
| (3) |
where is the total number of cancer cells and is the distance of each clone from the center-of-mass of the tumour () that can vary during the tumour progression.
Shannon Index. This indicator is introduced to account for the presence of different phenotypes within a tumour, with regards to tumour heterogeneity and relative frequency of each clonal family (). The Shannon index is thus defined as:
| (4) |
where is the relative abundance of the phenotype and is
the total number of different phenotypes (in our case ). For
simplicity, is then normalised to the interval where zero
indicates a homogeneous population with only one clonal family and unity
represents a fully heterogeneous population where all phenotypes
are equally present.
3 Results
The model outlined in the previous sections is the basis for in silico experiments, where a different number of therapies and their combinations are tried out for significant values of the parameter set. Depending on the initial conditions, the system exhibits three typical behaviours, namely eradication, sustained (irregular) oscillations or exponential, uncontrolled growth when an immune response to a growing tumour is present. We consider parameter values where the effect of clinical therapies are relevant. Cases where the tumour grows too fast or too slow, making the effects of therapies not noticeable, are excluded from our analysis. Stationary behaviour has never been observed. Outcomes also depend on the characteristics of cellular phenotypes present in the growing mass, strongly influencing its speed of growth, its ability to counteract the action of T-cells with immunoediting and its morphological qualities, which can hinder the ability of the immune system to effectively erode the cancer.
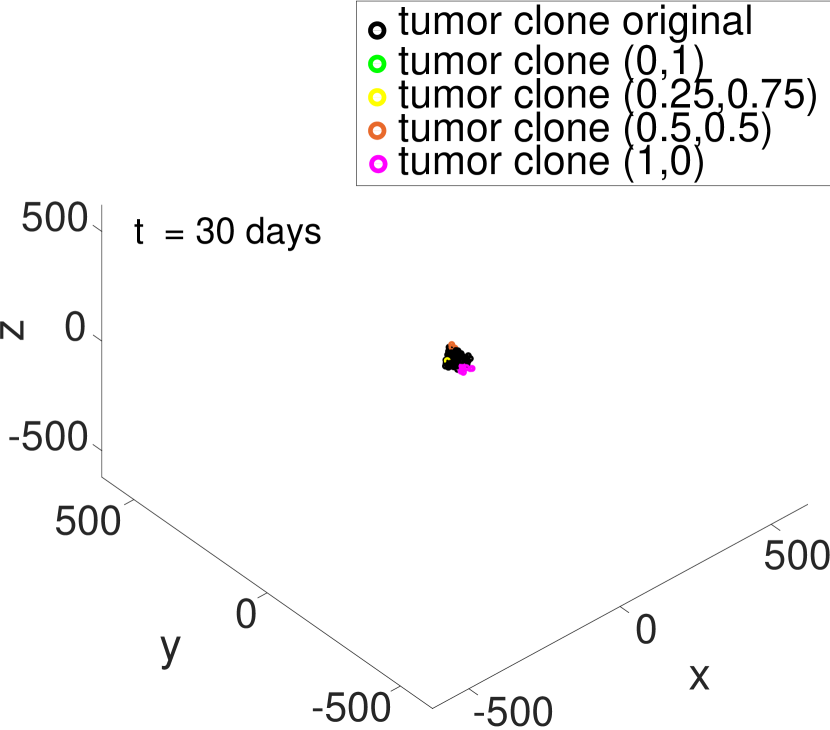
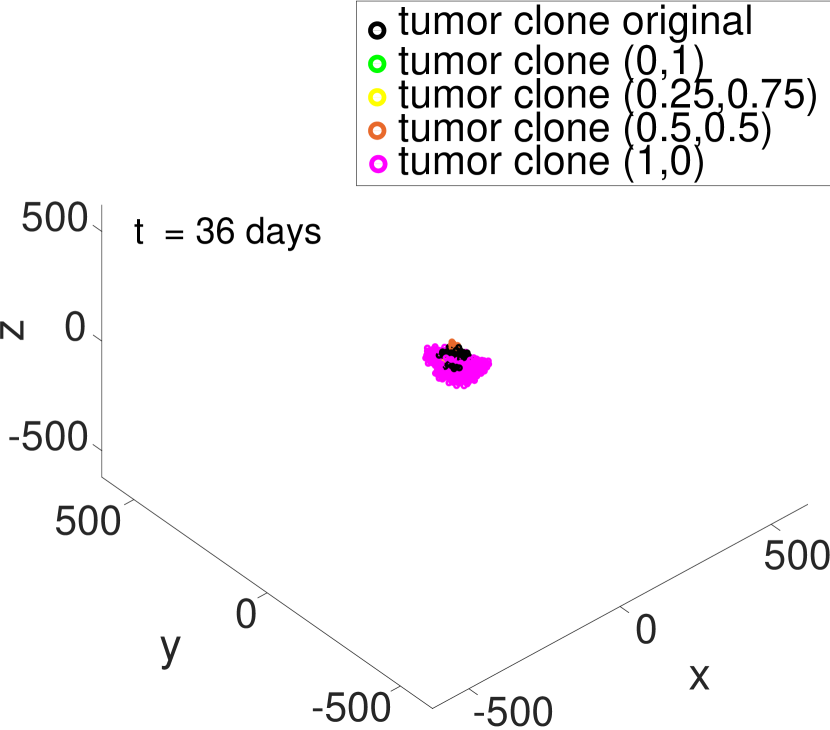
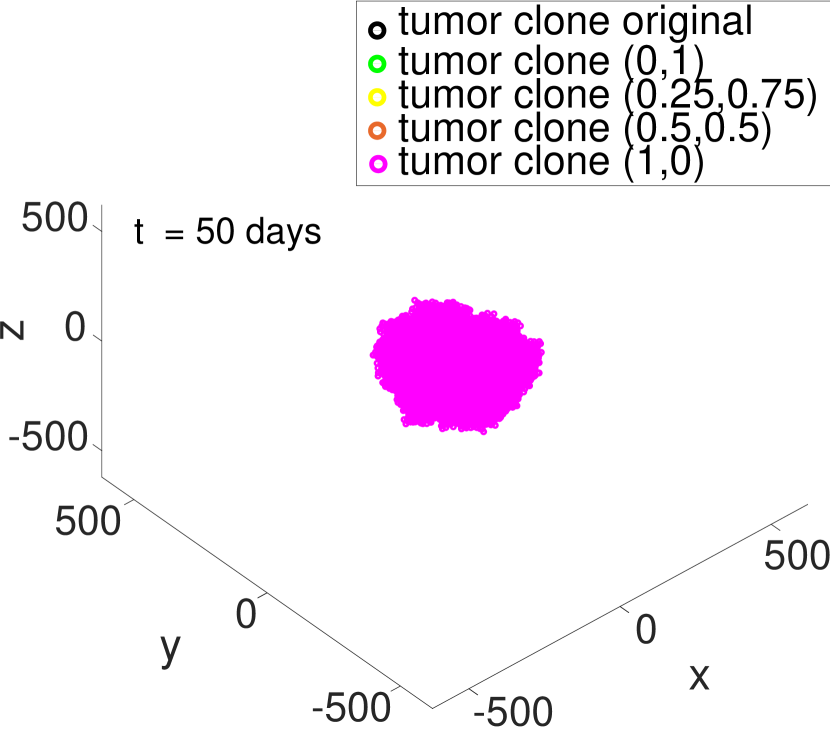
Considering the dynamics observed in a number of computational experiments performed at biologically meaningful parameter values, tumour growth generally appears as exponential, with a consequent linear increase in the radius of gyration with time, as previously observed [57]. The main reason, as explained in Ref. [14], is that the growth is driven by those cells that reside at the periphery of the mass. The nearly spherical shape of the tumour when only a single clone is present changes significantly in the presence of mutations. The greatest contribution to asymmetry occurs when a new population with a faster proliferation rate than neighbouring cells is generated. In that case, this new population forms an evolutionary niche that can alter the sphericity of the tumour, until the new clones have proliferated enough to surround the slower cells and recreate a spherical appearance, as shown in Fig. 2. Note that, in our model, cells acquire a new phenotype upon mutation in a purely stochastic way and there is equal probability to mutate from the original phenotypes to all the others.
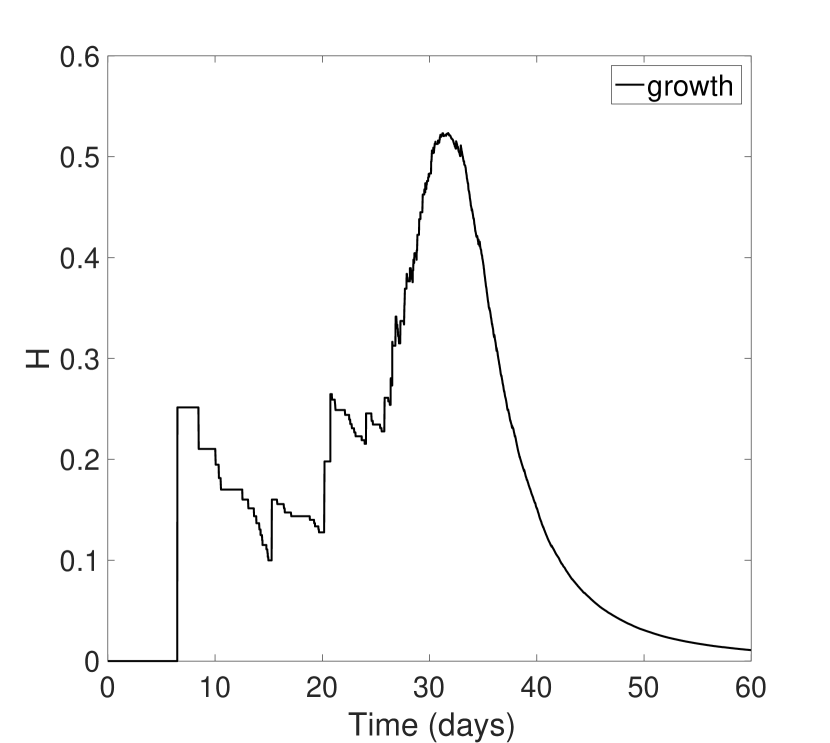
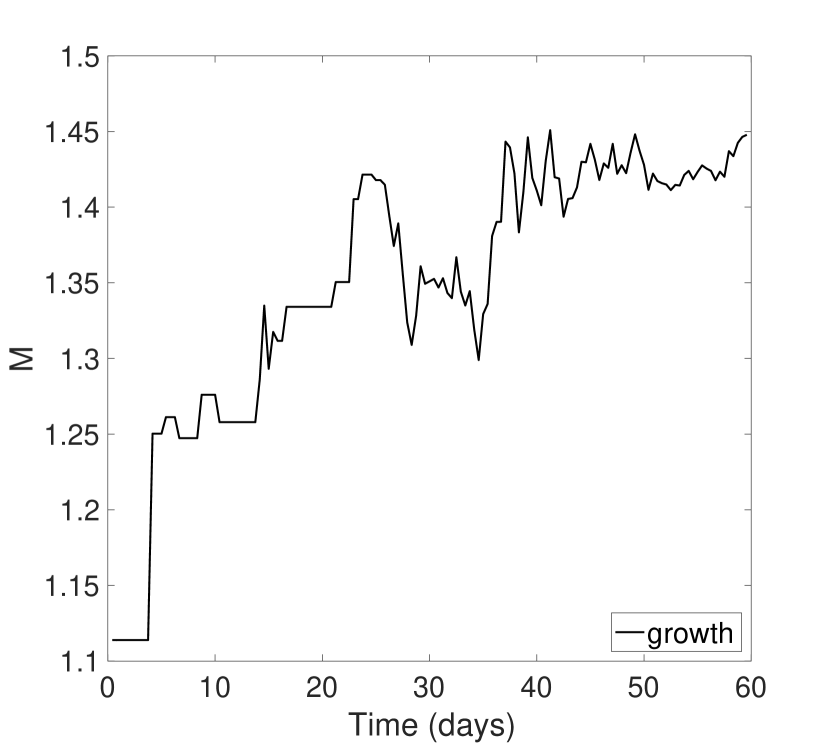
The heterogeneity of the mass increases with mutations until the faster clones are not outnumbering the other phenotypes. If this occurs, then the Shannon index rapidly decreases with time in a way that it is inversely proportional to the growth of the more proliferating clones, i.e. the faster they grow the faster decreases. The action of the immune system usually tends to favor homogeneity over heterogeneity, rebalancing the distribution of phenotypes as long as the immune response is active. As T-cells erode the tumour, natural selection leads to an evolutionary bottleneck characterised by low . It is interesting to note that the roughness of the tumour tends to be in the interval , with signs of superficial infiltration by the immune system. The limited life span of the CTLs used in our model tends to promote attacks that occur on the periphery and rarely result in deep infiltration, which, as we will show shortly, is instead present when therapies are activated.
The effect of therapies on tumours
In the following, all the parameters have been set as in Ref. [27] and are reported in Tables 1 and 2. The tumour mutation rate has been chosen following the principle that positive mutations, i.e. mutations that lead to an evolutionary benefit to the cells over therapies and immune response, are rare. As it is expected, the dominant phenotype population usually appears after a clonal expansion of few mutations. The range of variation of the proliferating, aggressive tumour has been set to ensure a biological meaning and a rate of growth that allows the cancer mass to escape the control of the immune system in a limited range of time. The main reason for this choice is that we are interested in modeling the impact of different therapies on cancers that will not be eradicated in the absence of anti-tumour therapies and that, at the same time, do not show growth rates that are unrealistic. Thanks to the probabilistic structure of the system, simulations can generate different outcomes also when parameters are kept fixed for the particular cancer studied. Among the different experiments, three paradigmatic dynamics emerge, which bear particular relevance and help understanding the typical scenarios that our model predicts. They are the result of stochastic variations on the evolution of initially identical tumours. These cases respectively correspond to a tumour mass with an initial slow growth and high heterogeneity (case A), and two fast growing tumours with either initial low (case B) or high (case C) heterogeneity.
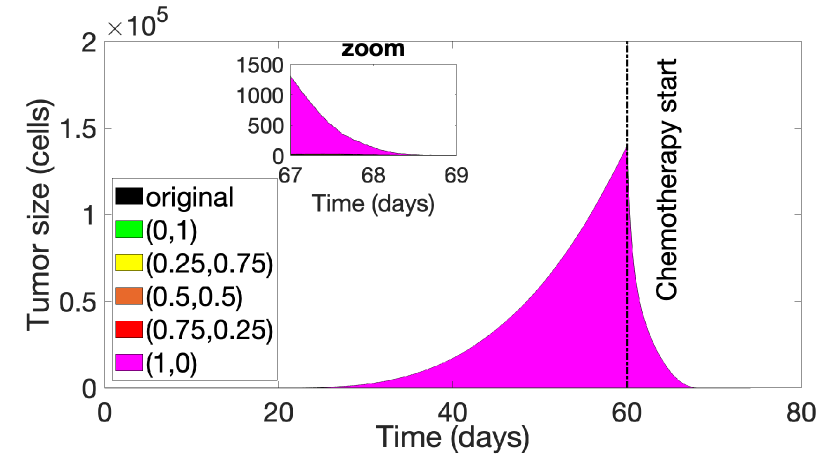
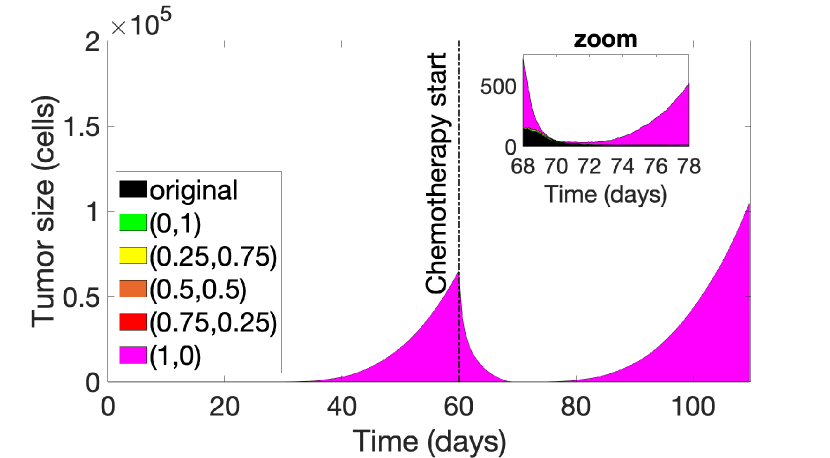
First single-therapy strategy: chemotherapy
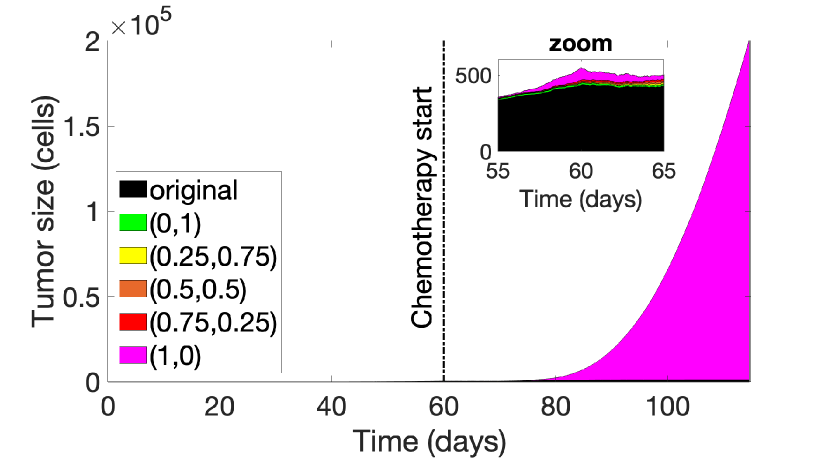
Our first choice is to simulate a cytotoxic chemotherapy that acts with more efficiency against the cancer cells that have the largest growth rate, starting at day after the first tumour cell colonizes the site and for a total duration of days. The probability of a cell to be killed by chemotherapy, with a total dose of drug fixed, is set independently from the time duration of the protocol in an effort to maximize the efficiency of the therapy.
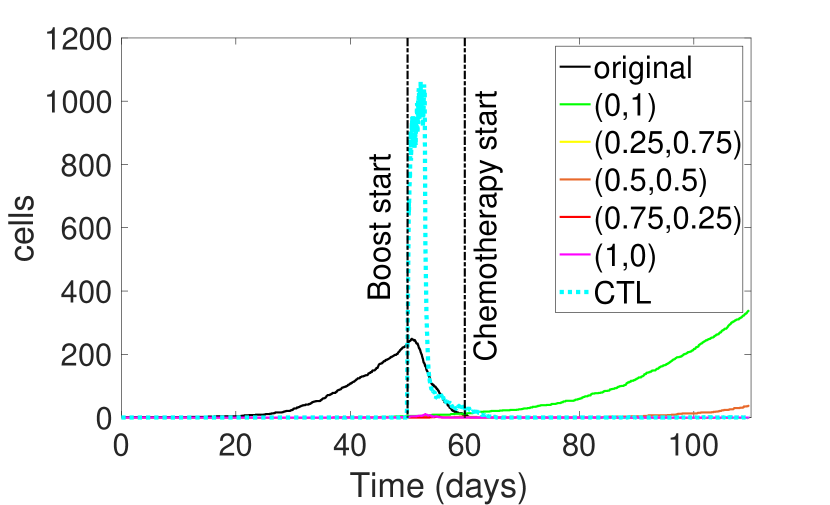
Fig. 3 shows the evolution of the tumour cell population as a function of time, according to different phenotypic compositions. In the following, time is evaluated starting from the instant at which the original clone starts to colonize the new organ. This time does not refer to the primary tumour or the history of his evolution.. In panel (A), the effect of chemotherapy on tumour case A, which is representative of those cancers with lower rates of proliferation but higher propensities to mutate.
A too early start of the treatment results in a completely ineffective strategy, with a negative outcome. This is because chemotherapy reduces the more proliferating cells (in pink) at day when those cells are still scarce and the tumour is too small to benefit from the action of the cytotoxic drug. Once the treatment is over, the remaining cells restart to mutate and proliferate, with an exponential growth that the immune system alone cannot contain. As shown in the inset of panel (A), the number of cells belonging to the original phenotype (in black) remain almost constant throughout the procedure and do not change significantly for the duration of the experiment.
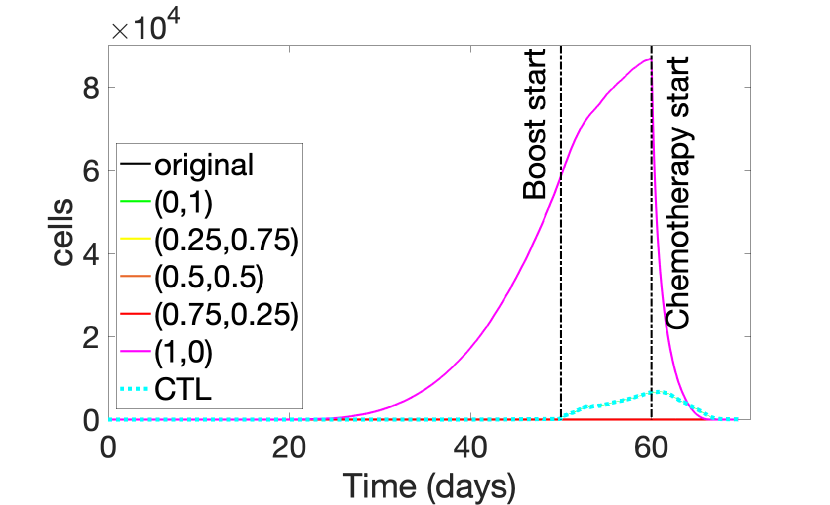
Panel (B) of Fig. 3 instead shows a complete eradication of case B, where tumour cells have initially a low heterogeneity but are reproducing fast. The effect of the therapy is in this case to eliminate every cell belonging to the dominating, fast-reproducing phenotype before it is over, i.e. approximately around day of its days duration. Also, all cells of the original phenotype are eradicated by the end of the treatment, with the tumour completely cleared out by the effect of the cytotoxic drug and the immune response.
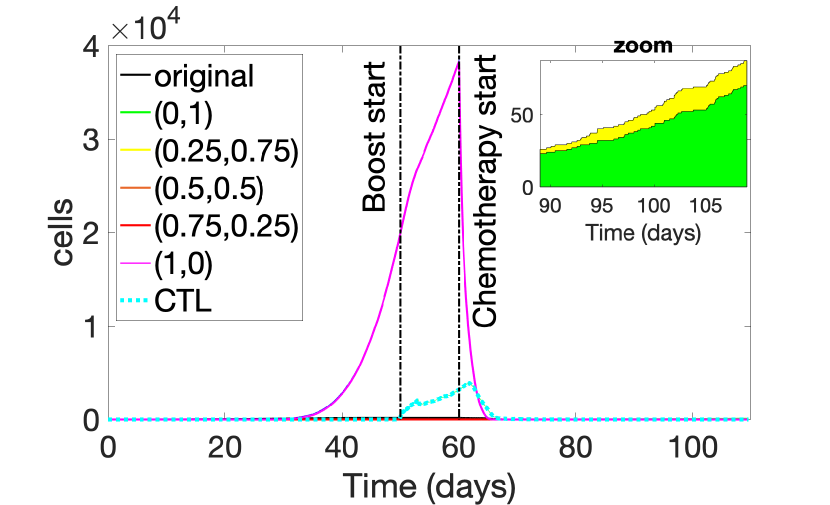
An initially fast reproducing tumour with high heterogeneity can instead lead to uncontrollable rebounds, with an overall negative outcome for the patient. In panel (C), the action of the chemotherapy is not sufficient to eliminate every single cell belonging to the mutated phenotype. According to our choice of parameters, it is enough that one original cancer cell or one of the more proliferating clone survives after the chemotherapy that a fast, uncontrollable rebound can be expected.
Interestingly, these last two cases (i.e. B and C) do not show different evolutions of the radius of gyration (not shown in the Figure) during the action of chemotherapy, since the treatment acts homogeneously on the cancer mass as a whole. This is associated directly to the limited dimension of the tumour, leading to the drug acting on the aggregate with a high strength from all spatial directions. Roughness instead show significant changes from case A and cases B and C. Tumour case A remains spherical and compact during the experiment, essentially because the treatment has a very limited effect on the mass due to its premature start. Tumour case B and C, instead, reach high level of roughness during the treatment, showing, for the cases reported in the Figure 3, a maximal of and , respectively at day and for cases B and C. This clearly indicates that the tumour loses density and becomes morphologically inhomogeneous at around half of the treatment duration and is infiltrated to a relevant degree by the T-cells taking part in the immune response. The overall consideration from these results is that the correct timing of treatment, here intended as the ideal treatment starting time and therapy duration to achieve optimal patient’s benefit, is a major variable for the outcome of the treatment and it is also strongly affected by phenotypical compositions.
Second single-therapy strategy: immune boosting
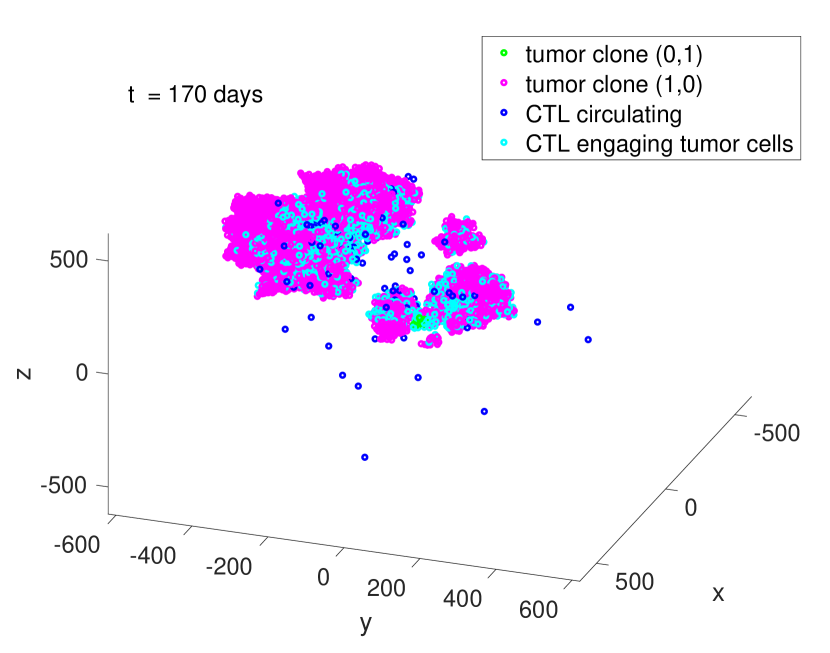
The overall effect of immune boosting is to increase the number of CTL cells circulating around the tumour site, which we simulate as an injection of cells starting at day and occurring for a duration of days. Erosion of cancer cells by the immune system proceeds from the periphery towards the center of the tumour mass, and is usually characterised by a linear decrease of during the first few days. Another typical characteristics of the dynamics that follows boosting is a clonal expansion of the CTL population shortly after treatment. For the prototypical three cases A, B and C introduced above, all of our computational experiments indicate that boosting alone is not able to eradicate cancer: after an initial decrease in the tumour mass, two types of evolutions have been observed, both resulting in negative outcomes. Of particular relevance is case C, which, although not treatable by chemotherapy alone, shows a somewhat unexpected and complicated morphology when subject to immune boosting. In fact, after an initial clonal selection of the less immunogenic phenotype, case C displays a clear deviation from sphericity in the mass, with a nonlocal spread of the tumour population in islands of different sizes, as reported in Fig. 4. After a decreasing phase due to an immune response that does not result in a complete eradication, the tumour population is eventually subject to a faster, uncontrollable increase driven by disconnected, smaller masses. Overall, a selection of 5 parameter sets and 10 trials for different seeds give qualitatively similar results.
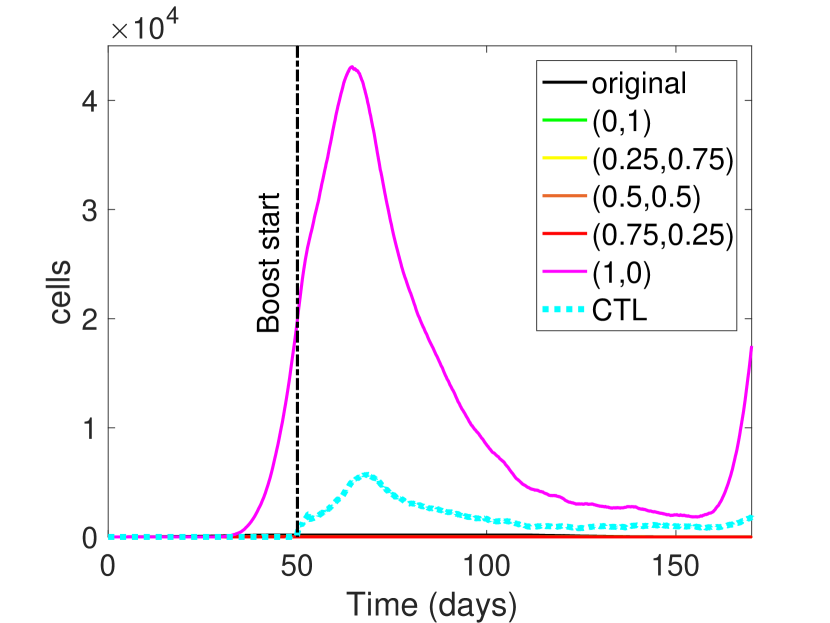
Panel (A) in Fig. 4, shows the number of cells for each phenotype as a function of time: an initially exponential growth is firstly slowed down then halted by immunotherapy, with a maximum cell population occurring about days after the beginning of the treatment. Around day , the evolution of the cell population changes. Frequent, local maxima in both tumour and T-cell curves represent the failed attempts made by the immune system to completely erode the tumour due to the increasing sparseness of the cancer. This behaviour seems to occur for a protracted period of time of about days.
As the cells in the island’s sizes begin to proliferate faster than the rate of killing of the T-cells, a rebound phase with a higher speed of growth than the original unbroken mass appears at day . Panel (B) provides an image of the scattered status of the tumour immediately before its exponential rebound. Let us remark that the model does not allow for migration of cancer cells and this picture is the result of the infiltration of T-cells coming from boosting and immune response.
As expected, morphology immediately before the rebound phase is characterised by a high value of roughness, with at day . Also, there is almost a twofold increase in compared to the value for identical number of cells in the first growth phase. For example, for cells, we have at day and at day 160.
First example of synergistic therapy: chemotherapy and boosting
Cancer heterogeneity has been invoked to explain one of the major aspects of cancer development, namely acquired drug resistance, by which phases of remission are often followed by a rapid growth of tumour cells [3]. One of the ways to overcome resistance is, for instance, to find more “evolutionarily enlightened” strategies that places malignant cells in an “evolutionary double bind” [17]. In cancer, a double blind could be obtained using the immune system as natural biological predator [58]. Clinical evidence shows that immunotherapy or oncolytic viruses alone are not effective, despite the possible theoretical advantages. Therefore, cancer treatment is adopting a multistep approach that combines biological and chemicalradioactive therapies using cytotoxic effects on one side and subsequent adaptation on the other side to limit tumour adaptive resistance [59, 60].
Guided by the poor outcomes displayed by immune boosting alone in the prototypical cases, we now consider the combination of chemotherapy and immune boosting, with the aim of discussing the major factors that maximize positive outcomes. The prototypical cases have been subjected to a protocol of an immune boosting injection at day lasting three days, followed by a chemotherapy session at day . Results are displayed in Fig 5, with the insets displaying phenotypical composition over time. For cases A and B, the complete temporal range is shown, whereas for C the last days are reported. Timing for these therapies has been chosen arbitrarily. For cases B and C the second lesion grows up to numbers of tumour cells that are close to the detectability threshold.
The effects of this synergistic therapy in cases A and C are similar: chemotherapy preferentially kills those cells that are fast to reproduce, leaving the slowest reproducing phenotype unaffected. As a result, rebounds occur once therapies end, with case A showing a negative outcome within the simulated time window and case C displaying a still moderate but uncontrollable growth at the end of the simulation. In other words, the effect of chemotherapy is to create an evolutionary bottleneck that selects the poorly immunogenic clones. In particular, case C (see the inset of Panel (C)) shows a surviving tumour composed by only two clones: the clone and the clone : these are the two families that are the slowest in proliferating and have the lowest immunogenicity. These clones have a strong immunoediting ability and remain unnoticed by the immune system, resulting in unending growth: because of their ability to be elusive to both the immune response and chemtherapy, outcome C appears the worst of all. Note that, for this reason, this phase is of a different nature than those previously reported for individual therapies (i.e. Figs. 3 and 4). Also, because of the low heterogeneity of case B, this combined therapy is instead successful in fully eradicating the tumour, which is eliminated during the administration of the cytotoxic drug. On the other hand, case A, differently from the results obrained for chemotherapy alone, displays a selection of the poorly differentiated immunogenic clones.
From the morphological perspective, masses emerging from this synergistic intervention appear to be low in roughness when the reproductive rate is slow, with at days. If the rate is instead fast, the level of heterogeneity usually determines the level of roughness, with low heterogeneity contributing high roughness during the chemotherapy phase, i.e. at days and at days. Contrary to case B, case C shows a Shannon index of for most of the simulation, which results in an unsuccessful eradication.
Other time protocols and order of administration between boosting and chemotherapy are possible, and have been tested to some degree (results not shown here). Although a study of optimisation of protocols is not within the scope of the present work, the overall insight from the simulations is that heterogeneity always plays an important role in the outcomes. For this combination therapy, high values of are consistently associated with negative prognosis [61].
Second example of synergistic therapy: radiotherapy, boosting and “abscopal” effect
A second example of synergistic therapies that is currently used in clinical practice is the combination of an initial cycle of radiotherapy with an immune boosting protocol. Besides a better understanding of the parameters that can trigger a positive outcome, our interest in testing such a combination resides in the occurrence of a somewhat rare and poorly understood event, which is named “abscopal” effect. There are a number of clinical cases discussed in the medical literature where a reduction of a secondary tumour or an existing metastasis outside the primary, radiated lesion has been observed [62, 63, 64, 65, 66, 67]. Differently from chemotherapy, radiotherapy has a localised action on the region irradiated and this makes the phenomenon, to some extent, counterintuitive. Sometimes, the effect appears to affect a secondary lesion very distant from the region treated.
The complications inherent to the stimulation of such an event are due to the immune action apparently being as crucial as radiotherapy in triggering such a response.
The model allows us to test some hypotheses on the nature and causes of the effect of protocols introduced by Demaria et al. in Ref. [68], who have reported some interesting and positive outcomes. In particular, they have treated mice with a syngeneic mammary carcinoma in both flanks with immunotherapy and only one of the two tumours with radiotherapy. They use the non-irradiated lesion to monitor the insurgence of the abscopal effect. Biologically, a tumour-specific T-cells activation occurs after inflammatory signals are introduced in the system as a consequence of the therapy. Dying cancer cells release tumour-specific antigens and immune-stimulatory signals that seem to induce an increased recognition of cancer cells with the same phenotypical characteristics in other areas of the body. Further, radiation modulates different compartments of the tumour microenvironment, resulting in exclusion-inhibition of effector T-cell and induction of de novo anti-tumour immune responses [69]. The protocol that we simulate is a radiotherapy (RT) on the primary tumour (not simulated or showed here) at day 1, followed by an immune boosting that lasts 10 days. As anticipated, RT is considered a restoring factor in the ability of CTL cells to recognise and kill all cancer phenotypes, with no exceptions.
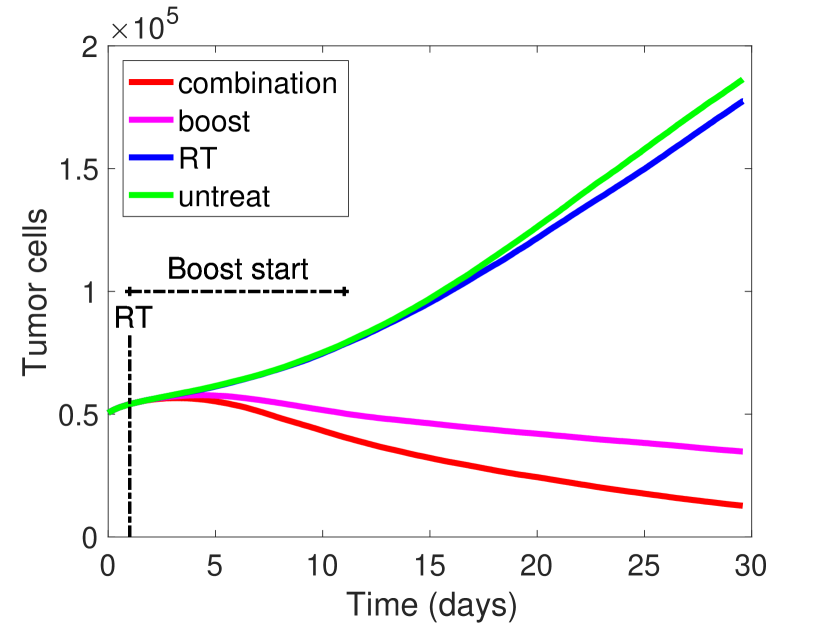
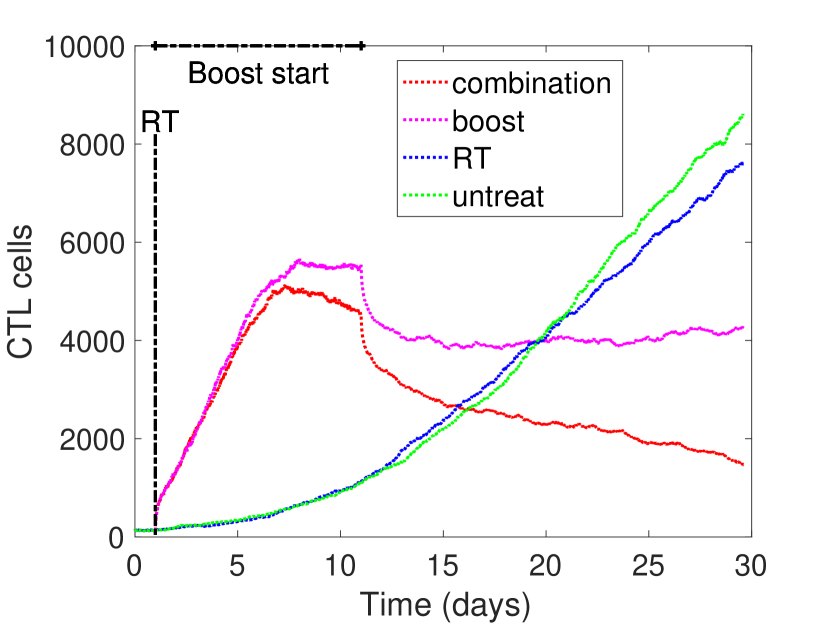
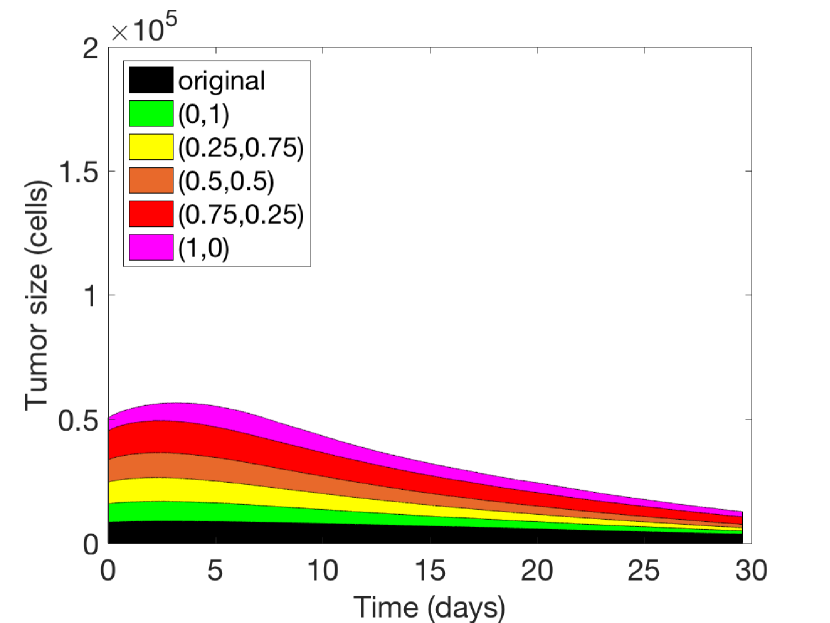
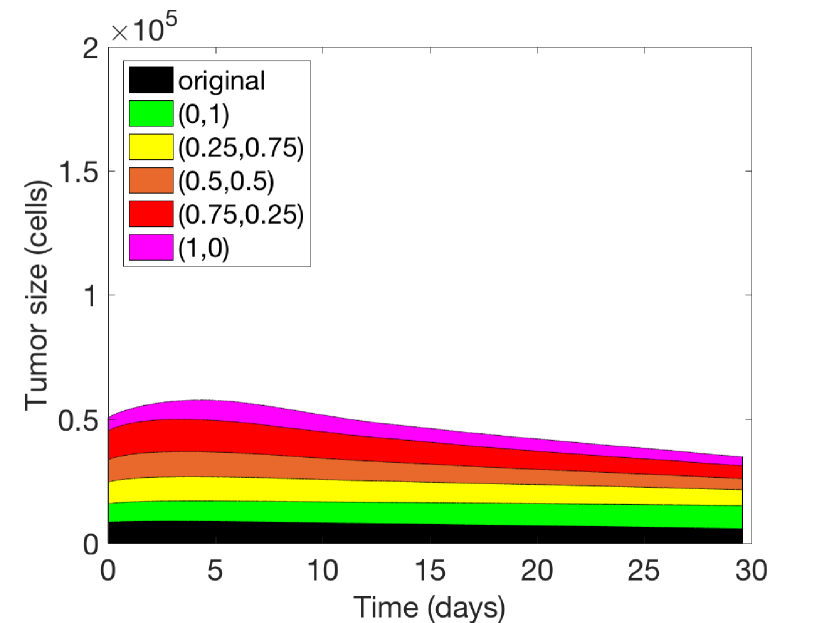
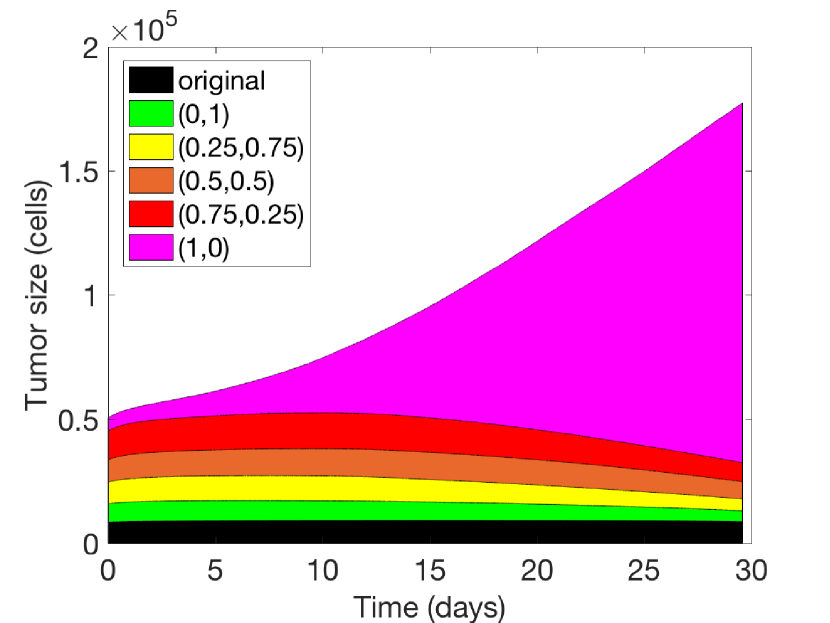
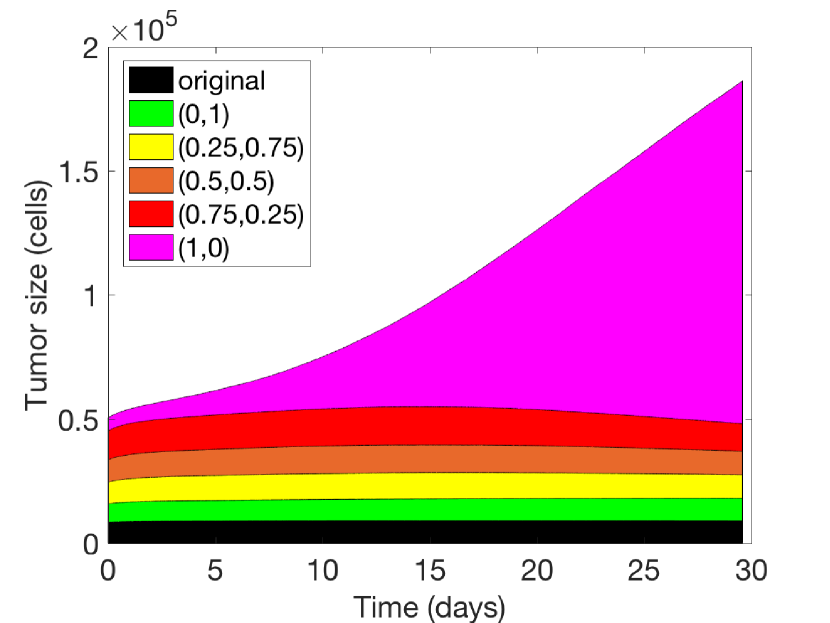
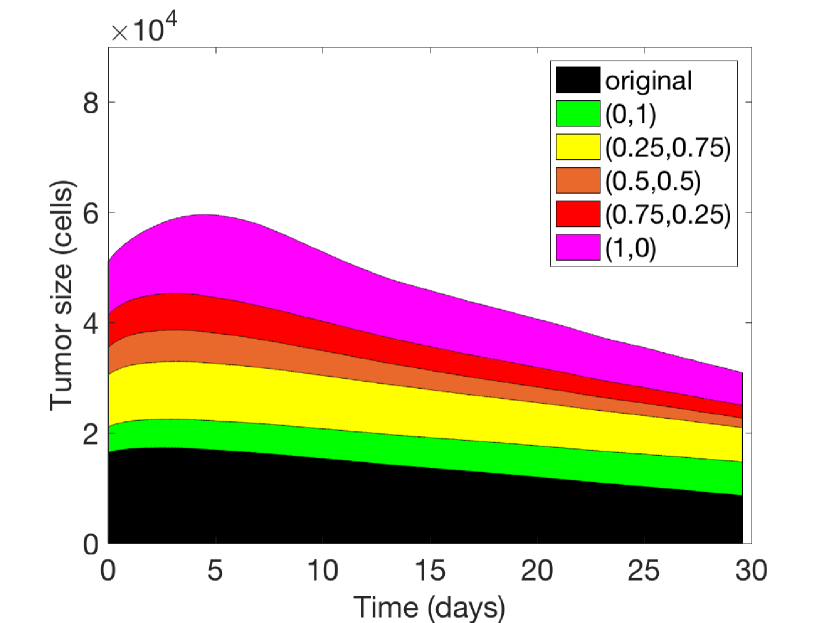
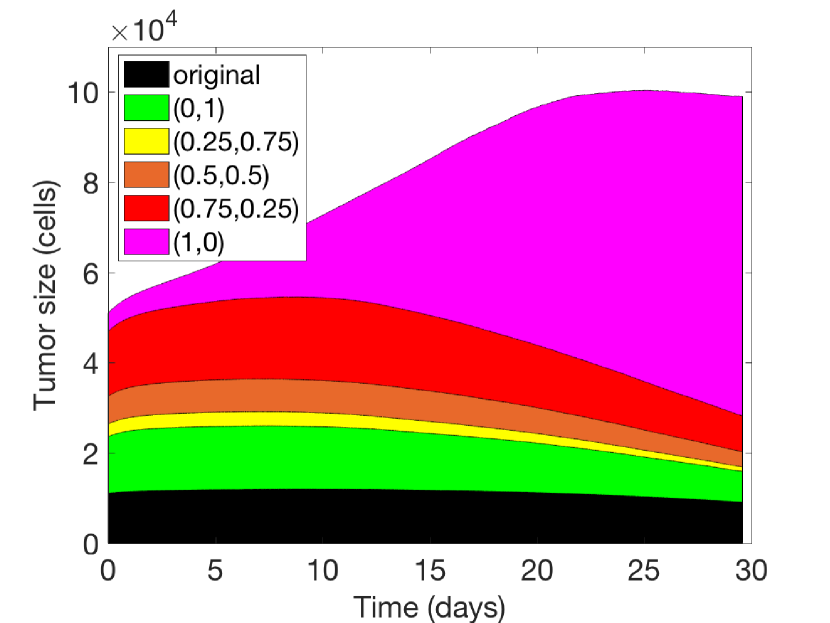
The secondary lesion is composed of x heterogeneous cells (the same number of cells injected in mice in the experiment by Demaria et al.), generated randomly with each clonal family representing at least of the total population. We compare the action of two single therapies (RT and immune boosting), with a combination of the two and a control case where the second lesion remains untreated. Results are presented in Fig 6(d): each panel represents the typical outcome from a single simulation. For each case, i.e. control (no treatment), combination, immunotherapy, and radiotherapy, we have performed three different simulation runs, with different initial conditions. The outcome of each simulation for any configuration consistently gives comparable results. Variation due to stochasticity are minimal and do not affect the outcomes.
Firstly, no treatment or RT alone result in similar negative outcomes for the secondary mass, not directly treated by RT, both from the perspective of surviving cancer cells (panel (A)) and the response of the CTLs of the immune system (panel (B)). An initial RT with no follow-up has the only effect of delaying an exponential rebound, not dissimilar to the behaviour of an untreated mass. Boosting alone does not impact the mass as much as when we combine boosting and RT, with the former giving rise to a tumour that after days has less than half the mass than in the case of chemotherapy alone. Stimulated by the release of the antigens of the dead tumour cells of the primary lesion, both therapies show a maximum in the number of active CTLs, which occurs around day and is then followed by a characteristic drop around day . Qualitatively the results of the model reproduce the experimental data in Ref. [69], with indications of a start of a remission for the secondary tumour.
Different strategies on the secondary mass also lead to different clonal compositions, which have an effect on the final outcome..One of the keys for the success of the strategy is to have no phenotype prevailing over the others, as shown in panel (C) for the combination of RT and immune boosting and, to a lesser extent, in panel (D) for immune boosting alone. Note that the width of the coloured regions in panels (C)-(F) indicates the number of cells that belong to a specific clone population: the larger the width, the larger the population. For example, combination therapy provides a very high Shannon index, , throughout the whole duration of the experiment. RT and no treatment show instead reduced indices, with values at day of and respectively. Interestingly, the RT case appears to be less heterogeneous than the control case. Overall, it is important to stress that, for the case of the secondary lesion, high heterogeneity is not per se associated to a worse prognosis. The reason is that a successful action on the secondary mass reduces the fitness advantage of the phenotypes and makes the immune system able to recognise each clones equally. Note that Panel (E) refers to the radiotherapy case made on primary tumour, showing the evolution of the secondary mass and the fact that the immunogenic effects induced by the treatment are not sufficient to contrast cancer growth. Panel (F) represents the control case, where no treatments are administered and the tumour is growing unchallenged as an aggressive breast cancer.
We find that the relation between the phenotypical composition of the primary and secondary lesions plays a very important role in the dynamics of the so-called abscopal effect. The previous examples refer to a secondary lesion that is antigenically related to the first tumour, but this is not always the case in practice. Results vary considerably if the phenotypical compositions differ and this is important to stress.
For example, if the secondary tumour is characterised
by clones that are not antigenically related to the first lesion, the
final outcome of combination therapy cannot be as positive as in the
previously discussed cases. Given that radiotherapy affects
phenotypes that are distributed in different ways in the first and
second tumours, the immune system is not capable of recognising specific tumour
cells in the same successful way as in the previous examples. As a
result, the therapy shows a worse outcome, as can be seen in
Fig. 7(a). Furthermore, if the second tumour mass is instead
implanted in an immune suppressed host (mathematically obtained by setting ),
where the level of CTLs circulating around the tumour is lower than ordinary
levels, the outcome is negative. As reported in
Fig. 7(b), a reduced fitness of the immune system causes
one phenotype to prevail over the others and proliferate quickly out
of control. It is reasonable to suppose that, if more cycles of therapies are repeated, the effectiveness of treatments is likely to be also reduced.
Mutation rates and eradication of secondary tumours
A complete eradication of a secondary tumour as an indirect result of an anti-cancer therapy on a primary lesion is a relatively rare occurrence. Also, it appears to be associated mainly with certain types of cancer, namely melanoma or breast cancer. This might be linked to the fact that generic metastatic events are characterised by a high genetic instability, often making secondary lesions phenotypically unrelated to the first tumour. From this point of view, a possible speculation could be that the so-called abscopal effect is not a rare event per se, but it is an effect limited to secondary tumours that have a phenotypical clone composition that is not too dissimilar from the originally treated lesion, and thus the effect only seldom changes the prognosis for secondary lesions. Indeed, extensive genetic and phenotypic variation are known to strongly influence therapeutic outcomes [70].
To investigate how the rate of mutation of cancer cells affects outcomes on secondary lesions, we generate a tumour of x cells with a full mutation capability and apply a combination therapy (RT and immune boosting) as per the previously introduced protocols. In other words, the complete secondary lesion before the start of treatments is composed by the original clone. Typical results are reported in Fig 8(a)(a) and show that outcomes do not linearly depend on the rate of mutation. Interestingly, tumour reductions at day are larger when the mutation rate is lower, but become negligible when the rate of mutation is approximately larger than , with no relevant change in the overall outcome for higher rates (see purple, yellow and cyan lines). Also, for rates lower than (see blue and black lines), different dynamics of eradication can be present, with tumours having different cell counts after the treatment is administered, although the final result at day appears almost identical.
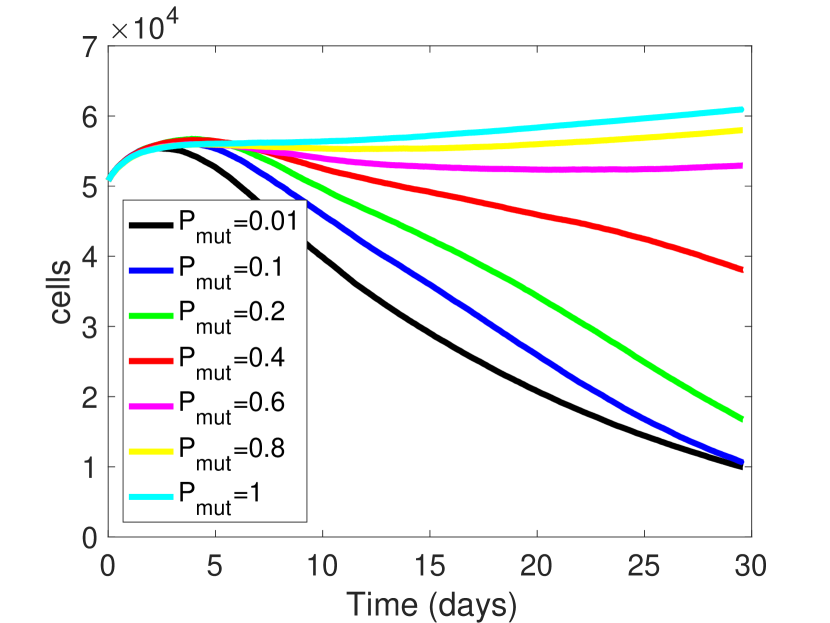
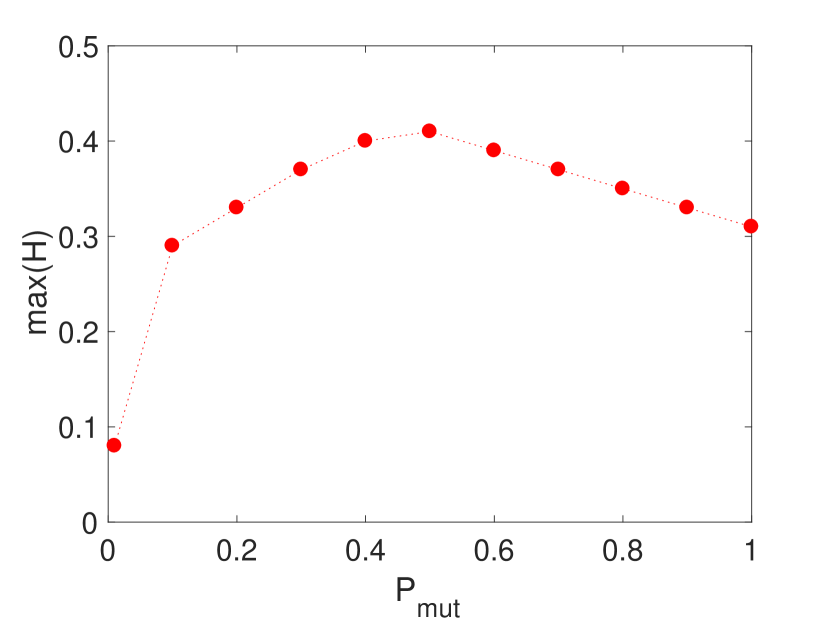
Heterogeneity tends to increase with the mutation rate, but its maximum value during therapy is not directly proportional to how fast the system can mutate. After a given rate of mutation, which is approximately , mutations do not increase the heterogeneity of the mass. This is because the fittest clone usually becomes dominant, its cells outnumber the other phenotypes and heterogeneity reduces. Fig. 8(a)(b) shows that the maximum values of are a concave function of mutation probability. Also, the overall distribution of phenotypes in the secondary mass is, as discussed previously for the case of a single cancer, strongly affected by the morphology.
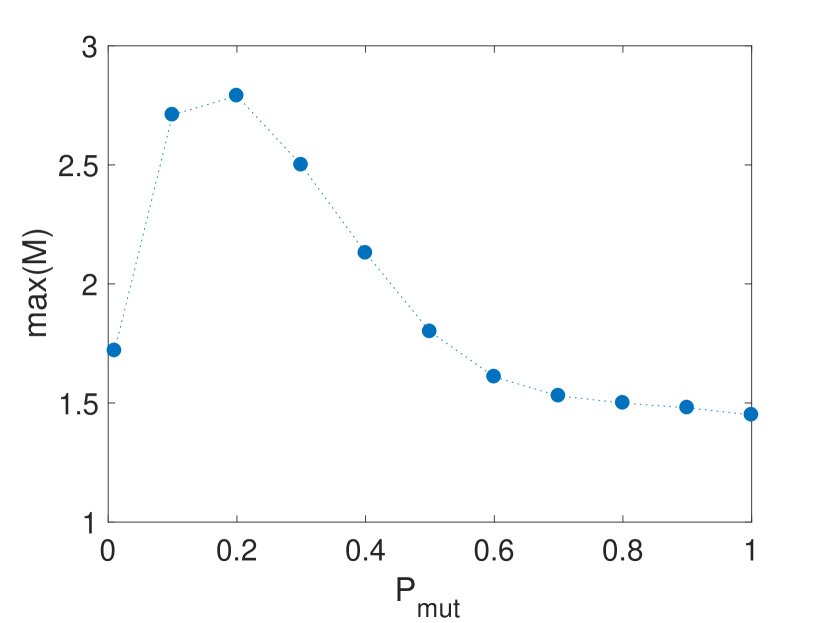
Different rates induce different roughness as shown in Fig. 8(a)(c), where the maximum value of reached by the tumour mass is plotted as a function of mutation rate. This value increases for small rates and reaches a maximum for a rate , followed by a sharp decrease. For rates larger than , the value does not change significantly. Tumour morphology of the secondary lesion influences how the immune system progresses in its attack. In our simulations, we observe different dynamics of attack carried out by the immune system, with the tumour being eroded in different ways and often not in a homogeneous fashion. Nonetheless, a rougher tumour always appears more vulnerable to immune system attacks because of the degree of infiltration by CTLs it allows. Even in “abscopal” positive outcomes, infiltration plays a major role in the dynamics of erosion and high correlates with better results. At the highest mutation rates, roughness is low because the immune system is not able to recognise phenotypes that are different from those of the primary mass and kill them. This results in a fast, unbounded growth of one or two phenotypes that increase the sphericity of the mass and quickly lower the roughness value approximately to unity, which corresponds to a spherical object. This is reflected in the plateau observed in Fig. 8(a) for .
4 Discussion
Cancer and immune cells are complex systems with different characteristics that also depend on internal and external evolutionary pressures. In the last decades, improvements on the general knowledge of these processes have stimulated new therapeutic strategies which take into account to patients’ particularities to some degree. The detailed model of immune interaction described here focuses on the salient traits of the dynamics and is able to reproduce the major features of a number of therapeutic interventions.
An analysis of the effect of different drugs on three prototypical secondary masses arising from a metastatic breast cancer (not modeled) has been proposed, showing a faithful representation of some of the main mechanisms of tumour-immune interactions present in literature [20, 9]. In particular, we note a significant dependence of the outcomes on the heterogeneity of the tumour, with higher heterogeneity generally correlated with negative outcomes confirming biological evidence suggested in Ref. [70]. Indeed, therapies targeting heterogeneous cancer micro environments often show large rebounds of more resistant tumour cells, that are able to counteract the action of drugs or boosting in a consistent way. In particular, one original result from our modeling is that chemotherapy appears more efficient in a less phenotypically differentiated secondary lesion independently of the rate of growth or the dimension of the mass. For the reproductive rates considered in this study, immune boosting alone is not sufficient to produce full eradication, but rather can trigger the spread of the more aggressive cells in the body by making the existing mass more sparse. A well-timed intervention with a combination of boosting and chemotherapy seems to be the safest of the protocols, allowing for a relevant reduction of the mass and preventing the unbounded growth of the most proliferating cells. Nevertheless, timing of intervention on the secondary lesion can be critical.
One further result of this work is to uncover the importance of tumour morphology in evolution and fate of secondary lesions. The shape of secondary masses conveys important information that could be an indicator of successful eradication. For instance, during or immediately after administration of chemotherapy, our modeling shows that a high infiltrated tumour is associated with the best outcome. At the same time, a harsh environment or a high selective pressure tend to generate a tumour that has a greater roughness and the tendency to spread, as previously noted [8]. This often occurs and persists for many days after administration of chemotherapy. In particular, findings for case A suggest that clonal composition of surviving cells that originated from the beginning tumour colony, and are later influenced by the selected therapies, strongly affect the final outcomes of the metastasis. Similar dynamics is reported to be present in some types of tumours that are known to be particularly resistant to therapies [71].
Here we consider one cycle of treatment, but some extra care should be taken when multiple cycles are considered, since the immune system could be further weakened and respond less efficiently. On the other hand, there is evidence in the medical literature that a combination of radiotherapy and immunotherapy can provide a positive effect not only in the area affected by the radiation but also in other areas of the body. This seems to be due to the release of autologous neoantigens to the immune system [69], with the overall result of what it appears to be an individualised tumour vaccine. Our model captures the effects of this cascading action on a secondary metastatic mass and confirms that the immune system can act as a mediator for secondary attacks. In particular, there is evidence in our findings that immune-suppressed hosts or secondary lesions antigenically unrelated to the treatment area do not show any abscopal effect, as experimentally noted.
There is a growing discussion in the community about the causes of this rare, positive occurrence on secondary masses. Currently, it seems that this is the result of a fragile balance between positive and negative signals activated with the radiation, dependent on the pre-existing environment and the immunogenicity of the tumour [69]. These biological elements, alongside a critical dependence on the dose and the interval between radiation fractions, contribute to the low occurrence of this effect. Furthermore and interestingly, a dependence of the effect on the mutation rate of the cancer clones in the secondary site is apparent, suggesting that the role of genetic instability at that site should be investigated more.
Overall, our findings emphasises that the morphology of the secondary lesions before, during and after the treatment, bears some indications of the rate of success for the treatment. For the lesions under the detectability threshold, this work suggests that heterogeneity and roughness are both important quantities. Negative prognosis is linked to the selection of a poorly immunogenic clone and has been shown to lead to a large, unbounded regrowth of the tumour. It is thus vital to design a protocol that can minimize the immunoediting ability of cells surviving from therapies or improve the immune system ability to recognise and attacks such clones especially when we cannot detect individual, isolated lesions but only total tumour burden. In regards to the latter, the activation of an “abscopal-like” response seems to be a strategy in re-calibrating the immune reaction to such cells. Results are still in their infancy and it is unknown whether such a response can be elicited and how. One of the ideas we suggest is to carefully consider the best tumour target to be irradiated: when possible, it could be advantageous to target a secondary metastasis antigenically related to the more common lesions in the body, with a low grade of hypoxia and with a good grade of immunogenicity.
5 Conclusions
Cellular mutation constitutes one of the causes of negative outcomes in therapeutic strategies against cancer. Morphology, growth rates and the clonal composition of a tumour mass can, to some extent, be used as predictors of tumour resistance to a range of anti-cancer therapies and be analysed to combine treatments to maximize their impacts. In most of the commonly used protocols, the action of the immune system is crucial. Modern therapies elicit and enhance patient’s immune response, also because of its ability to adapt to, change and modify the tumour microenvironment.
The mathematical model we have presented tries to capture the complexity of tumour-immune dynamics and discuss how therapies with different scopes, doses and protocols can influence prognosis for small, solid, secondary tumoural lesions. Even if these lesions can be small and not yet detectable, their role can be catastrophic for the patient if they are untreated or, as in some cases we have shown, the effect of therapies on the primary tumour can lead to the selection of more aggressive and resilient clones in the secondary lesions. Ideally, individual, evidence-based modelling might provide a fast, reliable and patient-centred way to test and find optimum control of protocols in vivo.
Our findings suggest that the success of synergistic therapies is strongly influenced by the phenotypical composition of all the lesions, alongside their mutation rates and immunogenic properties. Effective strategies that can “normalise” the microenvironment [72] and will try to limit tumour clonal mutation could be trialled to improve prognosis. Therapies that target slowly proliferating and undifferentiated cells can also become viable in the future.
6 Acknowledgements
EP, PSK and FF gratefully acknowledge support for this work through the Australian Research Council Discovery Project DP180101512, “Dynamical systems theory and mathematical modelling of viral infections”.
7 Code and Data availability
The code used and the produced data for the simulations discussed in this work are available upon request.
References
- Hanahan and Weinberg [2011] D. Hanahan, R. A. Weinberg, Hallmarks of cancer: the next generation, Cell 144 (2011) 646–674.
- Tabassum and Polyak [2015] D. P. Tabassum, K. Polyak, Tumorigenesis: it takes a village, Nature Reviews Cancer 15 (2015) 473–483.
- Gerlinger and Swanton [2010] M. Gerlinger, C. Swanton, How Darwinian models inform therapeutic failure initiated by clonal heterogeneity in cancer medicine, British Journal of Cancer 103 (2010) 1139–1143.
- Sottoriva et al. [2015] A. Sottoriva, H. Kang, Z. Ma, T. A. Graham, M. P. Salomon, J. Zhao, P. Marjoram, K. Siegmund, M. F. Press, D. Shibata, et al., A big bang model of human colorectal tumor growth, Nature Genetics 47 (2015) 209.
- Rübben and Araujo [2017] A. Rübben, A. Araujo, Cancer heterogeneity: converting a limitation into a source of biologic information, Journal of Translational Medicine 15 (2017) 190.
- Pacheco et al. [2014] J. M. Pacheco, F. C. Santos, D. Dingli, The ecology of cancer from an evolutionary game theory perspective, Interface Focus 4 (2014) 20140019.
- Hillen and Lewis [2014] T. Hillen, M. A. Lewis, Mathematical ecology of cancer, in: Managing Complexity, Reducing Perplexity, Springer, 2014, pp. 1–13.
- Anderson et al. [2006] A. R. Anderson, A. M. Weaver, P. T. Cummings, V. Quaranta, Tumor morphology and phenotypic evolution driven by selective pressure from the microenvironment, Cell 127 (2006) 905–915.
- De Pillis et al. [2006] L. G. De Pillis, W. Gu, A. E. Radunskaya, Mixed immunotherapy and chemotherapy of tumors: modeling, applications and biological interpretations, Journal of Theoretical Biology 238 (2006) 841–862.
- Wilson and Levy [2012] S. Wilson, D. Levy, A mathematical model of the enhancement of tumor vaccine efficacy by immunotherapy, Bulletin of Mathematical Biology 74 (2012) 1485–1500.
- Asatryan and Komarova [2016] A. D. Asatryan, N. L. Komarova, Evolution of genetic instability in heterogeneous tumors, Journal of theoretical biology 396 (2016) 1–12.
- Sottoriva et al. [2011] A. Sottoriva, L. Vermeulen, S. Tavaré, Modeling evolutionary dynamics of epigenetic mutations in hierarchically organized tumors, PLoS Computational Biology 7 (2011) e1001132.
- Anderson and Quaranta [2008] A. R. Anderson, V. Quaranta, Integrative mathematical oncology, Nature Reviews Cancer 8 (2008) 227.
- Jeon et al. [2010] J. Jeon, V. Quaranta, P. T. Cummings, An off-lattice hybrid discrete-continuum model of tumor growth and invasion, Biophysical Journal 98 (2010) 37–47.
- Jiao and Torquato [2012] Y. Jiao, S. Torquato, Diversity of dynamics and morphologies of invasive solid tumors, AIP advances 2 (2012) 011003.
- Gatenby et al. [2009a] R. A. Gatenby, A. S. Silva, R. J. Gillies, B. R. Frieden, Adaptive therapy, Cancer Research 69 (2009a) 4894–4903.
- Gatenby et al. [2009b] R. A. Gatenby, J. Brown, T. Vincent, Lessons from applied ecology: cancer control using an evolutionary double bind, Cancer research 69 (2009b) 7499–7502.
- Eladdadi et al. [2014] A. Eladdadi, A. Radunskaya, et al., Modeling cancer-immune responses to therapy, Journal of pharmacokinetics and pharmacodynamics 41 (2014) 461–478.
- Frascoli et al. [2014] F. Frascoli, P. S. Kim, B. D. Hughes, K. A. Landman, A dynamical model of tumour immunotherapy, Mathematical Biosciences 253 (2014) 50–62.
- Piretto et al. [2018] E. Piretto, M. Delitala, M. Ferraro, Combination therapies and intra-tumoral competition: insights from mathematical modelling, Journal of Theoretical Biology 446 (2018) 149–159.
- Bunimovich-Mendrazitsky et al. [2008] S. Bunimovich-Mendrazitsky, H. Byrne, L. Stone, Mathematical model of pulsed immunotherapy for superficial bladder cancer, Bulletin of Mathematical Biology 70 (2008) 2055–2076.
- Jenner et al. [2018] A. L. Jenner, C.-O. Yun, A. Yoon, A. C. Coster, P. S. Kim, Modelling combined virotherapy and immunotherapy: strengthening the antitumour immune response mediated by IL-12 and GM-CSF expression, Letters in Biomathematics (2018) 1–18.
- Bellomo et al. [2008] N. Bellomo, N. Li, P. K. Maini, On the foundations of cancer modelling: selected topics, speculations, and perspectives, Mathematical Models and Methods in Applied Sciences 18 (2008) 593–646.
- Wilkie [2013] K. P. Wilkie, A review of mathematical models of cancer–immune interactions in the context of tumor dormancy, in: Systems Biology of Tumor Dormancy, Springer, 2013, pp. 201–234.
- Eftimie et al. [2011] R. Eftimie, J. L. Bramson, D. J. Earn, Interactions between the immune system and cancer: a brief review of non-spatial mathematical models, Bulletin of Mathematical Biology 73 (2011) 2–32.
- Eladdadi et al. [2014] A. Eladdadi, P. Kim, D. Mallet, Mathematical models of tumor-immune system dynamics, Springer, 2014.
- Kim and Lee [2012] P. S. Kim, P. P. Lee, Modeling protective anti-tumor immunity via preventative cancer vaccines using a hybrid agent-based and delay differential equation approach, PLoS Computational Biology 8 (2012) e1002742.
- Catron et al. [2004] D. M. Catron, A. A. Itano, K. A. Pape, D. L. Mueller, M. K. Jenkins, Visualizing the first 50 hr of the primary immune response to a soluble antigen, Immunity 21 (2004) 341–347.
- Mohri et al. [2001] H. Mohri, A. S. Perelson, K. Tung, R. M. Ribeiro, B. Ramratnam, M. Markowitz, R. Kost, L. Weinberger, D. Cesar, M. K. Hellerstein, et al., Increased turnover of t lymphocytes in hiv-1 infection and its reduction by antiretroviral therapy, Journal of Experimental Medicine 194 (2001) 1277–1288.
- Belz et al. [2007] G. T. Belz, L. Zhang, M. D. Lay, F. Kupresanin, M. P. Davenport, Killer t cells regulate antigen presentation for early expansion of memory, but not naive, cd8+ t cell, Proceedings of the National Academy of Sciences 104 (2007) 6341–6346.
- Wodarz and Thomsen [2005] D. Wodarz, A. R. Thomsen, Effect of the ctl proliferation program on virus dynamics, International Immunology 17 (2005) 1269–1276.
- De Boer et al. [2001] R. J. De Boer, M. Oprea, R. Antia, K. Murali-Krishna, R. Ahmed, A. S. Perelson, Recruitment times, proliferation, and apoptosis rates during the cd8+ t-cell response to lymphocytic choriomeningitis virus, Journal of Virology 75 (2001) 10663–10669.
- Kaech and Ahmed [2001] S. M. Kaech, R. Ahmed, Memory cd8+ t cell differentiation: initial antigen encounter triggers a developmental program in naive cells, Nature Immunology 2 (2001) 415.
- De Boer et al. [2003] R. J. De Boer, D. Homann, A. S. Perelson, Different dynamics of cd4+ and cd8+ t cell responses during and after acute lymphocytic choriomeningitis virus infection, The Journal of Immunology 171 (2003) 3928–3935.
- Janeway et al. [1996] C. A. Janeway, P. Travers, M. Walport, M. Shlomchik, et al., Immunobiology: the immune system in health and disease, volume 7, Current Biology London, 1996.
- Veiga-Fernandes et al. [2000] H. Veiga-Fernandes, U. Walter, C. Bourgeois, A. McLean, B. Rocha, Response of naive and memory cd8+ t cells to antigen stimulation in vivo, Nature Immunology 1 (2000) 47.
- Ying and Pang [2009] M. Ying, B. Pang, Three-dimensional ultrasound measurement of cervical lymph node volume, The British journal of radiology 82 (2009) 617–625.
- Mallet and De Pillis [2006] D. G. Mallet, L. G. De Pillis, A cellular automata model of tumor–immune system interactions, Journal of Theoretical Biology 239 (2006) 334–350.
- Soiffer et al. [2003] R. Soiffer, F. S. Hodi, F. Haluska, K. Jung, S. Gillessen, S. Singer, K. Tanabe, R. Duda, S. Mentzer, M. Jaklitsch, et al., Vaccination with irradiated, autologous melanoma cells engineered to secrete granulocyte-macrophage colony-stimulating factor by adenoviral-mediated gene transfer augments antitumor immunity in patients with metastatic melanoma, Journal of Clinical Oncology 21 (2003) 3343–3350.
- Soiffer et al. [1998] R. Soiffer, T. Lynch, M. Mihm, K. Jung, C. Rhuda, J. C. Schmollinger, F. S. Hodi, L. Liebster, P. Lam, S. Mentzer, et al., Vaccination with irradiated autologous melanoma cells engineered to secrete human granulocyte–macrophage colony-stimulating factor generates potent antitumor immunity in patients with metastatic melanoma, Proceedings of the National Academy of Sciences 95 (1998) 13141–13146.
- Mackay [1996] C. R. Mackay, Chemokine receptors and t cell chemotaxis., Journal of Experimental Medicine 184 (1996) 799–802.
- Maurer and Von Stebut [2004] M. Maurer, E. Von Stebut, Macrophage inflammatory protein-1, The International Journal of Biochemistry & Cell Biology 36 (2004) 1882–1886.
- Lin [2004] A. H. Lin, A model of tumor and lymphocyte interactions, Discrete & Continuous Dynamical Systems-B 4 (2004) 241–266.
- Alarcón et al. [2003] T. Alarcón, H. M. Byrne, P. K. Maini, A cellular automaton model for tumour growth in inhomogeneous environment, Journal of Theoretical Biology 225 (2003) 257–274.
- Kirschner and Panetta [1998] D. Kirschner, J. C. Panetta, Modeling immunotherapy of the tumor–immune interaction, Journal of mathematical biology 37 (1998) 235–252.
- Kuroishi et al. [1990] T. Kuroishi, S. Tominaga, T. Morimoto, H. Tashiro, S. Itoh, H. Watanabe, M. Fukuda, J. Ota, T. Horino, T. Ishida, et al., Tumor growth rate and prognosis of breast cancer mainly detected by mass screening, Japanese Journal of Cancer Research 81 (1990) 454–462.
- Michaelson et al. [2003] J. Michaelson, S. Satija, R. Moore, G. Weber, E. Halpern, A. Garland, D. B. Kopans, Estimates of breast cancer growth rate and sojourn time from screening database information, Journal of Womens Imaging 5 (2003) 11–19.
- Friedl and Gunzer [2001] P. Friedl, M. Gunzer, Interaction of t cells with apcs: the serial encounter model, Trends in Immunology 22 (2001) 187–191.
- Wood et al. [2007] L. D. Wood, D. W. Parsons, S. Jones, J. Lin, T. Sjöblom, R. J. Leary, D. Shen, S. M. Boca, T. Barber, J. Ptak, et al., The genomic landscapes of human breast and colorectal cancers, Science 318 (2007) 1108–1113.
- Hatzikirou et al. [2012] H. Hatzikirou, D. Basanta, M. Simon, K. Schaller, A. Deutsch, ‘Go or grow’: the key to the emergence of invasion in tumour progression?, Mathematical Medicine and Biology: a Journal of the IMA 29 (2012) 49–65.
- Mendonsa et al. [2018] A. M. Mendonsa, T.-Y. Na, B. M. Gumbiner, E-cadherin in contact inhibition and cancer, Oncogene (2018) 1.
- Brunton et al. [2011] L. L. Brunton, B. A. Chabner, B. C. Knollmann, Therapeutics, MWateria Medica, x887, 6ox (2011).
- Zitvogel et al. [2008] L. Zitvogel, L. Apetoh, F. Ghiringhelli, G. Kroemer, Immunological aspects of cancer chemotherapy, Nature Reviews Immunology 8 (2008) 59–73.
- Rosenberg et al. [2008] S. A. Rosenberg, N. P. Restifo, J. C. Yang, R. A. Morgan, M. E. Dudley, Adoptive cell transfer: a clinical path to effective cancer immunotherapy, Nature Reviews Cancer 8 (2008) 299.
- Frascoli et al. [2017] F. Frascoli, E. Flood, P. Kim, A model of the effects of cancer cell motility and cellular adhesion properties on tumour-immune dynamics, Mathematical Medicine and Biology : a journal of the IMA 34 (2017) 215–240.
- Sottoriva et al. [2010] A. Sottoriva, J. J. Verhoeff, T. Borovski, S. K. McWeeney, L. Naumov, J. P. Medema, P. M. Sloot, L. Vermeulen, Cancer stem cell tumor model reveals invasive morphology and increased phenotypical heterogeneity, Cancer Research 70 (2010) 46–56.
- Bruét al. [1998] A. Bru,́ J. Pastor, I. Fernaud, I. Brú, S. Melle, C. Berenguer, Super-rough dynamics on tumor growth, Physical Review Letters 81 (1998) 4008–4011.
- Basanta et al. [2012] D. Basanta, R. A. Gatenby, A. R. Anderson, Exploiting evolution to treat drug resistance: combination therapy and the double bind, Molecular Pharmaceutics 9 (2012) 914–921.
- Ramakrishnan et al. [2010] R. Ramakrishnan, D. Assudani, S. Nagaraj, T. Hunter, H.-I. Cho, S. Antonia, S. Altiok, E. Celis, D. I. Gabrilovich, Chemotherapy enhances tumor cell susceptibility to CTL-mediated killing during cancer immunotherapy in mice, The Journal of Clinical Investigation 120 (2010) 1111.
- Antonia et al. [2006] S. J. Antonia, N. Mirza, I. Fricke, A. Chiappori, P. Thompson, N. Williams, G. Bepler, G. Simon, W. Janssen, J.-H. Lee, et al., Combination of p53 cancer vaccine with chemotherapy in patients with extensive stage small cell lung cancer, Clinical Cancer Research 12 (2006) 878–887.
- Greaves and Maley [2012] M. Greaves, C. C. Maley, Clonal evolution in cancer, Nature 481 (2012) 306–313.
- Reits et al. [2006] E. A. Reits, J. W. Hodge, C. A. Herberts, T. A. Groothuis, M. Chakraborty, E. K. Wansley, K. Camphausen, R. M. Luiten, A. H. de Ru, J. Neijssen, et al., Radiation modulates the peptide repertoire, enhances MHC class I expression, and induces successful antitumor immunotherapy, Journal of Experimental Medicine 203 (2006) 1259–1271.
- Lugade et al. [2005] A. A. Lugade, J. P. Moran, S. A. Gerber, R. C. Rose, J. G. Frelinger, E. M. Lord, Local radiation therapy of B16 melanoma tumors increases the generation of tumor antigen-specific effector cells that traffic to the tumor, The Journal of Immunology 174 (2005) 7516–7523.
- Finkelstein and Fishman [2012] S. E. Finkelstein, M. Fishman, Clinical opportunities in combining immunotherapy with radiation therapy, Frontiers in Oncology 2 (2012) 169.
- Finkelstein et al. [2012] S. E. Finkelstein, C. Iclozan, M. M. Bui, M. J. Cotter, R. Ramakrishnan, J. Ahmed, D. R. Noyes, D. Cheong, R. J. Gonzalez, R. V. Heysek, et al., Combination of external beam radiotherapy (EBRT) with intratumoral injection of dendritic cells as neo-adjuvant treatment of high-risk soft tissue sarcoma patients, International Journal of Radiation Oncology Biology Physics 82 (2012) 924–932.
- Finkelstein et al. [2011] S. E. Finkelstein, R. Timmerman, W. H. McBride, D. Schaue, S. E. Hoffe, C. A. Mantz, G. D. Wilson, The confluence of stereotactic ablative radiotherapy and tumor immunology, Clinical and Developmental Immunology 2011 (2011).
- Vatner et al. [2014] R. E. Vatner, B. T. Cooper, C. Vanpouille-Box, S. Demaria, S. C. Formenti, Combinations of immunotherapy and radiation in cancer therapy, Frontiers in Oncology 4 (2014) 325.
- Demaria et al. [2004] S. Demaria, B. Ng, M. L. Devitt, J. S. Babb, N. Kawashima, L. Liebes, S. C. Formenti, Ionizing radiation inhibition of distant untreated tumors (abscopal effect) is immune mediated, International Journal of Radiation Oncology Biology Physics 58 (2004) 862–870.
- Demaria et al. [2015] S. Demaria, E. B. Golden, S. C. Formenti, Role of local radiation therapy in cancer immunotherapy, JAMA oncology 1 (2015) 1325–1332.
- Burrell et al. [2013] R. A. Burrell, N. McGranahan, J. Bartek, C. Swanton, The causes and consequences of genetic heterogeneity in cancer evolution, Nature 501 (2013) 338–345.
- Kusoglu and Biray Avci [2019] A. Kusoglu, C. Biray Avci, Cancer stem cells: A brief review of the current status, Gene 681 (2019) 80–85.
- Jain [2005] R. K. Jain, Normalization of tumor vasculature: an emerging concept in antiangiogenic therapy, Science 307 (2005) 58–62.