Gaia GraL: Gaia DR2 Gravitational Lens Systems. VII.
XMM-Newton Observations of Lensed Quasars
Abstract
We present XMM-Newton X-ray observations of nine confirmed lensed quasars at identified by the Gaia Gravitational Lens program. Eight systems are strongly detected, with 0.3–8.0 keV fluxes . Modeling the X-ray spectra with an absorbed power law, we derive power law photon indices and 2–10 keV luminosities for the eight detected quasars. In addition to presenting sample properties for larger quasar population studies and for use in planning for future caustic crossing events, we also identify three quasars of interest: a quasar that shows evidence of flux variability from previous ROSAT observations, the most closely-separated individual lensed sources resolved by XMM-Newton, and one of the X-ray brightest quasars known at . These sources represent the tip of discovery that will be enabled by SRG/eROSITA.
1 Introduction
| Target | R.A. | Dec. | aaAdopted magnification based on models presented in Paper VI (Quads). | SeparationbbFor the quads, separation corresponds to the maximum separation. | Notes | |
|---|---|---|---|---|---|---|
| GraL J0659+1629 | 06:59:04.1 | +16:29:09 | 3.083 | 37.6 | 68 | quad - Paper VI |
| GraL J08182613 | 08:18:28.3 | 26:13:25 | 2.164 | 100.1 | 62 | quad - Paper VI |
| GraL J11314419 | 11:31:00.0 | 44:20:00 | 1.090 | 70.4 | 16 | quad - Paper IV |
| GraL J16510417 | 16:51:05.3 | 04:17:25 | 1.451 | 7.3 | 101 | quad - Paper VI |
| GraL J1719+1515 | 17:19:22.6 | +15:15:46 | 1.716 | 11 | double - Paper V | |
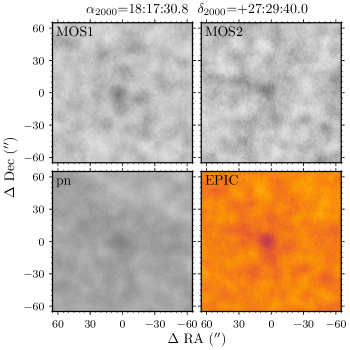
| GraL J1817+2729 | 18:17:30.8 | +27:29:40 | 3.074 | 19.0 | 18 | quad - Paper VI |
| GraL J2017+6204 | 20:17:49.1 | +62:04:43 | 1.724 | 14.7 | 07 | quad - Paper VI |
| GraL J21030850 | 21:03:29.0 | 08:50:49 | 2.455 | 13.3 | 10 | quad - Paper VI |
| GraL J2200+1448 | 22:00:15.6 | +14:49:00 | 1.115 | 25 | double - Paper V | |
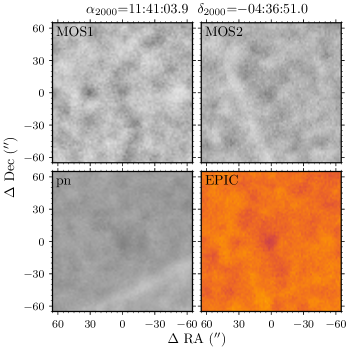
| SDSS J11410436 | 11:41:03.9 | 04:36:51 | 1.647 | unlensed - Paper VI |
Strong gravitational lensing, wherein a distant object is magnified and possibly resolved into multiple images by a massive foreground structure, is an extremely valuable tool for studying the universe (see Treu 2010 for a review). Not only do strong lenses enable mass reconstruction from the scales of galaxy clusters (e.g., Paterno-Mahler et al., 2018) to the scales of galaxy subhaloes (e.g., Vegetti et al., 2012), but strong lensing measurements have enabled tests of fundamental physics and cosmology. Using spatially-resolved kinematic measurements of lensed arcs, Collett et al. (2018) tested the predictions of general relativity in the strong-gravity regime. Furthermore, a number of works have exploited time delays between individual images to calculate (e.g., Suyu et al., 2017; Chen et al., 2018; Vega-Ferrero et al., 2018).
Of particular importance in the strong lensing regime are background quasars lensed by galaxy-scale masses. Quasar microlensing directly constrains the stellar mass fraction at the position of lensed images, enabling kinematics-independent derivations of dark matter fractions in galaxies (Bate et al., 2011; Oguri et al., 2014). Furthermore, using flux measurements of lensed quasars to model the mass distribution of lensing galaxies, works including those of Gilman et al. (2020) and Nierenberg et al. (2020) have constrained the characteristics of dark matter structures. And, building on the work of Kochanek & Dalal (2004), which showed that microlensing time delays can enable a measurement of lensed source sizes, multiple works have exploited lensing to measure the properties of quasars (e.g., Wayth et al., 2005; Pooley et al., 2007). Due to the vast utility of these sources, lensed quasars have remained compelling targets for discovery.
While the first lensed quasars were discovered by serendipity (Walsh et al., 1979), exploiting the full potential of these systems requires both large samples and systematic searches. To that end, the Gaia Gravitational Lenses working group (GraL) has exploited the exquisite astrometric precision of the Gaia mission (Gaia Collaboration et al., 2016) to identify candidate lensed quasars (Krone-Martins et al., 2018, Paper I). Ducourant et al. (2018, Paper II) expanded on this work by creating an exhaustive list of known quasars and integrating in the sub-milliarcsecond astrometry of Gaia Data Release 2 (Gaia Collaboration et al., 2018). Following refinement of the candidate selection algorithms (Delchambre et al., 2019, Paper III) and a demonstration of the potential for Gaia observations alone to constrain mass models (Wertz et al., 2019, Paper IV), Krone-Martins et al. (2019, Paper V) and Stern et al. (2020, Paper VI) spectroscopically confirmed a set of doubly and quadruply imaged quasars, respectively. All told, over two dozen lensed quasars have been identified and confirmed by GraL, which is one of several ongoing searches for lensed quasars (Ostrovski et al., 2017, 2018; Agnello et al., 2018; Treu et al., 2018; Lemon et al., 2018, 2019, 2020; Khramtsov et al., 2019; Li et al., 2020).
As new gravitational lens systems are discovered, they become intriguing targets for X-ray studies, enabling discoveries beyond that of optical investigations. In particular, as noted by Pooley et al. (2012), a quiescent lensing galaxy does not contribute a meaningful amount of X-ray flux, allowing for improvements in mass modeling. Utilizing the inherent ability to obtain spectral information from each resolved image, Walton et al. (2015), building on measurements at lower redshifts (Reis et al., 2014; Reynolds et al., 2014), demonstrated the ability of X-ray observations of lensed quasars to measure black hole spins in the universe. Differences between X-ray and optical light curves have enabled multiple measurements of the size of the X-ray emitting region in lensed quasars (e.g,. Morgan et al., 2008; Dai et al., 2010; Mosquera et al., 2013). In addition, while distant quasars can still be well-studied from optical to radio wavelengths (e.g., Bañados et al., 2021), even luminous quasars with deep X-ray observations are so photon limited as to preclude all but the most basic of spectral analyses (e.g., Connor et al., 2019); as such, the boost in flux caused by lensing that enables more detailed studies of individual objects is critical in the X-ray regime for exploring the universe.
Of particular interest are microlensing events when lensed objects touch a caustic. These caustic crossing events have been previously observed to produce magnifications in excess of (Kelly et al., 2018). While such extreme magnification events are uncommon and generally associated with the macrocaustics of galaxy clusters (Diego, 2019), even smaller-magnification microlensing events could enable studies of distant quasars at a level of detail otherwise only obtainable in the local universe (e.g., Tomozeiu et al., 2018). As the strength of a caustic crossing event increases with decreasing source size, the relatively small scale of X-ray emitting regions makes this energy band ideal for exploiting these incidents. Mosquera & Kochanek (2011) found that the median Einstein radius crossing time for a sample of 87 lensed quasars, which is equivalent to the rate of caustic crossing events, was once per 20 years per lensed image. Due to the rarity of these events, analyses often rely on photometric monitoring of low-magnification events (e.g., Courbin et al., 2018; Fian et al., 2018) or of statistical analyses of higher-magnification events (e.g., Rodney et al., 2018). However, with time-domain surveys such as the Zwicky Transient Facility (Bellm et al., 2019) providing deep coverage of large fractions of the sky at near-daily cadence, we may soon be able to detect caustic-crossing events early and often enough to enable target of opportunity observations. Preliminary X-ray observations are necessary to prioritize these optically-selected events for X-ray follow-up.
In this article we present the X-ray observations and analysis of a subset of the Gaia GraL sample. The paper is structured as follows: we present our observations and their reduction in Section 2, provide the results in Section 3, discuss these results in the broader context of ongoing studies in Section 4, and summarize this effort in Section 5. Throughout this work, we adopt a flat cosmology with , , and . All uncertainties are given at the level and all upper limits correspond to values. Except where otherwise stated, all luminosities presented in this work are not corrected for the lensing magnification.
2 X-Ray Observations and Analysis
We proposed a snapshot survey using XMM-Newton to observe a sample of 19 lensed quasars from GraL (PropID: 086462, PI: Stern), though this survey was accepted as C Priority, and so only a random sub-sample was observed. In total, ten new quasars were observed in this program, the details of which are given in Table 1. One unlensed quasar – SDSS J11410436 – was included in this sample. Though initial reductions of follow-up spectroscopy suggested a lensed quasar, subsequent analysis revealed this source to be an asterism composed of a Galactic star and a quasar (Paper VI).
Each target was observed for around 10 ks with the European Photon Imaging Camera (EPIC) on XMM-Newton (Jansen et al., 2001), consisting of two MOS cameras (Turner et al., 2001) and a pn CCD camera (Strüder et al., 2001). Sources were positioned at the standard EPIC-pn prime position, ensuring they were away from pn chip edges. Camera readout was conducted in full frame mode, and we used the thin optical blocking filter.
| Count RateaaBackground-subtracted count rate from 0.3–8.0 keV. | ||||||||
|---|---|---|---|---|---|---|---|---|
| Target | OBSID | Start Date | Exp. | MOS1 | MOS2 | pn | ||
| (YYYY-mm-dd) | (ks) | () | ( ) | |||||
| GraL J0659+1629 | 0864620401 | 2021-Apr-07 | 16\@alignment@align.7 | |||||
| GraL J08182613 | 0864620501 | 2020-Oct-23 | 8\@alignment@align.5 | |||||
| GraL J11314419 | 0864620701b,cb,cfootnotemark: | 2020-Dec-11 | 16\@alignment@align.1 | |||||
| GraL J16510417 | 0864621301b,cb,cfootnotemark: | 2021-Mar-17 | 17\@alignment@align.4 | |||||
| GraL J1719+1515 | 0864622501ccfootnotemark: | 2021-Mar-02 | 11\@alignment@align.0 | |||||
| GraL J1817+2729 | 0864621501b,cb,cfootnotemark: | 2020-Oct-24 | 19\@alignment@align.5 | |||||
| GraL J2017+6204 | 0864621701 | 2020-Jul-09 | 15\@alignment@align.3 | |||||
| GraL J21030850 | 0864621901ccfootnotemark: | 2020-Nov-05 | 14\@alignment@align.2 | |||||
| GraL J2200+1448 | 0864622001ccfootnotemark: | 2020-Nov-17 | 12\@alignment@align.3 | |||||
| SDSS J11410436 | 0864620801b,cb,cfootnotemark: | 2020-Dec-25 | 15\@alignment@align.7 | |||||
pn experienced full scientific buffer during observation.
Observations were conducted from 2020 July to 2021 April; details of these observations are given in Table 2. We note that there are three additional OBSIDs associated with our program that are not included in this analysis. Two of these observations (0864622301 and 0864622401) were conducted with the EPIC filter wheel in the closed position due to enhanced radiation at the start of a revolution, while the third (0864621401) was affected by radiation at such a significant amount as to be unusable. Several other observations were also affected by radiation, as indicated in Table 2, but at a level that still allowed the data to be usable. We also note those sources for which the pn camera experienced a full scientific buffer. Normally caused by a high radiation background, the full scientific buffer causes the pn camera to switch to counting mode, thereby no longer recording scientific data.
We reduced and processed these observations using the Scientific Analysis System (SAS, Gabriel et al. 2004) v19.0.0. To standardize our analysis, we used the xmmextractor script to produce event files and extract spectra. As part of this analysis, we adopted standard analysis flags (PATTERN for MOS and PATTERN for pn) and good time intervals (RATE for MOS and RATE for pn). Source spectra were extracted in xmmextractor-selected apertures, while background spectra were extracted from off-source circular apertures of varying size.
Spectral fitting was performed using the python implementation of XSPEC v12.11.1 (Arnaud, 1996). We used a simple absorbed power-law model to fit our sources (phabspowerlaw). For all targets, we adopt a Galactic neutral Hydrogen column density, , based on the H I HI4PI Survey (HI4PI Collaboration et al., 2016). Both the normalization of the power law and the photon index, , were free to vary. We fixed the spectra of all three EPIC cameras to the same normalization, as studies with significantly deeper spectra have found that cross-normalization terms are effectively unity (e.g., Read et al., 2014; Li et al., 2015). We binned our spectra to a minimum of only one count per bin, and we therefore used the modified -statistic to evaluate best-fits and errors (Cash, 1979; Wachter et al., 1979).
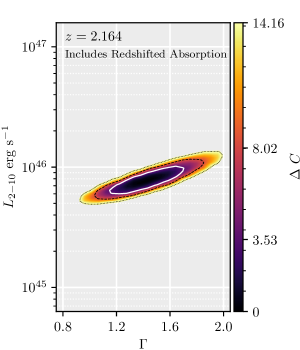
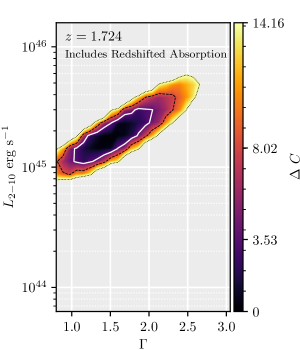
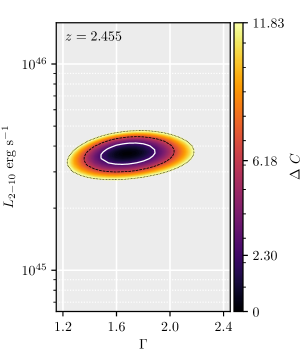
Additionally, we fit each source including an absorption component at the quasar redshift (phabspowerlawzphabs). Two sources have a redshifted column density, , that is not consistent with 0; for the other objects, we only report the results of the simpler fits. These two sources – GraL J08182613 and GraL J20176204 – were previously identified in Paper VI as having optical spectral signatures of absorption. GraL J08182613 has a red continuum and weak Ly emission, while GraL J20176204’s spectrum is reddened with broad absorption line (BAL) features. The only other quasar in our sample with optical features of absorption is GraL J18172729, which is not strongly detected in our observations.
| Target | normaaNormalization of the powerlaw component, with units at 1 keV. | /DOF | ||||||
|---|---|---|---|---|---|---|---|---|
| () | () | () | () | () | ||||
| GraL J06591629 | 11.60 | \@alignment@align | 831.18/937 | |||||
| GraL J08182613 | 13.40 | \@alignment@align | 520.04/623 | |||||
| GraL J11314419 | 4.86 | \@alignment@align | 282.68/322 | |||||
| GraL J16510417 | 9.52 | \@alignment@align | 568.31/682 | |||||
| GraL J17191515 | 5.44 | \@alignment@align | 290.77/278 | |||||
| GraL J18172729 | 8.43 | \@alignment@align | ||||||
| GraL J20176204 | 13.40 | \@alignment@align | 371.22/392 | |||||
| GraL J21030850 | 6.02 | \@alignment@align | 292.51/317 | |||||
| GraL J22001448 | 4.31 | \@alignment@align | 267.07/279 | |||||
| SDSS J11410436 | 3.05 | \@alignment@align | ||||||
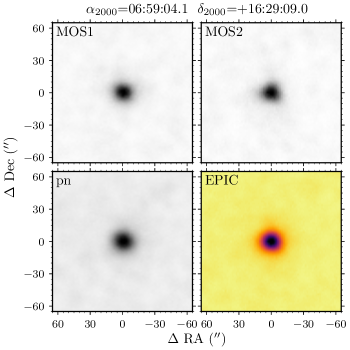
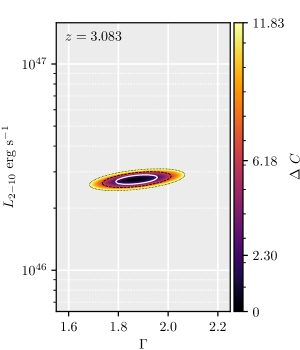
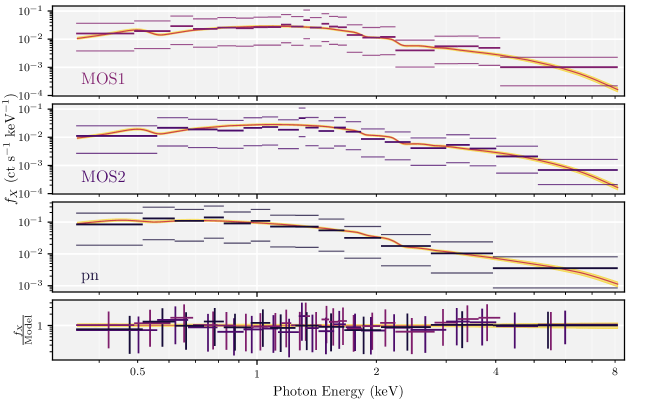
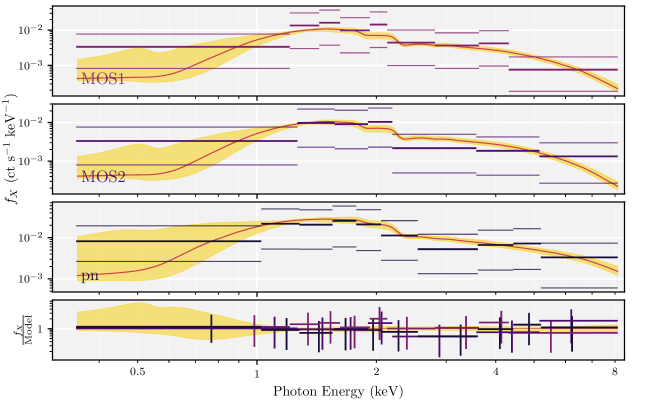
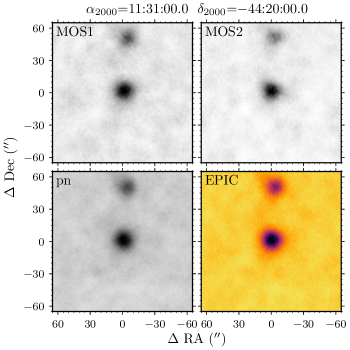
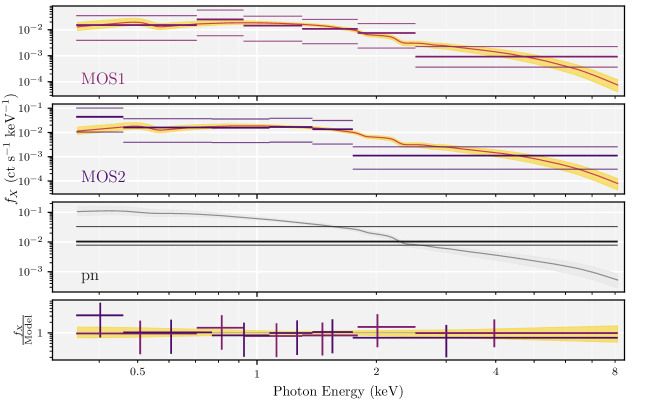
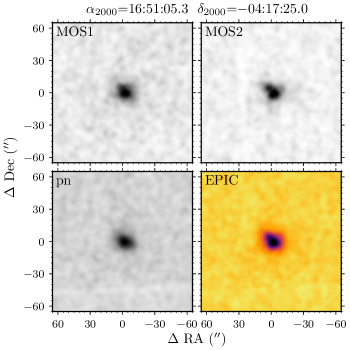
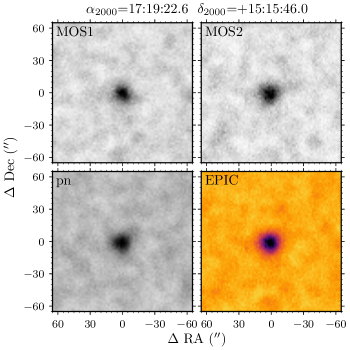
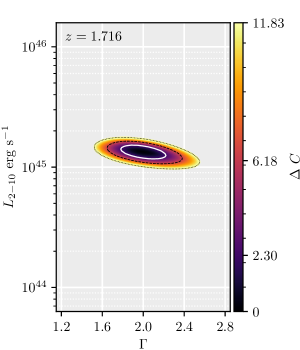
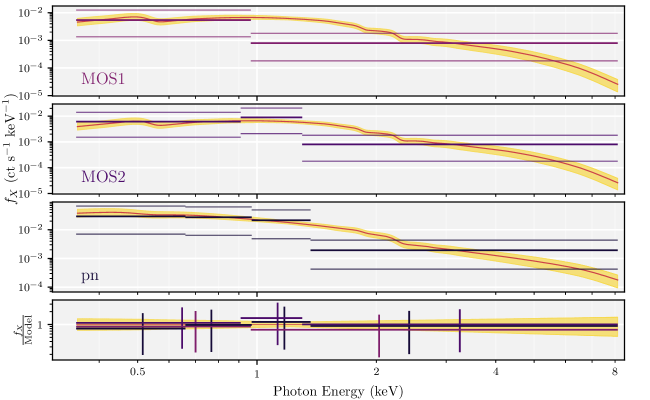
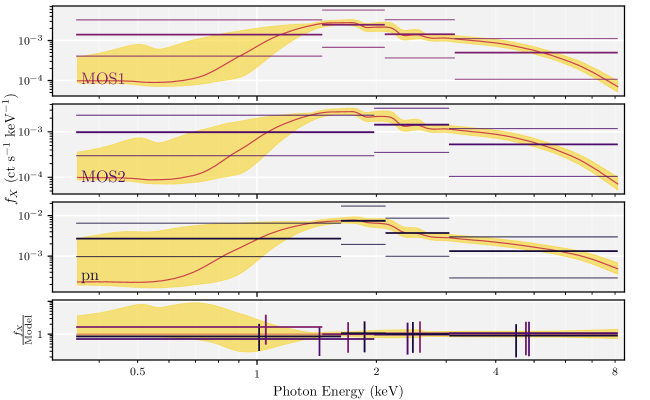
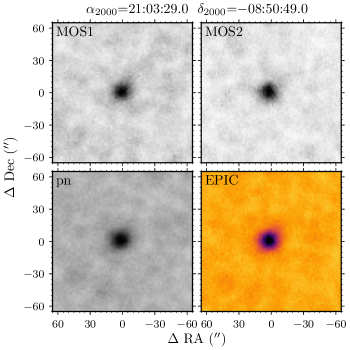
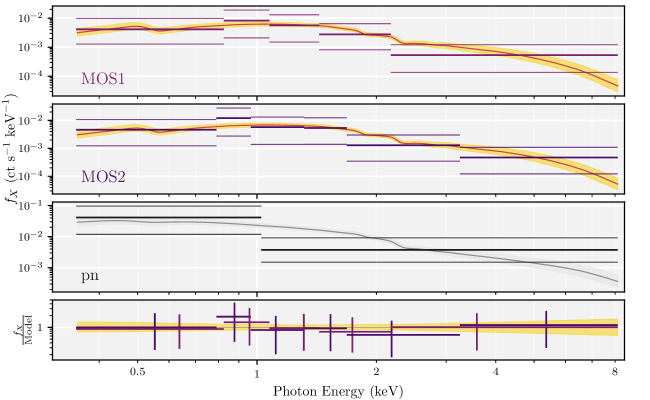
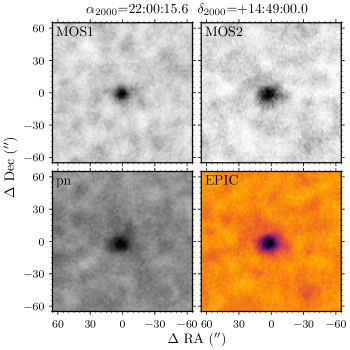
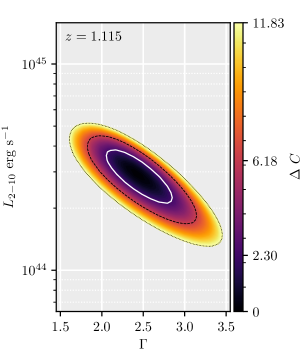
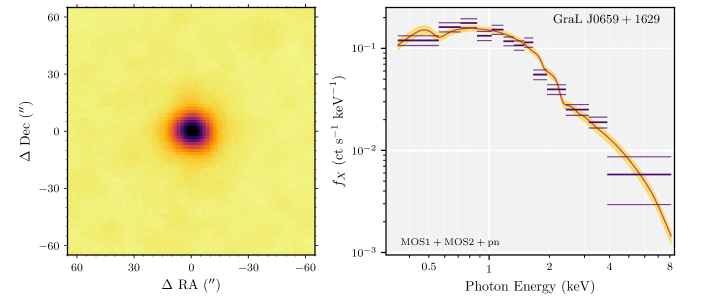
We computed the uncertainties on fit parameters by measuring contours in the statistic. As noted by Cash (1979), behaves as when evaluating confidence intervals, so that the uncertainties include those fits where (or for the three-component model, e.g., Lampton et al., 1976). Figure 1, presenting GraL J06591629, shows an example of our reduced data. The combined image from the three EPIC cameras are shown in the left, smoothed with a Gaussian kernel of width and with individual normalizations adjusted for presentation purposes. In the right, we show the background-subtracted combined count rate spectra from all three cameras, binned for plotting purposes. Horizontal bars show the source count rate, with thinner bars above and below corresponding to the uncertainties, using the methods of Gehrels (1986). The best fit model and its uncertainties were folded through the spectral responses with XSPEC and are plotted with the red line and yellow region, respectively. More detailed versions of this figure are presented for each quasar in our sample in the Appendix as Figures 4 and 5.
3 Results
In this section we present the results of our analysis of the ten observed quasars. We first present the observed properties for the entire sample in § 3.1, including notes on specific parameters. Then, in § 3.2, we discuss individual quasars, including how results may be influenced by the observing conditions.
3.1 Full Sample
We begin our analysis of these quasars with measurements of their flux. As with all results reported here, we do not attempt to differentiate the properties of individual point quasar images, as the XMM-Newton EPIC half energy width is . One motivation for reporting flux values is to facilitate the planning of future observations of these sources in the event of a caustic crossing event. As these observations may be conducted with either Chandra or XMM-Newton, we present flux values in the range of 0.3–8.0 keV, which is a suitable broad baseline for both observatories. Total energy fluxes, in units of , are given in Table 2 for all sources. These flux values are derived in XSPEC from the best-fitting model fits. For those quasars that were not well-fit, upper limits are given instead. We also report the background-subtracted source count rates in Table 2. Upper limits are again given for rates not detected at a level, and we do not report values for sources observed for less than 1.5 ks in a camera.
Next, we present the fitted X-ray properties of these quasars. The normalization and photon index of each object’s power law component is listed in Table 3. As with flux measurements, we present the upper limits on the normalization for the two quasars that were not detected. We also present the unobscured, rest-frame 2–10 keV luminosities. These model-derived luminosities assume the source is entirely composed of power-law emission in this energy band. For the two quasars that were well-fit by this model, we also include the constraints on the redshifted column density.
Finally, we include the rest-frame 6 m luminosity for each of these objects. Following, e.g., Stern (2015), we use photometry from the Wide-field Infrared Survey Explorer (WISE; Wright et al., 2010) and known redshifts from Paper IV, Paper V, and Paper VI to calculate . For our entire sample, rest-frame 6 m lies between the WISE W3 (12 m) and W4 (24 m) channels, and we compute luminosities through linear interpolation of these values. IR luminosities are listed in Table 3. Unlike the X-ray measurements, which are expected to only have minimal contamination from the lensing galaxy, these values could potentially be slightly boosted in flux due to the contribution of the intervening galaxy. On the other hand, lensing preferentially occurs from more massive, i.e., early-type, galaxies, which have falling spectral energy distributions beyond rest-frame -band, so the expectation is that the W3 and W4 flux from these systems is dominated by the lensed quasar emission.
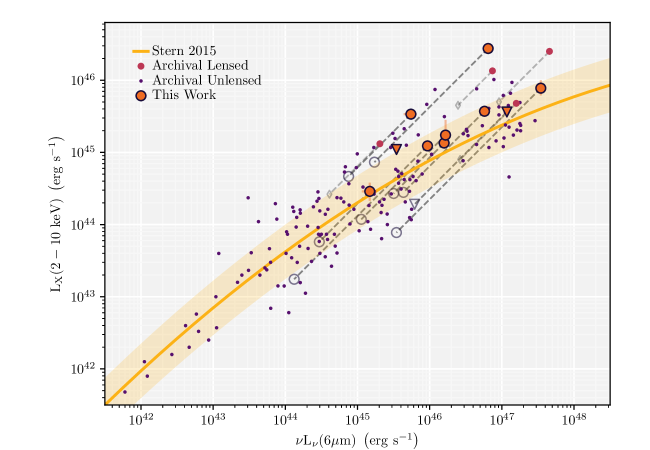
We show the distribution of X-ray to IR luminosities for this sample in Figure 2. For all lensed quasars, we also plot a magnification track, showing what these values would be were the quasar unlensed. For the quad lenses, we use the modeled magnification values from Paper VI (listed in Table 1), while we adopt a value of for the doubly-imaged lenses (a typical value for these systems, e.g., Kochanek et al., 2000; Rusu et al., 2016). Also shown is the relation between X-ray and IR luminosities presented by Stern (2015). While linear at lower luminosities, this relation has a characteristic flattening above , believed to be caused by the X-ray emission saturating as the corona cools and softens with increasing thermal emission from the disk (e.g., Brightman et al., 2013). We also include a sample of archival lensed quasars (Just et al. 2007, Stern & Walton 2020, and Walton et al., submitted), local Seyferts (Horst et al., 2008; Gandhi et al., 2009), and luminous quasars (Just et al., 2007). For the lensed quasar sample, magnification tracks are for reported values if known, and are otherwise also assumed to be .
3.2 Notes on Individual Quasars
3.2.1 GraL J0659+1629
The highest redshift quasar in our sample, GraL J0659+1629 is also the X-ray brightest. Consequently, this quasar is the most X-ray luminous object in our sample by almost an order of magnitude. Paper VI reported that there are no archival radio sources associated with this source, and the closest object in the 3 GHz Very Large Array Sky Survey Epoch 1 Quick Look catalog is almost two arcminutes away (Gordon et al., 2020). We have also carried out deeper VLA observations (D. Dobie et al., in prep.) and detected radio sources at the location of all four optical images with a typical flux density of , comparable to the optical flux density reported by Paper VI. This quasar therefore does not fit the standard definition of radio-loud, i.e. having a radio flux density greater than ten times its optical flux density (e.g., Kellermann et al., 1989). Conversely, the most X-ray luminous quasars in the universe tend to be radio-loud quasars or blazars (e.g., Khorunzhev et al., 2021). As such, this source presents a unique opportunity to study the radio-quiet quasar population in detail. We also note that the high observed X-ray luminosity is potentially indicative of a large magnification; as discussed by Stern (2015), X-ray luminosities tend to saturate above , so the observed value of is the result of either a very intrinsically luminous quasar or a large luminosity boost from lensing. From the modeling presented in Paper VI, , demonstrating the validity of this technique for identifying significantly lensed quasars.
3.2.2 GraL J1131–4419
Voges et al. (2000) report an X-ray source at this position in ROSAT All-Sky Survey observations, 1RXS J113058.9441949. While that catalog only reports a source count rate, the second ROSAT all-sky source catalog (Boller et al., 2016) includes properties from a power-law spectral fit. The reported absorption-corrected flux in the 0.1-2.4 keV band is , which is almost two orders of magnitude brighter than what we report here. Some of this discrepancy can be explained by Boller et al. (2016) effectively adding in flux by correcting for absorption and the differences in energy bands. Further differences may be driven by the fitted power-law, which has a best-fit photon index of for the ROSAT data. As discussed by Connor et al. (2020), an excessively steep fit to the photon index caused by limited source counts can effect a larger calculated flux at soft energies. Yet cannot be entirely to blame, as the normalization, , is still an order of magnitude larger than what we find in the more recent XMM-Newton observations.
We also note that another X-ray source is seen in the new X-ray imaging, roughly to the north at the location of the high proper motion star 2MASS J113100014419088. However, it is unlikely that this is the source of the large ROSAT flux for two reasons. First, although the separation of the two objects may lead to some flux contamination in the ROSAT imaging (see Boese, 2000), the star is fainter than GraL J11314419 in the new observations and much fainter than the earlier flux value. Second, 1RXS J113058.9441949 is only from GraL J11314419, consistent with the expected positional uncertainty Boller et al. (2016) report for ROSAT coordinates. In contrast, the ROSAT detection is from 2MASS J113100014419088, implying that the star was not the source of the X-ray flux. There are no further bright X-ray objects within of the lensing system.
It is not clear what is responsible for such a change in the observed flux. While AGN are known to have intrinsic flux variations in X-rays (e.g., Paolillo et al., 2004), the observed dimming is too large to be explained by stochastic variability from changes in black hole fueling alone (Sartori et al., 2018). Such a large dimming over 30 years (15 years in the source frame) could be attributed to the quasar being a changing-look AGN (Ricci et al., 2020), although this is difficult to assess without a spectrum from the earlier epoch. Serendipitous Swift observations from 2009-2012 show no significant difference in the X-ray flux with what is found here (; Evans et al. 2020). Alternatively, the ROSAT observations could have coincided with a microlensing event, although this, too, would be an extreme value for such an effect (Chen et al., 2012).
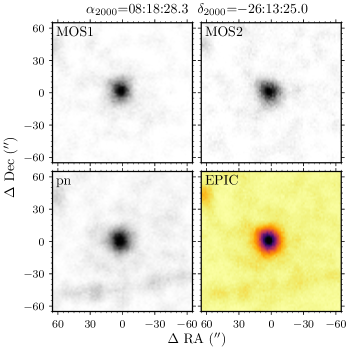
3.2.3 GraL J1651–0417
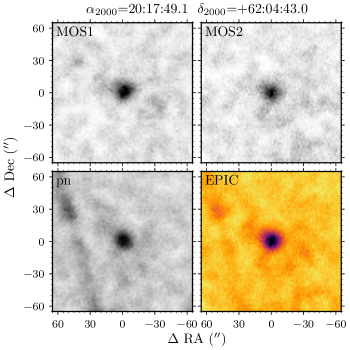
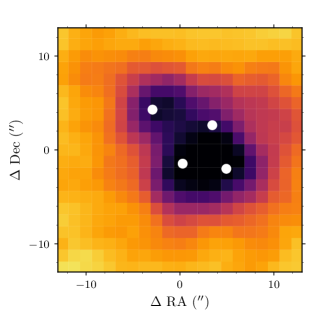
This quasar has the largest maximum separation of our sample, at (Paper VI). The most separated lensed image is located to the NE, while the three other images in this quad are located in close proximity to each other. In the X-ray observations of this system, presented in Figure 3, we find that the quasar is composed of two separate sources, with the second source appearing in the direction and at the separation expected of the NE image. Individual lens images have been resolved by XMM-Newton when the lensing object is a galaxy cluster (e.g., Lamer et al., 2006), but previous observations of sources with galaxy-scale lenses have heretofore been unresolved with this observatory (e.g., Fedorova et al., 2008; Chartas et al., 2016). GraL J16510417 is thus a potentially interesting source for future X-ray studies with large effective area but worse-than-arcsecond resolution, such as X-IFU on Athena (Barret et al., 2018).
3.2.4 GraL J1817+2729
Despite having one of the highest inferred 6 m luminosities of our sample, this gravitational lens system, known as Hercules’ Sword (Paper VI), is undetected in a nominal exposure of 19.5 ks. However, this observation was heavily affected by radiation; the pn camera experienced a full scientific buffer and was rendered unusable for our analysis, while the good time intervals for the MOS cameras only summed to 3.1 and 3.0 ks for MOS1 and MOS2, respectively. Nevertheless, the strict upper limits on measured count rates place this lensed quasar as the faintest target in our sample. From a mass model of the system, Lemon et al. (2019) report a magnification for Hercules’ Sword of , similar to the value of derived from Paper VI. Based on that, the unmagnified X-ray luminosity is, at most, of order , while the IR luminosity is still approximately . This value, even at the X-ray limit, is still a large offset from the Stern (2015) relation.
One potential explanation is that the IR luminosity is contaminated in a way the X-ray measurement is not. Paper VI spectroscopically identified a Galactic mid-type star NW of the lens, which is the brightest -band object in the system (Rusu & Lemon, 2018). Subaru imaging and associated mass modeling presented by Rusu & Lemon (2018) show that the lensing galaxy is brighter (-band) than two of the lensed images and is suggestive of an edge-on, dusty disk. Neither a typical Galactic star or an inactive galaxy should be able to mimic such a large IR luminosity, however.
Conversely, the spectrum of this lensed quasar shows strong C IV BAL features. Previous studies have found that the strength of BAL features correlates with a reduced X-ray luminosity (Gibson et al., 2009). The presence of this correlation in observed hard-energy NuSTAR observations suggests that this faintness is intrinsic, not caused by absorption, and so would still be present even at (Luo et al., 2014). BAL quasars can be more luminous than the limit set for Hercules’ Sword – Vito et al. (2018) reported on XMM-Newton observations of five , quasars with BAL features, finding luminosities of , while Connor et al. (2020) reported on an unlensed , BAL quasar with . However, the faintness of GraL J1817+2729 is still in keeping with the expectation of an X-ray weak quasar.
3.2.5 GraL J2103-0850
This gravitational lens system is associated with a source detected in the ROSAT All-Sky Faint Source Catalog (Voges et al., 2000), 1RXS J210328.9085039. In the second ROSAT all-sky source catalog, Boller et al. (2016) report an absorption-corrected 0.1-2.4 keV flux from an assumed power-law model of . Considering the slightly softer energy range of this observation and the correction for absorption, this value is consistent with what we report here, suggesting only a minimal amount of variation since the ROSAT observations of 1990/1991.
4 Discussion
In their analysis of MG 1131+0456, Stern & Walton (2020) proposed that the relation could act as a means to identify lensed quasars. As shown in Figure 2, magnification pushes sources on the Stern (2015) relation up and off; thus, any sources with anomalously high X-ray luminosities for their mid-infrared luminosity could indicate lensing. However, most of the sources analyzed here are consistent with the Stern (2015) relation, within the expected scatter. The lack of excess X-ray luminosity is most likely a result of some combination of small magnification factors, intrinsic X-ray luminosities lying below the relation, and the roughly linear correlation at lower luminosities minimizing the impact of magnification on producing deviations. While X-ray luminosity offsets should nevertheless serve as a means of identifying lensing among the most luminous quasars and the strongest magnification lenses, as is demonstrated here by GraL J06591629, we should not expect the overall population of lensed sources to only be outliers.
One of the motivations for this work was to establish a baseline set of flux measurements of lensed quasars to facilitate future observations of caustic crossing events. The full all-sky survey of SRG/eROSITA (eRASS) is expected to reach a point source sensitivity of (Predehl et al., 2021). As such, we expect all of the lens systems presented here to be detected by the full survey and the brightest of these to potentially have multiple observations to constrain their variability. However, that is the limiting sensitivity for detection; even the simple spectral analyses reported here will be beyond the capabilities of the eRASS. As such, future observations of lensed quasars with XMM-Newton and Chandra are still warranted.
Another potential advantage of the SRG-based observatories comes in their potential to detect X-ray variability. The medium-energy ART-XC telescope on SRG is performing daily scans of the sky at 4–12 keV. These scans have sensitivities of and survey roughly 1% of the sky every day (Sunyaev et al., 2021). It is possible – albeit unlikely – that a caustic crossing event could produce the magnifications necessary to boost one of the lensed quasars in this sample into that flux threshold. As previous transient sources detected by ART-XC have also been seen by eROSITA (e.g., Mereminskiy et al., 2020; Schwope et al., 2020), we would expect similar results from the softer survey. As further gravitational lenses are spectroscopically confirmed, archival observations may reveal past extreme magnification events.
Finally, we note the potential for XMM-Newton in the study of distant lensed quasars. Chandra, with its exquisite angular resolution enabling the separation of individual sources, is often used for studies of lensed quasars (e.g., Chen et al., 2012; Guerras et al., 2017; Dogruel et al., 2020). However, for faint sources, Chandra will be unable to detect the necessary amount of photons for a temporal analysis without deep observations; meanwhile, as demonstrated by Paper II, Gaia observations can provide precise astrometry, obviating that requirement from X-ray observations. In cases such as these, when only spectral information is desired at X-ray energies, XMM-Newton is more than suited for the task.
5 Summary
We have presented XMM-Newton X-ray observations of nine lensed quasars and one unlensed source selected by Gaia GraL. Observations were relatively short ( ks), and represent an exploratory program into the nature of the GraL sample. The primary results of this work are as follows.
-
•
We report X-ray fluxes and XMM-Newton EPIC count rates for eight of the lensed quasars, as well as upper limits for the ninth. Most sources have fluxes of and count rates of at least 10 ct in each MOS camera. These measurements will be invaluable in planning future targeted observations of caustic crossing events.
-
•
Using XSPEC, we fit the observed quasars with an absorbed power-law, and we report the best-fit values of this in Table 3. From these fits, we also derive rest-frame 2–10 keV unabsorbed luminosities. Here, we find that the observed sample covers over two orders of magnitude in X-ray luminosity.
-
•
Despite observing it for almost 20 ks, we do not detect GraL J1817+2729, one of the two most IR luminous quasars in our sample. This is partially due to severe radiation effects during the observation, which cut the effective exposure time to 3 ks in the MOS cameras and which overwhelmed the pn camera entirely. However, the upper limit we infer from these limited observations nevertheless reveals that this quasar is X-ray faint, perhaps related to its observed BAL features. Due to the lensing magnification, deeper observations may enable the first detailed look at an X-ray faint quasar in the early Universe ().
-
•
We observe GraL J11314419, which was previously detected in the ROSAT All-Sky Survey. The X-ray flux reported from that survey is almost two orders of magnitude brighter than what we find here. As the ROSAT observations were taken 30 years prior to the XMM-Newton observations, it is not entirely clear what the cause of the variability is, but this could potentially be indicative of a major microlensing event in the older observations.
-
•
MOS observations of GraL J16510417 reveal an extended structure to the NE of the main component of the quasar emission. Using a small smoothing scale, we are able to observe two distinct structures in this lens system, in the orientation expected from the Gaia-observed positions of the lensed images. With a maximum separation of , this is the most closely-separated gravitational lens system resolved into multiple components by XMM-Newton.
The work of TC and DS was carried out at the Jet Propulsion Laboratory, California Institute of Technology, under a contract with NASA. TC’s research was supported by an appointment to the NASA Postdoctoral Program at the Jet Propulsion Laboratory, California Institute of Technology, administered by Universities Space Research Association under contract with NASA. DJW acknowledges support from the Science and Technology Facilities Council (STFC) in the form of an Ernest Rutherford Fellowship (grant ST/N004027/1). LD acknowledges support from the ESA PRODEX Programme ‘Gaia-DPAC QSOs’ and from the Belgian Federal Science Policy Office. SAK was partially supported by the German Aerospace Agency (grant 50QG1402). DS acknowledges support from the European Research Council (ERC) under the European Union’s Horizon 2020 research and innovation programme (grant agreement No 787886).
Based on observations obtained with XMM-Newton, an ESA science mission with instruments and contributions directly funded by ESA Member States and NASA.
XMM
© 2021. All rights reserved.
References
- Agnello et al. (2018) Agnello, A., Lin, H., Kuropatkin, N., et al. 2018, MNRAS, 479, 4345
- Arnaud (1996) Arnaud, K. A. 1996, adass V, 101, 17
- Bañados et al. (2021) Bañados, E., Mazzucchelli, C., Momjian, E., et al. 2021, ApJ, 909, 80
- Barret et al. (2018) Barret, D., Lam Trong, T., den Herder, J.-W., et al. 2018, Proc. SPIE, 10699, 106991G
- Barrett & Bridgman (1999) Barrett, P. E., & Bridgman, W. T. 1999, adass VIII, 172, 483
- Bate et al. (2011) Bate, N. F., Floyd, D. J. E., Webster, R. L., & Wyithe, J. S. B. 2011, ApJ, 731, 71
- Bellm et al. (2019) Bellm, E. C., Kulkarni, S. R., Graham, M. J., et al. 2019, PASP, 131, 018002
- Boese (2000) Boese, F. G. 2000, A&AS, 141, 507
- Boller et al. (2016) Boller, T., Freyberg, M. J., Trümper, J., et al. 2016, A&A, 588, A103
- Brightman et al. (2013) Brightman, M., Silverman, J. D., Mainieri, V., et al. 2013, MNRAS, 433, 2485
- Cash (1979) Cash, W. 1979, ApJ, 228, 939
- Chartas et al. (2016) Chartas, G., Cappi, M., Hamann, F., et al. 2016, ApJ, 824, 53
- Chen et al. (2012) Chen, B., Dai, X., Kochanek, C. S., et al. 2012, ApJ, 755, 24
- Chen et al. (2018) Chen, G. C. F., Chan, J. H. H., Bonvin, V., et al. 2018, MNRAS, 481, 1115
- Collett et al. (2018) Collett, T. E., Oldham, L. J., Smith, R. J., et al. 2018, Science, 360, 1342
- Connor et al. (2019) Connor, T., Bañados, E., Stern, D., et al. 2019, ApJ, 887, 171
- Connor et al. (2020) Connor, T., Bañados, E., Mazzucchelli, C., et al. 2020, ApJ, 900, 189
- Courbin et al. (2018) Courbin, F., Bonvin, V., Buckley-Geer, E., et al. 2018, A&A, 609, A71
- Dai et al. (2010) Dai, X., Kochanek, C. S., Chartas, G., et al. 2010, ApJ, 709, 278
- Delchambre et al. (2019) Delchambre, L., Krone-Martins, A., Wertz, O., et al. 2019, A&A, 622, A165
- Diego (2019) Diego, J. M. 2019, A&A, 625, A84
- Dogruel et al. (2020) Dogruel, M. B., Dai, X., Guerras, E., Cornachione, M., & Morgan, C. W. 2020, ApJ, 894, 153
- Ducourant et al. (2018) Ducourant, C., Wertz, O., Krone-Martins, A., et al. 2018, A&A, 618, A56
- Evans et al. (2020) Evans, P. A., Page, K. L., Osborne, J. P., et al. 2020, ApJS, 247, 54
- Fedorova et al. (2008) Fedorova, E. V., Zhdanov, V. I., Vignali, C., & Palumbo, G. G. C. 2008, A&A, 490, 989
- Fian et al. (2018) Fian, C., Mediavilla, E., Jiménez-Vicente, J., Muñoz, J. A., & Hanslmeier, A. 2018, ApJ, 869, 132
- Gabriel et al. (2004) Gabriel, C., Denby, M., Fyfe, D. J., et al. 2004, adass XIII, 314, 759
- Gaia Collaboration et al. (2016) Gaia Collaboration, Prusti, T., de Bruijne, J. H. J., et al. 2016, A&A, 595, A1
- Gaia Collaboration et al. (2018) Gaia Collaboration, Brown, A. G. A., Vallenari, A., et al. 2018, A&A, 616, A1
- Gandhi et al. (2009) Gandhi, P., Horst, H., Smette, A., et al. 2009, A&A, 502, 457
- Gehrels (1986) Gehrels, N. 1986, ApJ, 303, 336
- Gibson et al. (2009) Gibson, R. R., Jiang, L., Brandt, W. N., et al. 2009, ApJ, 692, 758
- Gilman et al. (2020) Gilman, D., Du, X., Benson, A., et al. 2020, MNRAS, 492, L12
- Gordon et al. (2020) Gordon, Y. A., Boyce, M. M., O’Dea, C. P., et al. 2020, Research Notes of the American Astronomical Society, 4, 175
- Guerras et al. (2017) Guerras, E., Dai, X., Steele, S., et al. 2017, ApJ, 836, 206
- HI4PI Collaboration et al. (2016) HI4PI Collaboration, Ben Bekhti, N., Flöer, L., et al. 2016, A&A, 594, A116
- Horst et al. (2008) Horst, H., Gandhi, P., Smette, A., & Duschl, W. J. 2008, A&A, 479, 389
- Jansen et al. (2001) Jansen, F., Lumb, D., Altieri, B., et al. 2001, A&A, 365, L1
- Just et al. (2007) Just, D. W., Brandt, W. N., Shemmer, O., et al. 2007, ApJ, 665, 1004
- Kellermann et al. (1989) Kellermann, K. I., Sramek, R., Schmidt, M., Shaffer, D. B., & Green, R. 1989, AJ, 98, 1195
- Kelly et al. (2018) Kelly, P. L., Diego, J. M., Rodney, S., et al. 2018, Nature Astronomy, 2, 334
- Khorunzhev et al. (2021) Khorunzhev, G. A., Meshcheryakov, A. V., Medvedev, P. S., et al. 2021, Astronomy Letters, 47, 123
- Khramtsov et al. (2019) Khramtsov, V., Sergeyev, A., Spiniello, C., et al. 2019, A&A, 632, A56
- Kochanek & Dalal (2004) Kochanek, C. S., & Dalal, N. 2004, ApJ, 610, 69
- Kochanek et al. (2000) Kochanek, C. S., Falco, E. E., Impey, C. D., et al. 2000, ApJ, 535, 692
- Krone-Martins et al. (2018) Krone-Martins, A., Delchambre, L., Wertz, O., et al. 2018, A&A, 616, L11
- Krone-Martins et al. (2019) Krone-Martins, A., Graham, M. J., Stern, D., et al. 2019, arXiv e-prints, arXiv:1912.08977
- Lamer et al. (2006) Lamer, G., Schwope, A., Wisotzki, L., & Christensen, L. 2006, A&A, 454, 493
- Lampton et al. (1976) Lampton, M., Margon, B., & Bowyer, S. 1976, ApJ, 208, 177
- Lemon et al. (2020) Lemon, C., Auger, M. W., McMahon, R., et al. 2020, MNRAS, 494, 3491
- Lemon et al. (2019) Lemon, C. A., Auger, M. W., & McMahon, R. G. 2019, MNRAS, 483, 4242
- Lemon et al. (2018) Lemon, C. A., Auger, M. W., McMahon, R. G., & Ostrovski, F. 2018, MNRAS, 479, 5060
- Li et al. (2015) Li, J.-T., Decourchelle, A., Miceli, M., Vink, J., & Bocchino, F. 2015, MNRAS, 453, 3953
- Li et al. (2020) Li, R., Napolitano, N. R., Tortora, C., et al. 2020, ApJ, 899, 30
- Luo et al. (2014) Luo, B., Brandt, W. N., Alexander, D. M., et al. 2014, ApJ, 794, 70
- Mereminskiy et al. (2020) Mereminskiy, I., Medvedev, P., Lutovinov, A., et al. 2020, The Astronomer’s Telegram, 14206, 1
- Morgan et al. (2008) Morgan, C. W., Kochanek, C. S., Dai, X., Morgan, N. D., & Falco, E. E. 2008, ApJ, 689, 755
- Mosquera & Kochanek (2011) Mosquera, A. M., & Kochanek, C. S. 2011, ApJ, 738, 96
- Mosquera et al. (2013) Mosquera, A. M., Kochanek, C. S., Chen, B., et al. 2013, ApJ, 769, 53
- Nierenberg et al. (2020) Nierenberg, A. M., Gilman, D., Treu, T., et al. 2020, MNRAS, 492, 5314
- Oguri et al. (2014) Oguri, M., Rusu, C. E., & Falco, E. E. 2014, MNRAS, 439, 2494
- Ostrovski et al. (2017) Ostrovski, F., McMahon, R. G., Connolly, A. J., et al. 2017, MNRAS, 465, 4325
- Ostrovski et al. (2018) Ostrovski, F., Lemon, C. A., Auger, M. W., et al. 2018, MNRAS, 473, L116
- Paolillo et al. (2004) Paolillo, M., Schreier, E. J., Giacconi, R., Koekemoer, A. M., & Grogin, N. A. 2004, ApJ, 611, 93
- Paterno-Mahler et al. (2018) Paterno-Mahler, R., Sharon, K., Coe, D., et al. 2018, ApJ, 863, 154
- Pooley et al. (2007) Pooley, D., Blackburne, J. A., Rappaport, S., & Schechter, P. L. 2007, ApJ, 661, 19
- Pooley et al. (2012) Pooley, D., Rappaport, S., Blackburne, J. A., Schechter, P. L., & Wambsganss, J. 2012, ApJ, 744, 111
- Predehl et al. (2021) Predehl, P., Andritschke, R., Arefiev, V., et al. 2021, A&A, 647, A1
- Read et al. (2014) Read, A. M., Guainazzi, M., & Sembay, S. 2014, A&A, 564, A75
- Reis et al. (2014) Reis, R. C., Reynolds, M. T., Miller, J. M., & Walton, D. J. 2014, Nature, 507, 207
- Reynolds et al. (2014) Reynolds, M. T., Walton, D. J., Miller, J. M., & Reis, R. C. 2014, ApJ, 792, L19
- Ricci et al. (2020) Ricci, C., Kara, E., Loewenstein, M., et al. 2020, ApJ, 898, L1
- Rodney et al. (2018) Rodney, S. A., Balestra, I., Bradac, M., et al. 2018, Nature Astronomy, 2, 324
- Rusu & Lemon (2018) Rusu, C. E., & Lemon, C. A. 2018, Research Notes of the American Astronomical Society, 2, 187
- Rusu et al. (2016) Rusu, C. E., Oguri, M., Minowa, Y., et al. 2016, MNRAS, 458, 2
- Sartori et al. (2018) Sartori, L. F., Schawinski, K., Trakhtenbrot, B., et al. 2018, MNRAS, 476, L34
- Schwope et al. (2020) Schwope, A., Semena, A., Maitra, C., et al. 2020, The Astronomer’s Telegram, 14219, 1
- Stern (2015) Stern, D. 2015, ApJ, 807, 129
- Stern & Walton (2020) Stern, D., & Walton, D. J. 2020, ApJ, 895, L38
- Stern et al. (2020) Stern, D., Djorgovski, S. G., Krone-Martins, A., et al. 2020, arXiv e-prints, arXiv:2012.10051
- Strüder et al. (2001) Strüder, L., Briel, U., Dennerl, K., et al. 2001, A&A, 365, L18
- Sunyaev et al. (2021) Sunyaev, R., Arefiev, V., Babyshkin, V., et al. 2021, arXiv e-prints, arXiv:2104.13267
- Suyu et al. (2017) Suyu, S. H., Bonvin, V., Courbin, F., et al. 2017, MNRAS, 468, 2590
- Tomozeiu et al. (2018) Tomozeiu, M., Mohammed, I., Rabold, M., Saha, P., & Wambsganss, J. 2018, MNRAS, 475, 1925
- Treu (2010) Treu, T. 2010, ARA&A, 48, 87
- Treu et al. (2018) Treu, T., Agnello, A., Baumer, M. A., et al. 2018, MNRAS, 481, 1041
- Turner et al. (2001) Turner, M. J. L., Abbey, A., Arnaud, M., et al. 2001, A&A, 365, L27
- Vega-Ferrero et al. (2018) Vega-Ferrero, J., Diego, J. M., Miranda, V., & Bernstein, G. M. 2018, ApJ, 853, L31
- Vegetti et al. (2012) Vegetti, S., Lagattuta, D. J., McKean, J. P., et al. 2012, Nature, 481, 341
- Vito et al. (2018) Vito, F., Brandt, W. N., Luo, B., et al. 2018, MNRAS, 479, 5335
- Voges et al. (2000) Voges, W., Aschenbach, B., Boller, T., et al. 2000, IAU Circ., 7432, 3
- Wachter et al. (1979) Wachter, K., Leach, R., & Kellogg, E. 1979, ApJ, 230, 274
- Walsh et al. (1979) Walsh, D., Carswell, R. F., & Weymann, R. J. 1979, Nature, 279, 381
- Walton et al. (2015) Walton, D. J., Reynolds, M. T., Miller, J. M., et al. 2015, ApJ, 805, 161
- Wayth et al. (2005) Wayth, R. B., O’Dowd, M., & Webster, R. L. 2005, MNRAS, 359, 561
- Wertz et al. (2019) Wertz, O., Stern, D., Krone-Martins, A., et al. 2019, A&A, 628, A17
- Wright et al. (2010) Wright, E. L., Eisenhardt, P. R. M., Mainzer, A. K., et al. 2010, AJ, 140, 1868
Appendix A EPIC Observations and Spectral Fits of the Sample
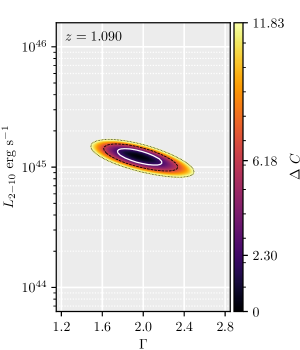
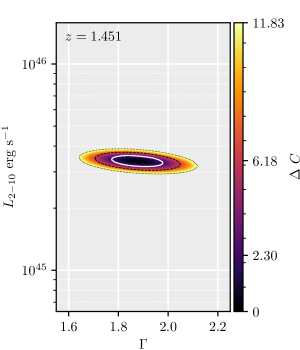
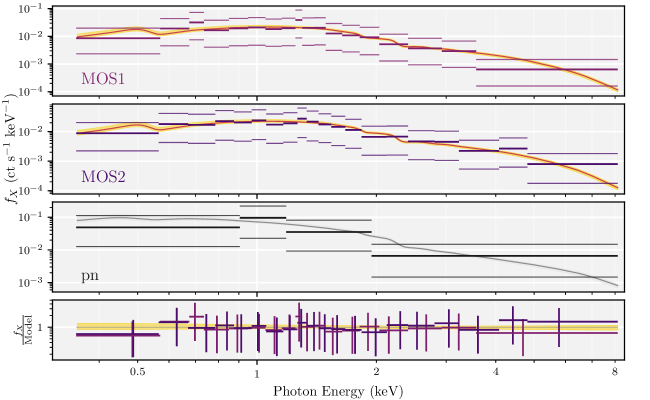
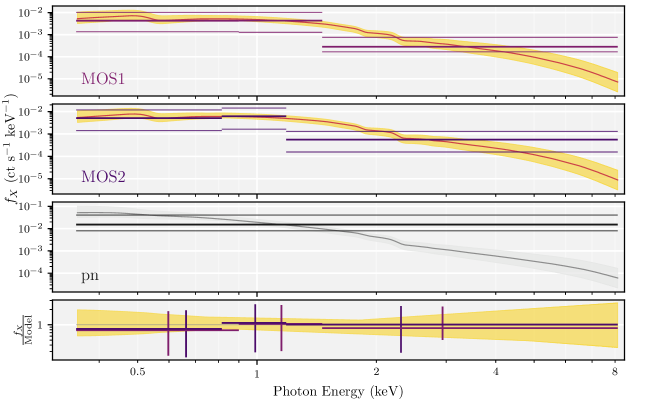
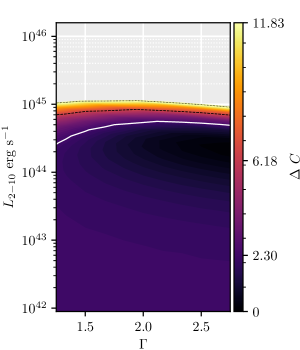
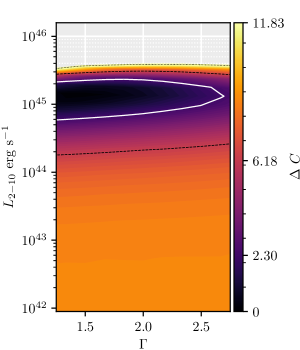
To assist in the planning of future observations of these quasars should they be the site of a future microlensing event, we present full details of our fits and analysis in Figures 4 and 5. In the upper left panels, we show the individual images from the three EPIC cameras, as well as a combined view of all three. These images are on a side, are centered on the position of the quasar, and are smoothed with Gaussian kernels of width . In the upper right, we show contours of the best-fitting values of and . Contours corresponding to , , and are indicated by the white, black dashed, and black dotted lines, respectively. For the two quasars well-fit by including a redshifted absorption component, these contours trace the lowest value of for a given pair of and luminosity across the entire range of modeled column densities.
In the bottom panels of Figure 4, we show the individual observed and best-fitting spectra in the three EPIC cameras, as well as the residuals. Observed spectra are background-subtracted and have been binned for presentation purposes. Thin horizontal lines above and below the observed values correspond to uncertainties. Best fit models, propogated through fakeit in XSPEC, are shown by the red lines, while yellow regions trace the bounds of uncertainties on the fit. For the pn observations that were unusable, the subfigure is rendered in gray.