∎
University of Calgary
22email: gouri.deshpande@ucalgary.ca 33institutetext: Guenther Ruhe 44institutetext: Dept. Computer Science
Dept. Electrical and Software Engineering
University of Calgary
44email: ruhe@ucalgary.ca 55institutetext: Chad Saunders 66institutetext: Haskayne School of Business
University of Calgary
66email: wsaunder@ucalgary.ca
How Much Data Analytics is Enough?
Abstract
Machine Learning (ML) can substantially improve the efficiency and effectiveness of organizations and is widely used for different purposes within Software Engineering. However, the selection and implementation of ML techniques rely almost exclusively on accuracy criteria. Thus, for organizations wishing to realize the benefits of ML investments, this narrow approach ignores crucial considerations around the anticipated costs of the ML activities across the ML life-cycle, while failing to account for the benefits that are likely to accrue from the proposed activity. We present findings for an approach that addresses this gap by enhancing the accuracy criterion with return on investment (ROI) considerations. Specifically, we analyze the performance of the two state-of-the-art ML techniques: Random Forest and Bidirectional Encoder Representations from Transformers (BERT), based on accuracy and ROI for two publicly available data sets. Specifically, we compare decision-making on requirements dependency extraction (i) exclusively based on accuracy and (ii) extended to include ROI analysis. As a result, we propose recommendations for selecting ML classification techniques based on the degree of training data used. Our findings indicate that considering ROI as additional criteria can drastically influence ML selection when compared to decisions based on accuracy as the sole criterion.
Keywords:
Machine LearningReturn on Investment Accuracy BERT Random Forest1 Introduction
Machine Learning (ML) includes methods, tools, and techniques for inferring models from data and has provided successful applications of classification and prediction algorithms. In the area of software development and evolution, a recent study shafiq2020machine revealed that there is a spectrum of applications of ML across the software development life-cycle, with most of the applications belonging to the category of Quality Assurance and Analytics.
There exists an extensive variety of ML algorithms and this pool is growing steadily. A recent study shafiq2020machine listed Decision Trees, Naive Bayes, and Random Forrest as the techniques most frequently applied in Software Engineering. However, it is important to determine which algorithm works well for a given problem and which are less effective. The performance of any ML technique is generally measured in terms of accuracy (or similar measures). However, the success of ML does not only depend on the algorithms used because ML is a process with various interdependent steps and the investments made in this process need to be related to the return gained from its results. This paper puts estimating the return-on-investment (ROI) of ML in the spotlight. ROI is most widely used in the context of business analysis, which we extend to ML classification problems. In particular, we focus on the decision-making of ML method selection, i.e., to determine when to stop the process and how much additional investment is needed to achieve a target goal (result).
The most important prerequisite for generating accurate ML models is high-quality training data, however securing such data is often an arduous task. Additionally, engineering and selecting appropriate features is especially time-consuming and requires a vast amount of effort and resources figalist2020end . The benefits gained from the application of ML can be dramatically offset due to data collection and data pre-processing activities, which incur substantial costs and effort.
ROI is of great interest in engineering and business, where it is widely used as a guide for decision-making. This is true in Software Engineering (SE) as well. For example, Silverio et al. martinez2013rearm evaluated cost-benefit analysis for the adoption of software reference architectures for optimizing architectural decision-making. Cleland et al. cleland2004heterogeneous studied the ROI of heterogeneous solutions for the improvement of requirements traceability. However, the recent data explosion in the form of big data and advances in Machine Learning (ML) have posed questions on the efficiency and effectiveness of these processes that have become more relevant.
In this paper, we present two empirical studies from the field of requirements engineering. While it serves as one sample topic for a broader problem, Requirements Dependency Classification (RDC) has been a topic of interest for both researchers and practitioners. In particular, we study a fine-tuned BERT (Bidirectional Encoder Representations from Transformers) devlin2018bert , a recent technique published by researchers from Google, with Random Forest for solving RDC. BERT uses bidirectional training of transformer, a popular attention model, to language modelling, which claims to be state-of-the-art for NLP tasks. We compare BERT with Random Forest (RF), a widely used ML technique that serves as a baseline for comparison.
The objective of this study is to present an alternative method to evaluate ML algorithms. In that sense, we demonstrate the perspective of the returns ML algorithms would generate for the investment done while choosing a particular method for a given problem. Our research contributions are as follows
-
•
Describe an ML process model for ML classification and perform related ROI modeling.
-
•
Empirically evaluate Random Forest and fine-tuned BERT for textual classification in the context of requirement dependency classification (RDC) using accuracy and ROI.
The remainder of the paper is structured as follows: Section 2 provides a motivating example of this study, followed by the description of related work in Section 3. Section 4 explains requirement dependency, its extraction, practical relevance, and research questions. Section 5 elaborates our ROI modeling of the ML process. Data used in this study are detailed in Section 6 followed by empirical results in Section 7. The discussion Section 8 details implications and limitations of this study before summarizing conclusions in Section 9.
2 Motivating Example
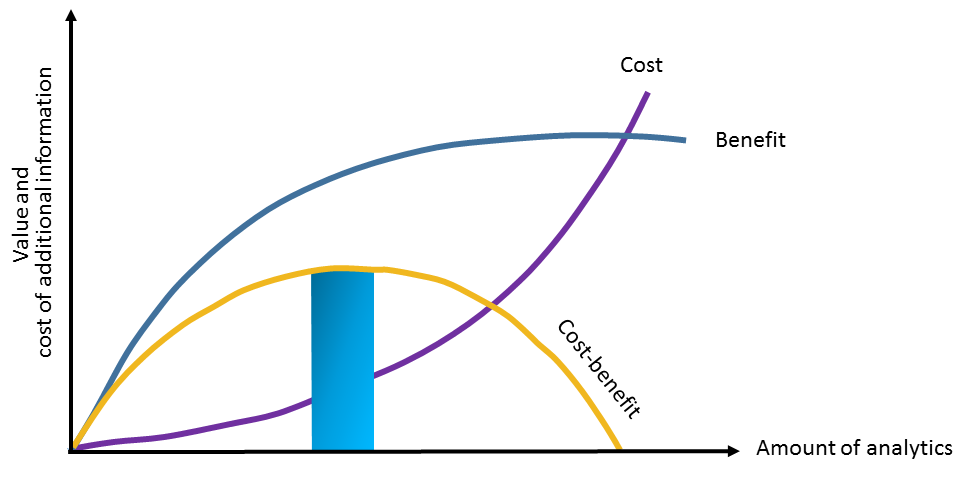
Figure 1 shows a prototypical ROI curve for technology investment ruhe2020optimization . When trying to achieve better results, the investment’s cost (or effort) is growing over time, typically non-linearly. However, the benefit achieved from that investment eventually reaches some saturation point beyond which almost no further improvement is achieved. In total, a saturation point is achieved, after which further investment does not pay off anymore (i.e., point of diminishing returns).
Thus, the most crucial question arises-Do similar arguments apply for ML classification in Software Engineering? While this could be true in general, we study it in the context of the requirements dependency classification problem.
Deshpande et al. deshpande_ruhe report the results of a recent survey for requirements dependency classification and maintenance, with 76% of responses (out of 70) from practitioners. More than 80% of the participants agreed or strongly agreed that dependency type classification is difficult in practice; dependency information has implications for maintenance, and ignoring dependencies has a significant impact on project success deshpande_ruhe .
Applying the advanced NLP technique BERT, we performed an ROI analysis on the requirements dependency classification. Automating this process saves time, and making the classification more effective helps better align the development process with the existing dependencies. For example, if a requirement r depends on another requirement s, then the implementation of s should precede implementing r. Violating this logical dependency will not only delay the usage of r but also decrease the effectiveness of testing.
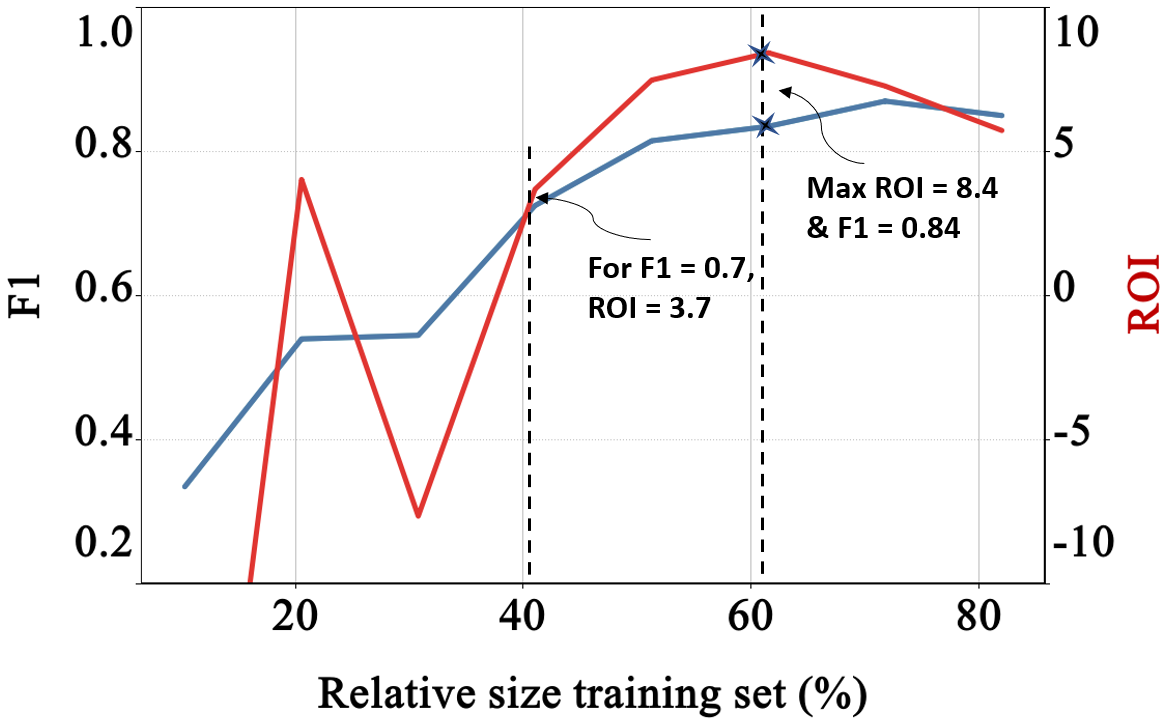
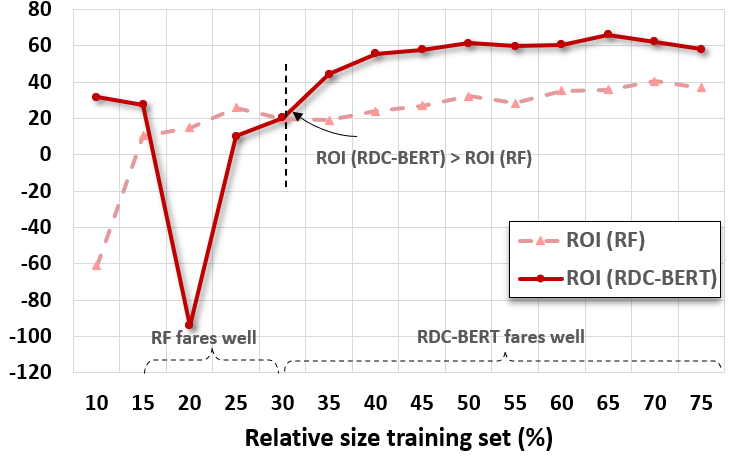
Figure 2 shows that there is an early peak in the ROI of using BERT. Since it is a very data-intensive technique, the ROI goes down with increasing training set size before the ROI reaches the global maximum. By comparison, considering only the harmonic mean (F1) of precision and recall gives a different recommendation for training set size. We discuss this in detail in Section 5.
3 Related Work
Although ROI is used in various contexts in Software Engineering and Data analytics, we discuss noted findings from the literature in the context of our proposed research.
3.1 Exploration of ROI in Software Engineering
Farbey et al. farbey_evaluation_nodate explained that as a product moves through its life cycle, various evaluation methods such as ROI, Multi-Objective multi-criteria, Value analysis etc. play an important role in decision making. In this study, ROI was recommended either as a strategy to decrease uncertainty in the business area or to improve knowledge of how technology would operate.
Khoshgoftaar et al. khoshgoftaar_cost-benefit_2001 presented an interesting case study of a large telecommunication software system and demonstrated a methodology for cost-benefit analysis of a software quality classification model. The cost and benefit computations were based on the type-I (FP) and type-II (FN) values of classification models. Although these cost-benefit models were ahead of their time, they did not consider the time and effort investment done on data and metrics gathering for cost computation. In another study on calculating ROI in the software product line, Bockle et al. bockle_calculating_2004 derived cost and benefit estimates based on organization level criteria, such as cost to the organization and cost of reuse. However, this did not involve data analytics of any form.
The guesswork could be eliminated from the decision-making process while evaluating the profitability of expenditure, which could help measure success over time. For instance, Erdogmus et al. erdogmus2004return analyzed the ROI of quality investment to bring its value into perspective; posed an important question, "We generally want to increase a software product’s quality because fixing existing software takes valuable time away from developing new software. But how much investment in software quality is desirable? When should we invest, and where?", which we think is difficult to quantify yet crucial for the success of software-based products.
Begel & Zimmermann begel2014analyze gathered and listed a set of 145 questions in a survey of 200 Microsoft developers and testers and termed them relevant for DA at Microsoft. One of the questions: "How important is it to have a software DA team answer this question?", expected answer on a five-point scale (Essential to I don’t understand). Although this analysis provides a sneak peek of the development and testing environments of Microsoft, it does not provide emphasis on any form of ROI. Essentially, we speculate that the ROI aspect was softened into asking for the perceived subjective importance through this question.
Boehm et al. boehm2008roi boehm_roi_2004 presented quantitative results on the ROI of Systems Engineering based on the analysis of the 161 software projects in the COCOMO II database. Ruhe and Nayebi ruhe2016counts proposed the Analytics Design Sheet as a means to sketch the skeleton of the main components of the DA process. The four-quadrant template provides direction to brainstorm candidate DA methods and techniques in response to the problem statement and the available data. In its nature, the sheet is qualitative, while ROI analysis goes further and adds a quantitative perspective for outlining DA.
Ling et al. ling2005predicting proposed a system to predict the escalation risk of current defect reports for maximum return on investment (ROI), based on mining historic defect report data from an online repository. ROI was computed by estimating the cost of not correcting an escalated defect (false negative) to be seven times the cost of correcting a non-escalated defect (false positive).
3.2 Exploration of ROI in Data Analytics
Ferrari et al. ferrari2005roi studied the ROI for text mining and showed that it not only has a tangible impact in terms of ROI but also intangible benefits, which arise from the investment in the knowledge management solution. This solution translates the returns directly that must be considered while integrating the financial perspective of analysis with the non-financial ones.
Weiss et al. weiss2008maximizing emphasized how the quality of external data influence the results and quantified the effort of gathering and using such data when it is available at a premium into cost in terms of CPU time, even though the treatment of the subject is limited to a static setting. In a similar vein, Nagrecha et al. nagrecha2016quantifying proposed a Net Present Value model to determine the cost and impact of analytics programs for an organization.
Taking inspiration from these studies in our research, we not only consider data pre-processing costs as an additional cost aspect but also transform machine learning metrics to dollar amounts, with derived costs and benefits being also validated by industry experts.
3.3 Empirical Analysis for Requirements Dependency Classification
Requirements dependencies classification is an active field of SE research. The practical importance of the topic was confirmed by a survey deshpande_ruhe of over 90 participants from the SE industry. Results showed that more than 80% of the participants agreed or strongly agreed that (i) dependency type extraction is difficult in practice, (ii) dependency information has implications on maintenance, and (iii) ignoring dependencies has a significant negative impact on project success.
Several empirical studies have explored diverse computational methods that used natural language processing (NLP) och2002feasibility atas2018automated , semi-supervised technique deshpande_arora_ruhe_2019 , hybrid techniques deshpande_ruhe_2020 and deep learning guo2017semantically in this context. Recently, Wang et al. 9222252 explored a semi-automatic ML approach based on traceability to identify requirement dependencies to further identify security vulnerabilities. However, none of the approaches considered ROI to decide among techniques and the depth and breadth of their execution level.
3.4 Exploration of Machine Learning process in Software Engineering
We analyzed 96 papers from IEEE, Scopus, ScienceDirect, and ACM Digital Library which exclusively used ML, and data analytics within software engineering, and software development domains. Precision, Recall, Accuracy, and AUC were by far the most common performance measures used by researchers in these papers. Additionally, the choice of performance measure was generally not justified. Most studies did not present all steps of the ML process, and most of the papers formally present only 3 steps of the ML process such as data pre-processing, evaluation, and parameter tuning and all these steps are underestimated in terms of effort spent.
This study highlights the merits of simultaneously considering technical and business criteria when evaluating tradeoffs faced within machine learning approaches for requirements dependency classification (RDC). We extend prior work that focused on comparing various ML techniques based upon technical criteria of accuracy to include broader consideration of the impact i.e. Evaluating value generated by the analysis compared to the costs incurred for the analysis.
4 Requirements Dependency Classification
Similar to requirements elicitation lim2021data , extraction of requirements dependencies is a cognitively difficult problem. These dependencies not only influence the development of software but also impact how requirements operate. In this section, we provide the formal problem definition which serves as an example to demonstrate the value of looking beyond accuracy measure and investing in more general concepts of ROI analysis.
4.1 Practical Relevance
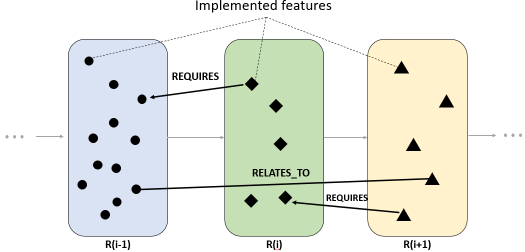
Figure 3 is an illustration of the practical relevance of considering requirements dependencies for incremental and iterative software development. Having multiple release cycles: defines the order of implementing and testing new or updated features. However, if a requirement is implemented in a release but requires a requirement implemented in a later release, then the requirement will not be usable. Similar arguments hold for two requirements that are related to each other but are implemented in different releases. Thus, identifying the dependencies early on is crucial as it drives the implementation as well as testing and rework efforts immensely.
4.2 Problem Formulation
While there are different types of dependencies between requirements Zhang14 , Carlshamre we provide the definitions just for the ones used in the empirical study . For a set of requirements and a pair of requirements
-
1)
Two requirements r, s are called INDEPENDENT if handling one of them has no logical or practical implication for handling the other one. Otherwise, they are called DEPENDENT.
-
2)
REQUIRES is a form of DEPENDENT relationship. If requirement requires the requirement to be implemented, then, and are in a REQUIRES relationship. REQUIRES is an asymmetric relationship.
-
3)
RELATES_TO is another specific form of DEPENDENT relationship. Requirement relates_to requirement if changing one of them has an impact on the other. RELATES_TO is a symmetric relationship111There are other types of dependencies such as DUPLICATES, BLOCKS etc. that also occur in the these datasets, however, we have considered the ones that occur most frequently.
Problem: Binary Requirements Dependency Classification (RDC)
For a given set of requirements and their textual description, the binary Requirements Dependency Classification problem (RDC) is to decide for a given pair (r,s) if (r,s) is in a REQUIRES (called problem RDC_1) or in a RELATES_TO (called problem RDC_2) relationship.
4.3 Research Questions
In this paper, two research questions (RQs) are addressed:
-
RQ1: How to model the ROI for ML classification? Specifically, how to instantiate the model for the problem of RDC?
Rational: The exclusive consideration of accuracy in the selection of ML classification techniques might be misleading. We consider ROI as an alternative and additional criterion. To study the cost and benefit of the ML classification in a specific context, it is essential to consider the complete process of ML classification and the impact of the results in the original problem space. -
RQ2: For RDC, how is the preference decision between RDC-BERT and RF impacted by the accuracy criteria F1 that includes ROI?
Rational: We evaluate the impact of the selection criteria through two empirical studies on two open-source software (OSS) datasets: Firefox, a software application from Mozilla family mozillawiki and Typo3 typo3 , a content management software. Our goal is to evaluate two extraction techniques (RDC-BERT and RF) to demonstrate the impact of the consideration of ROI in addition to accuracy considerations.
5 ROI Modeling of ML Classification - RQ1
Machine Learning classification is an iterative process comprising a series of steps. Aiming at ROI analysis of ML classification requires a look at the effort consumed for all these steps. In what follows, we describe various ML process steps, we estimate cost and benefit, and project the ROI of ML classification.
Although various ML workflow has been defined in the literature fayyad1996kdd amershi2019software mlworkflow , in this section, we present the simplified version of it mainly focusing on the ML process.
5.1 Modeling the Process
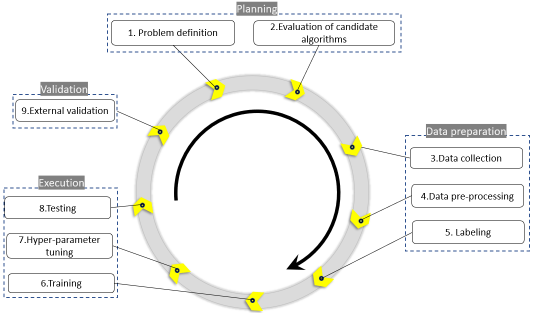
The process steps are organized into four Phases: A, B, C, and D called Planning, Data Preparation, Execution, and Validation, respectively. Depending on the context, the effort allocated for these steps may vary. However, this approach parallels the process steps and guidelines for pragmatic optimization in software engineering by Ruhe et al. ruhe2020optimization .
An overview of the steps is illustrated in Figure 4. Here, we did
not show all the possible arrows to indicate that loops
can, and do, occur between any two steps in the
process. The iterative and interactive ML process, involving various phases is summarized as:
Phase A : Planning
-
Step 1: Scoping and problem formulation
Scoping defines the problem context and its boundaries. Problem formulation addresses the key independent and dependent attributes to be considered. As a result of later steps, the problem formulation eventually needs to be adjusted as asking the right question constitutes the largest effort for any application effort. -
Step 2: Evaluation of candidate machine learners
A variety of ML algorithms exist and new ones are discovered regularly. Commonly used machine learning algorithms include Linear Regression, Logistic Regression, Decision Trees, K-means, Support Vector Machines, Naïve Bayes, Random Forest, and Neural Networks. There is no obvious preference in the sense that "One size fits all". However, there could be recommendations for a particular ML algorithm for a given problem based on its exemplary performance for a similar problem(s). An initial evaluation helps to select the most promising one(s). The selection is influenced by the success criterion of the classification (e.g., accuracy).
Phase B: Data Preparation
-
Step 3: Data collection
Different sources of data might exist for performing ML classification. Data collection looks into what is potentially relevant and checks the type and availability of the data. -
Step 4: Data pre-processing
Raw data would not be ready for processing through the ML algorithm as it could have duplicates, missing values, and contradictions that need to be tackled first for error-free results. Performing such pre-processing operations, for example, data cleaning, normalization, transformation, feature extraction and selection, etc. are essential for the success of ML classification, but these steps consume a considerable amount of human resources and processing time. The outcome of data pre-processing is the training set which could be processed through ML algorithm further kotsiantis2006data . -
Step 5: Labeling
Labeling is to assign labels to ground truth data amershi2019software . Supervised ML methods need labeled data unlike unsupervised ML methods. Labeling is generally performed by domain experts who identify a set of samples (that are most likely representative of the real-world data) to train the ML models. Depending on the nature of the problem, online crowdsourced platforms could also be used for labeling tasks nayebi2017MAPFEAT .
Phase C: Execution
-
Step 6: Training
The key idea of ML is to learn from existing data and then apply the resulting model to new data. The quality and quantity of the training data are often as important as the actual machine learning algorithm. To learn from existing data also means that the data set is complete, with known input and output of the observations. -
Step 7: Hyper-parameter tuning
ML algorithms depend upon several parameters such as named model parameters and named hyper-parameters. Named model parameters can be initialized and updated through the data learning process (e.g., the weights of neurons in neural networks). Named hyper-parameters cannot be directly estimated from data learning and should be set before training an ML model because they define the model architecture. Tuning these parameters means achieving settings that enable good algorithmic performance kuhn2013applied . -
Step 8: Testing
After training, the model is applied to the selected test set(s) (a small part of labeled data that is held out and excluded from the training process). The larger the number of variables in the real world, the bigger the training and test data should be. From performing testing, classification error counts are captured in the form of a confusion matrix.
Phase D: Validation
-
Step 9: External validation
Success from Step 8 does not automatically imply the success of the results in the context of the application. The validity of the problem formulation and the data might prevent the applicability of the results (i.e., not actionable within the organization resulting in significant wasted effort).Internal validation approaches such as cross-validation can not guarantee the quality of a machine learning model due to potentially biased training data. External validation is critical for evaluating the generalization ability of the machine learning model, where independently derived datasets (external) are leveraged as validation datasets. While such independent validation is also sometimes used to refer to a validation study by other researchers that the researchers who developed the model ho2020extensions .
5.2 Modeling Cost and Benefit
Acknowledging that ML classification is a process of steps with possibly multiple iterations suggests the need to look at the estimated cost for all these steps. Cost estimation is known to be inherently difficult in software engineering shepperd2014cost . The same is true for value prediction. Despite many factors influencing the costs and benefits of ML classifications, we provide a preliminary model to allow a rough estimate of the ROI.
For cost estimation, we make the assumption that the total cost of performing ML classification with any given ML technique is the sum of cost components of the four phases outlined in the previous section. To simplify the model, we focus on Phase B (Data Preparation) and Phase C (Execution) and ignore the other two phases. Finally, we assume an 80:20 effort (and cost) ratio between Phase B and Phase C, emphasizing the fact that the majority of effort is spent on data preparation.
For modeling the benefit of the classification results, we are looking at classification errors and their cost (penalty) created. A confusion matrix CM is a matrix that contains information relating actual with predicted classifications. For n classes, CM will be an matrix associated with a classifier. Table 1 shows the principal entries of CM for binary classification.
| Predicted Negative | Predicted Positive | |
|---|---|---|
| Actual Negative | True Negative (TN) | False Positive (FP) |
| Actual Positive | False Negative (FN) | True Positive (TP) |
| Symbol | Meaning | Unit | ||
| Cost factors1 | Phase A | 2 | Planning phase cost | $ |
| Phase B | Data gathering cost | $ | ||
| Pre-processing cost | $ | |||
| Phase C | Labeling cost | $ | ||
| 2 | Hyper-parameter tuning cost | $ | ||
| Training and testing cost | $ | |||
| Phase D | 2 | External Validation cost | $ | |
| Classification Penalty | Penalty per FP | $ | ||
| Penalty per FN | $ | |||
| Others | #Human resources | Number | ||
| Human Resource cost | $/hr | |||
| Size of the training set | Number | |||
| Size of the test set | Number | |||
| + | Number | |||
| 3 | Estimated value of the product for a release cycle | $ | ||
1These are per sample cost factors. All the costs are computed by translating them from minutes to $ by multiplying with resources and cost per hour of the resources
2For simplicity few of the cost factors have been assumed to be zero
3This value was computed using various cost estimates for a period of one release cycle (= 18 months)
The F1 score is a measure of the model’s accuracy based on the training set and defined as the harmonic mean of the model’s precision and recall in (1).
| (1) |
In the context of dependency classification, the benefit could be modeled in terms of the ability of the ML model to produce the least amount of overhead by 1) Incorrectly classifying independency as a dependency (False Positive) 2) Incorrectly classifying dependency as independent (False Negative). So, using and as estimated re-work costs due to classification overhead, would be the cumulative expense that a company has to bear.
In a release cycle, if estimated value that a product could generate is : then the would be the difference of the estimated value and the classification overhead. Table 2 lists the relevant cost components and their corresponding units.
5.3 Modeling ROI
During every classification, and were computed using the parameters explained in Table 2. Cost factors are data processing costs (Phase B and Phase C) for all the train () and test () samples () in every iteration. This is further translated into dollar-cost by multiplying with hourly charges () of human resources.
| (2) |
computations for RDA, assumes reward () for misidentifying the independent requirements (FP) and heavily penalizing () instances that were falsely identified as independent (FN).
| (3) |
| (4) |
Return and investment are context-specific terms, and studying the ROI of Machine Learning classification needs tailoring to the context of the study. To determine the ROI, we follow the simplest form of its calculation relating to the difference between and to the amount of as shown in (5). Both and are measured as human effort in person-hours.
| (5) |
The core investigative focus of our study is to evaluate various conditions under which RDC-BERT (fine-tuned BERT using data specific to requirement dependency extraction) is preferable to the baseline ML method: Random Forrest (RF).
In this empirical analysis, beginning with a small train set, classifiers were created, and then the train set was incremented slowly by a fixed factor to generate new classifiers in every iteration until all the data available for training was exhausted. In every iteration, the classifiers were tested for a small fixed data set to capture the results.
6 Data and Experiment Setup
Online bug tracking systems such as Bugzilla bugzilla and Redmine redmine are widely used in open-source software development. Feature requests, tasks, bugs, epics, stories, features, enhancements, and new requirements are logged into these systems in the form issue reports shi2017understanding bhowmik2015resolution which help software developers to track them for effective implementation shin2015guidelines , testing and release planning ruhe2005art .
We mined data from Bugzilla and Redmine related to features for the two OSS projects namely, Firefox - a Mozilla web browser application and Typo3 - a content management system.
| Dependency type | ID | Description | ID | Description |
|---|---|---|---|---|
| REQUIRES | 1432952 | add ability to associate saved billing address with payment card in add/edit card form | 1429180 | option to use new billing address when adding new payment card |
| 1394451 | update illustration for error connection failure | 1358293 | ux error connection failure copy design and illustration update | |
| 1524948 | introduce session group to allow to manage multiple session at same time | 1298912 | multiple snapshot perform periodic session backup and let user restore particular backup | |
| RELATES_TO | 92822 | ignore button for link targets | 92297 | make it possible to mark specific links to not get checked by linkvalidator |
| 92576 | page tree filter: make it possible to explicitly filter by uid | 36075 | advanced filtering for the page-tree | |
| 91496 | differentiate between password reset "by user" and "by admin" | 89513 | provide password recovery for backend users |
6.1 Firefox
In Bugzilla, feature requests are specific types of issues that are typically tagged as “enhancement” mozillawiki . We retrieved these feature requests for the Firefox project using the search engine in the Bugzilla issue tracking system and exported all the related fields such as Title, Type, Priority, Product, Depends_on, and Blocks. Each issue report contains dependency relationships with other issue reports as references metadata kim2019weighted . Using this information, 3,773 depends_on (also interpreted as REQUIRES dependency type) requirements pairs were retrieved. To generate negative samples, requirements that had no relationship were paired and 21,358 samples were generated.
6.2 Typo3
Redmine redmine is a free and open-source web-based management and issue tracking tool website. It allows users to manage multiple projects and associated projects. Various issues across a range of projects are updated each day which helps software developers to track them for effective implementation. In Redmine, features are a specific type of issue that is extracted in this paper for further data analysis. Typo3 Content Management System (CMS) is an Open Source Enterprise Content Management Systemtypo3 with a large global community of approximately 900 members of the TYPO3 Association. We collected information such as issue_links, description, the version found, the version released, issue_id etc. for 5,017 features using Redmine’s REST API through a Python script for this study.
All feature descriptions that had fewer than three words in them were filtered out, resulting in 1,324 feature pairs with dependency type RELATES_TO. Using the rest of the features that were not in any type of dependency with others, 9,270 pairs were generated as a negative sample set.
Table 3 mentions sample pairs of requirements dependencies. For example, to be able to associate the address with payment card REQUIRES ability to use a new billing address when adding a new payment card. For both data sets, to perform binary classification, both positive and negative samples are needed for training. Since we only had dependent (positive) samples in the data, we generated negative samples by pairing the requirements which were not related in the given snapshot of the dataset.
6.3 Effort and Value Estimation
Typo3, currently at released version 11, is a complex content management system that is developed as a hybrid OSS software product. It has a core team of 12 members with varying skills and expertise. They have a major release cycle of 18 months and they plan two or more releases ahead of time. Developers are encouraged to track the dependencies in Jira, however, a few of the team members utilize post-its to work and track them. Typo3 does not explicitly consider Requirements Engineering as a development phase, but they term the efforts towards identifying features and extracting dependencies as conceptual work or scoping. Over 15% of the release, the cycle is identified as scoping effort and about 25% of scoping in a release cycle is identified as dependency extraction and identification. Nine team members and the CTO are involved, mostly in identifying the dependencies.
The CEO confirmed that about 80 % of the features are in some form of dependency with each other and missing the dependencies is more problematic than misidentifying them. As he puts this in words, “if you miss dependencies then it starts to ramp up quickly and this is when things go wrong, and breaks deadlines. we wanted to release in April (4 weeks ago) now deadline is mid October”.
Typo3 identifies and manages seven different types of dependencies and their inversions such as precedes, blocks, clones, caused_by etc. Most of the dependency issues are identified rigorously through testing and the estimated re-work is about 12%. They have minimal manual testing as they have test suits of over 75,000 test cases. The CEO estimated that the overwork caused by missing dependencies is about 10% of the efforts. The average salary of the nine people involved in re-work is $70 (CAD). A summary of all estimates is provided in Table 5.
6.4 Experiment Setup
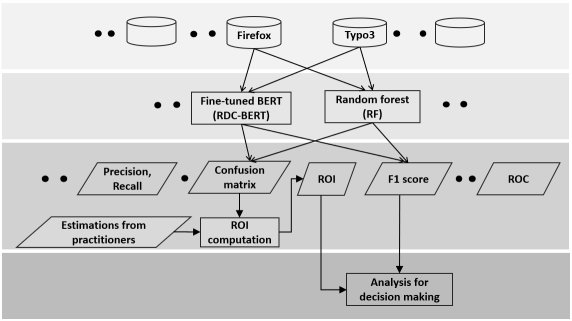
Figure 5 depicts the overview of our experiment setup. The complete approach is multi layered as highlighted in the shades. Each one of these could be further expanded to include additional elements for solution space evaluation further.
In this study, to generate the results, RF, Naive Bayes and SVM ML algorithms were compared against RDC-BERT for the two datasets: Firefox and Typo3. Overall eight experiments were conducted. Since RF performed better among all the conventional ML algorithms Deshpande_Ruhe_ROI , we report the results of RF and RDC-BERT (i.e. totally four experiments).
For each experiment, we computed ROI using False Negative and False Positive values (from Confusion matrix). In Section 7 we present the insights to aid decision-making in algorithm selection based on these eight outcomes. For additional clarity, we list the names of the analysis of the results and their description in Table 4.
| Description | |||
|---|---|---|---|
| Fig 7 | F1_Firefox | Firefox: Compare F1 of RF and RDC-BERT | RQ 2.1 |
| Fig 7 | F1_Typo3 | Typo3: Compare F1 of RF and RDC-BERT | RQ 2.1 |
| Fig 9 | ROI_Firefox | Firefox: Compare ROI of RF and RDC-BERT | RQ 2.1 |
| Fig 9 | ROI_Typo3 | Typo3: Compare ROI of RF and RDC-BERT | RQ 2.1 |
| Fig 11 | F1_ROI_RDC-BERT_Firefox | Firefox: F1 vs ROI of RDC-BERT | RQ 2.2 |
| Fig 11 | F1_ROI_RF_Firefox | Firefox: F1 vs ROI of RF | RQ 2.2 |
| Fig 13 | F1_ROI_RDC-BERT_Typo3 | Typo3: F1 vs ROI of RDC-BERT | RQ 2.2 |
| Fig 13 | F1_ROI_RF_Typo3 | Typo3: F1 vs ROI of RF | RQ 2.2 |
Requirements pairs were pre-processed to eliminate noise such as spatial characters and numbers. The generated output is fed to RDC-BERT and RF for training. Care was taken to process the same data snapshot through RF and RDC-BERT models. Further, the fine-tuned BERT model (RDC-BERT) is then used for classification. The data was split (80:20) into train and test sets, and balanced between both classes.
In this empirical analysis, we conducted classification by utilizing a fraction of the whole dataset for training and testing for a small fixed data set. This was repeated by slowly increasing the training set and results were captured.
Random Forest: For RF, we use TF-IDF to generate word vectors before training. Also, hyper-parameter tuning was performed and the results for 10-fold cross-validation were computed, followed by testing.
RDC-BERT: For fine-tuning BERT, a pre-trained BERT model is used in combination with our RDC specific dataset. The result is a fine-tuning BERT model called RDC-BERT. To fine-tune the BERT model, we used NextSentencePrediction222https://huggingface.co/transformers/model_doc/bert.html#bertfornextsentenceprediction, a sentence pair classification pre-trained BERT model, and further fine-tuned it for the RDA specific dataset on Tesla K80 GPU on Google Colab333https://colab.research.google.com/.
In every instance, for a given training set size, RDC-BERT was trained through three epochs with a batch size of 32, and a learning rate of 2e-5. In each epoch, the train set was divided into 90% for training and 10%for validation. Finally, RDC-BERT was used to classify the test set and the resulting F1-score and confusion matrix were captured.
BERT eliminates the need for feature extraction since it is a language model based on deep learning. BERT, pre-trained on a large text corpus, can be fine-tuned on specific tasks by providing only a small amount of domain-specific data.
7 Empirical Analysis - RQ2
In this section, we report the results of our empirical analysis and answer RQ2. We structure results by the type of decisions to be made: (i) RQ 2.1: When comparing two techniques: Which one is preferable under conditions selected?, and (ii) RQ 2.2: When looking at one technique, when to stop the analysis? For both decisions, we present the results of the analysis for the two data sets introduced above and the two techniques under investigation using estimates from Table 5.
[t] Parameters Values Phase B: ()1 1.5 min/sample Phase C: 0.30 min/sample $70/hr 10 Firefox:7,546 Typo3: 2,648 $25,000 $10,000 $4,000,000
1 and are weighed equally (= 0.5min/sample) each. Also ratio of Phase B:Phase C = 80:20 has been considered
7.1 RQ 2.1: Comparison between RDC-BERT and RF
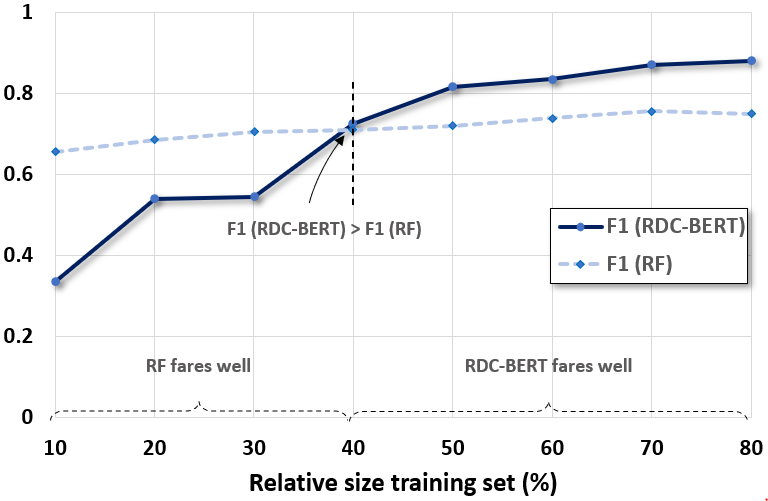
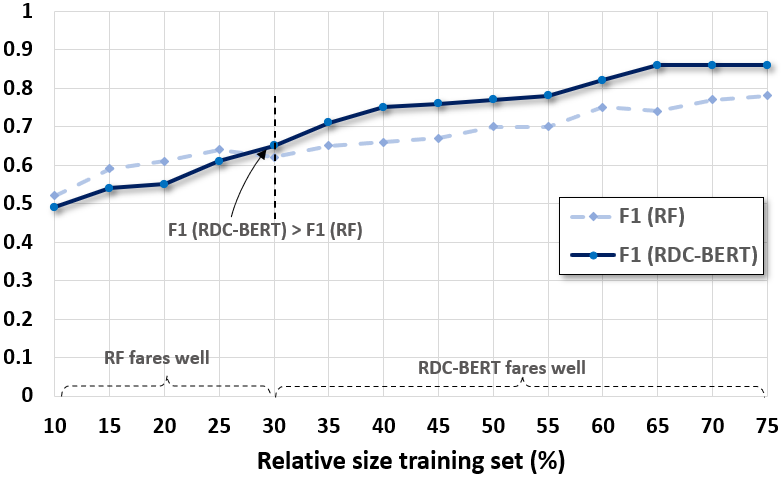
The traditional approach for comparing techniques is to look at just accuracy for some fixed training set. Figures 7 (F1_Firefox) and 7 (F1_Typo3) show the comparison of the F1-scores for varying training set sizes for the two datasets. Results show that RF achieves a higher accuracy more quickly for even small-sized train sets respectively. However, with a training set greater than 40% of the dataset for Firefox and 30% for Typo3, RDC-BERT achieves better results overall.
Comparison of ROI for the two datasets and two methods (RDC-BERT and RF) is shown in Figures 9 (ROI_Firefox) and 9 (ROI_Typo3) respectively.
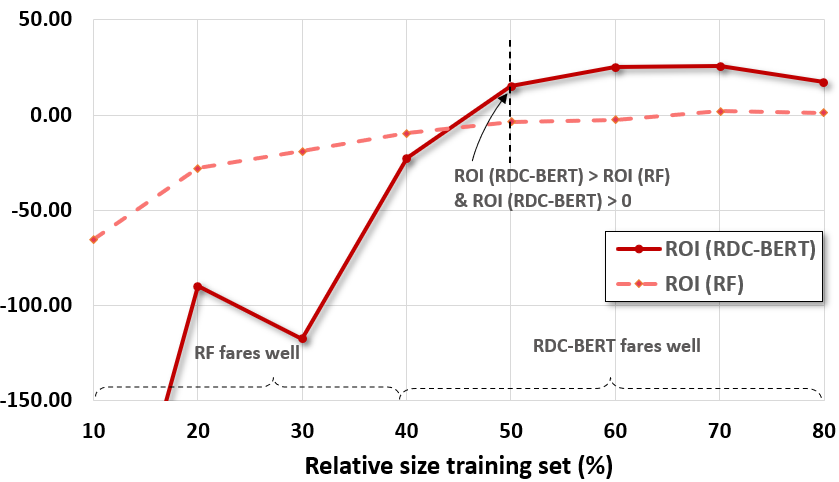
For Firefox, with a smaller-sized train set, RF once again performs better comparatively, even though the ROI is negative. Similar results are evident for Typo3. RF performs marginally better ROI-wise for the smaller training set. ROI of RDC-BERT picks up pace only beyond 40% and 30% train set for Firefox and Typo3, respectively.
7.2 RQ 2.2: Bi-criterion analysis of RDC-BERT and RF
In the second part of the analysis for RQ2, we look at one technique at a time from the perspective of both F1-score and ROI. This will support decision-making towards the question of when does increase accuracy no longer pays off?
As illustrated in figures 7 and 7, increased training set does not yield better F1-score beyond 65%. The F1-score hits a plateau and even starts to degrade for both of the methods and datasets.
However, if we look at the trade-off between the F1 and ROI for both datasets, the results become interesting. Figures 11: F1_ROI_RDC-BERT_Firefox show that for RDC-BERT, F1-score increases linearly, however, max ROI is achieved when the train set is 70% of the dataset. Whereas, for RF, in Figure 11 : F1_ROI_RF_Firefox shows that F1 and ROI for the train set lower than 40% is better than that of RDC-BERT. Chasing for a higher F1 score does not payoff and one needs to take a closer look at the benefits vs investment in more training data, eventually.
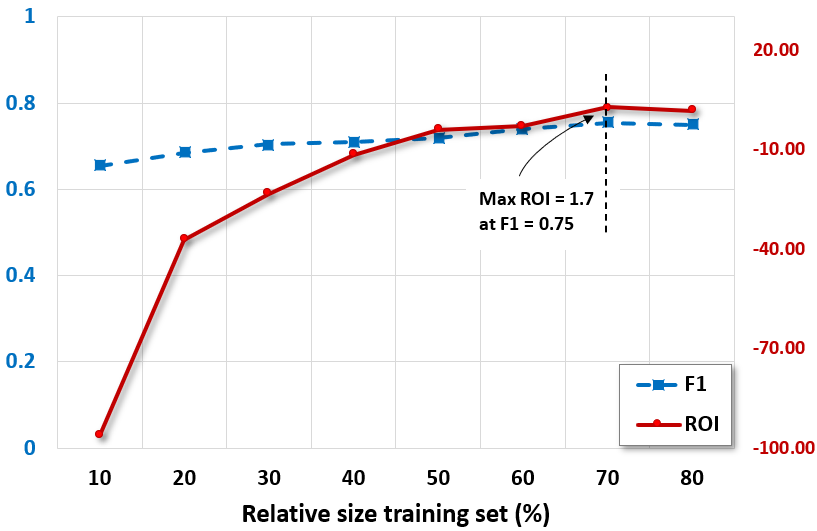
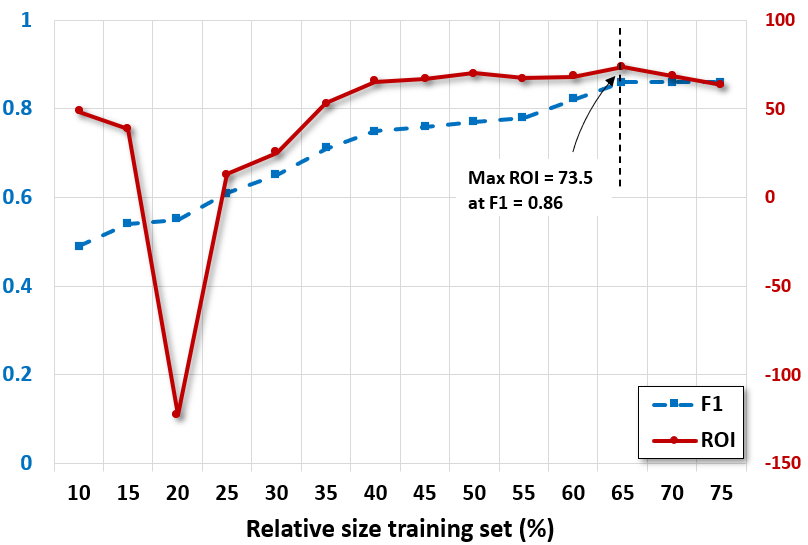
For Typo3, in Figure 13: F1_ROI_RDC-BERT_Typo3 shows that F1-score and ROI grow steeply for RDC-BERT with the increasing train set. However, similar to Firefox, ROI and F1 of RF are stable and better than RDC-BERT for the train set smaller than 30%. These findings once again emphasize the need to relook at how F1 and ROI together could aid in deciding on the ML selection.
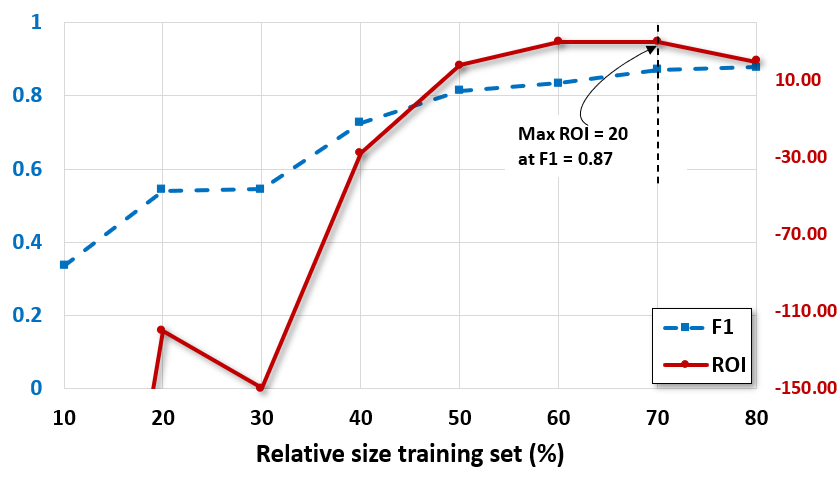
In both datasets studies, it is evident that RDC-BERT models require large amounts of data (at least 30% or more) to stabilize and show value (steady positive ROI). When comparing RDC-BERT with RF using ROI criteria (Fig 8 and 9) across the two data sets, RF outperforms RDC-BERT for the lower train set (incurring lower negative returns). However, positive ROIs are observed only at the larger train set at which RDC-BERT is consistently better than RF. Based upon the Firefox findings (Fig 10 and 11), RDC-BERT approaches the 80% benchmark accuracy with approximately 50% of the training data while RF requires 70% training data to attain the same level of accuracy. However, both techniques can achieve positive ROI with as little 50% training data but RBC-BERT achieves maximum ROI (30) with an accuracy of 0.87 with approximately 70% training data, while RF achieves maximum ROI (2.2) with an accuracy of 0.75 with approximately 70% training data.
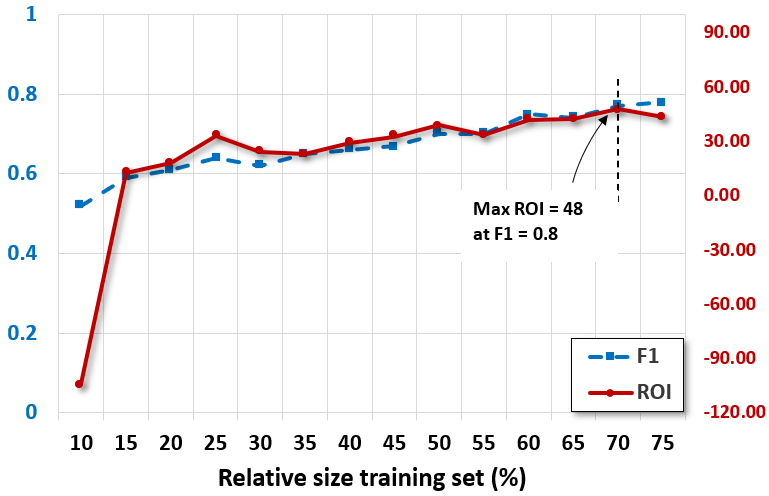
Based upon the Typo3 findings (Fig 12 and 13), RDC-BERT approaches the 80% benchmark accuracy with approximately 55% of the training data while RF requires 70% training data to reach the same level of accuracy. However, both RBC-BERT and RF can achieve positive ROI with as little 15% training data, but RBC-BERT achieves maximum ROI (73.5) with an accuracy of 0.86 with approximately 65% training data, while RF achieves maximum ROI (48) with an accuracy of 0.80 with approximately 70% training data. Thus, RBC-BERT can deliver much higher ROI and similar levels of accuracy than RF given approximately the same amount of training data.
Finally, the parameter settings that seeded the initial model (Table 5) were based upon industry estimates, which were possible were verified by senior management in the respective firms. However, some of the findings may be sensitive to these initial conditions. Thus, these would need to be set for the specific context upon which the data sets are based. This is also the basis upon which scenario analysis could be conducted to evaluate the worst case, best case and most likely initial conditions to evaluate the impacts on subsequent decisions.
8 Discussion
8.1 Implications
ML is not simply a cost of doing business, rather it is a foundational activity that can provide value for the money invested. Our proposed approach aligns this notion with the strategic direction of the organization. While return on investment (ROI) is a common approach used for business planning and decision making, it is not applied as widely within software engineering or specifically within applied ML.
In our study, we demonstrate how to instantiate ROI in the context of RDC. Our approach provides a pragmatic link between the business and technical aspects of the organization by providing a common language that incorporates both the technical aspects inherent in the evaluation of accuracy, with the business considerations of costs and benefits. We argue that this is an extremely powerful approach that provides evidence that is compelling and consistent for both technical and business decision-making.
In addition, we think that the ROI approach could sensitize the ML team to the entire process of ML classification and how that process fits into organizational processes. The ROI approach is essential for evaluating the possible tradeoffs between accuracy and the benefits. Mainly because without consideration of the key dependencies within the process, benefits in one part of the process (e.g., improved accuracy) can easily be undermined by excessive costs in another part of the process that would not typically be considered if focused exclusively on accuracy. Alternatively, lower levels of accuracy in the ML process might be acceptable if other benefits are accruing at reasonable costs. Thus, valuable ML investments are potentially being avoided based upon not meeting accuracy expectations, when those ML solutions could be sufficient to realize high payoffs for the organization.
Our approach increases the transparency of the decision-making process by adding diversity to the evaluation criteria that foreground the various tradeoffs being made. The development of AI tools that businesses and consumers can trust is essential for their continued adoption, especially as there is increasing regulatory scrutiny of the biases that arise in the ML algorithms or inherent in the data used for training.
While ML algorithms are generally trusted for relatively mechanical well-defined problems, this trust plummets when the decisions are subjective, and likely to vary by contextual variables that are not well understood. This in turn increases the pressure to adjust ML algorithms for variations in specific markets further driving up development costs. Such pressure directs the focus on customizing products and services based upon ML algorithms for specific markets while increasing costs further and undermines the benefits for certain markets or customers hbr . The proposed approach considers technical and business aspects simultaneously and provides a more traceable set of interconnected processes. This approach includes business and technical considerations to enable management to evaluate the risks of some undesirable decisions and the tradeoffs needed to realize the likely benefits.
8.2 Limitations
We have explored RF and RDC-BERT in the context of the RDC problem and presented our results. Since there is no single method which could work for any given problem, comparison of multiple approaches and their results remains out of the scope of this study.
Another threat to validity is the related to the conclusions made. Although we have taken care to randomize the data by shuffling and used stratified split to take care of balanced data in both training and validation, multiple runs with varying first iteration data sample are needed to be more confident on the conclusions made. However, we argue that the key observations made are valid from the restricted empirical validation performed.
9 Conclusions and Future Work
ML classification is widely used in many disciplines of Science and Engineering. In this study, we demonstrate that just looking at performance measures such as accuracy could be misleading when, for example, deciding between two ML techniques evaluated for solving the same problem. Conversely, ignoring the cost and benefit of such a classification could cause the risk of unprecedented emphasis on improving accuracy that might not generate any value for the additional efforts spent. Additionally, in this research, we also provide a high-level ML process for classification (supervised machine learning). However, with minuscule changes, this process can be adapted to unsupervised or semi-supervised ML methods easily.
We use Requirements Dependency Classification as a sandbox to build a proof of the concept based on the two ML techniques used to solve RDC. In the future, we will extend the results in various dimensions. The concepts of this paper will be applied and evaluated for problems from other domains. However, the challenge is to project the benefit of achieving better accuracy results and estimating the total effort of data analysis. Also, depending on the problem, we will investigate other ML techniques and additional data sets.
With a broader data and knowledge base, we aim at developing a customized recommendation system that would support practitioners in their decision-making in terms of "How much Data Analytics is Enough".
Acknowledgements.
We would like to thank graduate students Saipreetham Chakka and Aris Aristorenas for their assistance in generating results and conducting literature review for this study.Conflict of interest
The authors declare that they have no conflict of interest.
References
- (1) S. Shafiq, A. Mashkoor, C. Mayr-Dorn, and A. Egyed, “Machine learning for software engineering: A systematic mapping,” arXiv preprint arXiv:2005.13299, 2020.
- (2) I. Figalist, C. Elsner, J. Bosch, and H. H. Olsson, “An end-to-end framework for productive use of machine learning in software analytics and business intelligence solutions,” in International Conference on Product-Focused Software Process Improvement. Springer, 2020, pp. 217–233.
- (3) S. Fernández et al., “Rearm:a reuse-based economic model for software reference architectures,” in Int. Conf on Software Reuse. Springer, 2013, pp. 97–112.
- (4) J. Cleland-Huang, G. Zemont, and W. Lukasik, “A heterogeneous solution for improving the return on investment of requirements traceability,” in Proc. 12th IEEE Requirements Engineering Conference, 2004. IEEE, 2004, pp. 230–239.
- (5) J. Devlin et al., “Bert: Pre-training of deep bidirectional transformers for language understanding,” arXiv preprint arXiv:1810.04805, 2018.
- (6) G. Ruhe, “Optimization in software engineering: A pragmatic approach,” in Contemporary Empirical Methods in Software Engineering. Springer, 2020, pp. 235–261.
- (7) G. Deshpande and G. Ruhe. (2020, Dec) Survey: Elicitation and maintenance of requirements dependencies. [Online]. Available: https://ispma.org/elicitation-and-maintenance-of-requirements-dependencies-a-state-of-the-practice-survey/
- (8) G. Deshpande et al., “Beyond accuracy: Roi-driven data analytics of empirical data,” in Proc. of the 14th ACM / IEEE International Symposium on Empirical Software Engineering and Measurement (ESEM), 2020.
- (9) B. Farbey and A. Finkelstein, “Evaluation in Software Engineering: ROI, but more than ROI,” p. 6.
- (10) T. M. Khoshgoftaar, E. B. Allen, W. D. Jones, and J. P. Hudepohl, “Cost-Benefit Analysis of Software Quality Models,” Software Quality Journal, vol. 9, no. 1, pp. 9–30, Jan. 2001. [Online]. Available: https://doi.org/10.1023/A:1016621219262
- (11) G. Bockle, P. Clements, J. D. McGregor, D. Muthig, and K. Schmid, “Calculating ROI for software product lines,” IEEE Software, vol. 21, no. 3, pp. 23–31, May 2004, conference Name: IEEE Software.
- (12) H. Erdogmus, J. Favaro, and W. Strigel, “Return on investment,” IEEE Software, vol. 21, no. 3, pp. 18–22, 2004.
- (13) A. Begel and T. Zimmermann, “Analyze this! 145 questions for data scientists in software engineering,” in ICSE, 2014, pp. 12–23.
- (14) B. Boehm et al., “The roi of systems engineering: Some quantitative results for software-intensive systems,” Systems Engineering, vol. 11, no. 3, pp. 221–234, 2008.
- (15) B. Boehm, L. Huang, A. Jain, and R. Madachy, “The ROI of software dependability: The iDAVE model,” IEEE Software, vol. 21, no. 3, pp. 54–61, May 2004, conference Name: IEEE Software.
- (16) G. Ruhe and M. Nayebi, “What counts is decisions, not numbers — toward an analytics design sheet,” in Perspectives on Data Science for SE. Elsevier, 2016, pp. 111–114.
- (17) C. X. Ling, S. Sheng, T. Bruckhaus, and N. H. Madhavji, “Predicting software escalations with maximum roi,” in Fifth IEEE International Conference on Data Mining (ICDM’05). IEEE, 2005, pp. 4–pp.
- (18) M. Ferrari et al., “Roi in text mining projects,” WIT Transactions on State-of-the-art in Science and Engineering, vol. 17, 2005.
- (19) G. M. Weiss and Y. Tian, “Maximizing classifier utility when there are data acquisition and modeling costs,” Data Mining and Knowledge Discovery, vol. 17, no. 2, pp. 253–282, 2008.
- (20) S. Nagrecha and N. V. Chawla, “Quantifying decision making for data science: from data acquisition to modeling,” EPJ Data Science, vol. 5, no. 1, p. 27, 2016.
- (21) J. Dag et al., “A feasibility study of automated natural language requirements analysis in market-driven development,” RE, vol. 7, no. 1, pp. 20–33, 2002.
- (22) R. Samer, M. Stettinger, M. Atas, A. Felfernig, G. Ruhe, and G. Deshpande, “New approaches to the identification of dependencies between requirements,” in 31st Conference on Tools with Artificial Intelligence, ser. ICTAI ’19. ACM, 2019.
- (23) G. Deshpande, C. Arora, and G. Ruhe, “Data-driven elicitation and optimization of dependencies between requirements,” Proc. RE, 2019.
- (24) G. Deshpande et al., “Requirements dependency extraction by integrating active learning with ontology-based retrieval,” Proc. RE, 2020.
- (25) J. Guo et al., “Semantically enhanced software traceability using deep learning techniques,” in 2017 IEEE/ACM 39th ICSE. IEEE, 2017, pp. 3–14.
- (26) W. Wang, F. Dumont, N. Niu, and G. Horton, “Detecting software security vulnerabilities via requirements dependency analysis,” IEEE Transactions on Software Engineering, pp. 1–1, 2020.
- (27) S. Lim, A. Henriksson, and J. Zdravkovic, “Data-driven requirements elicitation: A systematic literature review,” SN Computer Science, vol. 2, no. 1, pp. 1–35, 2021.
- (28) H. Zhang, J. Li, L. Zhu, D. R. Jeffery, Y. Liu, Q. Wang, and M. Li, “Investigating dependencies in software requirements for change propagation analysis,” Information & Software Technology, vol. 56, no. 1, pp. 40–53, 2014. [Online]. Available: https://doi.org/10.1016/j.infsof.2013.07.001
- (29) P. Carlshamre, K. Sandahl et al., “An industrial survey of requirements interdependencies in software product release planning,” in Proceedings Fifth IEEE International Symposium on Requirements Engineering, Aug 2001, pp. 84–91.
- (30) Mozilla.org. (2020, Apr) Userguide/bugfields. [Online]. Available: https://wiki.mozilla.org/BMO/UserGuide/BugFields\#bug\_type
- (31) Typo3.org. (2021, May) Typo3 — the professional, flexible content management system. [Online]. Available: https://typo3.org/
- (32) U. Fayyad, G. Piatetsky-Shapiro, and P. Smyth, “The kdd process for extracting useful knowledge from volumes of data,” Communications of the ACM, vol. 39, no. 11, pp. 27–34, 1996.
- (33) S. Amershi, A. Begel, C. Bird, R. DeLine, H. Gall, E. Kamar, N. Nagappan, B. Nushi, and T. Zimmermann, “Software engineering for machine learning: A case study,” in 2019 IEEE/ACM 41st International Conference on Software Engineering: Software Engineering in Practice (ICSE-SEIP). IEEE, 2019, pp. 291–300.
- (34) MLworkflow. Machine learning workflow. [Online]. Available: https://cloud.google.com/mlengine/docs/tensorflow/ml-solutions-overview
- (35) S. B. Kotsiantis, D. Kanellopoulos, and P. E. Pintelas, “Data preprocessing for supervised leaning,” International journal of computer science, vol. 1, no. 2, pp. 111–117, 2006.
- (36) M. Nayebi, M. Marbuti, R. Quapp, F. Maurer, and G. Ruhe, “Crowdsourced exploration of mobile app features: A case study of the fort mcmurray wildfire,” in Proc. ICSE. ACM, 2017.
- (37) M. Kuhn, K. Johnson et al., Applied predictive modeling. Springer, 2013, vol. 26.
- (38) S. Y. Ho, K. Phua, L. Wong, and W. W. B. Goh, “Extensions of the external validation for checking learned model interpretability and generalizability,” Patterns, vol. 1, no. 8, p. 100129, 2020.
- (39) M. Shepperd, “Cost prediction and software project management,” Software project management in a changing world, pp. 51–71, 2014.
- (40) Mozilla.org. (2020, Apr) Bugzilla: bug-tracking system. [Online]. Available: https://www.bugzilla.org/
- (41) Redmine.org. (2020, Apr) Redmine: bug-tracking system. [Online]. Available: https://www.redmine.org/projects/redmine/issues/
- (42) L. Shi et al., “Understanding feature requests by leveraging fuzzy method and linguistic analysis,” in Proc. of the 32nd Conf. on ASE. IEEE Press, 2017, pp. 440–450.
- (43) T. Bhowmik and S. Reddivari, “Resolution trend of just-in-time requirements in open source software development,” in 2015 IEEE Workshop on Just-In-Time Requirements Engineering (JITRE). IEEE, 2015, pp. 17–20.
- (44) Y. Shin, J. H. Hayes, and J. Cleland-Huang, “Guidelines for benchmarking automated software traceability techniques,” in Proceedings of the 8th Int. Symposium on Software and Systems Traceability. IEEE Press, 2015, pp. 61–67.
- (45) G. Ruhe and M. O. Saliu, “The art and science of software release planning,” IEEE software, vol. 22, no. 6, pp. 47–53, 2005.
- (46) B. Kim, S. Kang, and S. Lee, “A weighted pagerank-based bug report summarization method using bug report relationships,” Applied Sciences, vol. 9, no. 24, p. 5427, 2019.
- (47) R. C. d. C. François Candelon et al., “Ai regulation is coming: How to prepare for the inevitable,” 2021.