Insights into lithium manganese oxide-water interfaces using machine learning potentials
Abstract
Unraveling the atomistic and the electronic structure of solid-liquid interfaces is the key to the design of new materials for many important applications, from heterogeneous catalysis to battery technology. Density functional theory (DFT) calculations can in principle provide a reliable description of such interfaces, but the high computational costs severely restrict the accessible time and length scales. Here, we report machine learning-driven simulations of various interfaces between water and lithium manganese oxide (LixMn2O4), an important electrode material in lithium ion batteries and a catalyst for the oxygen evolution reaction. We employ a high-dimensional neural network potential (HDNNP) to compute the energies and forces several orders of magnitude faster than DFT without loss in accuracy. In addition, a high-dimensional neural network for spin prediction (HDNNS) is utilized to analyze the electronic structure of the manganese ions. Combining these methods, a series of interfaces is investigated by large-scale molecular dynamics. The simulations allow us to gain insights into a variety of properties like the dissociation of water molecules, proton transfer processes, and hydrogen bonds, as well as the geometric and electronic structure of the solid surfaces including the manganese oxidation state distribution, Jahn-Teller distortions, and electron hopping.
I Introduction
The understanding of solid-liquid interfaces is of major importance for a sustainable energy future.[1, 2] In particular, electrode-electrolyte interfaces are central for many processes, from the electrocatalytic water splitting for the production of green hydrogen to energy storage in lithium ion batteries supplying, e.g., portable electronic devices and electric vehicles.[3, 4, 5, 6, 7] For this purpose, a prominent material is the lithium manganese oxide spinel LixMn2O4, with , which is a frequently used positive electrode material in lithium ion batteries but can also be employed as electrocatalyst for the oxygen evolution reaction (OER) representing the limiting step of water splitting.[8, 9, 10, 11] Beyond conventional lithium ion batteries containing organic electrolytes, the LixMn2O4-water interface has recently received increasing attention regarding the development of environment-friendly aqueous rechargeable lithium ion batteries offering improved safety combined with higher ionic conductivity and lower-cost production.[12, 13]
Stoichiometric LiMn2O4 contains a one-to-one ratio of MnIII and MnIV ions.[14, 15, 16] The electrochemical incorporation or removal of Li ions during battery discharging and charging changes this ratio by the reduction or oxidation of Mn ions, respectively, ensuring overall charge neutrality[17, 8] and allowing to control the electronic structure of the bulk material. This control is particularly important for the OER, as the Mn oxidation states are considered to be central for this process.[18] Apart from the overall composition of the material, the OER activity is also determined by the details of the solid-electrolyte interface whose geometric and electronic structure as well as the atomic composition can be substantially different from the bulk.[19, 20]
The active sites of electrocatalytic reactions are often embedded in a complex environment consisting of the – possibly reconstructed – solid surface and the electrical double layer. Small particles and porous materials have large surface-to-volume ratios, which are beneficial for a high activity, but the exposed surfaces can exhibit very different reactivities. The identification of active sites is therefore essential in a bottom-up approach for the design of improved catalysts.[21, 22, 23, 24, 25]
A practical challenge when using LixMn2O4 as battery material is capacity fading, which is related to the disproportionation of MnIII ions at the interface and the dissolution of the resulting MnII ions.[26, 27, 28] Consequently, the identification of tactics for controlling the Mn oxidation states at the interface is important for the construction of batteries with improved charge/discharge cycles and enhanced lifetime. Hence, to unravel the relationship between composition and reactivity, a comprehensive understanding of the geometric and electronic structure as well as of the dynamics and reactions at the interface is required.[29, 30, 31]
These insights can be gained in principle in computer simulations, but complex interface systems still pose a significant challenge as they require a first principles-quality description.[32, 33, 34, 35, 36] The electronic structure of LixMn2O4 with coexisting MnIV and Jahn-Teller distorted high-spin MnIII ions in the bulk as well as high-spin MnII ions at the interface is, however, difficult to describe by established methods like density functional theory (DFT). For a correct representation at least the level of the generalized gradient approximation including an additional Hubbard-like term for on-site Coulomb interactions (GGA) or a hybrid functional containing a fraction of exact Hartree-Fock exchange is needed.[37, 38, 39, 40, 41] A recent hybrid DFT benchmark of lithium manganese oxides showed that on-site Hartree-Fock exchange terms yield a correct description of partially filled shells of localized d electrons.[41] However, up to now ab initio molecular dynamics simulations using GGA or hybrid DFT functionals could only be performed for rather small LixMn2O4-water model systems containing a few hundred atoms on picosecond time scales due to the large computational effort.[42, 43, 44, 45, 46] To consider the interplay of a variety of different structural motifs with a liquid solvent, picosecond time scales are not sufficient. For instance, for the equilibration of LixMn2O4-water interfaces including the formation of hydroxide layers, electrical double layers, and/or strongly bound water at the interface as well as to obtain reliable statistics for elementary steps of proton transfer (PT) reactions and hydrogen bond networks significantly larger length and time scales are required.
Machine learning potentials (MLP) combine the efficiency of simple empirical potentials with the accuracy of quantum mechanics allowing to meet these requirements.[47, 48, 49, 50] Consequently, various MLPs have been developed, e.g., for water[51, 52, 53, 54] and different solid-liquid interface systems.[55, 56, 57, 58] In previous works we could further show that a high-dimensional neural network potential (HDNNP),[59, 60, 61, 62, 63] a frequently used type of MLPs, is applicable to bulk materials containing transition metal ions in different oxidation states[64, 65, 66] and in different magnetic orders.[66] The ability to represent different oxidation states is mandatory for studying the LixMn2O4 system. As the HDNNP’s underlying functional form is unbiased with respect to different interaction types, an equally reliable description for the interactions in the bulk and at the interface is obtained as has been demonstrated, e.g., for the Cu-water[67, 68] and ZnO-water interfaces.[69, 70, 71] Moreover, like most MLPs, HDNNPs are reactive, i.e., they are able to describe the formation and cleavage of bonds making them applicable to PT reactions omnipresent in electrochemical systems.
Apart from the simulation of the atomistic structure, machine learning algorithms can also be applied to obtain information about the electronic structure, for example, atomic charges,[72, 73, 74, 75, 76] electrostatic multipole moments,[77, 78] polarizabilities,[79] and even quantum mechanical wavefunctions.[80] Moreover, our recently developed high-dimensional neural network spin (HDNNS) prediction method[65] can be used to identify the oxidation and spin states of the Mn ions. This method is based on local geometric changes associated to the details of the electronic structure. Thus, in combination with an HDNNP providing the energies and forces, nowadays nanosecond time scale investigations of the geometric and electronic structure are possible for systems containing about - atoms.
In this work we investigate the LixMn2O4-water interface employing an HDNNP in combination with an HDNNS. Several {100} and {110} surfaces with different terminations in contact with water are investigated to unravel the spatial distribution of Mn oxidation states and oxygen species, such as oxide ions O2-, hydroxide ions OH-, neutral water molecules H2O, and hydronium ions H3O+. Starting from atomically smooth solid surfaces in contact with a liquid water phase, the formation of hydroxide and strongly bound water layers at the interface is studied to understand the fundamental properties of the interface structure. A detailed analysis of Jahn-Teller distortions and the hydrogen bond network is provided in the Supplementary Material. The analysis of electron hopping rates between Mn ions, various PT reactions, and water species residence lifetimes under equilibrium conditions yields a detailed understanding of the kinetics and dynamics. Finally, we compare the activity of the different surfaces and sites and show that initial steps of the OER occur already spontaneously under equilibrium conditions.
II Methods
In HDNNPs[59, 63], which we use to compute the energies and forces driving the molecular dynamics (MD) simulations, the potential energy is constructed as a sum of atomic energy contributions ,
| (1) |
Here, are the nuclear coordinates for a system containing elements with for element . The individual atomic energy contributions are represented by atomic feed-forward neural networks of the form
| (2) | ||||
The architecture ----1 of the atomic neural networks contains an input layer with neurons providing a description of the atomic environment. Moreover, in this work three hidden layers with , , and neurons, respectively, and an output layer with one neuron, which yields the atomic energy contribution, are used. The activation functions are hyperbolic tangents except for the output layer, for which a linear function is employed. The weight parameters and of the atomic neural networks are optimized to accurately reproduce a training data set consisting of energies and atomic force components of reference structures obtained, for example, in DFT calculations. For each element an individual atomic neural network is constructed making the neural network parameters element-specific. For clarity, the index representing this element-dependence has been omitted in the quantities in Equation 2.
The atomic neural networks are able to describe the complex relation between the atomic energies and the local chemical environments of the atoms. These environments are described by vectors of many-body atom-centered symmetry functions (ACSF)[81] serving as structural fingerprints of the local geometry inside a cutoff sphere of radius . ACSFs represent a general transformation from the Cartesian coordinates to a translationally, rotationally, and permutationally invariant structural description based on interatomic distances and angles. Moreover, for all atoms of a given element, the ACSF vectors have the same dimensionality to ensure the applicability of the trained atomic neural networks to large-scale simulations of systems containing different numbers of atoms. As the ACSFs depend only on the elements and positions of the atoms, HDNNPs are able to describe the making and breaking of bonds. The parameters defining the spatial shapes of the radial and angular ACSFs can be adjusted to optimize the performance as described in the Supplementary Material. More detailed information about HDNNPs, ACSFs, their properties, and their construction are provided in several reviews.[60, 61, 62, 63]
The HDNNS method[65] is closely related to HDNNPs and employs the same atomic neural network topology. However, instead of atomic energy contributions , the atomic neural networks (Equation 2) yield the atomic spins , i.e., they provide the relation. A HDNNS exploits the observation that different oxidation states as well as high- and low-spin states of transition metal ions typically lead to structurally different local environments. Thus, like for the energies and forces in HDNNPs, the method is based on the assumption that the atomic spins and oxidation states are uniquely defined by the structure. Consequently, consistent reference data corresponding to the ground state electronic structure are mandatory for a successful construction of the HDNNS. The absolute values of atomic reference spins obtained from DFT are used for training to circumvent the issue that the electronic ground state is twofold degenerate with respect to the absolute sign of all spins. Since the present work is restricted to the magnetic ground state, we do not explicitly include the degrees of freedom related to the relative orientations of the atomic spins, but we note that magnetic HDNNPs taking these degrees of freedom into account have been proposed.[66]
III Computational Details
For the generation of the reference data the local hybrid exchange-correlation functional PBE0r[82, 41] including D3 dispersion corrections[83, 84] was used in collinar spin-polarized DFT calculations. PBE0r considers only on-site Hartree-Fock exchange terms yielding an accurate description of the partially filled Mn d shell with a computational effort comparable to generalized gradient approximation functionals. The Car-Parrinello Projector Augmented-Wave (CP-PAW) code (version from September 28, 2016)[85, 86] and the DFT-D3 code (version from June 14, 2016)[83, 84] were employed using the same setup as in our previous studies.[41, 64, 65]
The HDNNP and HDNNS were constructed using the RuNNer code (versions from October 19, 2020 and December 4, 2018, respectively).[61, 62, 87] The architecture of the atomic neural networks is 180-25-20-15-1 for all elements in the HDNNP and 180-20-15-10-1 for Mn in the HDNNS, which is the only spin-polarized atom in the system. The parameters of the 180 radial and angular ACSFs per element with the cutoff radius are compiled in the Supplementary Material along with the description of a generally applicable scheme to adjust the parameter of the ACSFs to the element-specific nearest-neighbor distances. is the Bohr radius.
Instead of total energies, the DFT formation energies were used for training, which were obtained from the total energies minus the sum of the atomic energies calculated for the elements in their reference states, i.e., gaseous H2, body centered cubic Li, gaseous O2, and -Mn. In addition to the formation energies also the DFT Cartesian atomic force components were used for training the HDNNP. Of all available energies and force components 90% were used in the training set to determine the neural network parameters, while the remaining 10% were employed to test the predictive power and reliability for structures not included in the training process.
The DFT reference atomic spins used to train the HDNNS are the absolute values of projections of the spin density onto the one-center expansions of the partial waves using atom-centered spheres with a radius of 1.2 times the atomic covalent radius. The atomic spin is therefore equal to the absolute difference in the number of spin-up and spin-down electrons at an atom in units of the electron spin . The setup of the HDNNP and HDNNS construction is described in detail in the Supplementary Material.
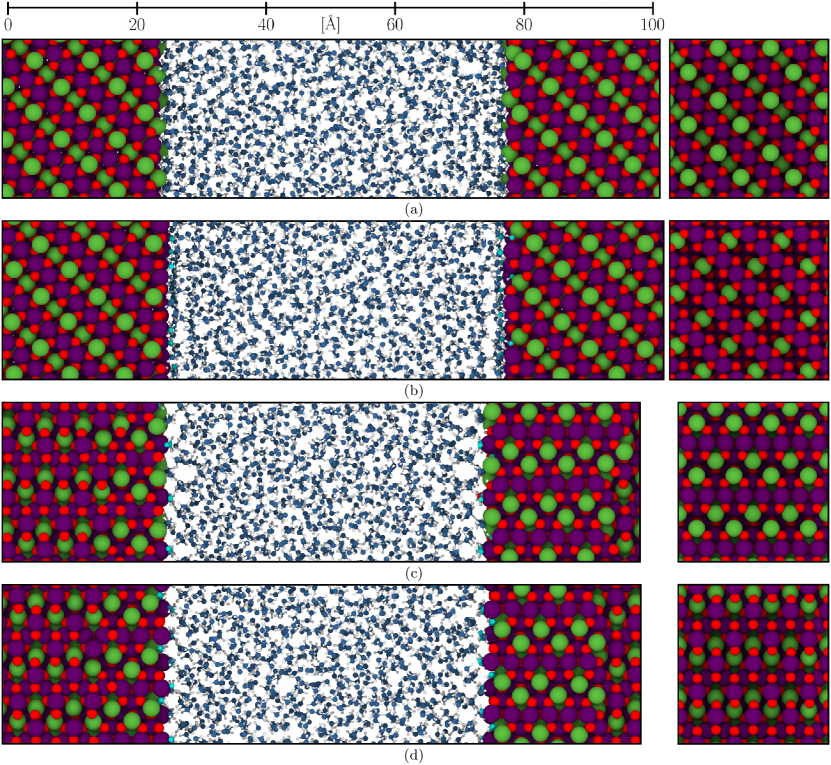
HDNNP-driven MD simulations were performed for LixMn2O4-water interface systems in the isothermal-isobaric () ensemble at a temperature of K and a pressure of bar. The simulation cells include about atoms in a volume of about . The volume ratio of LixMn2O4 and water is approximately 1:1 with the phase boundaries parallel to the plane. Four different cuts of bulk LixMn2O4 in contact with water have been investigated, which are the {100} Li-terminated surface with Mn2O4 in the first subsurface layer (), the {100} Mn2O4-terminated surface with Li in the first subsurface layer (), the {110} LiMnO2-terminated surface (), and the {110} MnO2-terminated surface (). Top views of the clean surfaces as well as side views of the employed interface slab models are shown in Figures 1 (a) to (d), respectively. Both surfaces of each slab are structurally identical. Therefore, the solid slab is built from bulk stoichiometric LiMn2O4 with non-stoichiometric LixMn2O4 surfaces. For each system, three simulations starting from different H2O configurations, which initially did not include OH- and H3O+ ions, on top of the atomically flat solid surfaces were performed for an equilibration time of 1 ns and a subsequent acquisition time of 5 ns. In the same way, three bulk water simulations with different initial structures were carried out using approximately cubic cells containing around atoms and fluctuating lattice parameters between about 50 and 60 Å in the ensemble. To identify the oxygen and water species, each H atom has been assigned to its closest O atom.
The HDNNP-driven simulations were performed using the Large-scale Atomic/Molecular Massively Parallel Simulator (LAMMPS)[89, 90] and the neural network potential package (n2p2).[91, 92] They were run with a timestep of 0.5 fs applying the Nosé-Hoover thermostat and barostat[93, 94] with coupling constants of 0.05 ps and 0.5 ps, respectively, allowing for anisotropic changes of the simulation cell. The trajectory was stored in intervals of 0.1 ps.
IV Results and Discussion
IV.1 High-dimensional neural networks
The HDNNP and HDNNS are based on a reference data set consisting of 15228 LixMn2O4 bulk structures,[64, 65] 5143 water bulk structures, and 17597 LixMn2O4-water interface structures and their PBE0r-D3 DFT energies, atomic force components, and atomic spins. The structures include 32 to 255 atoms, with the interface structures containing between 122 and 194 atoms. A detailed description of the reference data set construction and composition is provided in the Supplementary Material.
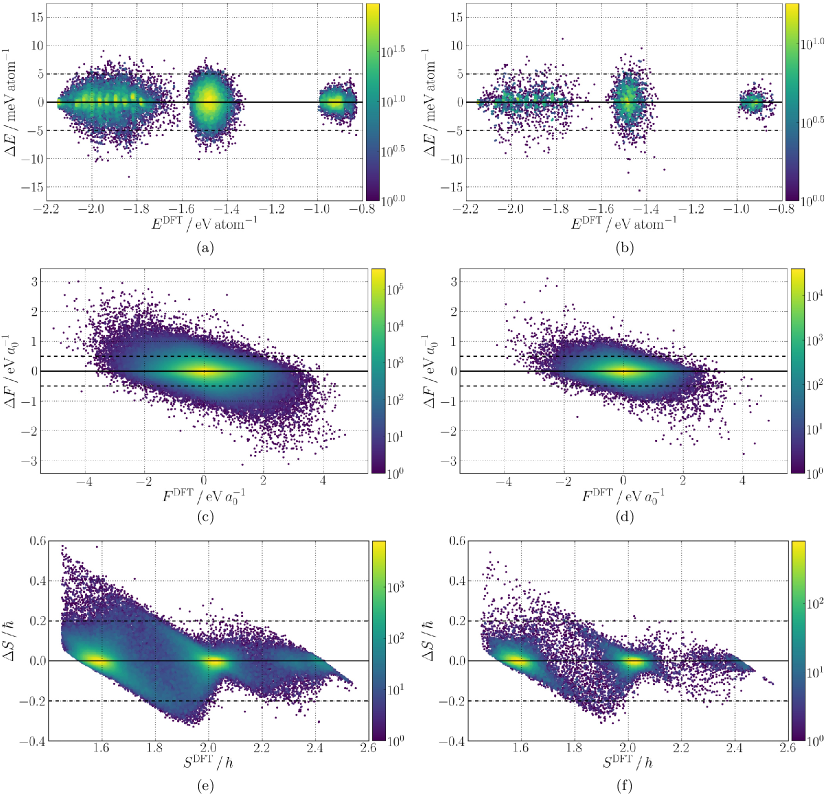
The PBE0r-D3 DFT formation energies range from eV atom-1 to eV atom-1 therefore spanning a fitting interval of eV atom-1. In Figures 2 (a) and (b) the three structure types can be identified by their formation energies between about and , and , as well as and eV atom-1 corresponding to bulk LixMn2O4, interface structures, and bulk water, respectively.
The HDNNP reproduces the energies of the training set with a root mean squared error (RMSE) of 1.9 meV atom-1, while it is able to predict the energies of the test set with an RMSE of 2.4 meV atom-1. The RMSE of only the bulk water training structures is about 1.0 meV atom-1 (test set 1.1 meV atom-1) and thus about half of the values of the RMSEs of the LixMn2O4 and interface training structures, which are 2.0 and 2.1 meV atom-1, respectively (test sets 2.3 and 2.8 meV atom-1). We ascribe this difference to the less complex geometric and electronic structure of bulk liquid water that is typically very well represented by machine learning potentials.[51, 54] We note that in spite of the increased complexity of the potential energy surface of the interface system, in particular the bulk LixMn2O4 test set RMSE is very similar to the RMSE of 2.2 meV atom-1 of a previous HDNNP fitted to bulk LixMn2O4 data only.[64] The maximum energy error of all data in the training/test set is 13.2/15.6 meV atom-1. Only 2.3/5.5% of the energy predictions in the training/test set have errors larger than 5 meV atom-1 (Figures 2 (a) and (b)).
The PBE0r-D3 reference data contains force components up to eV . The force components RMSE of all data is 0.127 eV for both, training and test set. Again, the RMSE of bulk water (0.059 eV ) is lower than the RMSEs of bulk LixMn2O4 (0.114 eV ) and the interface structures (0.143 eV ). The force components RMSE of bulk LixMn2O4 is similar to the value of 0.107 eV of the aforementioned bulk only LixMn2O4 HDNNP.[64] As highlighted by the heatmaps in Figures 2 (c) and (d) most of the force components have an error smaller than 0.5 eV (99.33/99.32%). The maximum errors are 3.13 and 3.12 eV for the training and test set.
The atomic spins of Mn are in the range (Figures 2 (e) and (f)). The RMSE of the HDNNS is for both training and test set. Only 0.75% of the training data and 0.76% of the test data show errors larger than possibly resulting in the assignment of a different spin and oxidation state, while the maximum errors are 0.57 and , respectively. Consequently, the vast majority of the Mn oxidation states is accurately predicted. The assignment to the oxidation states MnIV (d electron configuration te), high-spin MnIII (te), and high-spin MnII (te) has been set to the intervals , , and , respectively, based on the distribution of spins shown in Figures 2 (e) and (f).
IV.2 Manganese oxidation state distribution
Using the obtained HDNNP and HDNNS, we investigate four solid-liquid interface systems with different geometric and electronic structure. In this section we first investigate the interface from the perspective of the solid phase, while we focus on the liquid phase in the next section and finally discuss the reactivity of interfacial water species in the last section.
In general, HDNNP-driven MD simulations allow to gain insights into the atomic structure and dynamics of the LixMn2O4-water interface in equilibrium. Further, using the HDNNS we can in addition investigate the Mn oxidation state distribution in the trajectories. This distribution is of major importance for understanding capacity fading of LixMn2O4 during battery usage because previous studies propose the origin to be disproportionation of MnIII ions at the interface and subsequent dissolution of the emerging MnII ions. MnII is the most stable oxidation state in aqueous solution while MnIV is not soluble.[95] Structural features exposing only small amounts of MnII and MnIII ions at the interface could thus support the development of more durable electrode materials.
We start with the surface (Figure 1 (a)), which is positively polarized due to Li termination, while the overall slab is neutral because of the charge compensation by the subsequent Mn2O4 layer containing formally a one-to-one ratio of MnIII and MnIV ions. We note that due to the structurally identical surfaces at both sides of the slab, the system in total contains 23 Li layers and only 22 Mn2O4 layers resulting in a slight overall excess of MnIII compared to MnIV ions in the system. Such a situation is not unphysical but typical for LixMn2O4, e.g., for different loads of Li ions compensated by different oxidation states of Mn.
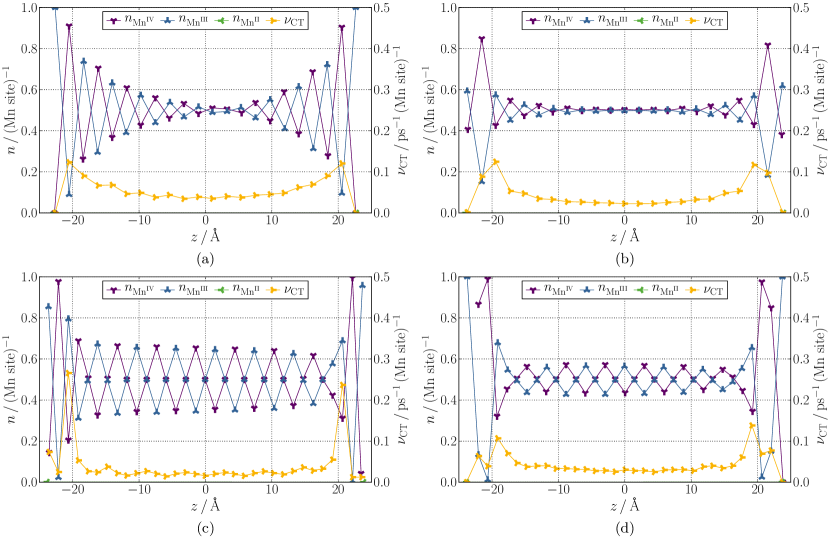
In our simulations we observe that in the outermost Mn2O4 layer on each side almost only MnIII ions are present (Figure 3 (a)). The reason for the preference of MnIII ions in the topmost layer is the undercoordination of the Mn ions at interface sites by only five O2- ions compared to the octahedral coordination in the bulk material. We have not observed any long-living OH- ions formed by dissociation of water molecules, Consequently, significant protonation of interfacial O2- ions and adsorption of hydroxide ions at the undercoordinated Mn ions does not take place. Due to this lack of negative ions, the formation of MnIII ions is favored at the interface and MnIV ions are predominantly found in the second Mn2O4 layer (Figure 3 (a)). Deeper layers contain a decreasingly pronounced alternating excess of either MnIII or MnIV ions, respectively, which becomes small after several layers. MnII ions are very rarely observed and, if found, they only emerge in the topmost layer with about MnII ions per Mn site.
In contrast to the system, both sides of the slab representing the interface (Figure 1 (b)) are terminated by Mn2O4 resulting in total in 22 Li layers and 23 Mn2O4 layers. The reduced amount of Li+ ions in the system compared to the system leads to a slight excess of MnIV ions instead of MnIII ions. In the topmost layer the fraction is about three MnIII to two MnIV ions (Figure 3 (b)). The increased stability of MnIV ions in the topmost layer compared to the system can be explained by the coordination by OH- ions. For this system we find that OH- ions are adsorbed on top of about 43% of the interface Mn ions. The majority of the corresponding protons formed in the dissociation of water molecules is attached to interface O2- ions, which are covered to about 21% forming OH-. This value is about half of the Mn coverage by OH- ions because there are twice as many interface O2- ions as Mn ions per layer. The OH- ions of the first liquid layer are preferably but not exclusively located at MnIV sites while MnIII sites are typically coordinated by H2O molecules (Figure 4). The proposed intermediate state of the OER, in which two OH- ions are found on top of an [MnMnO4]6+ unit,[10] is therefore a rare configuration in our simulations explaining the low OER activity of the stoichiometric LiMn2O4 spinel.
The second layer on each side adapts to the MnIV excess in the system (Figure 3 (b)). The alternating excess of either MnIII or MnIV ions decays after a few layers converging to equal fractions of MnIII and MnIV ions in deeper layers. In contrast to the system in which basically no MnII ions form, in the system we find about MnII ions per Mn site in the topmost Mn2O4 layer with some statistical fluctuations depending on the surface and simulation. Substantially longer simulations are expected to be required to obtain fully converged values for such small fractions. As both sides of the LixMn2O4 slab in every simulation are equal, converged results in Figure 3 are symmetric with respect to . Deviations from this behavior, which are small for most of our results, can consequently be employed to estimate the uncertainty caused by the finite simulation time.
The (Figure 1 (c)) and (Figure 1 (d)) interface systems show similar amounts of about and MnII ions per Mn sites in the topmost surface layers. While the system contains a slight excess of MnIII over MnIV ions, the opposite is the case for the system. The topmost layer is still dominated by MnIII ions in both systems with a ratio of nine MnIII to one MnIV at the interface (Figure 3 (c)) and almost only MnIII ions at the interface (Figure 3 (d)). The reason for this preference of MnIII ions is the low coordination of the topmost Mn ions by only four O2- ions. As a consequence, the second layer in the system and even the second and third layers in the interface are predominantly occupied by MnIV ions. The influence of the interface on the oxidation state distribution vanishes already after about four layers. Regular oscillations of the alternating excess of either MnIII or MnIV, respectively, can be observed in the bulk (Figure 3 (c) and (d)). As the amplitude of these oscillations varies for the and systems different arrangements of MnIII and MnIV ions can lead to local minimum configurations. Further, due to electron hopping processes, the MnIII and MnIV arrangements are dynamical at 298 K and different local motifs are observed during the simulations even for the same interface systems. We note that the Mn oxidation state distribution is averaged over (001) planes in Figures 3 (a) and (b) and over (110) planes in Figures 3 (c) and (d) yielding different slices of the structure.
To compensate for the undercoordination of Mn ions by O2-, about 94% of the interface Mn ions are in addition coordinated by approximately two OH- ions. These OH- ions are placed on bridge sites thus resembling the octahedral coordination in bulk LixMn2O4 and are shared by two Mn ions (see Section IV.3). About 46% of the interface O2- ions contain adsorbed H+ ions forming OH-. For the interface this value further increases slightly to about 48%, while there is about one adsorbed OH- ion per interfacial Mn atom. In this case, the OH- ions originating from the liquid phase are not placed at Mn bridge sites but adopt empty octahedral coordination sites (see section IV.3). To compare the OH- coverage between the interface and the and interfaces, the number of Mn ions per interface area has to be taken into account. This number is about 1.5 times higher at the interface compared to the other two interfaces. Still, the OH- coverage is higher at the and interfaces. Hence, the dissociation degree of H2O molecules is higher at these two interfaces, which provide more empty octahedral coordination sites of the interfacial Mn ions than the interface.
In addition to the Mn oxidation state distribution, we estimated the charge transfer rates related to electron hopping between the MnII, MnIII, and MnIV ions. These rates were determined from the number of oxidation state changes per time. Because two oxidation states are changed by one electron hop, this number is divided by two. The trajectory data was collected every 0.1 ps. The data in Figures 3 (a) to (d) show that even the fastest processes are more than an order of magnitude slower than this sampling interval. This time scale difference ensures that the major fraction of processes is counted. To exclude counting of unsuccessful attempts to change the oxidation state, a transition is only considered in case the spin value of a MnIV ion increases above , the spin value of a MnIII ion increases above or decreases below , or the spin value of a MnII ion decreases below .
For all systems, the charge transfer rates are found to be largest close to the interface, with a maximum typically in the second to fourth Mn containing layer (Figures 3 (a) to (d)). In the center of the solid slab the corresponding values are between about 0.02 to 0.03 charge transfers per ps and Mn site and hence much smaller than at the interface. These values are close to the value of 0.02 charge transfers per ps and Mn site obtained in our previous study of bulk LiMn2O4.[65] The rates in the topmost layer of the interface are higher than those in the topmost layers of the other interfaces, and in general lower charge transfer rates are found in layers with predominant single Mn oxidation states. For the interface the rates are smaller in the second layer, which corresponds to the topmost layer at the interface. Therefore, the charge transfer rates in the LiMnO2 layers seem to be higher than those in the MnO2 layers.
The electrons are not explicitly included in the HDNNP and the HDNNS identifies different oxidation states based on the local structural environment like, for example, the presence or absence of Jahn-Teller distortions. Consequently, the inhomogeneous distribution of MnIII and MnIV ions in the systems as well as the electron hopping processes raise the question if the overall numbers of these ions are conserved during the simulations. In principle, in the solid phase there has to be a one-to-one ratio between the number of Li+ ions and the number of Mn eg electrons. Since the average number of MnII ions contributing two eg electrons is rather small or even negligible at all interfaces, we expect to find about the same number of Li+ ions and MnIII ions, each containing one eg electron, in the system. Indeed we observe that the number of eg electrons stays approximately constant during all interface simulations (see Supplementary Material Figures S2 (a) to (d)). This observation provides evidence of the conservation of total charge and number of electrons and confirms the consistent description of the systems by the HDNNP. Only small fluctuations in the predictions are observed, since electron hopping processes can give rise to intermediate structures in which the geometry-based assignment of the oxidation state is unavoidably physically ambiguous.[65] In addition, remaining prediction errors of the HDNNS may contribute to these fluctuations as well.
Due to the slight excess of Li+ ions in the system related to the surface geometry, there are more MnIII than MnIV ions present in this system. About 409 MnIII and 383 MnIV ions are predicted by the HDNNS on average over the full simulation time of all three interface simulations, which contain all the same number of Mn ions. Since 414 Li+ ions are present, the error in the number of eg electrons obtained from the HDNNS prediction is only about 1.2%. In contrast to the system, the system contains more MnIV than MnIII ions. Also in this case the HDNNS prediction is very accurate yielding about 400 MnIII and 428 MnIV ions on average. Compared to the number of 396 Li+ ions, the prediction error in the number of eg electrons is again small (1.1%). For the system 401 eg electrons are predicted compared to 408 Li+ ions resulting in an underestimation of 1.8%. Again, the excess of MnIII over MnIV ions is predicted correctly (401:391). For the system, for which 386 MnIII and 406 MnIV ions are predicted by the HDNNS, an even better agreement with a deviation of only 0.4% is reached, as this slab contains 384 Li+ ions. In conclusion, the Mn oxidation states of all systems identified by the HDNNS are very accurately described via the geometric atomic environments of the Mn ions determined by the HDNNP energy surface.
The MnII ions in all systems have an above-average distance from the solid and are slightly displaced towards the liquid, which can be reasoned by the larger size of MnII ions. The MnII ions are preferably coordinated by H2O instead of OH- of the water contact layer and the Mn-O distances are on average larger than for MnIII and MnIV ions. Dissolution of MnII ions was not observed in the 5 ns MD simulations at 298 K and 1 bar employing atomically flat solid surfaces without defects and in the absence of external electric fields. Therefore, dissolution seems to be rare in equilibrium under standard conditions. Especially, the inclusion of steps and defects at the solid surface is expected to increase the dissolution rate.[96] Moreover, possible surface reconstructions as proposed for the {110} and {111} surfaces[29, 97, 37, 98] and the formation of surface layers of different stoichiometry such as Mn3O4[99, 100, 101] might also be relevant for MnII dissolution. In particular, the Mn3O4 tetragonal spinel structure, in which MnII ions substitute the Li+ ions at the tetrahedral sites of LixMn2O4, is an interesting candidate for the formation of dissolved MnII ions. These MnII ions in addition block the Li+ channels in the spinel structure and thus need to be removed during charging of the battery.
In summary, the weak interaction between water and the interface seems to be responsible for only very little formation of MnII ions. The outermost Li+ layer separates the water molecules from the Mn and O2- ions, which are important for the dissociation of water and the formation of long-living OH- ions. A high coordination by O2- ions, i.e., a more bulk-like environment, favors the formation of higher Mn oxidation states and leads to a weaker interaction with water. On the one hand, electron hopping and hence electrical conductivity is increased in the vicinity of the interface leading to higher battery performance when using smaller particles sizes. On the other hand, the formation of MnII ions is only observed close to the surface suggesting more durable battery materials when using larger particles.
IV.3 Structural characterization of the interfaces
The atomic structure as well as the reactivity of the interface are determined by the termination of the solid surface. For instance, we have seen that the Mn coordination can strongly affect the formation of OH- ions. The resulting degree of hydroxylation at the interface can be expected to be relevant for reactions at the surface such as the OER. Moreover, the structure and dynamics of the liquid in the vicinity of the interface and deviations of its properties from the bulk liquid are of high interest.
To assess the impact of the interface on the properties of the liquid, the system has to be sufficiently large to ensure the presence of a bulk-like region in the center of the liquid phase. This bulk-like region is not only important for comparing interfacial properties to those of the bulk, but also to obtain converged data for the interfacial properties. Figures 5 (a) to (d) show the averaged atomic distributions in all four systems. The central region of the liquid phase is very similar for all different surfaces and shows only small fluctuations, which are much larger in the vicinity of the surfaces. The density of H2O in the central 5 Å slice of the liquid phase is 0.946 kg l-1 (). This density agrees very well with the value of 0.947 kg l-1 obtained in HDNNP-driven simulations of bulk water. Further, the properties of the hydrogen bond network are very similar in the centers of the liquid in all simulations (Supplementary Material). Consequently, the simulation cells, which all have a water region with a diameter of at least 50 Å, are large enough to yield bulk properties in the center, which is in excellent agreement with previous studies on other solid-water interfaces.[67, 69] An underestimation of the density compared to the experimental value of 0.997 kg l-1 at 298 K and 1 bar[102] is common in DFT calculations and was also observed in a previous study of water yielding 0.94 kg l-1[54] based on the revPBE0-D3[103, 104] DFT functional – we note that our results are based on the PBE0r-D3[82, 105] DFT functional.
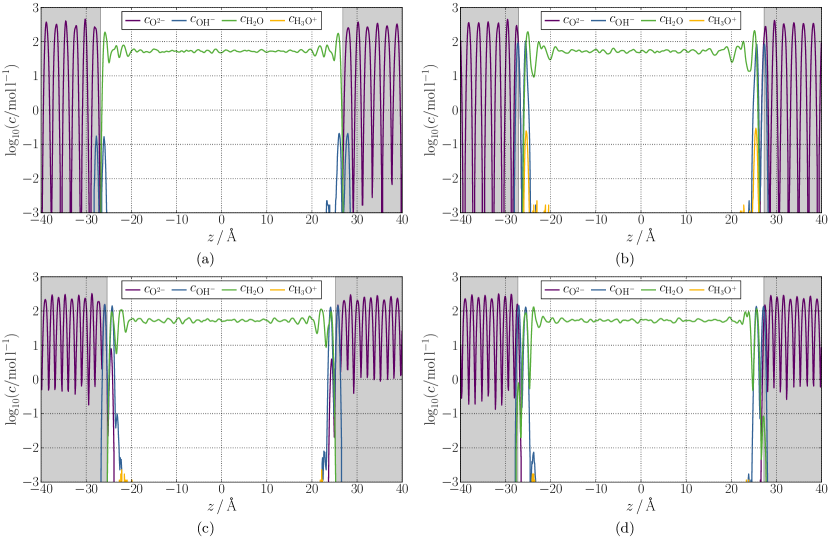
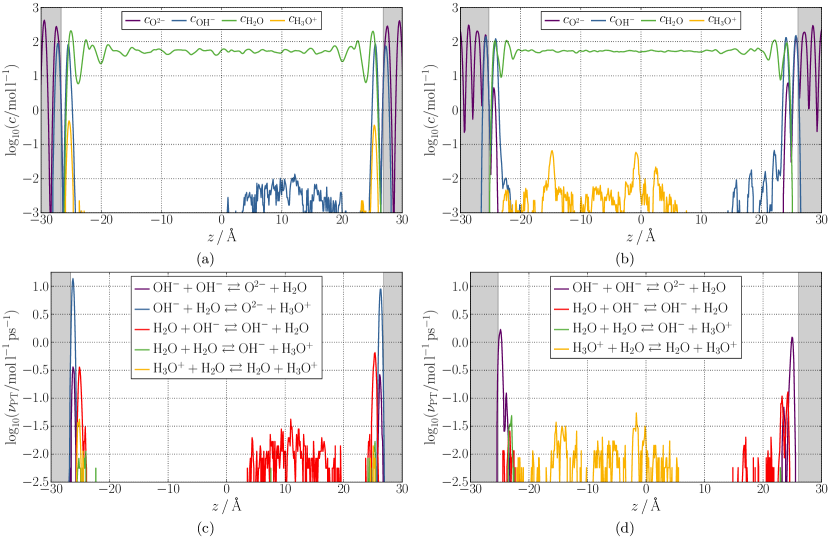
The concentration profile as a function of the distance from the surfaces, which is proportional to the density profile with the molar mass as proportionality constant, shows two distinct OH- peaks of about the same size for each phase boundary (Figure 5 (a) to (d)). These peaks correspond to protonated O2- ions of the solid and OH- ions adsorbed to Mn sites, respectively. Since these two peaks dominate the OH- concentration profile and are of about equal height, essentially all protons and hydroxide ions formed in the dissociation of water molecules are bound at the solid surface. The OH- concentration is about three orders of magnitude smaller at the interface compared to the other systems. The reason is that the OH- ions are not long-living at the interface.
Oscillations of the H2O concentration in the vicinity of the interface are more pronounced than in the vicinity of the interface (Figure 5 (a) and (b)). The depletion layer beyond the first water peak can be observed in the spatial atomic distributions in Figure 6 (b) as well. The relatively high concentration of H3O+ ions at the same distance as the second OH- peak will be discussed in Section IV.4.
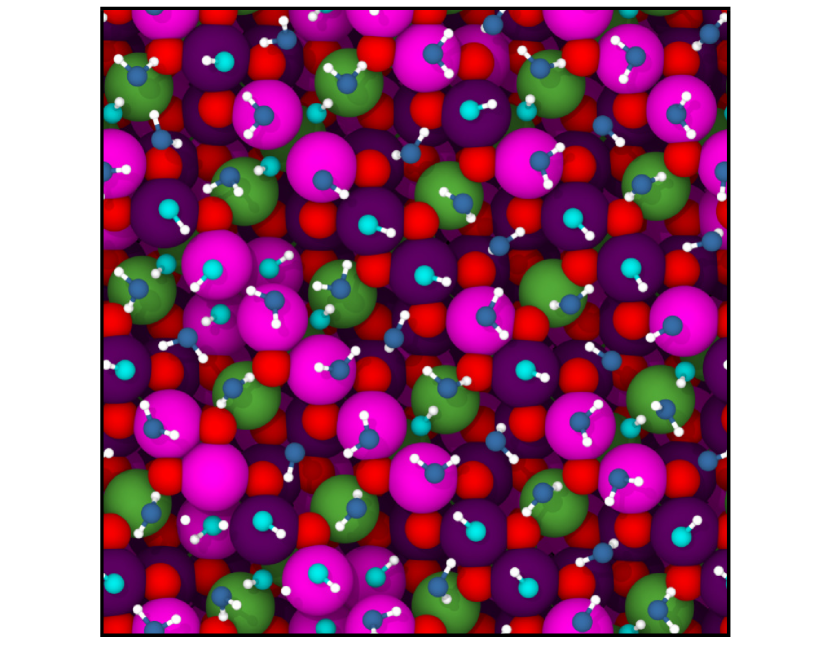
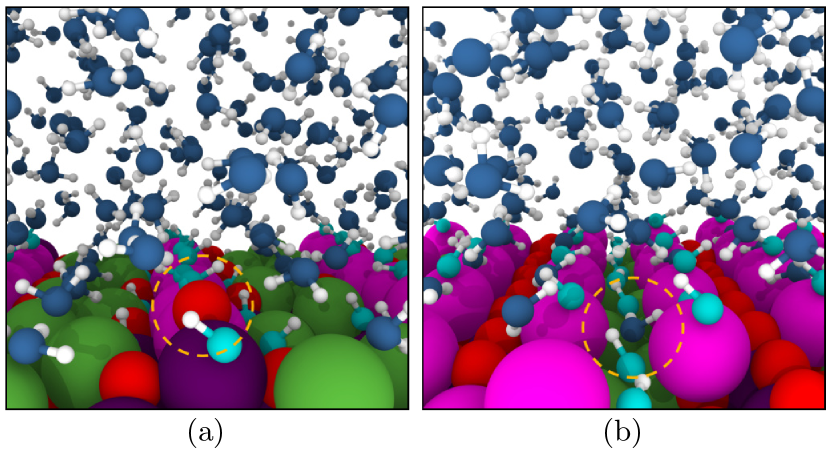
The structural deviation of the contact layer from the bulk liquid for the and systems is even more pronounced. In the case of the system, the OH- concentration profile shows the presence of OH- ions rather far from the surface. The formation of a small additional O2- peak on top of the surface with maximum concentrations between 1 and 10 mol l-1 is particularly interesting. This peak implies that some H2O molecules can be deprotonated twice to partially complete the octahedral coordination of the Mn ions as shown in Figure 7 (a). This formation of surface exposed O2- ions is potentially of interest for catalytic reactions due to their low coordination. Furthermore, a MnIV ion is often found close to a surface exposed O2- ion although the first solid layer is typically dominated by MnIII ions at this surface. Thus, the surface exposed O2- ions have an impact on the distribution of MnIII and MnIV ions.
At the interface an H2O concentration of 0.1 to 1 mol l-1 is found in the topmost layer of the solid surface, which implies the opposite process. Here, O2- ions are protonated twice thus forming water as shown in Figure 7 (b). A correlation of MnII formation to the formation of H2O molecules in the topmost solid layer is not observed. MnII ions are most often observed in environments in which the Mn ion is coordinated by two H2O molecules from above instead of typically one OH- ion and one H2O molecule. The double deprotonation and protonation processes can be viewed as surface reconstructions of the LixMn2O4 surfaces.
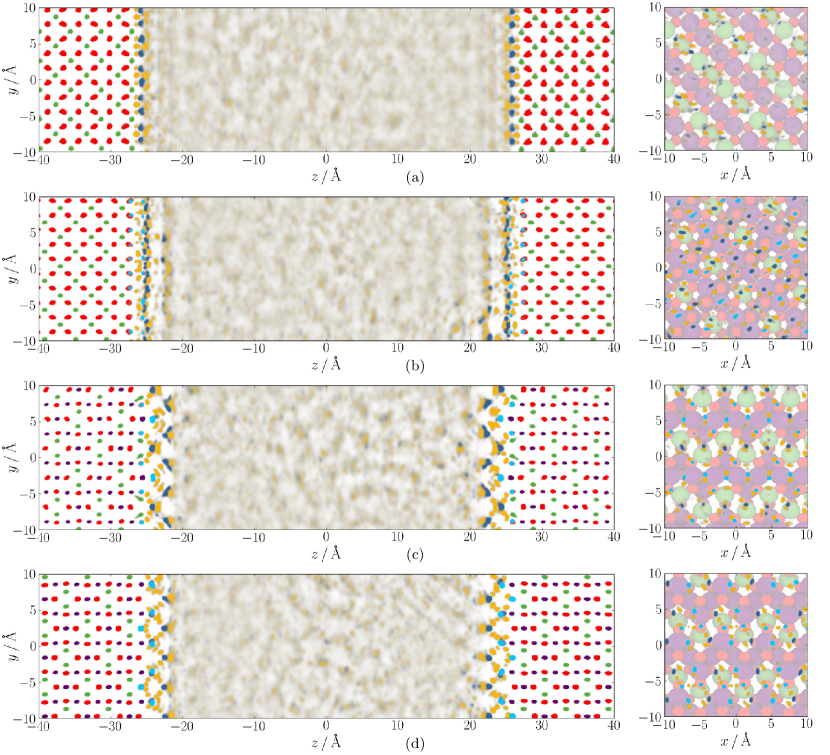
On the left side of Figures 6 (a) to (d) the time averaged spatial atomic distributions projected onto the plane are shown for each interface. As expected the bulk solid has a regular pattern reflecting the crystal structure while the bulk liquid has a diffuse distribution in all simulations. However, at the different solid-liquid interfaces the liquid phase shows various interesting strongly bound water structural features, which are less mobile due to the strong interaction with the surface. An adaption of the interfacial water layers to optimize the interaction to the solid as well as the hydrogen bond network to the bulk liquid has been observed for different metal surfaces as well and can yield very specific water structures depending on the solid surface.[106, 107] The thickness of the strongly bound water layer depends on the underlying solid surface. For the interface the strongly bound water layer has a diameter of about 1.5 to 2 Å only, while it is 3 to 4 Å thick for the and interfaces. However, the structure at the interface is dominated by a two-dimensional dense water layer on top of the solid, while the structure at the interface is three-dimensional. A pattern similar to the latter one is also observed at the interface. Here the strongly bound water layer is even 3.5 to 4.5 Å.
To investigate the strongly bound water layers in more detail the right panels of Figures 6 (a) to (d) show the spatial atomic distributions in water films of 2.5 Å diameter above the surface starting from the H atom closest to the surface projected onto the plane. The small strongly bound water layer on top of the interface forms due to the attractive interactions between the oxygen of H2O and Li+ ions as well as due to hydrogen bond formation between the hydrogen of H2O and O2- ions at the surface (Figure 6 (a)). A pattern can be observed at the interface but the concentrations at the strongly bound water sites are lower than those for the other interfaces (lower opacity of the first liquid layer in the right panels of Figure 6 (a) than in (b) to (d)). Consequently, the H2O molecules at the interface are more mobile than the various water species at the other interfaces, corresponding to the weaker interaction between water and the surface discussed above.
As mentioned in Section IV.2 OH- ions are formed at the , , and interfaces and cover the solid surface to a large fraction (Figures 6 (b) to (d)). These OH- ions are rather strongly bound to specific sites and thus less mobile than the water molecules. Moreover, they are able to form strong hydrogen bonds and can order the water molecules. Therefore, they have a large impact on the formation of the strongly bound water layer. The H2O/OH- distribution in the first layer of the liquid phase does not follow a regular pattern at the interface (Figure 6 (b) as well as Figure 4). Hence, the MnIII/MnIV distribution in the first layer of the solid phase is also disordered (Figure 4).
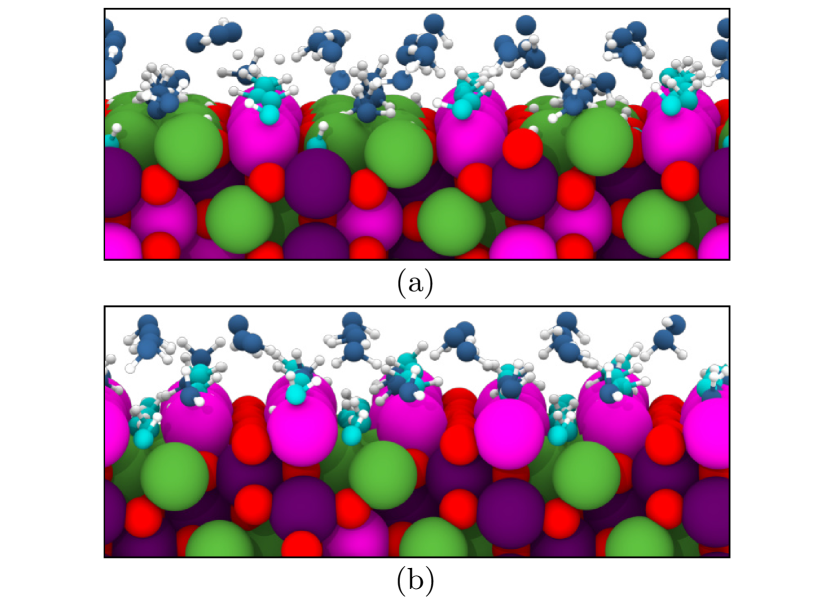
The order in the H2O/OH- distribution increases for the and interfaces. At the interface most OH- ions of the first layer of the liquid bridge the Mn sites, which are arranged in rows in the first solid layer (e.g., in Figure 6 (c) as well as Figures 7 (a) and 8 (a)). Most H2O molecules in the first layer are aligned in rows close to the Li+ ions with H atoms pointing to O2- ions of the solid (e.g., in Figure 6 (c)). In the first layer of the solid rows of alternating O2- and OH- ions are formed (e.g., in Figure 6 (c)). O2- excess can lead to MnIV ions in the topmost solid layer.
In the first solid layer of the interface an alternating pattern of O2- and OH- rows is formed, whereby O2- ions bridge the underlying Mn sites and the OH- ions are above the Li sites (e.g., and in Figure 6 (d) as well as Figures 7 (b) and 8 (b)). In some simulations the H2O molecules and OH- ions in the first liquid layer are arranged in alternating rows (e.g., and in Figure 6 (d)).
The oxygen atoms of the water species in the first liquid layer generally tend to continue the oxygen face centered cubic (fcc) lattice of the solid yielding an energetically favored coordination of the Li and Mn ions (see Supplementary Material Figures S7 (a) and (b) for representations of the oxygen lattice only). The second liquid layer is most pronounced in the case of the interface. The view on the plane still seems to agree with the fcc lattice (Figure 8 (b)) but a view on the plane shows that the second layer does not match the fcc lattice (Supplementary Material Figure S8). The same observation is obtained for the interface. However, the strongly bound water layer cannot be assigned to a specific lattice structure or ice polymorph, since in most cases the OH- ions at the surface do not form a sufficiently regular pattern.
In conclusion, with increasing OH- concentration complex structural patterns can form which also affect the oxidation states of the underlying Mn ions. Interactions between the solid and the liquid lead to favored positions of the atoms. The oxygen atoms of OH- ions and H2O molecules in the contact layer of the liquid prefer to be at sites which complete a bulk-like octahedral coordination of Mn or tetrahedral coordination of Li. The respective OH- ions thereby favor to bind to interfacial Mn ions. Therefore, strongly bound water structures form at the interface.
To compare the residence lifetimes of the O atoms in the strongly bound water layers at the different interfaces as well as in the bulk quantitatively, the correlation function,
| (3) |
can be used with the total number of simulation steps and total simulation time . is the number of steps until time . The quantity,
| (4) |
keeps track if the oxygen coordinate of atom at time is outside the interval . O atoms which are close to the boundary at the time can lead to a large impact of short-term boundary crossing. To reduce this effect, the vector can employ a slightly smaller interval than used for .
The residence correlation function is 1 if all initially resident O atoms are in the interval and becomes 0 if none of these O atoms is left in the interval. This function enables to measure the residence lifetime of the O atoms in given slices of the simulation cell. The residence lifetime can be extracted by a biexponential fit using
| (5) |
is the residence lifetime due to long-range reorganization caused by diffusion and accounts for short-term crossing of the boundaries. The weights of both processes and add up to one. For verification we show in the Supplementary Material Figure S9 monoexponential fits excluding the initial drop of the correlation functions which yield similar residence lifetimes .
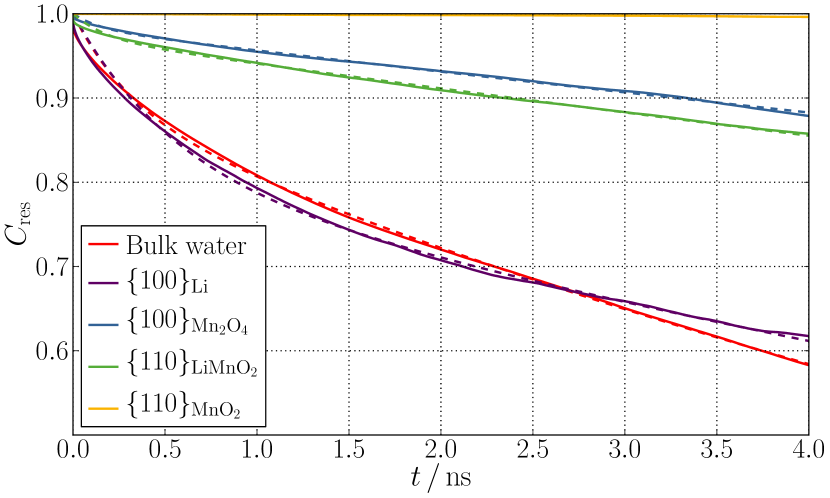
The residence correlation functions of the central bulk water region and the different interface regions show that the long-range diffusion is faster in the bulk than at the interfaces (Figure 9). The residence lifetime of the O atoms in the central region is about 9 ns. Since the interface has only a very thin strongly bound layer of H2O molecules, the residence lifetime of about 14 ns is still similar to bulk water, which is expected due to the weak interaction of this surface with the liquid. However, the and interfaces containing large amounts of OH- ions bind the hydroxide/strongly bound water layer leading to higher residence lifetimes of about 37 and 31 ns, respectively. For the interface only very few oxygen species in the strongly bound layer can escape from the interface during the 5 ns simulation. We note that the relative comparison of these numbers is more valuable than the absolute numbers because the underlying DFT method may generally tend to under- or overstructure water leading to faster or slower diffusion than obtained experimentally.[108, 109, 110]
IV.4 Proton transfer
An atomistic understanding of site-specific reaction mechanisms is crucial in the bottom-up development of advanced heterogeneous catalysts. The reactivity of solid surfaces can be highly dependent on the interface structure. The identification of active solid surface sites can therefore target the design of particle shapes and sizes yielding a higher activity. For instance, we have seen that the dissociation of water molecules is much more frequent at the , , and interfaces compared to the interface. Since the initial steps of the proposed OER mechanism at LixMn2O4 include the formation of two OH- ions on top of [MnMnO4]6+,[10] PT reactions at the interface are likely to play an important role.
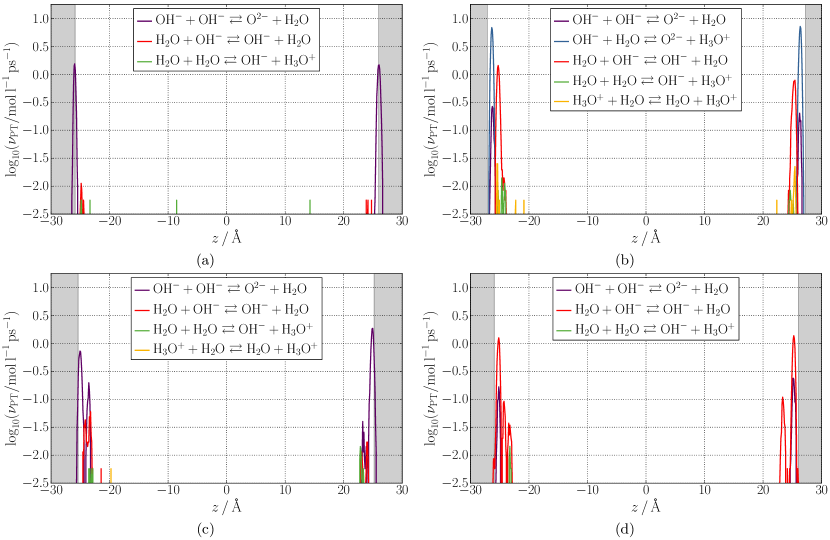
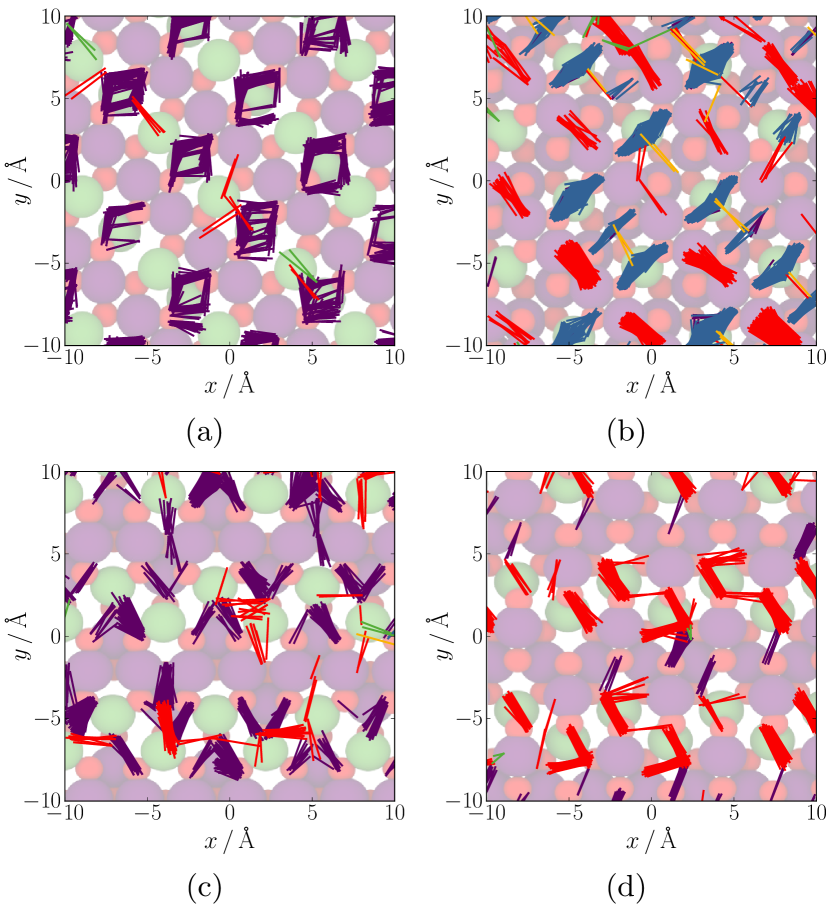
The PT reaction rates in Figures 10 (a) to (d) are obtained from changes in the H atom assignments to the closest O atom, i.e., it is the number of assignment changes per unit time. The projected networks of the PT reactions near the interfaces are shown in Figures 11 (a) to (d). In the ideal case, all PT processes from one local minimum configuration to another one are counted, while proton rattling events, in which H atoms quickly jump back and forth between O atoms without settling on one of them, are excluded. However, an unambiguous distinction of both types is not possible. We decided to use a sampling interval of 0.1 ps to reduce counting of proton rattling events because in this time interval a new local minimum can often be adopted. This approach yields a lower boundary of the absolute reaction rates since some PTs can be missed if forward and backward reactions happen rapidly. Also, nuclear quantum effects, which are not included in our simulations, are expected to increase the PT reaction rates.[111] In the Supplementary Material we calculate the PT reaction rates of shorter trajectories using a reduced sampling interval of 1 fs, while requiring that the assignment of the H atom to the closest O atom has to be maintained for 50 fs after a transition to be counted as PT reaction. This approach yields mostly similar reaction rates of the frequent processes, while rare processes are sampled worse due to the shorter total simulation time (Supplementary Material Figures S10 (a) to (d)). Since the same approximations have been applied in the analysis of all PT processes, errors are expected to cancel to some extent resulting in comparable relative reaction rates. The PT reactions are classified by the water species involved in the reaction. In case a certain ion or molecule is participating in multiple PTs during a single sampling interval, the overall process is decomposed into the respective elementary steps. Since the PT rates of forward and backward reactions are equal in equilibrium according to the principle of detailed balance, their average has been calculated.
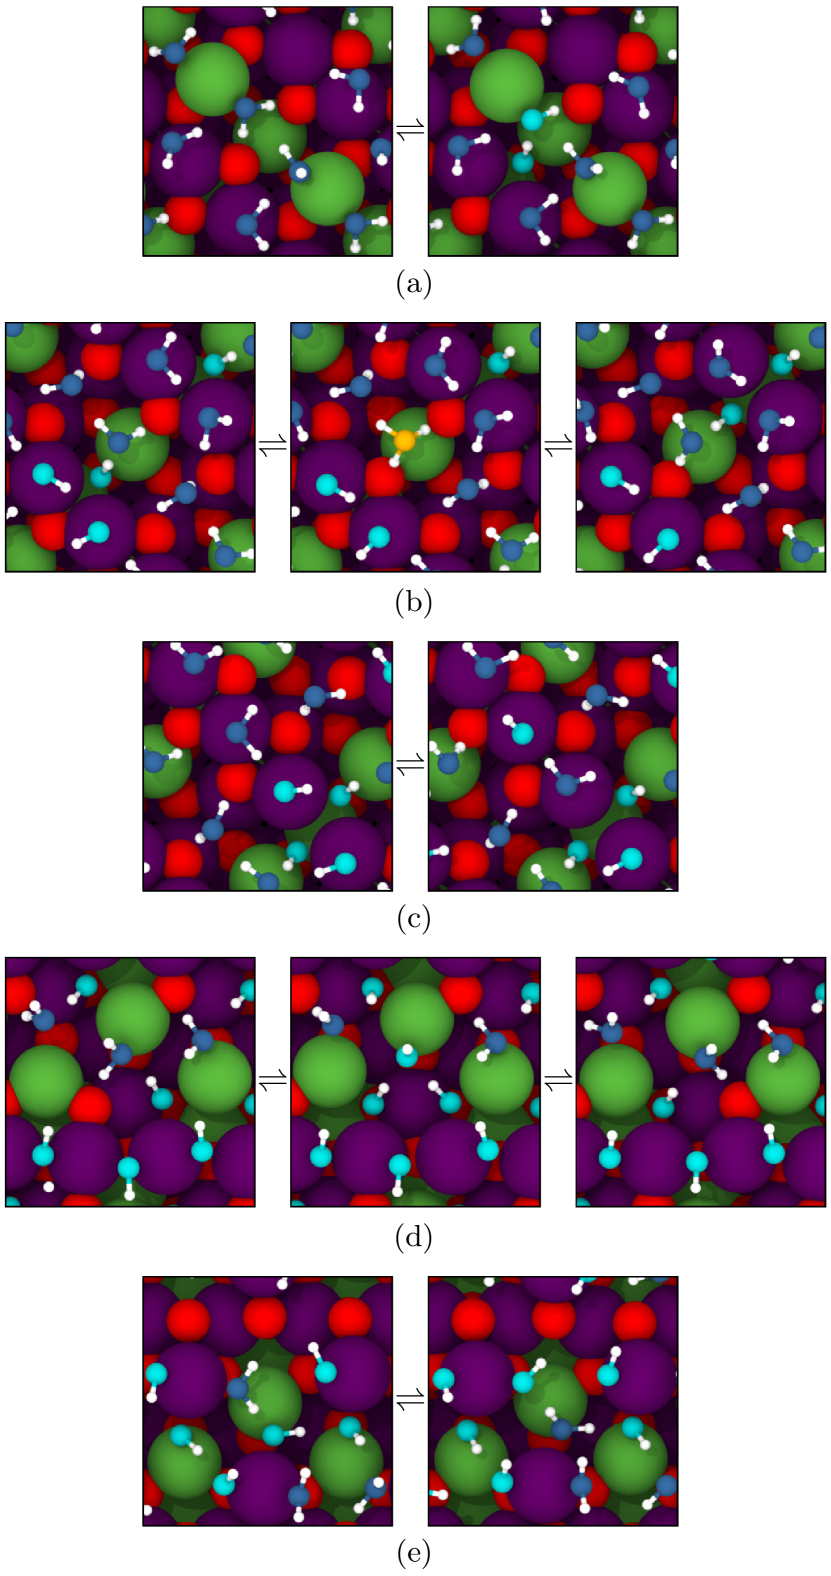
At the interface the dominant PT mechanism is the hydroxylation of the solid surface (Figure 10 (a)), which has been called “surface PT” in earlier work.[69, 70, 71] An O2- ion from the solid accepts one proton from an H2O molecule such that two OH- ions are formed (Figure 12 (a)). The backward reactions most often happen between the same atoms (Figure 11 (a)) since the OH- ions are not long-living at the interface. PTs between H2O molecules and OH- ions in the first liquid layer, i.e., “adlayer PT”,[69] happen rarely. Due to the effectively zero-dimensional proton transport by these PT reactions, the long-range transport is only given by diffusion and not by PT reactions following a Grotthus-like mechanism. In the liquid phase we can observe rare events of the autoionization of water, i.e., the formation of OH- and H3O+ ions from two H2O molecules (very small green peaks between in Figure 10 (a)). These PT processes in the bulk can also be observed in some of the other simulations which are not shown in Figure 10. The OH- and H3O+ ions always recombine very quickly. This behavior is expected as a pH value of 7 in bulk water would mean that only a concentration of H3O+ ions are present. Consequently, there would be around 0.1 H3O+ ions in one of the structures of a simulation trajectory including about H2O molecules each.
The PT paths are completely different at the interface. Here, the dominant mechanism is the transfer of one proton from a surface OH- ion to an H2O molecule (Figure 10 (b)). The H3O+ ion can be seen as transition state of the PT which rapidly transfers another proton to an O2- ion of the surface (Figure 12 (b)). Such solvent-assisted PTs have also been observed at ZnO-water surfaces in previous work.[70] Surface PTs (violet) can be observed at the same locations as the solvent-assisted PTs (blue) in Figure 11 (b). Hence, the hydroxylation is in dynamic equilibrium at the interface. The difference to the interface is that the equilibrium of surface PT reactions is shifted towards the occurrence of OH- ions at the interface. Another frequent PT shown in Figure 12 (c) happens in the perpendicular direction to the process in Figure 12 (b) making the proton transport two-dimensional (Figure 11 (b)). Different dimensionalities of PT networks at different solid surfaces have been observed for ZnO-water interfaces before.[70] In the PT shown in Figure 12 (c) the proton is transferred within the first liquid layer from an H2O molecule to an OH- ion, i.e., adlayer PT (red).[69] Further, the aforementioned intermediate H3O+ ions can alternatively transfer another proton to an adjacent H2O molecule in the first liquid layer in the same direction as the PT in Figure 12 (c) (yellow lines in Figure 11 (b)). In this way, long-range proton transport by PT reactions at the interface is possible. The intermediate H3O+ ions also explain the relatively high concentration of H3O+ in Figure 5 (b).
As for the interfaces, surface PTs are a large fraction of the PT reactions at the interface (Figure 10 (c)). The dominant PT reaction, where the proton of an H2O molecule is transferred to the O2- ion of the first solid layer, can be followed by a PT from an OH- ion of the first solid layer to the just created OH- ion (Figure 12 (d)). The OH- ion in the first liquid layer is therefore an intermediate species in this two-step transfer (violet zigzag lines in Figure 11 (c)). In contrast to the other interfaces, OH- ions in the first liquid layer can also transfer their proton to another OH- ion forming surface exposed O2- ions at the solid surface, i.e., H2O molecules are deprotonated twice (second closest violet peak to the interface in Figure 10 (c) and vertical violet lines in Figure 11 (c)). In addition, adlayer PTs can happen as well yielding in total a two-dimensional PT network.
At the interface PTs between H2O molecules and OH- ions are dominant (Figure 10 (d)). In contrast to the other interfaces, these reactions can also form H2O molecules in the first solid layer. Hence, the O2- ions of the solid can be protonated twice. The protonation of an OH- ion in the first solid layer by an H2O molecule from the first liquid layer is shown in Figure 12 (e). This reaction can be an indication of solid surface reconstruction and dissolution at longer time scales as the boundary between solid and liquid changes. Surface PTs have been observed at the interface as well. The PT pathways form again a two-dimensional zigzag pattern at the interface (Figure 11 (d)). The PT networks at the interfaces are thus very different to those at the interfaces (Figures 11 (a) to (d)).
In conclusion, PT processes are much more frequent at the interface compared to the bulk liquid. Many different processes can happen which can be very specific to the interface structure. Larger interface areas in principle increase the PT reaction rates, but some reactions, as observed, e.g., for solvent-assisted PTs and the formation of surface exposed O2- ions, only happen at particular sites. Only an increase of these surface sites would lead to a higher activity highlighting the importance of the site-specific atomistic understanding. The reaction mechanisms at the different interfaces determine how fast long-range transport of reactive species by PT reactions can be. The strongly bound water structure of the interface promotes alternating forward and backward reactions. The rate itself does not seem to be an sufficient indicator of the transport. An increased number of possible paths can increase the effective transport of the protons. The highest activity is found between the first solid and first liquid layer followed by processes taking place within the first liquid layer. Consequently, the structure of the first liquid layer is also of major importance for the reactivity.
As shown already in Figure 5 a very few OH- and H3O+ ions can escape from the interface. In two of the simulations this process was successful as shown in Figures 13 (a) and (b). The OH- ion in Figure 13 (c) and the H3O+ ion in Figure 13 (d) diffuse via the Grotthuss mechanism through the bulk. The H3O+ thereby escaped from the left interface and diffused for about 265 ps in the bulk until it recombined at the initial interface. The diffusion via the Grotthuss mechanism is very fast as all PT events in the bulk originate from a single H3O+ species present only for 5.3% of the simulation time. The PT rate from H2O to OH- divided by the OH- concentration in the case of the system, i.e., the difference between the red graph in Figure 13 (c) and the blue graph in Figure 13 (a), shows that the OH- ion in the bulk undergoes more than one PT per picosecond. In the liquid layer closest to the interface the rate is below one per picosecond. Liquid layers further away from the interface can also reach as high reaction rates per particle as in the bulk liquid. Thus, the high concentration of reactive species at the interface is the reason for the high PT reaction rates. The very specific reaction paths present at the interface cannot take place in the bulk.
V Conclusion
A high-dimensional neural network potential has been used to perform first principles-quality simulations of several LixMn2O4 spinel-water interfaces. These simulations reveal spontaneous water dissociation and the formation of a hydroxide layer at several solid surface cuts. The different water species can arrange in strongly bound water layers with significantly reduced mobility at the interface, whose structures are highly dependent on the underlying solid surface. The oxygen atoms of the different water species in the first liquid layer tend to mimic the bulk oxygen coordination of Li and Mn ions because these binding sites are preferred by the solid. A second strongly bound water layer is formed at interfaces with a large fraction of hydroxide ions. Its structure deviates from the face centered cubic lattice of bulk oxygen to optimize the interaction with the bulk liquid.
A high-dimensional neural network for spin prediction allows to determine the influence of the solid-liquid interface on the Mn oxidation state distribution. Weak interaction with water seems to be an indicator for only little formation of MnII ions at the interface. An increasing number of coordinating oxide ions of interfacial Mn ions stabilizes higher Mn oxidation states. The mobility of eg electrons is increased in the vicinity of the interface compared to the bulk. Consequently, higher battery performance can be achieved with smaller particles sizes while smaller particles are also more prone to degradation since soluble MnII ions are formed at the interface.
Proton transfer occurs between water molecules and oxide ions at the solid surface. The formed hydroxide ions originating from water molecules are stabilized in the vicinity of Mn ions. Active sites at the interface increase the amount of water dissociation significantly compared to the bulk liquid. Beyond the solid surface, the reactivity is also highly dependent on the structure of the water contact layer because a large part of the proton transfer reactions takes place within this layer. The mobility of the water species at the interface is reduced. However, the protons can be transported by PT reactions depending on the effective dimensionality of the surface-specific proton transfer network. The number of possible paths as well as the underlying mechanisms are highly dependent on the interface structure. Therefore, a larger interface area increases the reactivity only if this interface includes the respective active sites.
In summary, in the present work a first step has been taken towards an understanding of site-specific reactions at the atomic scale to obtain control tactics for higher performance and durability of battery materials as well as higher reactivity of catalysts.
Supplementary Material
See Supplementary Material for (I.A.) construction of the reference data set,[112, 105, 64, 65, 66] (I.B.) determination of the atom-centered symmetry function parameters,[81] (I.C.) RuNNer settings,[64, 65] (II.A.) Jahn-Teller distortions,[64] (II.B.) charge conservation,[113, 65] (II.C.) hydrogen bonds, (II.D.) structure of the interface, (II.E.) residence correlation function, and (II.F.) proton transfer reaction rates.
Acknowledgements.
This project was funded by the Deutsche Forschungsgemeinschaft (DFG, German Research Foundation) - 217133147/SFB 1073, project C03. We gratefully acknowledge computing time provided by the Paderborn Center for Parallel Computing (PC2) and by the DFG project INST186/1294-1 FUGG (Project No. 405832858). Discussions with Peter E. Blöchl are gratefully acknowledged.Data Availability
The data that support the findings of this study are available from the corresponding author upon reasonable request.
Conflicts of Interest
The authors declare no conflicts of interest.
References
References
- Chu and Majumdar [2012] S. Chu and A. Majumdar, “Opportunities and challenges for a sustainable energy future,” Nature 488, 294–303 (2012).
- Larcher and Tarascon [2015] D. Larcher and J.-M. Tarascon, “Towards greener and more sustainable batteries for electrical energy storage,” Nat. Chem. 7, 19–29 (2015).
- Bruce, Scrosati, and Tarascon [2008] P. G. Bruce, B. Scrosati, and J.-M. Tarascon, “Nanomaterials for rechargeable lithium batteries,” Angew. Chem. Int. Ed. 47, 2930–2946 (2008).
- Goodenough and Kim [2010] J. B. Goodenough and Y. Kim, “Challenges for rechargeable Li batteries,” Chem. Mater. 22, 587–603 (2010).
- Suntivich et al. [2011] J. Suntivich, K. J. May, H. A. Gasteiger, J. B. Goodenough, and Y. Shao-Horn, “A perovskite oxide optimized for oxygen evolution catalysis from molecular orbital principles,” Science 334, 1383–1385 (2011).
- Seh et al. [2017] Z. W. Seh, J. Kibsgaard, C. F. Dickens, I. Chorkendorff, J. K. Nørskov, and T. F. Jaramillo, “Combining theory and experiment in electrocatalysis: Insights into materials design,” Science 355, eaad4998 (2017).
- Suen et al. [2017] N.-T. Suen, S.-F. Hung, Q. Quan, N. Zhang, Y.-J. Xu, and H. M. Chen, “Electrocatalysis for the oxygen evolution reaction: recent development and future perspectives,” Chem. Soc. Rev. 46, 337–365 (2017).
- Thackeray et al. [1983] M. M. Thackeray, W. I. F. David, P. G. Bruce, and J. B. Goodenough, “Lithium insertion into manganese spinels,” Mat. Res. Bull. 18, 461–472 (1983).
- Thackeray [1997] M. M. Thackeray, “Manganese oxides for lithium batteries,” Prog. Solid State Chem. 25, 1–71 (1997).
- Cady et al. [2015] C. W. Cady, G. Gardner, Z. O. Maron, M. Retuerto, Y. B. Go, S. Segan, M. Greenblatt, and G. C. Dismukes, “Tuning the electrocatalytic water oxidation properties of AB2O4 spinel nanocrystals: A (Li, Mg, Zn) and B (Mn, Co) site variants of LiMn2O4,” ACS Catal. 5, 3403–3410 (2015).
- Köhler et al. [2017] L. Köhler, M. E. Abrishami, V. Roddatis, J. Geppert, and M. Risch, “Mechanistic parameters of electrocatalytic water oxidation on LiMn2O4 in comparison to natural photosynthesis,” ChemSusChem 10, 4479–4490 (2017).
- Kim et al. [2014] H. Kim, J. Hong, K.-Y. Park, H. Kim, S.-W. Kim, and K. Kang, “Aqueous rechargeable Li and Na ion batteries,” Chem. Rev. 114, 11788–11827 (2014).
- Alias and Mohamad [2015] N. Alias and A. A. Mohamad, “Advances of aqueous rechargeable lithium-ion battery: A review,” J. Power Sources 274, 237–251 (2015).
- Takahashi et al. [2003] Y. Takahashi, J. Akimoto, Y. Gotoh, K. Dokko, M. Nishizawa, and I. Uchida, “Structure and electron density analysis of lithium manganese oxides by single-crystal X-ray diffraction,” J. Phys. Soc. Jpn. 72, 1483–1490 (2003).
- Akimoto et al. [2004] J. Akimoto, Y. Takahashi, N. Kijima, and Y. Gotoh, “Single-crystal X-ray structure analysis of the low temperature form of LiMn2O4,” Solid State Ion. 172, 491–494 (2004).
- Piszora [2004] P. Piszora, “Temperature dependence of the order and distribution of Mn3+ and Mn4+ cations in orthorhombic LiMn2O4,” J. Alloy. Comp. 382, 112–118 (2004).
- Hunter [1981] J. C. Hunter, “Preparation of a new crystal form of manganese dioxide: -MnO2,” J. Solid State Chem. 39, 142–147 (1981).
- Stamenkovic et al. [2006] V. Stamenkovic, B. S. Mun, K. J. J. Mayrhofer, P. N. Ross, N. M. Markovic, J. Rossmeisl, J. Greeley, and J. K. Nørskov, “Changing the activity of electrocatalysts for oxygen reduction by tuning the surface electronic structure,” Angew. Chem. Int. Ed. 45, 2897–2901 (2006).
- Gauthier et al. [2015] M. Gauthier, T. J. Carney, A. Grimaud, L. Giordano, N. Pour, H.-H. Chang, D. P. Fenning, S. F. Lux, O. Paschos, C. Bauer, F. Maglia, S. Lupart, P. Lamp, and Y. Shao-Horn, “Electrode-electrolyte interface in Li-ion batteries: Current understanding and new insights,” J. Phys. Chem. Lett. 6, 4653–4672 (2015).
- Schönewald et al. [2020] F. Schönewald, M. Eckhoff, M. Baumung, M. Risch, P. E. Blöchl, J. Behler, and C. A. Volkert, “A criticial view on eg occupancy as a descriptor for oxygen evolution catalytic activity in LiMn2O4 nanoparticles,” (2020), arXiv:2007.04217 [cond-mat.mtrl-sci] .
- Hammer and Nørskov [2000] B. Hammer and J. K. Nørskov, “Theoretical surface science and catalysis—calculations and concepts,” in Impact of Surface Science on Catalysis, Advances in Catalysis, Vol. 45 (Academic Press, 2000) pp. 71–129.
- Jaramillo et al. [2007] T. F. Jaramillo, K. P. Jørgensen, J. Bonde, J. H. Nielsen, S. Horch, and I. Chorkendorff, “Identification of active edge sites for electrochemical H2 evolution from MoS2 nanocatalysts,” Science 317, 100–102 (2007).
- Nørskov et al. [2009] J. K. Nørskov, T. Bligaard, J. Rossmeisl, and C. H. Christensen, “Towards the computational design of solid catalysts,” Nat. Chem. 1, 37–46 (2009).
- Behrens et al. [2012] M. Behrens, F. Studt, I. Kasatkin, S. Kühl, M. Hävecker, F. Abild-Pedersen, S. Zander, F. Girgsdies, P. Kurr, B.-L. Kniep, M. Tovar, R. W. Fischer, J. K. Nørskov, and R. Schlögl, “The active site of methanol synthesis over Cu/ZnO/Al2O3 industrial catalysts,” Science 336, 893–897 (2012).
- Jiao et al. [2015] Y. Jiao, Y. Zheng, M. Jaroniec, and S. Z. Qiao, “Design of electrocatalysts for oxygen- and hydrogen-involving energy conversion reactions,” Chem. Soc. Rev. 44, 2060–2086 (2015).
- Benedek et al. [2012] R. Benedek, M. M. Thackeray, J. Low, and T. Bučko, “Simulation of aqueous dissolution of lithium manganate spinel from first principles,” J. Phys. Chem. C 116, 4050–4059 (2012).
- Bhandari and Bhattacharya [2017] A. Bhandari and J. Bhattacharya, “Review—manganese dissolution from spinel cathode: Few unanswered questions,” J. Electrochem. Soc. 164, A106–A127 (2017).
- Leung [2017] K. Leung, “First-principles modeling of Mn(II) migration above and dissolution from LixMn2O4 (001) surfaces,” Chem. Mater. 29, 2550–2562 (2017).
- Hirayama et al. [2010] M. Hirayama, H. Ido, K. Kim, W. Cho, K. Tamura, J. Mizuki, and R. Kanno, “Dynamic structural changes at limn2o4/electrolyte interface during lithium battery reaction,” J. Am. Chem. Soc. 132, 15268–15276 (2010).
- Leung [2013] K. Leung, “Electronic structure modeling of electrochemical reactions at electrode/electrolyte interfaces in lithium ion batteries,” J. Phys. Chem. C 117, 1539–1547 (2013).
- Benedek [2017] R. Benedek, “Role of disproportionation in the dissolution of Mn from lithium manganate spinel,” J. Phys. Chem. C 121, 22049–22053 (2017).
- Schaub et al. [2001] R. Schaub, P. Thostrup, N. Lopez, E. Lægsgaard, I. Stensgaard, J. K. Nørskov, and F. Besenbacher, “Oxygen vacancies as active sites for water dissociation on rutile TiO2(110),” Phys. Rev. Lett. 87, 266104 (2001).
- Rossmeisl et al. [2007] J. Rossmeisl, Z.-W. Qu, H. Zhu, G.-J. Kroes, and J. K. Nørskov, “Electrolysis of water on oxide surfaces,” J. Electroanal. Chem. 607, 83–89 (2007).
- Bajdich et al. [2013] M. Bajdich, M. García-Mota, A. Vojvodic, J. K. Nørskov, and A. T. Bell, “Theoretical investigation of the activity of cobalt oxides for the electrochemical oxidation of water,” J. Am. Chem. Soc. 135, 13521–13530 (2013).
- Tocci and Michaelides [2014] G. Tocci and A. Michaelides, “Solvent-induced proton hopping at a water-oxide interface,” J. Phys. Chem. Lett. 5, 474–480 (2014).
- Friebel et al. [2015] D. Friebel, M. W. Louie, M. Bajdich, K. E. Sanwald, Y. Cai, A. M. Wise, M.-J. Cheng, D. Sokaras, T.-C. Weng, R. Alonso-Mori, R. C. Davis, J. R. Bargar, J. K. Nørskov, A. Nilsson, and A. T. Bell, “Identification of highly active Fe sites in (Ni,Fe)OOH for electrocatalytic water splitting,” J. Am. Chem. Soc. 137, 1305–1313 (2015).
- Karim, Fosse, and Persson [2013] A. Karim, S. Fosse, and K. A. Persson, “Surface structure and equilibrium particle shape of the LiMn2O4 spinel from first-principles calculations,” Phys. Rev. B 87, 075322 (2013).
- Kumar, Leung, and Siegel [2014] N. Kumar, K. Leung, and D. J. Siegel, “Crystal surface and state of charge dependencies of electrolyte decomposition on LiMn2O4 cathode,” J. Electrochem. Soc. 161, E3059–E3065 (2014).
- Lee, Park, and Luz [2016] Y. K. Lee, J. Park, and W. Luz, “Electronic and bonding properties of LiMn2O4 spinel with different surface orientations and doping elements and their effects on manganese dissolution,” J. Electrochem. Soc. 163, A1359–A1368 (2016).
- Warburton et al. [2016] R. E. Warburton, H. Iddir, L. A. Curtiss, and J. Greeley, “Thermodynamic stability of low- and high-index spinel LiMn2O4 surface terminations,” ACS Appl. Mater. Interfaces 8, 11108–11121 (2016).
- Eckhoff, Blöchl, and Behler [2020] M. Eckhoff, P. E. Blöchl, and J. Behler, “Hybrid density functional theory benchmark study on lithium manganese oxides,” Phys. Rev. B 101, 205113 (2020).
- Leung [2012] K. Leung, “First-principles modeling of the initial stages of organic solvent decomposition on LixMn2O4(100) surfaces,” J. Phys. Chem. C 116, 9852–9861 (2012).
- Choi et al. [2018] D. Choi, J. Kang, J. Park, and B. Han, “First-principles study on thermodynamic stability of the hybrid interfacial structure of LiMn2O4 cathode and carbonate electrolyte in Li-ion batteries,” Phys. Chem. Chem. Phys. 20, 11592–11597 (2018).
- Intan, Klyukin, and Alexandrov [2019] N. N. Intan, K. Klyukin, and V. Alexandrov, “Ab initio modeling of transition metal dissolution from the LiNi0.5Mn1.5O4 cathode,” ACS Appl. Mater. Interfaces 11, 20110–20116 (2019).
- Okuno et al. [2019] Y. Okuno, K. Ushirogata, K. Sodeyama, G. Shukri, and Y. Tateyama, “Structures, electronic states, and reactions at interfaces between LiNi0.5Mn1.5O4 cathode and ethylene carbonate electrolyte: A first-principles study,” J. Phys. Chem. C 123, 2267–2277 (2019).
- Zhou et al. [2020] G. Zhou, X. Sun, Q.-H. Li, X. Wang, J.-N. Zhang, W. Yang, X. Yu, R. Xiao, and H. Li, “Mn ion dissolution mechanism for lithium-ion battery with LiMn2O4 cathode: In situ ultraviolet-visible spectroscopy and ab initio molecular dynamics simulations,” J. Phys. Chem. Lett. 11, 3051–3057 (2020).
- Behler [2016] J. Behler, “Perspective: Machine learning potentials for atomistic simulations,” J. Chem. Phys. 145, 170901 (2016).
- Bartók et al. [2017] A. P. Bartók, S. De, C. Poelking, N. Bernstein, J. R. Kermode, G. Csányi, and M. Ceriotti, “Machine learning unifies the modeling of materials and molecules,” Sci. Adv. 3, e1701816 (2017).
- Noé et al. [2020] F. Noé, A. Tkatchenko, K.-R. Müller, and C. Clementi, “Machine learning for molecular simulation,” Annu. Rev. Phys. Chem. 71, 361–390 (2020).
- Behler and Csányi [2021] J. Behler and G. Csányi, “Machine learning potentials for extended systems - a perspective,” Eur. Phys. J. B 94, 142 (2021).
- Morawietz et al. [2016] T. Morawietz, A. Singraber, C. Dellago, and J. Behler, “How van der Waals interactions determine the unique properties of water,” Proc. Natl. Acad. Sci. 113, 8368–8373 (2016).
- Cheng, Behler, and Ceriotti [2016] B. Cheng, J. Behler, and M. Ceriotti, “Nuclear quantum effects in water at the triple point: Using theory as a link between experiments,” J. Phys. Chem. Lett. 7, 2210–2215 (2016).
- Zhang et al. [2018] L. Zhang, J. Han, H. Wang, R. Car, and W. E, “Deep potential molecular dynamics: A scalable model with the accuracy of quantum mechanics,” Phys. Rev. Lett. 120, 143001 (2018).
- Cheng et al. [2019] B. Cheng, E. A. Engel, J. Behler, C. Dellago, and M. Ceriotti, “Ab initio thermodynamics of liquid and solid water,” Proc. Natl. Acad. Sci. 116, 1110–1115 (2019).
- Wen et al. [2019] T. Wen, C.-Z. Wang, M. J. Kramer, Y. Sun, B. Ye, H. Wang, X. Liu, C. Zhang, F. Zhang, K.-M. Ho, and N. Wang, “Development of a deep machine learning interatomic potential for metalloid-containing Pd-Si compounds,” Phys. Rev. B 100, 174101 (2019).
- Artrith [2019] N. Artrith, “Machine learning for the modeling of interfaces in energy storage and conversion materials,” J. Phys. Energy 1, 032002 (2019).
- Pun et al. [2020] G. P. P. Pun, V. Yamakov, J. Hickman, E. H. Glaessgen, and Y. Mishin, “Development of a general-purpose machine-learning interatomic potential for aluminum by the physically informed neural network method,” Phys. Rev. Mater. 4, 113807 (2020).
- Schran et al. [2021] C. Schran, F. L. Thiemann, P. Rowe, E. A. Müller, O. Marsalek, and A. Michaelides, “Machine learning potentials for complex aqueous systems made simple,” (2021), arXiv:2106.00048 [physics.chem-ph] .
- Behler and Parrinello [2007] J. Behler and M. Parrinello, “Generalized neural-network representation of high-dimensional potential-energy surfaces,” Phys. Rev. Lett. 98, 146401 (2007).
- Behler [2014] J. Behler, “Representing potential energy surfaces by high-dimensional neural network potentials,” J. Phys.: Condens. Matter 26, 183001 (2014).
- Behler [2015] J. Behler, “Constructing high-dimensional neural network potentials: A tutorial review,” Int. J. Quantum Chem. 115, 1032–1050 (2015).
- Behler [2017] J. Behler, “First principles neural network potentials for reactive simulations of large molecular and condensed systems,” Angew. Chem. Int. Ed. 56, 12828–12840 (2017).
- Behler [2021] J. Behler, “Four generations of high-dimensional neural network potentials,” Chem. Rev. 121, 10037–10072 (2021).
- Eckhoff et al. [2020a] M. Eckhoff, F. Schönewald, M. Risch, C. A. Volkert, P. E. Blöchl, and J. Behler, “Closing the gap between theory and experiment for lithium manganese oxide spinels using a high-dimensional neural network potential,” Phys. Rev. B 102, 174102 (2020a).
- Eckhoff et al. [2020b] M. Eckhoff, K. N. Lausch, P. E. Blöchl, and J. Behler, “Predicting oxidation and spin states by high-dimensional neural networks: Applications to lithium manganese oxide spinels,” J. Chem. Phys. 153, 164107 (2020b).
- Eckhoff and Behler [2021] M. Eckhoff and J. Behler, “High-dimensional neural network potentials for magnetic systems using spin-dependent atom-centered symmetry functions,” (2021), arXiv:2104.14439 [physics.comp-ph] .
- Natarajan and Behler [2016] S. K. Natarajan and J. Behler, “Neural network molecular dynamics simulations of solid-liquid interfaces: water at low-index copper surfaces,” Phys. Chem. Chem. Phys. 18, 28704–28725 (2016).
- Natarajan and Behler [2017] S. K. Natarajan and J. Behler, “Self-diffusion of surface defects at copper–water interfaces,” J. Phys. Chem. C 121, 4368–4383 (2017).
- Quaranta, Hellström, and Behler [2017] V. Quaranta, M. Hellström, and J. Behler, “Proton transfer mechanisms at the water-ZnO interface: The role of presolvation,” J. Phys. Chem. Lett. 8, 1476–1483 (2017).
- Hellström, Quaranta, and Behler [2019] M. Hellström, V. Quaranta, and J. Behler, “One-dimensional vs. two-dimensional proton transport processes at solid–liquid zinc-oxide–water interfaces,” Chem. Sci. 10, 1232–1243 (2019).
- Quaranta, Behler, and Hellström [2019] V. Quaranta, J. Behler, and M. Hellström, “Structure and dynamics of the liquid–water/zinc-oxide interface from machine learning potential simulations,” J. Phys. Chem. C 123, 1293–1304 (2019).
- Artrith, Morawietz, and Behler [2011] N. Artrith, T. Morawietz, and J. Behler, “High-dimensional neural-network potentials for multicomponent systems: Applications to zinc oxide,” Phys. Rev. B 83, 153101 (2011).
- Ghasemi et al. [2015] S. A. Ghasemi, A. Hofstetter, S. Saha, and S. Goedecker, “Interatomic potentials for ionic systems with density functional accuracy based on charge densities obtained by a neural network,” Phys. Rev. B 92, 045131 (2015).
- Unke and Meuwly [2019] O. T. Unke and M. Meuwly, “PhysNet: A neural network for predicting energies, forces, dipole moments, and partial charges,” J. Chem. Theory Comput. 15, 3678–3693 (2019).
- Xie, Persson, and Small [2020] X. Xie, K. A. Persson, and D. W. Small, “Incorporating electronic information into machine learning potential energy surfaces via approaching the ground-state electronic energy as a function of atom-based electronic populations,” J. Chem. Theory Comput. 16, 4256–4270 (2020).
- Ko et al. [2021] T. W. Ko, J. A. Finkler, S. Goedecker, and J. Behler, “A fourth-generation high-dimensional neural network potential with accurate electrostatics including non-local charge transfer,” Nat. Commun. 12, 398 (2021).
- Houlding, Liem, and Popelier [2007] S. Houlding, S. Y. Liem, and P. L. A. Popelier, “A polarizable high-rank quantum topological electrostatic potential developed using neural networks: Molecular dynamics simulations on the hydrogen fluoride dimer,” Int. J. Quantum Chem. 107, 2817–2827 (2007).
- Bereau, Andrienko, and von Lilienfeld [2015] T. Bereau, D. Andrienko, and O. A. von Lilienfeld, “Transferable atomic multipole machine learning models for small organic molecules,” J. Chem. Theory Comput. 11, 3225–3233 (2015).
- Montavon et al. [2013] G. Montavon, M. Rupp, V. Gobre, A. Vazquez-Mayagoitia, K. Hansen, A. Tkatchenko, K.-R. Mueller, and O. A. von Lilienfeld, “Machine learning of molecular electronic properties in chemical compound space,” New J. Phys. 15, 095003 (2013).
- Schütt et al. [2019] K. Schütt, M. Gastegger, A. Tkatchenko, K.-R. Müller, and R. Maurer, “Unifying machine learning and quantum chemistry with a deep neural network for molecular wavefunctions,” Nature Comm. 10, 5024 (2019).
- Behler [2011] J. Behler, “Atom-centered symmetry functions for constructing high-dimensional neural network potentials,” J. Chem. Phys. 134, 074106 (2011).
- Sotoudeh et al. [2017] M. Sotoudeh, S. Rajpurohit, P. Blöchl, D. Mierwaldt, J. Norpoth, V. Roddatis, S. Mildner, B. Kressdorf, B. Ifland, and C. Jooss, “Electronic structure of Pr1-xCaxMnO3,” Phys. Rev. B 95, 235150 (2017).
- Grimme et al. [2010] S. Grimme, J. Antony, S. Ehrlich, and H. Krieg, “A consistent and accurate ab initio parametrization of density functional dispersion correction (DFT-D) for the 94 elements H-Pu,” J. Chem. Phys. 132, 154104 (2010).
- Grimme, Ehrlich, and Goerigk [2011] S. Grimme, S. Ehrlich, and L. Goerigk, “Effect of the damping function in dispersion corrected density functional theory,” J. Comput. Chem. 32, 1456–1465 (2011).
- Blöchl [1994] P. E. Blöchl, “Projector augmented-wave method,” Phys. Rev. B 50, 17953–17979 (1994).
- Blöchl [2016] P. E. Blöchl, “CP-PAW,” https://www2.pt.tu-clausthal.de/paw/ (September 28, 2016).
- Behler [2020] J. Behler, “RuNNer,” http://gitlab.com/TheochemGoettingen/RuNNer (October 19, 2020).
- Stukowski [2010] A. Stukowski, “Visualization and analysis of atomistic simulation data with OVITO – the open visualization tool,” Model. Simul. Mater. Sci. Eng. 18, 015012 (2010).
- Plimpton [1995] S. Plimpton, “Fast parallel algorithms for short-range molecular dynamics,” J. Comput. Phys. 117, 1–19 (1995).
- LAM [2019] “LAMMPS – Large-scale atomic/molecular massively parallel simulator,” http://lammps.sandia.gov (August 7, 2019).
- Singraber, Behler, and Dellago [2019] A. Singraber, J. Behler, and C. Dellago, “Library-based LAMMPS implementation of high-dimensional neural network potentials,” J. Chem. Theory Comput. 15, 1827–1840 (2019).
- Singraber [2019] A. Singraber, “n2p2 – A neural network potential package,” https://github.com/CompPhysVienna/n2p2 (December 9, 2019).
- Nosé [1984] S. Nosé, “A molecular dynamics method for simulations in the canonical ensemble,” Mol. Phys. 52, 255–268 (1984).
- Hoover [1985] W. G. Hoover, “Canonical dynamics: Equilibrium phase-space distributions,” Phys. Rev. A 31, 1695–1697 (1985).
- Davies [1969] G. Davies, “Some aspects of the chemistry of manganese(III) in aqueous solution,” Coord. Chem. Rev. 4, 199–224 (1969).
- Dove, Han, and De Yoreo [2005] P. M. Dove, N. Han, and J. J. De Yoreo, “Mechanisms of classical crystal growth theory explain quartz and silicate dissolution behavior,” Proc. Natl. Acad. Sci. 102, 15357–15362 (2005).
- Benedek and Thackeray [2011] R. Benedek and M. M. Thackeray, “Simulation of the surface structure of lithium manganese oxide spinel,” Phys. Rev. B 83, 195439 (2011).
- Kim, Aykol, and Wolverton [2015] S. Kim, M. Aykol, and C. Wolverton, “Surface phase diagram and stability of (001) and (111) LiMn2O4 spinel oxides,” Phys. Rev. B 92, 115411 (2015).
- Tang et al. [2014] D. Tang, Y. Sun, Z. Yang, L. Ben, L. Gu, and X. Huang, “Surface structure evolution of LiMn2O4 cathode material upon charge/discharge,” Chem. Mater. 26, 3535–3543 (2014).
- Amos et al. [2016] C. D. Amos, M. A. Roldan, M. Varela, J. B. Goodenough, and P. J. Ferreira, “Revealing the reconstructed surface of Li[Mn2]O4,” Nano Lett. 16, 2899–2906 (2016).
- Gao et al. [2019] X. Gao, Y. H. Ikuhara, C. A. J. Fisher, R. Huang, A. Kuwabara, H. Moriwake, K. Kohamac, and Y. Ikuhara, “Oxygen loss and surface degradation during electrochemical cycling of lithium-ion battery cathode material LiMn2O4,” J. Mater. Chem. A 7, 8845–8854 (2019).
- Wagner and Pruß [2002] W. Wagner and A. Pruß, “The IAPWS formulation 1995 for the thermodynamic properties of ordinary water substance for general and scientific use,” J. Phys. Chem. Ref. Data 31, 387–535 (2002).
- Zhang and Yang [1998] Y. Zhang and W. Yang, “Comment on “generalized gradient approximation made simple”,” Phys. Rev. Lett. 80, 890 (1998).
- Adamo and Barone [1999] C. Adamo and V. Barone, “Toward reliable density functional methods without adjustable parameters: The PBE0 model,” J. Chem. Phys. 110, 6158–6170 (1999).
- Eckhoff and Behler [2019] M. Eckhoff and J. Behler, “From molecular fragments to the bulk: Development of a neural network potential for MOF-5,” J. Chem. Theory Comput. 15, 3793–3809 (2019).
- Liriano et al. [2017] M. L. Liriano, C. Gattinoni, E. A. Lewis, C. J. Murphy, E. C. H. Sykes, and A. Michaelides, “Water-ice analogues of polycyclic aromatic hydrocarbons: Water nanoclusters on Cu(111),” J. Am. Chem. Soc. 139, 6403–6410 (2017).
- Gerrard et al. [2019] N. Gerrard, C. Gattinoni, F. McBride, A. Michaelides, and A. Hodgson, “Strain relief during ice growth on a hexagonal template,” J. Am. Chem. Soc. 141, 8599–8607 (2019).
- Lin et al. [2012] I.-C. Lin, A. P. Seitsonen, I. Tavernelli, and U. Rothlisberger, “Structure and dynamics of liquid water from ab initio molecular dynamics—comparison of BLYP, PBE, and revPBE density functionals with and without van der Waals corrections,” J. Chem. Theory Comput. 8, 3902–3910 (2012).
- Gillan, Alfè, and Michaelides [2016] M. J. Gillan, D. Alfè, and A. Michaelides, “Perspective: How good is DFT for water?” J. Chem. Phys. 144, 13090 (2016).
- Chen et al. [2017] M. Chen, H.-Y. Ko, R. C. Remsing, M. F. C. Andrade, B. Santra, Z. Sun, A. Selloni, R. Car, M. L. Klein, J. P. Perdew, and X. Wu, “Ab initio theory and modeling of water,” Proc. Natl. Acad. Sci. 114, 10846–10851 (2017).
- Litman et al. [2018] Y. Litman, D. Donadio, M. Ceriotti, and M. Rossi, “Decisive role of nuclear quantum effects on surface mediated water dissociation at finite temperature,” J. Chem. Phys 148, 102320 (2018).
- Artrith and Behler [2012] N. Artrith and J. Behler, “High-dimensional neural network potentials for metal surfaces: A prototype study for copper,” Phys. Rev. B 85, 045439 (2012).
- Zurbenko [1986] I. G. Zurbenko, The Spectral Analysis of Time Series (Elsevier North-Holland, Amsterdam, 1986).